Article

ROUTINE: The Development of a Physical Activity Promoting Journey Planner Web App

1
Factum—Apptec Ventures LLC, Slamastraße 43, Vienna 1230, Austria
2
Institute of Sport Science, University of Graz, 8010 Graz, Austria
*
Author to whom correspondence should be addressed.
Soc. Sci. 2019, 8(3), 82; https://doi.org/10.3390/socsci8030082
Submission received: 1 December 2018 / Revised: 21 February 2019 / Accepted: 28 February 2019 / Published: 5 March 2019
(This article belongs to the Special Issue Public Transport and Social Psychology)

Abstract

:
Behavior change apps are widespread, but the scientific base of the app-concept is rarely disclosed. The aim of this article is to present the methodological approach used for the development of a so-called “fitness feedback demonstrator” within an already existing journey planner web app to motivate people to increase their physical activity behavior while using public transport. Firstly, we introduce the behavior change theories applied for the design of the feedback, followed by the analysis of focus-group discussions about the desired content of the fitness feedback. Secondly, we describe how we conducted a field test to measure the number of steps taken when using public transport. Finally, we used the feedback from potential users in terms of design/attractiveness and comprehensibility of the added fitness information. The “fitness feedback demonstrator” is a good practical example of how to make use of the different research expertise to develop a theory-based tool to encourage persons to integrate physical activity into their daily routines.

1. Introduction

There is convincing scientific evidence that regular physical activity has diverse health benefits. Among other benefits, physical activity contributes to the prevention of several cancers, excessive weight gain, and cardiovascular disease, and improves brain health (Physical Activity Guidelines Advisory Committee 2018). Based on the World Health Organization (2010), there are two important messages for anyone looking to improve their health through physical activity. For those who are physically inactive, it is recommended that “some physical activity is better than none”. For people who are already physically active, the recommendation is “to achieve at least 150 min of moderate-intensity physical activity per week”. The last recommendation is sometimes translated into 10,000 steps per day on most days of the week (World Health Organization 2008). According to the Austrian Health Interview Survey conducted by Statistik Austria (2014), only half of the Austrian adult population achieves the 150 min of moderate-intensity physical activity.
Physical activity occurs throughout the day, for a variety of purposes, and in many types of settings. Typically, four contexts are considered to be important for regular physical activity: (a) occupational physical activity is performed while working; (b) transportation physical activity is performed in order to get from one place to another; (c) household physical activity is done in or around the home; and (d) leisure-time physical activity is performed when not working, traveling to a different location, or doing household chores (Physical Activity Guidelines Advisory Committee 2018). Walking has been highlighted to be the easiest and most acceptable form of physical activity that can be incorporated into everyday life (Department of Health 2011). Public Health England (2017) acknowledges brisk walking as an evidence-based choice for promoting physical activity. Walking is already prevalent and has no skill, facility or equipment requirement. Furthermore, walking is more accessible and acceptable than other forms of physical activity for most people. In addition, walking for transport can be included in daily life without much additional time expenditure.
In a recent systematic review (Oja et al. 2018), it was demonstrated that walking has benefits for seven cardiovascular disease (CVD) risk factors: Body mass, body mass index, body fat, systolic and diastolic blood pressure, fasting glucose, and VO2max. These findings demonstrate the health potential of everyday walking for large segments of the population. The conclusion of the authors was that “walking still remains firmly a ‘best buy’ for public health”.
In addition to studies of the health effects of everyday walking, how much physical activity or steps people accumulate during active transport has also been investigated. For example, Chaix et al. (2014) found that not only walking and cycling trips, but also public transportation trips, were associated with an increase in steps, and could be considered as moderate- to vigorous-intensity physical activity compared to the use of a personal motorized vehicle. They also found that one-third of all the steps recorded over a period of seven days were accomplished during active transport. Although it has been shown that everyday walking can be performed during active transport, the modal split of walking is still low in many cities (around 25% in Vienna) (Bundesministerium für Verkehr Innovation und Technologie 2016).
The main aim of the research project with the name ROUTINE (synonymous with pattern or habit) was to combine multi-disciplinary competencies to promote and maintain the use of public transport in order to facilitate habitual active mobility. The aim of this article is to present the methodological approach used for the development of the so-called “fitness feedback demonstrator” within an already existing journey planner web app to motivate people to increase their physical activity while using public transport. We focus on the identification of types of users as well as on how to quantify the amount of physical activity while using public transport. Therefore, we divided the method and the result sections into those two contents.

2. Overview of the Applied Behavior Change Theories

In general, psychological behavior change theories provide a structured approach to promote a particular behavior. Based on a review of previous research about the positive relations between the usage of concepts of behavior change theories and physical activity behavioral outcomes (Abraham and Sheeran 2005; Jones et al. 2014; Nigg et al. 2011; Sweet et al. 2012; Patrick et al. 2014) we selected the following theories as a basis to conduct and analyze focus group interviews and to design the feedback for the web app customers.

2.1. Transtheoretical Model

A common model to describe behavior change is the transtheoretical model (TTM; Prochaska and DiClemente 1983). The TTM’s basic premise is that behavior change is a process (National Cancer Institute 2005). Individuals move through five stages of change, and the process of change is not linear. Persons can enter the change process at any stage and relapse back to another stage. In the pre-contemplation stage, an individual does not intend to take action in the foreseeable future. The stage of contemplation means that the individual is intending to start to change their behavior. The stage of preparation describes the process in which the individual gets ready to take action for change. In the stage of action, the behavior change is realized, and the desired behavior is performed. In the maintenance stage, the individual sustains the changed behavior for a period of time. For each stage of change, different intervention strategies are necessary. Thus, we consider this model as a useful tool for initiating and supporting behavior change, providing different inputs for people in different stages of change.

2.2. Health Belief Model

We applied an adapted health belief model (HBM) (Rosenstock et al. 1988; National Cancer Institute 2005) for the theoretical-based interventions to promote physical activity while using public transport. The HBM is a so-called “explanatory theory”, which addresses the individual contributions to a problem. The adapted version of the HBM takes demographic factors into account, which we consider as useful when planning interventions that target public transport users of all ages and different physical fitness levels. The model focuses on (1) the individual‘s perception of a certain health-threatening behavior; (2) the perceived benefits of behavior change; (3) the individual‘s susceptibility for behavior change; (4) perceived barriers/costs of behavior change; (5) cues to action; and (6) self-efficacy.
The concept of self-efficacy is a crucial concept in health-promoting behavior, and is also central to other behavior change theories (e.g., TTM, social cognitive theory). It describes an individual’s confidence in successfully performing a behavior (Bandura 1977). If individuals believe they will succeed in performing a certain behavior, they are more likely to realize it and to sustain it, even in the presence of barriers. Factors which influence self-efficacy are (Downs et al. 2014):
  • Mastery performance
  • Vicarious experiences
  • Verbal persuasion
  • The individual’s physical and emotional state
We considered self-efficacy as a crucial aspect for our intervention, which was discussed with the participants of the focus-group interviews.

2.3. Self-Determination Theory

Self-determination theory (SDT) focuses, on the one hand, on the degree to which an individual’s behavior is self-motivated and self-determined (Ryan and Deci 2000a). On the other hand, there are three fundamental psychological needs—the needs for competence, relatedness, and autonomy—which describe the conditions for either a supportive or an antagonistic social environment through which motivation and self-regulation can be changed.
  • Competence refers to the need to feel capable of achieving the desired outcome.
  • Readiness refers to the need to feel connected to and be understood by important others.
  • Autonomy is the need to feel volitional, as the originator of one’s actions (Patrick et al. 2014).
Motivation in SDT is distinguished as extrinsic and intrinsic motivation. Extrinsic motivation means that a person performs an activity mainly because doing so will yield some kind of reward or benefit, while intrinsic motivation means that an individual performs a certain activity purely because of enjoyment or fun (Deci and Ryan 2002). Motivation is considered as a critical factor in supporting physical activity. Accordingly, research on motivation for increasing the amount of physical activity from the perspective of self-determination theory (SDT) has grown considerably in recent years (e.g., Patrick et al. 2014). Education research has shown that intrinsic motivation produces deeper engagement in learning activities, better conceptual learning, and higher persistence at learning activities (Deci and Ryan 2002).

3. Methods

In the study, we collaborated as a multi-disciplinary research team with expertise in sociology, psychology, and sports science, and thus we applied a multi-method research approach. The focus-group interview method was applied as a resource-efficient way to collect data about the individuals’ needs, motivations, and barriers for performing physical activity, such as walking to and from public transport. We also applied methods from sports science. A field test was conducted to develop a formula in order to quantify the number of steps and the duration of walking within public transport stations.

3.1. Focus-Group Interviews

Focus-group interviews are a common qualitative approach to gain an in-depth understanding of social issues. The method aims to obtain data from a group and was selected based on specific criteria rather than from a statistically-representative sample of a broader population (Nyumba et al. 2017).
We used focus-group interviews to explore the needs, motivations, and barriers for performing walking or cycling before, during, and after public transport use, to better understand the willingness to use a journey planner with an additional feature, i.e., a fitness feedback demonstrator. Each of the three focus-group interviews was conducted with the help of an interview guide. The structure of the interview guide followed three main topics: (1) Attitudes toward physical activity (physical activity habits, willingness for physical activity on daily trips); (2) attitudes toward journey planners (use habits, willingness to use integrated fitness feedback); and (3) motivational aspects (things which motivate or hinder individuals to be physically active).
The three focus-group interviews were conducted in March 2016. Sixteen persons (9 female, 7 male) participated in the focus-group interviews. The age of the participants ranged from 17–59 years (M = 41.9, SD = 15.5). The research team aimed for a heterogenous sample of participants according to age, perceived level of fitness, level of experience with route planners and public transport use. Various channels for recruiting participants were used to reach this heterogeneous sample (e.g., online job platforms, the websites of Austrian regional public transport providers, Facebook postings, and announcements in shops). All participants gave their written consent that the focus group interview can be recorded and that the research team is allowed to analyze the data for scientific purposes. The research team declared that the data will never be given to an external party or used for commercial purposes. We also guaranteed that all data and results will be stored in a safe and secure way. Each focus-group interview lasted about 2 h. All participants lived in Vienna, which was the target area for our study.
The focus-group interviews were analyzed following the qualitative content analysis approach of Mayring (2000). Based on this theoretical background (see Section 2), we defined a category system which was used for the analysis of the qualitative data. In the first step, the statements of the participants were shortened and the language was standardized. This procedure resulted in a list of topics. These topics were classified according to the category system and, in addition, the approach of “inductive category development” was applied for data which did not fit the existing categories. In the final step, the classified data were summarized.

3.2. Number of Steps and Duration—“Field Test”

We conducted a field test to provide an estimation of the possible number of steps and the duration of physical activity for all available routes in the journey planner web app. Ethical approval for the field test was obtained from the Ethics Commission of the University of Graz (GZ 39/61/63 ex 2016/17). Potential participants were recruited at work, and also friends of the research team participated. A total of 27 participants (13 female, 14 male; age: M = 42.8, SD = 18.1, range = 18–74 years) took part in the field test. Three participants completed primary education, six participants completed secondary education and 18 finished postsecondary education. Eleven participants rated themselves as more physically fit than the average person with equal age. The measurements took place at a major railway and metro station in Vienna in July 2017. All participants completed walks on a 60-m reference route and on five other routes through the railway station (e.g., from a spot on the railway platform to the entrance of the metro station). We measured the distances of the routes with a measuring wheel and counted the stair steps.
The participants wore an Omron HJ-720ITC pedometer (Omron Healthcare, Inc.; Bannockburn, IL, USA) mounted on their right hip to measure their steps. The duration of the walking on the routes of each participant was measured with a Polar RS400 (Polar Electro Oy; Kempele, Finland) stopwatch by a member of the research team. All participants walked the routes by themselves to ensure that they used their own preferred walking speed and step length (see Appendix A for a detailed description of an exemplary route).
We developed two simple formulas to estimate the number of steps and the duration of the walking. For the estimation of the possible number of steps on a certain route, the distance of the route (without the staircases) divided by the mean step length of the sample plus the number of stair steps on the route should provide a simple but exact estimation for an average person.
For the duration of the physical activity on a certain route, it was important to adjust the time spent on staircases to the time spent on flat ground. Since only the number of stair steps was available, we had no detailed information about the structure of the particular staircases on the routes. Therefore, the average tread depth of a staircase with 0.35 cm steps, and a gradient which led to approximately half the normal walking speed in the horizontal direction (Fujiyama and Tyler 2010) was taken into account. This assumption gave a factor of 0.7 (two times the average tread depth), which was multiplied by the number of stair steps to adjust the time spent on a staircase. When this was added to the distance of the route and divided by the mean walking speed from the reference route, a simple estimate of the duration of the walking on that particular route could be derived.

4. Results and Interpretation

4.1. Focus-Group Interviews

As a result of the analysis of the focus-group interviews, we distinguished between three types of users. These identified potential user groups were the basis for the decisions on which content, level of information details, and additional features we should integrate into the fitness feedback demonstrator of the journey planner.

4.1.1. User Group “Basic Information Type”

  • Attitude toward physical activity: This type is characterized by persons who have a need for basic information about the relationship between physical activity and health (e.g., how does physical activity affect health?).
  • Motivational aspect: Persons of this type have an intrinsic motivation for starting to be physically active. They are open to any information that supports their competence to perform more physical activity and to integrate it into their daily lives. The members of this type are persons who either do not have time for the gym or who feel uncomfortable at a gym.
  • Use of journey planner: The level of awareness for the health-enhancing effects of physical activity is rather low, but they feel ready to change their sedentary behavior. They consider the fitness feedback in the journey planner as a useful guide on how to perform physical activity on daily trips.

4.1.2. User Group “Fun and Games Type”

  • Attitude toward physical activity: This type is characterized by persons who are aware of the health benefits of physical activity, but who need additional input for performing more physical activity in their daily lives. Persons of this type have a need for advanced information about physical activity (e.g., how much physical activity is recommended?).
  • Motivational aspect: Persons of this group need extrinsic motivation for performing more physical activity. In contrast to persons who are classified as the “basic information type”, these persons do already perform some regular physical activity, such as cycling, in their leisure time.
  • Use of journey planner: Competitive games would motivate these persons to use the fitness feedback feature, although they also have an interest in the information about the potential number of steps and stairs on a route.

4.1.3. User Group “Incentive Type”

  • Attitude toward physical activity: This type is characterized by persons who consider physical activity as something that has to be performed in the gym in leisure time. Some participants classified as the “incentive type” considered themselves as “sporty”, whereas others considered themselves as “couch potatoes”. They are aware of the health benefits of physical activity but see barriers, such as being sweaty or exhausted after walking or using the stairs on public transport trips.
  • Motivational aspect: What unites these persons with different levels of fitness within the one type is the fact that they need an external impulse for performing physical activity on their daily trips. Incentives such as vouchers or other material benefits were considered as potential motivators.
  • Use of journey planner: Persons of this type are frequent users of smartphone applications; thus, they are willing to use the feedback feature, but they have sophisticated demands. Persons of this type were found to be male and younger participants.
The requirements for the design and visualization of the fitness feedback demonstrator of the journey planner were almost the same for all three types. All potential users expect clear, reliable, and comprehensible information. The information should be easily adaptable to the individual’s needs. Given the available resources for the study, we had to focus on one target group which covered a broad range of public transport users. Thus, we decided to develop the fitness feedback for persons whom we classified as the “basic information type”. As the focus-group interviews revealed that the majority of participants did not want to share any personal information (e.g., gender, height, weight, fitness status), we did not have data to individualize the formulas for certain subgroups, which would have provided more precise estimates.
Our results about the design requirements of the fitness demonstrator are in line with results of other studies about web applications applied to health issues. Graafland et al. (2014) highlight that comprehensive information on the aim of the web application and its claims should be disclosed to enhance the acceptance of serious games, which is also true for the developed fitness feedback demonstrator. The findings of Anderson et al. (2016) support our result that different user groups need different motivations for sustained app engagement. Apps that can adapt to changes in consumer requirements were more likely to be used on a continual basis, according to their findings, which fits our results that the information provided in the fitness feedback demonstrator should be easily adaptable to the user’s needs. Peng et al. (2016) examined the design and content elements of health apps from the users’ perception and presented different types of motivators to use health apps, such as internal dedication, social competition, and intangible and tangible rewards, which are similar to our identified motivational aspects: Intrinsic motivation through information, competitive games, and external impulse through incentives. Földes and Csiszár (2015) point out that public transportation users increasingly require a reduction of both preparation and travel time. We can confirm this result, as the interviewees, who were assigned to user group “incentive type”, distinguished between their willingness for physical activity on their way to work, which was lower than their willingness to walk short distances or use stairs on their way home.

4.2. Walking Steps and Duration in the Field Test

On the standardized reference route with a flat surface, the mean step length was 0.77 m (SD = 0.07 m) and the mean gait velocity was 1.47 m/s (SD = 0.12 m/s). Generally speaking, a person’s step length is dependent on their walking speed. In other words, the step length increases with increasing gait velocity (Samson et al. 2001). Our results corresponded very well with already published measurements (e.g., Bassett et al. 1996; mean step length = 0.78 m at a mean walking speed of 1.55 m/s). Based on the collected data, we input the mean values into Equations (1) and (2):
n u m b e r   o f   s t e p s = r o u t e   d i s t a n c e   [ m ] 0.77   [ m ] + n u m b e r   o f   s t a i r s t e p s
  a c t i v e   t i m e   [ s ]   = r o u t e   d i s t a n c e   [ m ] + ( n u m b e r   o f   s t a i r s t e p s * 0.7 ) 1.47   [ m / s ]
The comparison between the estimated steps per route, computed with Equation (1) (which is used for the estimation of the number of steps in the journey planner web app) and the collected data in the real-life situation, is presented in Table 1. There is a slight overestimation of steps when using the formula. The reason for this might be that a few participants occasionally took two stairs at once. Considering the mean steps of all five routes, the formula provides a precise estimate for an average person. In addition, we specified a range of possible steps that amount to ±10%. This span results from the mean of the standard deviations of the collected steps per route (average SD = 0.07; see Table A1).
Table 2 shows the results for the duration of the physical activity on each of the five routes. There was a slight overestimation of 13 s for the duration on Route 1, which can be attributed to the minor but continuous downward slope on this route. On Route 4, the duration was underestimated due to a narrow and busy staircase. Several participants told us that they had to slow down their usual walking speed on this section. Route 5 was slightly underestimated, because the participants had to ascend 142 stair steps, with only a small distance on a flat surface in between the staircases (see Table A1 for a detailed description), which led them to adjust their walking speed to a slower speed due to the higher intensity when walking upstairs. Considering the mean duration of all five routes and the reasonable explanations for the deviations, the formula provides a very precise estimate for an average person. As with the steps, there is consistently a standard deviation of ±10% (average walking speed: SD = 0.15 m/s; see Table A1). Hence, a span of this magnitude was also specified in the journey planner web app.

4.3. Putting Theory into Practice

The process of how we transferred the theoretical background into practice is described in the following, using illustrations of the developed fitness feedback. The developed fitness feedback demonstrator consists of four navigation links:
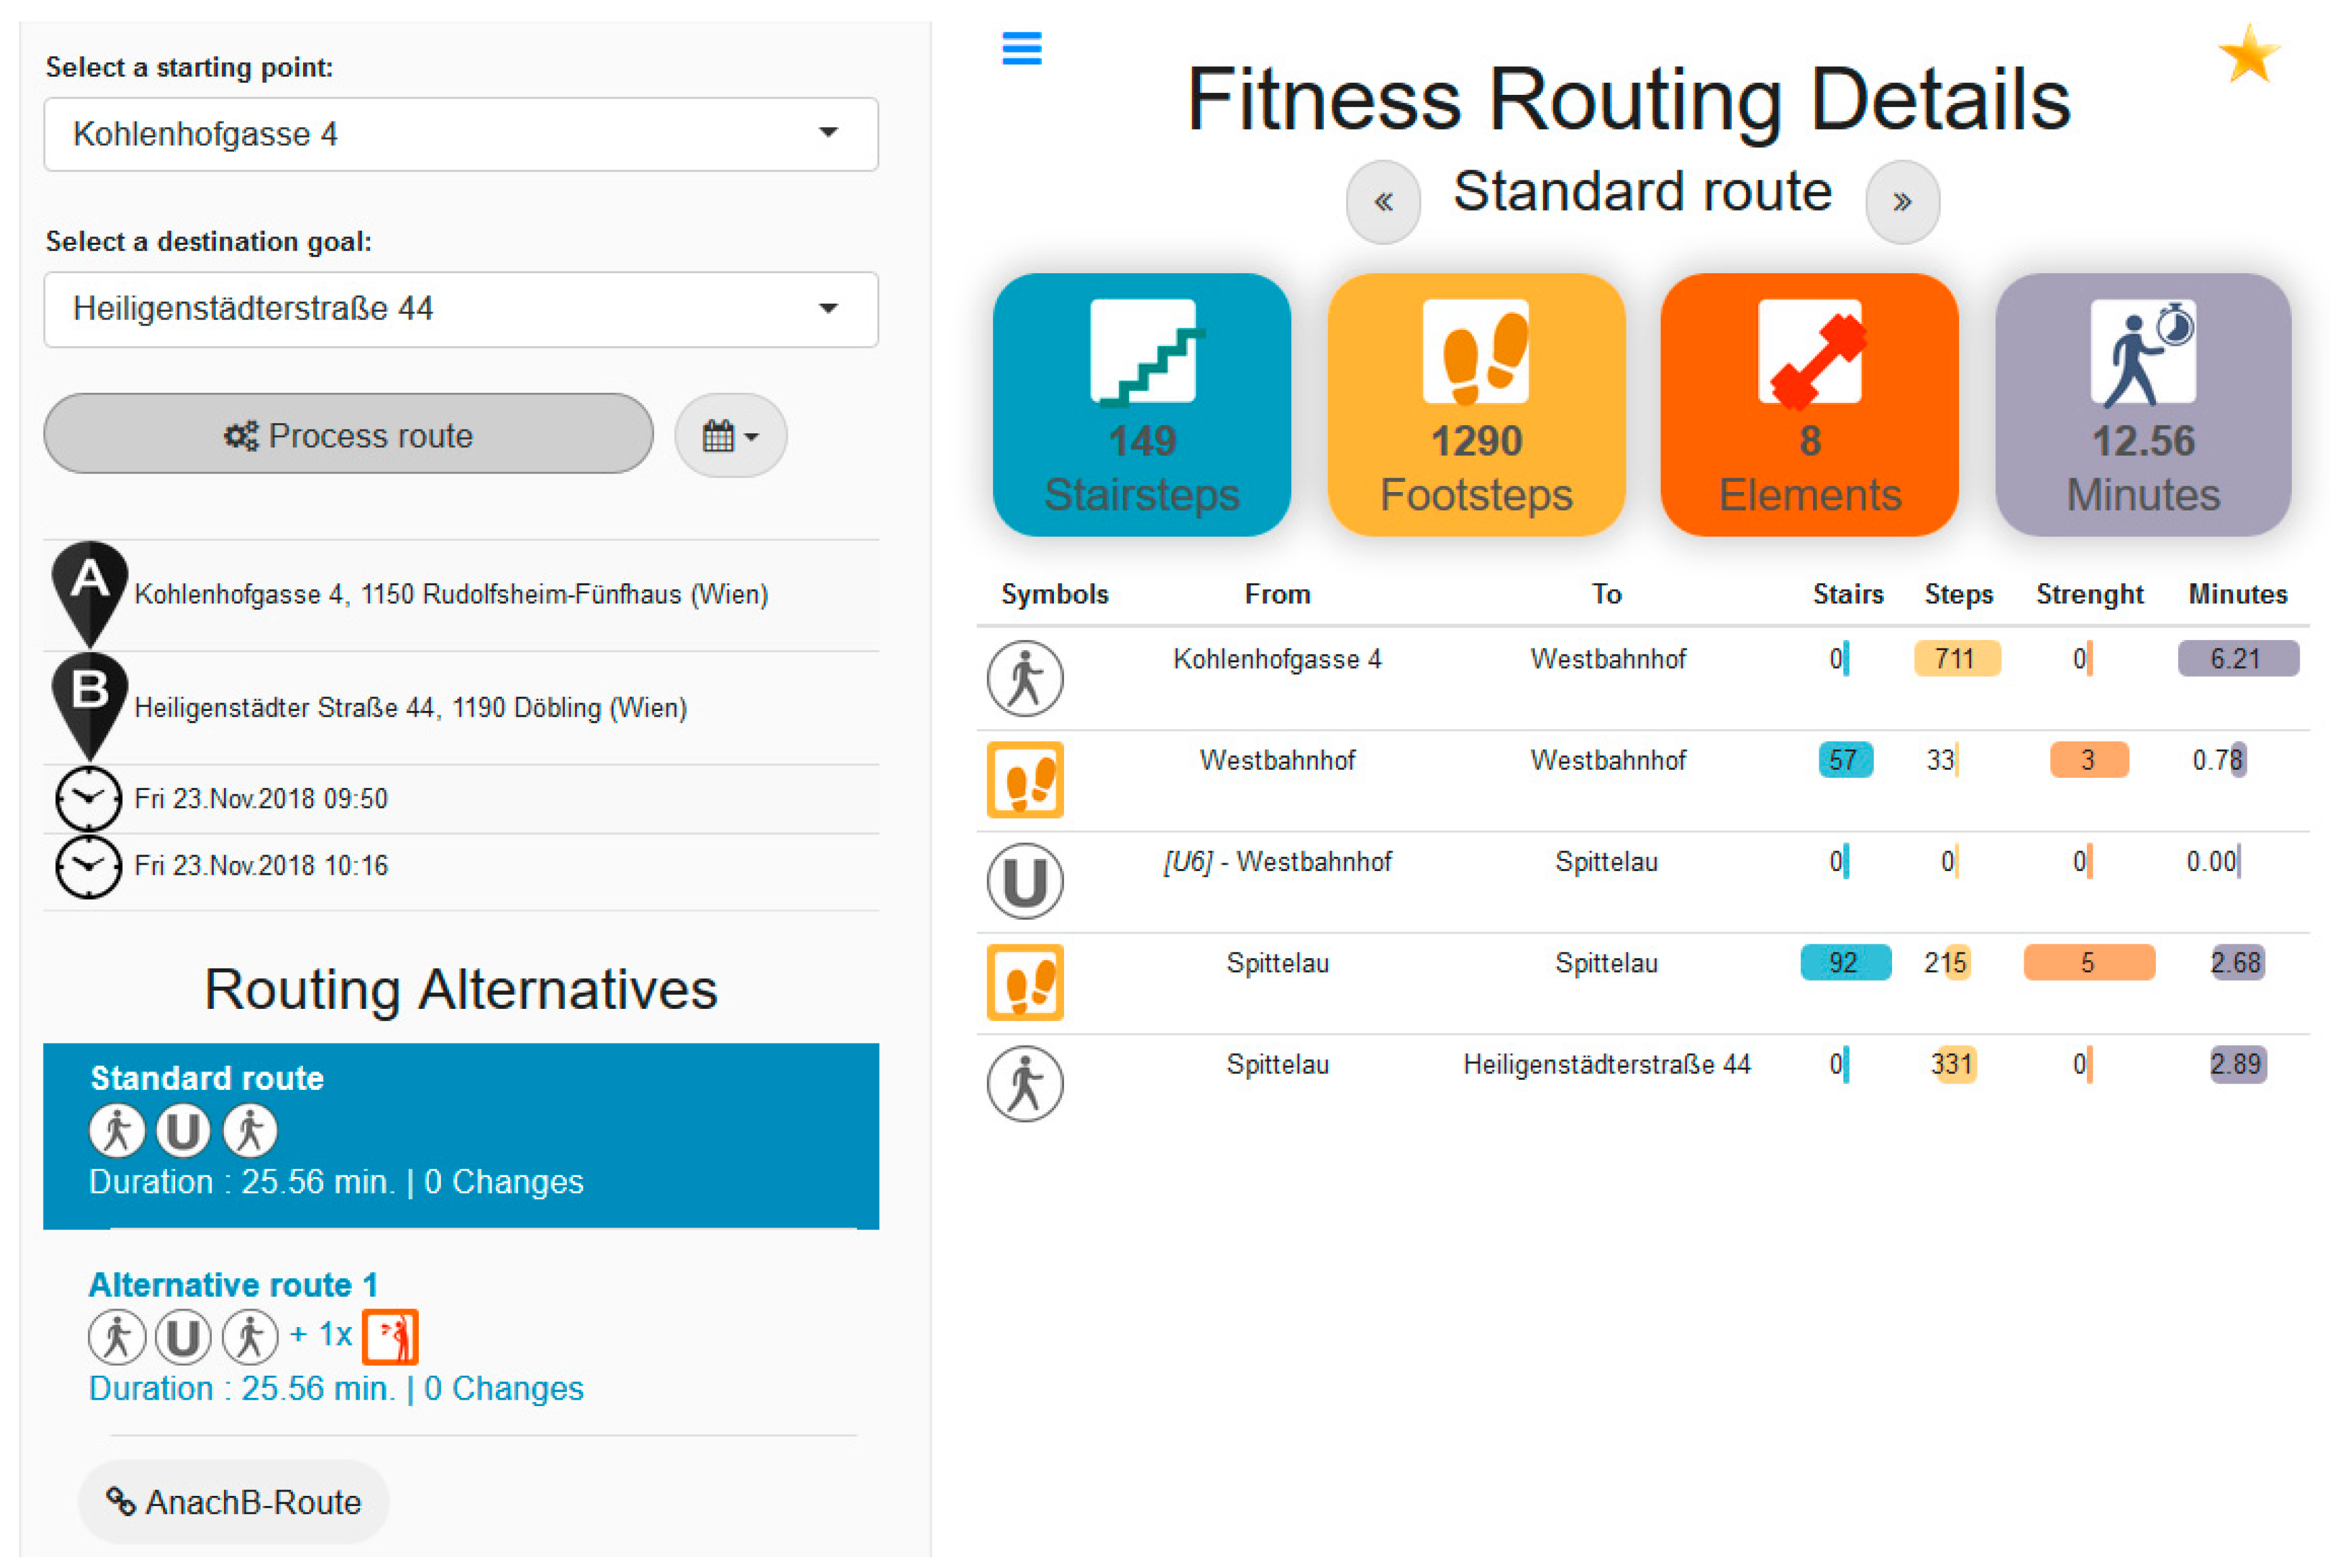
  • Routing: The routes can be selected and the information about the potential number of steps and stair steps is given (see Figure 1).
  • Info Portal: The basic information about the relationships between physical activity and health is described (see Figure 2 and Figure 3), as well as the data collection process and the development of the formula for estimating the steps and the active motion duration.
  • Project ROUTINE: The aims of the ROUTINE research project are presented, the project consortium is introduced, and the funding ministry is described. This area is not described in the following.
  • Home: The fitness feedback can be personalized; for example, favorite routes can be defined and statistics about the collected amount of physical activity within a certain time period are shown.

4.3.1. Routing

This navigation link (see Figure 1) shows the section for selecting a route on the left side (starting point, destination goal, time and date of trip). Below this section, various trip alternatives are suggested, which differ in their potential amount of physical activity. The real-time routing information, such as time of departure or time of arrival, were provided through a link to an already existing routing planner called “AnachB”, which is a routing service powered jointly by the Competence Centre for Intelligent Transport Systems (ITS) of the three Austrian federal states of Vienna, Lower Austria and Burgenland and the transport association of Vienna, Lower Austria and Burgenland. The pictured so-called “standard route” (see Figure 1) provides the possibility to make 149 stair steps and approximately 1290 footsteps (see the blue and yellow boxes on the left side). This amount is equal to eight strength elements and to approximately 13 min of active motion (i.e., the sum of time in which physical activity is performed, either by climbing steps or by walking; see the orange and purple boxes). The strength elements are reached by climbing stairs. At least 16 stairs at once must be taken to gain one strength element. The proposed alternative route (see the left side on the bottom) additionally provides exercises which can be performed during the waiting time at the public transport station (see Figure 4). The exercises are on a separate link. In total, five different health-enhancing exercises which represent five different dimensions of exercise training are provided: Calf raises for strengthening, swivel seats for agility, standing on one leg for training balance, finger exercises for training coordination, and coachman poses for relaxation.
The behavior change theories were integrated into the routing portal by defining strategies of how to initiate and support potential change. From SDT (Ryan and Deci 2000a), the following concepts were integrated:
  • Need for competence: We integrated this concept by presenting common daily physical activities, such as footsteps and stair steps, as important sources for health-enhancing physical activity that are equal to the gym.
  • Need for autonomy: This concept was integrated by providing pre-trip information about the potential amount of physical activity on a certain route. If an individual wishes to perform the suggested activities, this is down to the individual’s free choice.
  • The concepts of perceived barriers and cues to action were taken from the HBM. By providing hints on how to increase physical activity while using public transport (number of stair steps/steps, exercises), we offered such a cue to action.
  • From the TTM (Prochaska and DiClemente 1983), the stage of contemplation and the stage of preparation are represented in the “Routing” link. The information here about the potential amount of physical activity on specific routes supports the individual in making plans on how to increase physical activity and to reach further stages.

4.3.2. The Info Portal

The “Info Portal” navigation link (see Figure 2 and Figure 3) provides the basic information about the relationship between physical activity and health, as well as information on how the data were collected and how the formula for counting steps was calculated. Based on the analysis of the focus-group interviews, we defined the World Health Organization (2010) recommendations and the listing of positive effects of physical activity as the most relevant aspects for the potential users of the fitness feedback demonstrator. The transfer of the theoretical background into this area of fitness feedback was undertaken as follows:
The concept of susceptibility from the HBM describes the understanding of behavior changes. We addressed this concept by integrating information about the recommended amount of health-enhancing physical activity for adults (see Figure 2).
Intrinsic motivation, a concept taken from SDT, describes the “inherent impulse for doing an activity for its inherent satisfaction” (Ryan and Deci 2000b). According to the input from the participants of the focus-group interviews, we considered the basic facts about health benefits and physical activity as a kind of fact that triggers intrinsic motivation (see Figure 3).
The concepts of perceived threat and perceived benefits from the HBM describe the understanding of the threat/consequences of certain behavior and the understanding of the benefits of taking a certain behavior, respectively. We integrated these concepts by providing the basic information about the mitigation of negative effects through physical inactivity and the information about health-enhancing effects (see Figure 3).

4.3.3. Personalized Features—Home Section

The last navigation link, which includes the theoretical background, is named “Home”. To enter this area, the user needs a user name and a password. Users can define their favorite routes and collect personal data, such as their performed amount of physical activity while using public transport within a certain time period. Future development of this feedback could include further features such as sharing functions to allow individuals to compete with each other or a function for the collection of bonus points, which could be transferred into incentives (e.g., vouchers). The focus-group participants suggested a lot of ideas for further functions.
The SDT’s concept of self-efficacy was addressed by adding personalized features, which guide the user toward the goal of reaching at least the recommended amount of 10,000 steps per day. A concept from the HBM which was integrated was extrinsic motivation. The stages of action and maintenance from the TTM were addressed by providing the described personalized functions so that the users have feedback about their activities.

4.4. Application

The final task of the research project was to evaluate the fitness feedback demonstrator. Thus, we constructed a standardized questionnaire following the ISO 9241-110 standard for covering the ergonomics of human-computer interaction. The questionnaire included the following dimensions:
  • Conformity with user expectations: Does the fitness feedback demonstrator meet your expectations?
  • Self-descriptiveness: Are the graphical and textual descriptions sufficient?
  • Suitability for learning: Are the icons and the interface easy to understand without explanation?
  • Suitability for the task: Does the fitness feedback demonstrator fulfill the task it is designed for?
In addition, we asked how attractive this feature is for potential users, and offered the possibility to give open feedback. To collect feedback data, we provided an online link which we disseminated through various channels (TraffiCon newsletter, VOR Intranet, participants of focus-group interviews). Unfortunately, the response rate was too low for statistical analysis. Thus, we focused on the open feedback and the general evaluation trend of the fitness feedback to draw our conclusions for future development. The respondents, in general, liked the idea of the fitness feedback demonstrator and the included hints on how to integrate more physical activity into their daily lives. The suggestions for improvement were mainly related to the dimension of self-descriptiveness. According to the respondents, this dimension could be improved by reducing the provided information and by using more self-descriptive icons. As already mentioned, the participants of the focus-group interviews mentioned a lot of ideas for further fitness feedback functions. The respondents to the questionnaire also made some suggestions as to how to increase the attractiveness of the fitness feedback demonstrator, such as including more information about the interconnection between health and fitness (e.g., how many calories do I burn on my daily trips?).

5. Strength and Limitation of the Study

The strength of the study is that a multidisciplinary team worked together in order to optimally shape the fitness feedback. Another strength is the field test in order to prove the equation based on a 60m reference route. However, the field test is also a limitation of the study because the equation was tested on only five routes within one station. The research project was designed as a proof of concept study (TRL3-4). Thus, the limited number of routes for validating the prototype is justifiable. A further limitation was the low response rate for the questionnaire; only 10 persons answered the questionnaire completely.

6. Conclusions and Future Work

The main contribution of our study is the development of a methodology for providing theory-based pre-trip information about the potential amount of physical activity when using public transport. The key findings are (1) the identification of three different user types with regard to attitudes towards physical activity, attitudes toward journey planners and motivational aspects; and (2) the development of a formula for calculating the potential number of steps and the duration of walking while using public transport. The fitness feedback demonstrator is a good practical example of how to make use of the theories and methods from the areas of social and sports sciences. The information about the potential amount of physical activity that is integrated within public transport routes could serve as an additional argument to promote the use of public transport and might encourage persons to integrate more physical activity into their daily routines. Future work on one side should prove that this fitness feedback initiates and supports behavior change toward increased use of public transport and more physical activity. On the other side, we consider further development of the demonstrator as necessary to make it ready for the market.

Author Contributions

Conceptualization, E.F. and S.T.; Methodology, E.F. and J.J.; Investigation, E.F., S.T. and J.J.; Writing—Original Draft Preparation, E.F., S.T. and J.J.; Writing—Review & Editing, E.F., S.T. and J.J.; Visualization, J.J.; Supervision, S.T.; Project Administration, E.F.; Funding Acquisition, E.F.

Funding

This research was funded by the Austrian Federal Ministry for Transport, Innovation and Technology, grant number 854937. The APC was funded by institutions through the Knowledge Unlatched initiative.

Conflicts of Interest

The authors declare no conflict of interest.

Appendix A

Exemplary Description of Route 1: Platform 5A—Tram Station 52
start: platform 5A, end: tram station 52; distance on flat surface: 205 m, stairsteps: 39
platform 5A1. staircase (waiting hall):68 m
1. staircase: 26 stairsteps (downstairs)
1. staircase:2. staircase (outside):97 m
2. staircase: 8 stairsteps (downstairs)
2. staircase:3. staircase (outside):14 m
3. staircase: 5 stairsteps (downstairs)
3. staircase:tram station 52:26 m

Appendix B

Table A1. Results of the field test for all five routes measured in the railway station.
Stair StepsMeanMedianSDMinMax
Step length—60 m reference route [m]00.7740.7690.0640.670.90
Step length—route 1 [m]390.7600.7260.0750.650.92
Step length—route 2 [m]320.7490.7440.0610.650.89
Step length—route 3 [m]260.7340.7280.0690.570.88
Step length—route 4 [m]1130.6180.6070.0660.520.84
Step length—route 5 [m]1420.6340.6220.0570.550.81
Walking speed—route 1 [m/s]391.5381.5080.1611.291.92
Walking speed—route 2 [m/s]321.4761.4510.1441.261.78
Walking speed—route 3 [m/s]261.4391.4100.1561.111.76
Walking speed—route 4 [m/s]1131.1491.1420.1340.901.42
Walking speed—route 5 [m/s]1421.1981.1600.1430.951.53

Appendix C

Table A2. Description of the sample of the participants of the focus group interviews.
AgeGenderUse of Public TransportUse of Journey PlannerPerceived Level of Fitness
17maledailyregular use of common journey planner apps, web mapping servicesfeels fitter than persons of the same age
20femaledailyregular use of common journey planner apps, web mapping servicesfeels as fit as persons of the same age
22female2–3 times/weekregular use of common journey planner apps, web mapping servicesfeels as fit as persons of the same age
22maledailyregular use of common journey planner apps, web mapping servicesfeels less fit than persons of the same age
25female4–5 times/weekregular use of common journey planner apps, web mapping servicesfeels as fit as persons of the same age
28femaledailyrare us of journey planner apps feels as fit as persons of the same age
28male2–3 times/weekrare us of journey planner apps feels as fit as persons of the same age
37female4–5 times/weekregular use of common journey planner apps, web mapping servicesfeels less fit than persons of the same age
45male2–3 times/weekrare us of journey planner appsfeels as fit as persons of the same age
47maledailyrare us of journey planner apps, uses analog mapsfeels fitter than persons of the same age
50female4–5 times/weekuses paper mapsfeels less fit than persons of the same age
50female4–5 times/weekregular use of common journey planner apps, web mapping servicesfeels as fit as persons of the same age
50male4–5 times/weekregular use of common journey planner apps, web mapping servicesfeels as fit as persons of the same age
53male4–5 times/weekrare us of journey planner appsfeels as fit as persons of the same age
59femaledailyuses paper mapsfeels less fit than persons of the same age
59femaledailyRare use of common journey planner apps, web mapping services, regular use of analoge mapsfeels as fit as persons of the same age
59male2–3 times/weekrare use of web journey planners and analoge mapsfeels less fit than persons of the same age

References

  1. Abraham, Charles, and Paschal Sheeran. 2005. The Health Belief Model. Cambridge Handbook of Psychology, Health and Medicine 2: 97–102. [Google Scholar] [CrossRef]
  2. Anderson, Kevin, Oksana Burford, and Lynne Emmerton. 2016. Mobile Health Apps to Facilitate Self-Care: A Qualitative Study of User Experiences. PLoS ONE 11: e0156164. [Google Scholar] [CrossRef] [PubMed]
  3. Bandura, Albert. 1977. Self-Efficacy: Toward a Unifying Theory of Behavioral Change. Psychological Review 84: 191–215. [Google Scholar] [CrossRef] [PubMed]
  4. Bassett, David, Barbara Ainsworth, Sue Leggett, Clara Mathien, James Main, David Hunter, and Glen Duncan. 1996. Accuracy of five electronic pedometers for measuring distance walked. Medicine and Science in Sports and Exercise 28: 1071–77. [Google Scholar] [CrossRef] [PubMed]
  5. Bundesministerium für Verkehr Innovation und Technologie. 2016. Österreich unterwegs 2013/2014. Available online: https://www.bmvit.gv.at/verkehr/gesamtverkehr/statistik/oesterreich_unterwegs/downloads/oeu_2013-2014_Ergebnisbericht.pdf (accessed on 11 November 2018).
  6. Chaix, Basile, Yan Kestens, Scott Duncan, Claire Merrien, Benoir Thierry, Bruno Pannier, Ruben Brondeel, Antoine Lewin, Noella Karusisi, Camille Perchoux, and et al. 2014. Active transportation and public transportation use to achieve physical activity recommendations? A combined GPS, accelerometer, and mobility survey study. International Journal of Behavioral Nutrition and Physical Activity 11: 124. [Google Scholar] [CrossRef] [PubMed] [Green Version]
  7. Deci, Edward. L., and Richard M. Ryan. 2002. Handbook of Self-Determination Research. Rochester: University Rochester Press. [Google Scholar]
  8. Department of Health. 2011. Start Active Stay Active. Available online: https://www.gov.uk/government/publications/start-active-stay-active-a-report-on-physical-activity-from-the-four-home-countries-chief-medical-officers (accessed on 2 February 2019).
  9. Downs, Danielle, Claudio Nigg, Heather Hausenblas, and Erica Rauff. 2014. Why do people change physical activity behavior. In ACSM’s Behavioral Aspects of Physical Activity and Exercise. Edited by Claudio Nigg. Philadelphia: Wolters Kluwer, pp. 1–38. [Google Scholar]
  10. Földes, Dávid, and Csaba Csiszár. 2015. Route plan evaluation method for personalised passenger information service. Transport 30: 273–85. [Google Scholar] [CrossRef]
  11. Fonds Gesundes Österreich. 2018. Figure Recommendation for Physical Activity for Adults. Available online: http://fgoe.org/bewegungsempfehlungen_fuer_erwachsene (accessed on 26 November 2018).
  12. Fujiyama, Taku, and Nick Tyler. 2010. Transportation Planning and Technology Predicting the walking speed of pedestrians on stairs. Transportation Planning and Technology 33: 177–202. [Google Scholar] [CrossRef]
  13. Graafland, Maurits, Mary Dankbaar, Agali Mert, Joep Lagro, Laura De Wit-Zuurendonk, Stephanie Schuit, Alma Schaafstal, and Marlies Schijven. 2014. How to Systematically Assess Serious Games Applied to Health Care. JMIR Serious Games 2: e11. [Google Scholar] [CrossRef] [PubMed]
  14. Jones, Christina J., Helen Smith, and Carrie Llewellyn. 2014. Evaluating the effectiveness of health belief model interventions in improving adherence: A systematic review. Health Psychology Review 8: 253–69. [Google Scholar] [CrossRef] [PubMed]
  15. Mayring, Philipp. 2000. Qualitative Content Analysis. Forum Qualitative Sozialforschung/Forum: Qualitative Social Research 1: 20. [Google Scholar] [CrossRef]
  16. National Cancer Institute. 2005. Theory at a Glance. A Guide for Health Promotion Practice; Bethesda: U.S. Department of Health and Human Services, Public Health Service, National Institutes of Health, National Cancer Institute.
  17. Nigg, Claudio, Karly Geller, Rob Motl, Caroline Horwarth, Kristin Wertin, and Rodney Dishman. 2011. A Research Agenda to Examine the Efficacy and Relevance of the Transtheoretical Model for Physical Activity Behavior. Psychology Sport and Exercise 12: 7–12. [Google Scholar] [CrossRef] [PubMed]
  18. Nyumba, Tobia, Kerrie Wilson, Christina J. Derrick, and Nibedita Mukherjee. 2017. The use of focus group discussion methodology: Insights from two decades of application in conservation. Methods in in Ecology and Evolution. 9: 20–32. [Google Scholar] [CrossRef]
  19. Oja, Pekka, Paul Kelly, Elaine Murtagh, Marie Murphy, Charles Foster, and Sylvia Titze. 2018. Effects of frequency, intensity, duration and volume of walking interventions on CVD risk factors: A systematic review and meta-regression analysis of randomised controlled trials among inactive healthy adults. British Journal of Sports Medicine 52: 769–75. [Google Scholar] [CrossRef] [PubMed]
  20. Patrick, Heather, Ken Resnicoe, Pedro Teixeira, and Geoffrey Williams. 2014. Communication skills to elicit physical activity behavior change: How to talk to the client. In ACSM’s Behavioral Aspects of Physical Activity and Exercise. Edited by Claudio Nigg. Philadelphia: Wolters Kluwer, pp. 129–51. [Google Scholar]
  21. Peng, Wei, Shaheen Kanthawala, Yuan Shupei, and Syed A. Hussain. 2016. A qualitative study of user perceptions of mobile health apps. BMC Public Health 16: 1158. [Google Scholar] [CrossRef] [PubMed]
  22. Physical Activity Guidelines Advisory Committee. 2018. Physical Activity Guidelines Advisory Committee Scientific Report. Available online: https://health.gov/paguidelines/second-edition/report/pdf/PAG_Advisory_Committee_Report.pdf (accessed on 11 November 2018).
  23. Prochaska, James O., and Carlo. C. DiClemente. 1983. Stages and processes of self-change of smoking: Toward an integrative model of change. Journal of Consulting and Clinical Psychology 51: 390–95. [Google Scholar] [CrossRef] [PubMed]
  24. Public Health England. 2017. 10 Minutes Brisk Walking Each Day in Mid-Life for Health Benefits and towards Achieving Physical Activity Recommendations. Evidence Summary. London, England. Available online: https://assets.publishing.service.gov.uk/government/uploads/system/uploads/attachment_data/file/639030/Health_benefits_of_10_mins_brisk_walking_evidence_summary.pdf (accessed on 20 February 2019).
  25. Rosenstock, Irwin M., Victor J. Strecher, and Marshall H. Becker. 1988. Social learning theory and the health belief model. Health Education & Behavior 15: 175–83. [Google Scholar] [CrossRef]
  26. Ryan, Richard. M., and Edward. L. Deci. 2000a. Self-determination theory and the facilitation of intrinsic motivation, social development, and well-being. American Psychologist 55: 68–78. [Google Scholar] [CrossRef]
  27. Ryan, Richard. M., and Edward. L. Deci. 2000b. Intrinsic and Extrinsic Motivations: Classic Definitions and New Directions. Contemporary Educational Psychology 25: 54–67. [Google Scholar] [CrossRef] [PubMed]
  28. Samson, Monique M., Alan Crowe, Paul de Vreede, Jos A. G. Dessens, Sijmen A. Duursma, and Harald J. J. Verhaar. 2001. Differences in gait parameters at a preferred walking speed in healthy subjects due to age, height and body weight. Aging Clinical and Experimental Research 13: 16–21. [Google Scholar] [CrossRef]
  29. Statistik Austria. 2014. Körperliche Aktivität in der Freizeit. Available online: http://www.statistik.at/web_de/statistiken/menschen_und_gesellschaft/gesundheit/gesundheitsdeterminanten/koerperliche_aktivitaet/index.html (accessed on 11 November 2018).
  30. Sweet, Shane N., Michelle S. Fortier, Shaelyn M. Strachan, and Chris M. Blanchard. 2012. Testing and Integrating Self-Determination Theory and Self-Efficacy Theory in a Physical Activity Context. Canadian Psychology/Psychologie Canadienne 53: 319–27. [Google Scholar] [CrossRef]
  31. World Health Organization. 2008. Pacific Physical Activity Guidelines for Adults: Framework for Accelerating the Communication of Physical Activity Guidelines. Available online: https://www.who.int/dietphysicalactivity/publications/pacific_pa_guidelines.pdf (accessed on 20 February 2019).
  32. World Health Organization. 2010. Global Recommendations on Physical Activity for Health. Available online: https://www.who.int/dietphysicalactivity/publications/9789241599979/en/ (accessed on 11 November 2018).
Figure 1. Routing area of the fitness feedback demonstrator. Visualization by TraffiCon GmbH, Salzburg.
Socsci 08 00082 g001
Figure 2. World Health Organization (2010) physical activity recommendations. Figure by Fonds Gesundes Österreich (2018).
Socsci 08 00082 g002
Figure 3. List of health-enhancing effects of physical activity. Visualization by TraffiCon GmbH, Salzburg.
Socsci 08 00082 g003
Figure 4. Exercise for strengthening. Visualization by TraffiCon GmbH, Salzburg.
Socsci 08 00082 g004
Table 1. Comparison of the estimated steps from the equation and the collected data.
Stair StepsRoute Distance [m]Steps from EquationSteps from Field Test 1
Route 139205305301
Route 232192281273
Route 326146216213
Route 4113178344348
Route 5142173367358
Mean steps 303299
1 The median was chosen because of the skewed distribution.
Table 2. Comparison of the estimated duration of physical activity from the equation and the collected data.
Stair StepsRoute Distance [m]Duration [s] from EquationDuration [s] from Field Test 1
Route 139205158145
Route 232192146140
Route 326146112110
Route 4113178175185
Route 5142173185192
Mean duration 155154
1 The median was chosen because of the skewed distribution.

