1. Introduction
Nowadays, the European Union is experiencing the unceasing trend of population ageing. On one side, Europeans are able to enjoy longer lifespans as the result of the increasing life expectancy at birth, but on the other side, there is an ongoing trend of decreasing fertility rates in the European Union. In a globalized world there are a lot of new trends and challenges especially regarding the elderly population that is resistant to the new working conditions, the new working environment, and usage of new technology. New technologies need some particular skills. In a lot of cases, new technologies increasingly substitute routine tasks. There is a high share of routine tasks in all kind of jobs, in all industries and sizes of enterprise. The number of jobs and occupations that require only low skills has constantly decreased. Innovation will create new jobs for the future; we can ask ourselves—what is the future of jobs? A lot of new jobs will require creativity and social skills. Since 2011, the term Industry 4.0 has started to be widely used, after launching of the German project in the manufacturing sector. This paper is structured as follows. After the introduction part, the paper gives us the background or the literature review, and methodology of the research with all data and specification of variables. Further, the results are explained together with the implemented model of the research. In the discussion part and concluding remarks, new trends, challenges, and phenomena are described.
2. Background
With the declining numbers of economically active inhabitants, the labor market of the European Union (EU) will be forced to face multiple challenges in the near future. The phenomenon of population ageing is expected to continue into the next decades as the post war baby-boom generation is about to reach retirement age (
Dufek and Minařík 2009;
Blankenau et al. 2007) The process of increasing the retirement age has already started in the EU, and the inhabitants of the European Union will have to actively participate in the labor market for longer time periods (
Börsch-Supan et al. 2007;
Gonzalez-Eiras and Niepelt 2008;
Boons et al. 2013). According to
Summer (
2018), extensive use of technology, automation, robotization, computerization, and digitalization will have serious effects on jobs, skills, and occupations, especially in the context of job losses and employment destruction.
The current technological revolution Industry 4.0 goes hand in hand with discussions about the future of labor, especially under circumstances of demographic EU development. The opinion difference may be represented by the research of
Frey and Osborne (
2017) and
Autor (
2015), in which the opinions oscillate from concerns of massive job losses if current jobs became redundant due to interconnected robots, to the assumption of huge employment and innovation delivered by Industry 4.0. The prediction difference can be also represented in the findings of recent studies carried out on the German labor market.
The recent
BCG (
2015) study focused on how the introduction of Industry 4.0 will affect the evolution of 40 job families in 23 industries in Germany, and has forecasted 610,000 jobs will be lost in assembly and production, but 960,000 jobs will be created, particularly in information technologies. Hence, the report concludes that there will be an increase of 350,000 jobs in Germany through 2025. While
Wolter et al. (
2015) present neutral results of a study carried out in 2015 for Germany by the Institute for Employment Research (IAB), the Federal Institute for Vocational Education and Training (BIBB), and the Institute of Economic Structures Research (GWS). This study does not predict any considerable changes: “In the cells consisting of 54 occupational fields and 63 economic sectors 490,000 jobs will be lost while in other areas 430,000 jobs will be newly created within ten years beyond the baseline scenario.” (
Weber 2016, sec. 4).
3. Methodology of the Research
The multiple linear regression analysis, particularly specification and quantification of the model, has been used for the results of the paper. The last part of the regression analysis—the verification of the model—was not published into the paper due to limited space. The model specification has been constructed in three basic steps: the specification of all variables included in the model, in accordance with a priori information obtained from economic theory and data; the specification of the expected signs and values of the independent variables; and the specification of the model equation must play a part. The model quantification has been used for the estimation of the numerical values of the model and its parameters by appropriately chosen procedures designed for econometric estimation.
4. Data
Data were collected for the reference year 2015, from the Eurostat and OECD, as these were the most recent data at the time of writing the paper (
OECD 2017).
The sample size has twenty-two member countries of the European Union, namely: Belgium, Bulgaria, Croatia, the Czech Republic, Estonia, France, Germany, Greece, Hungary, Ireland, Latvia, Lithuania, Luxemburg, Malta, the Netherlands, Poland, Portugal, Romania, the Slovak Republic, Slovenia, Spain, and the United Kingdom. The data for the independent variable—monthly minimum wage—were available only for twenty-two EU member countries, as there have been six countries in the European Union which do not set statutory minimum wages. This indicator was, from the authors’ point of view, very crucial in the analysis, which was the main reason why the regression analysis contains only twenty-two EU member countries.
Specification of Variables
The dependent variable has been expressed as a percentage and it reflects the number of unemployed people from 55 to 64 years old over the active labor force in the same age class. The independent variables have characterized influences or causes of the dependent variable. The main factors which might eventually affect or cause the unemployment of age category 55–64 have been chosen as follows: long term unemployment, total unemployment, social benefits for the unemployed, monthly minimum wages, average age of retirement for men, average age of retirement for women, duration of working life, productivity, technology, gross domestic product, inflation, immigration and emigration, and membership in the Euro area.
5. Results
5.1. Summary Statistics of Variables
The summary statistics have been obtained for the dependent variable, as well as for all independent variables with the exception of the dummy variable, which symbolizes membership in the Euro area. The summary statistics reflect values for mean, median, minimum, maximum, standard deviation, and coefficient of variation, skewness, and kurtosis. The summary statistics are illustrated in the
Table 1 below.
The mean value of the unemployment of the age category 55–64 in twenty-two member countries of the European Union was equal to 8%. However, the mean statistic can, in many cases, be influenced by extreme values which might have been present in the dataset. Its explanatory power has been therefore considered to be worse, compared to the median. In order to obtain median values from the dataset, numbers must be sorted from the lowest to the highest value. The median represents the middle number in the sorted list of numbers. The median value of the dependent variable was 7.6%. Put differently, the unemployment of the age category 55–64 has been in fifty percent of twenty-two member states of the European Union higher than 7.6%, and in fifty percent of the investigated EU member countries it has been lower than 7.6%. Minimum and maximum stand for the minimum and maximum values within the dataset. The minimum value of the unemployment of age category 55–64 in twenty-two member states of the European Union was 3.5% and the maximum value was equal to 18.6%. Standard deviation represents the dispersion of the dataset from its mean. The closer the data are to the mean, the smaller the deviation in the dataset is. In the case of the unemployment of age category 55–64, the standard deviation was not very high, which indicates that the data were relatively close to its mean. The coefficient of variation is also called the relative standard deviation and it measures the dispersion of the data points in a data series around the mean. In other words, it is the ratio of the standard deviation to the mean. The coefficient of variation for the dependent variable was slightly higher than 0.5.
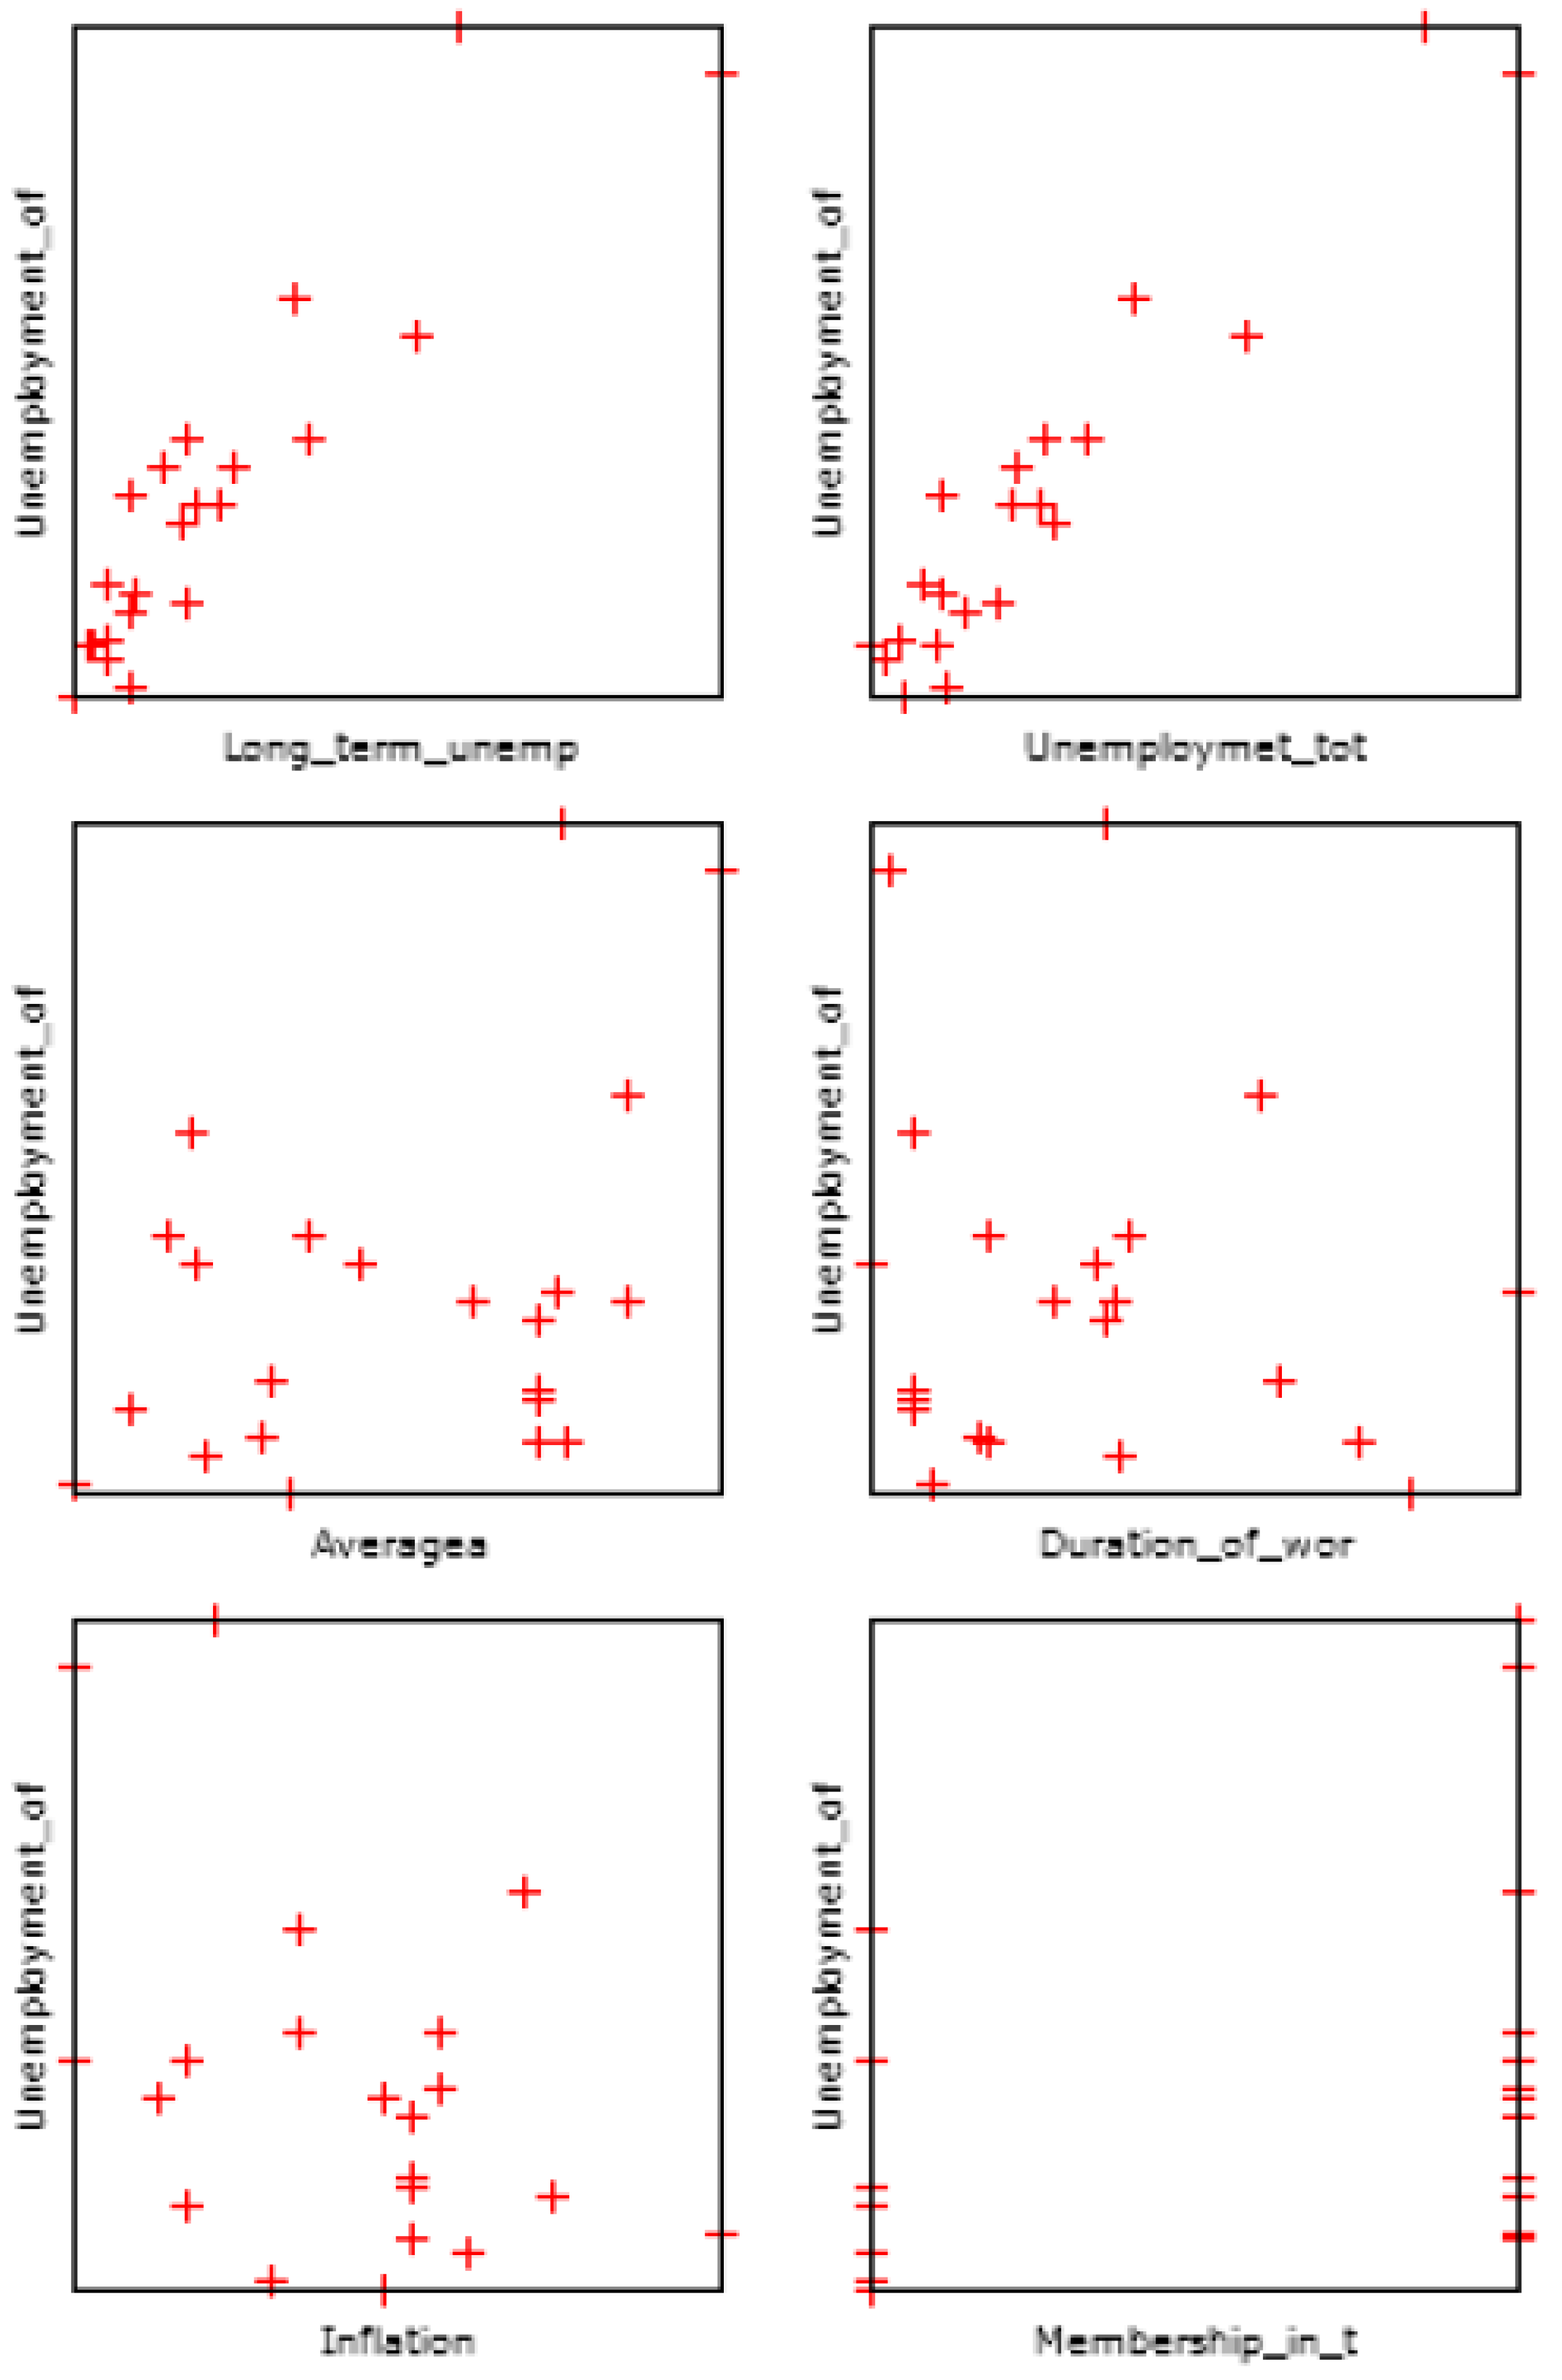
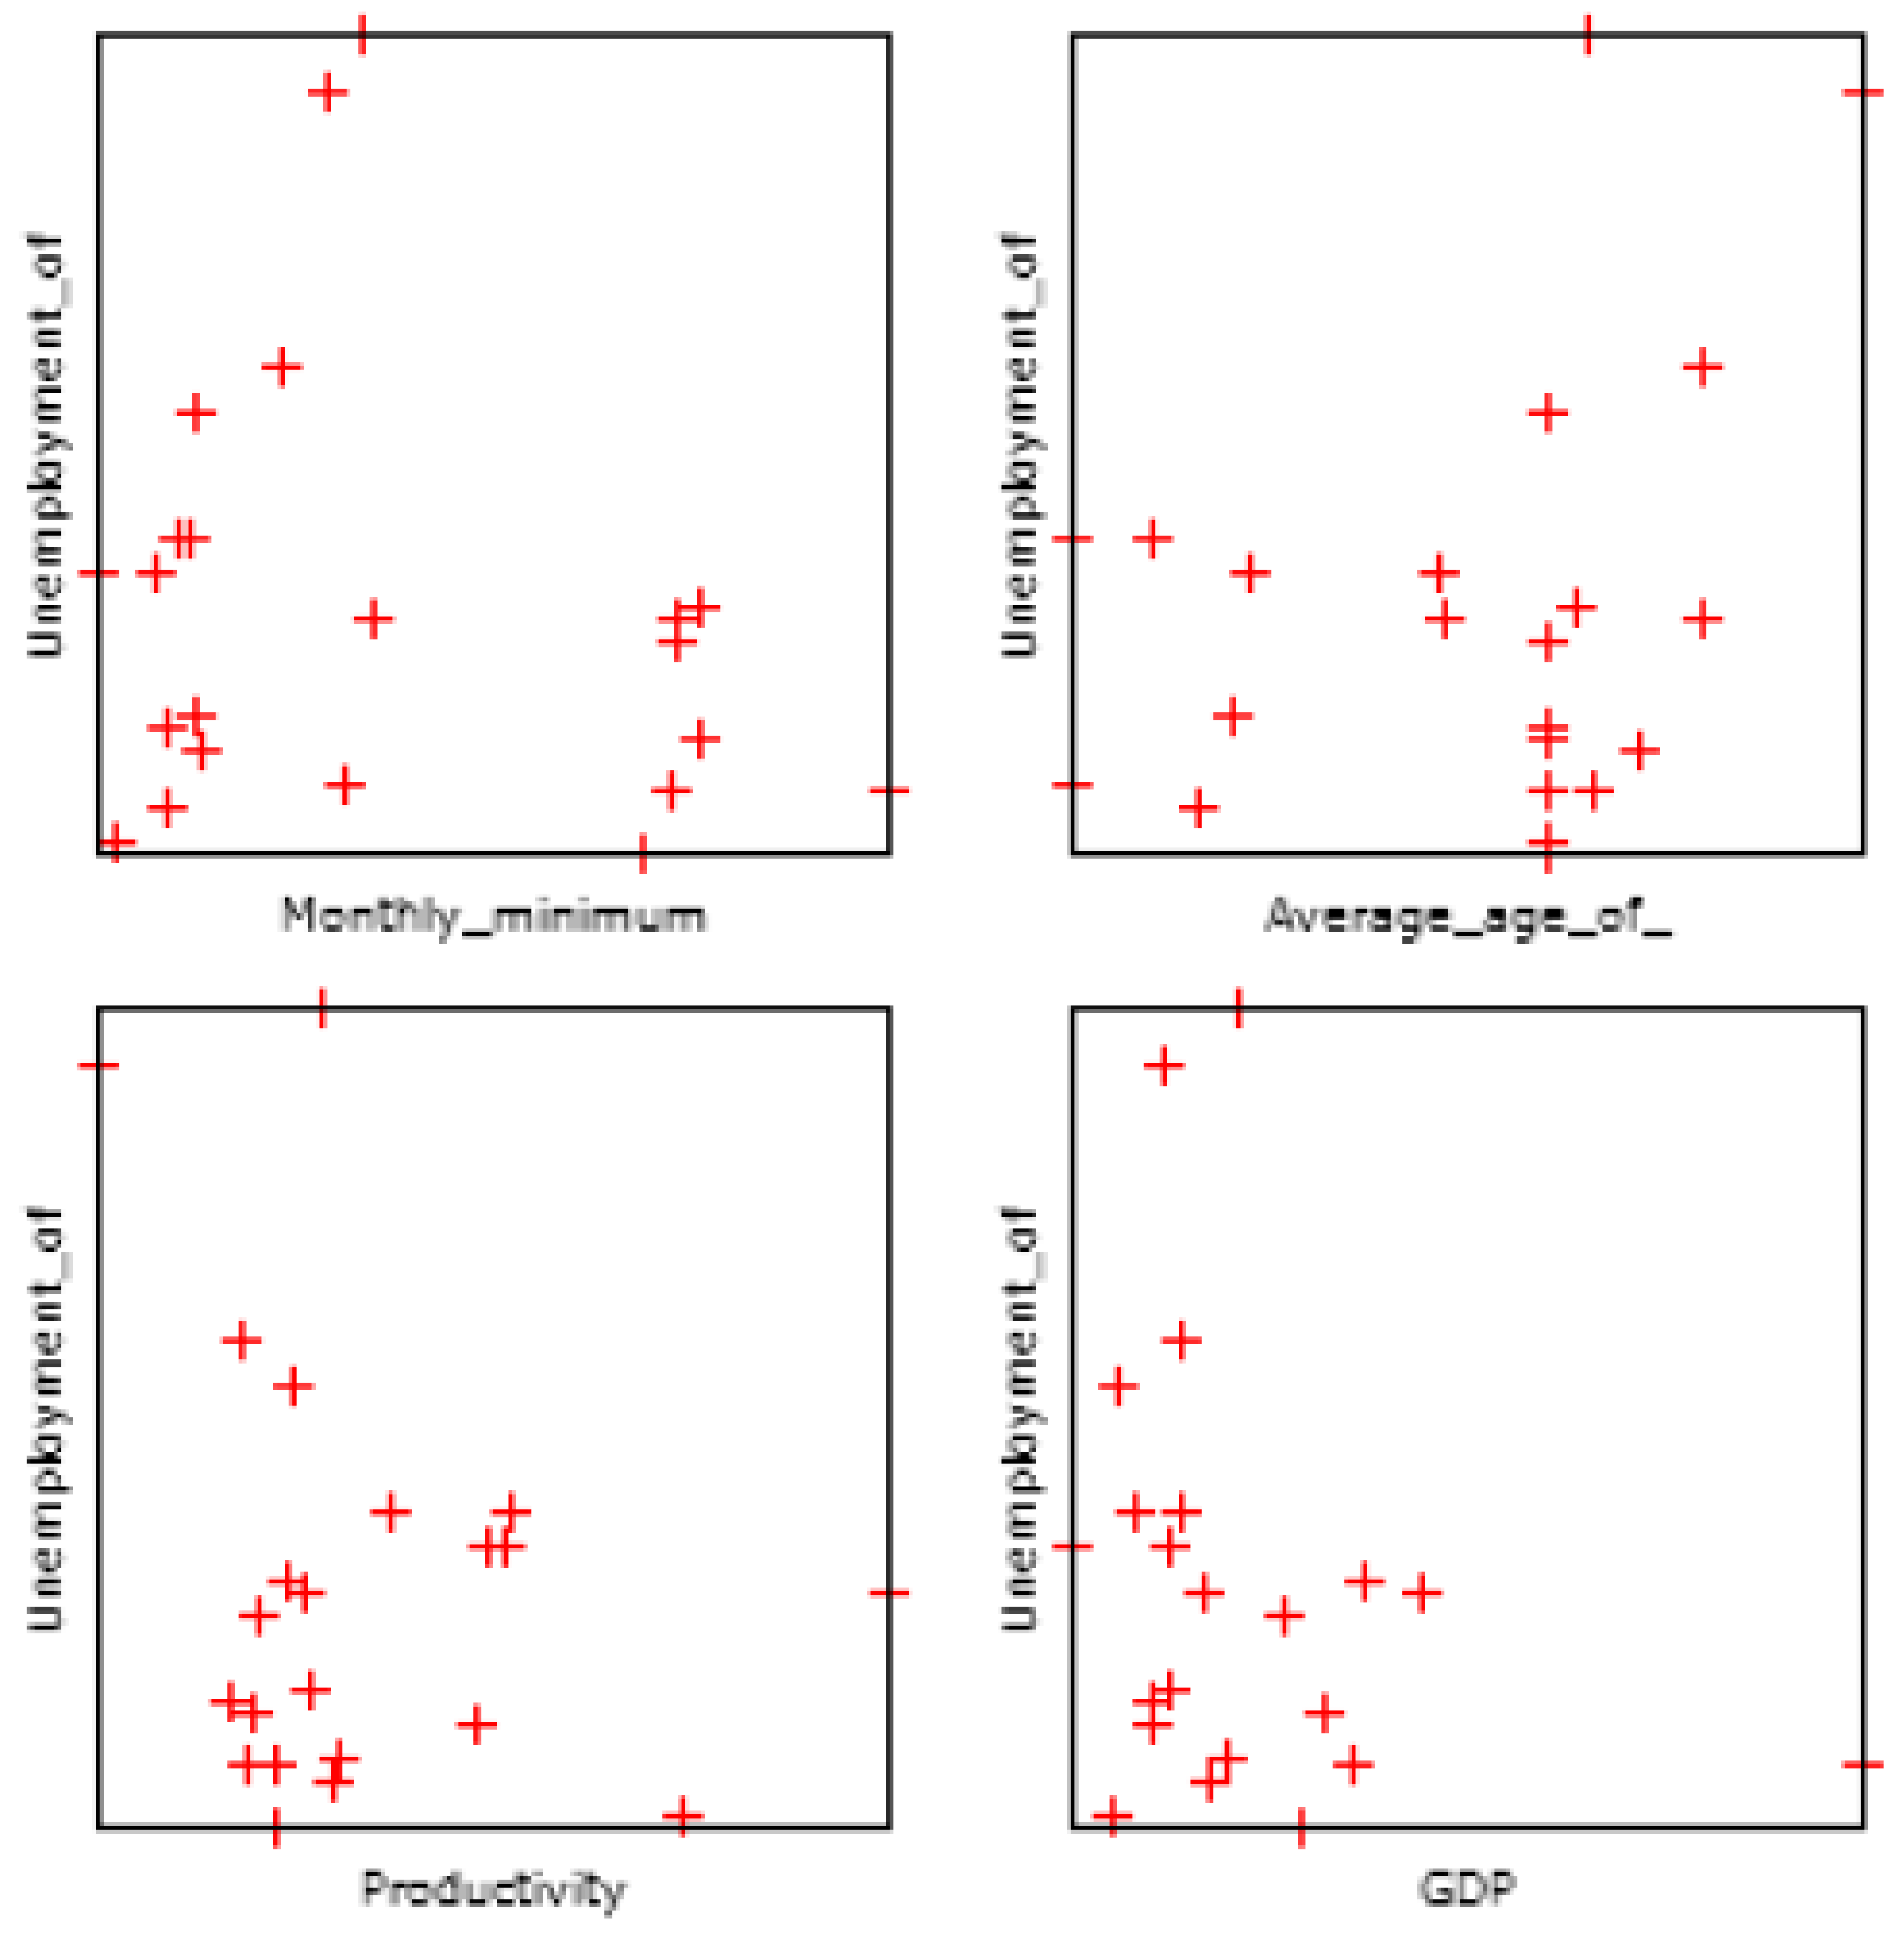
5.2. Multiple X-Y Scatter Plots
The relationship between the dependent variable and individual explanatory variables might be recognized by demonstrating multiple X-Y scatter plots in
Figure 1.
The scatter plots as seen in the
Figure 2 show the relationships between individual independent variables and the dependent variable—unemployment of age category 55–64. Although there has been a perceived positive correlation between unemployment of age category 55–64 and long-term unemployment, and the total unemployment, the other explanatory variables do not report strong positive correlations.
5.3. Model Quantification
The coefficients and
p-values have been estimated by the ordinary least squares method (OLS) as can be seen into
Table 2. The
t-test has been used for testing the statistical significance of the regression coefficients. The level of significance has been α = 0.05. The null hypothesis was rejected if the
p-value was smaller than the significance level. At the beginning, the
t-test was run for all variables, and subsequently, non-significant variables were removed from the model. Thus, a sequential selection method has been used. The test hypotheses were as follows: H0: Parameter is not statistically significant. H1: Parameter is statistically significant.
The presented
Table 3 indicates that only two out of ten explanatory variables have been statistically significant as their
p-values were smaller than the level of significance. These two variables are total unemployment and duration of working life. However, the
p-value of monthly minimum wage was smaller than the level of significance α = 0.10, the parameter was therefore significant as well. The adjusted coefficient of correlation was equal to 0.935, which means that the model was explained by 93.5%. It was necessary to further modify the model in order to obtain more precise results. After gradual removal of the statistically not significant variables, the following model was obtained.
The final modified model was created by gradual removal of statistically not significant variables. Productivity, as the explanatory variable with the highest
p-value, was removed first. It was followed by inflation, membership in the Euro area, GDP, long term unemployment, and average age of retirement for men. The final model contains four explanatory variables which are statistically significant at the significance level α = 0.05. For all four independent variables, the null hypothesis of the
t-test was rejected in favor of the alternative hypothesis. The final modified model was explained by 94.1%. In the original model, there were parameters which affected the unemployment of age category 55–64 directly (for instance, monthly minimum wage, average age of retirement, and duration of working life) and indirectly. The indirect variables have been general factors and they were step by step removed from the model. The linear function form was considered to be the most suitable for the model. The regression equation of the model was presented as the following:
where:
Y—unemployment of age category 55–64,
X2—total unemployment,
X3—monthly minimum wage,
X5—average age of retirement for women,
X6—duration of working life.
6. Discussion
Estimated signs of the independent variables, total unemployment, monthly minimum wage, and average age of retirement for women, were in accordance with expectations. Thus, the estimated signs were consistent with the economic theory.
Bocean (
2015) analyzed, besides many other factors, the influence of minimum wage setting on unemployment for all member countries of the European Union, while our paper is dealing with twenty-two member countries of the European Union only. Bocean was working with time-series datasets from 2003 to 2013.
Mitsis (
2015) was dealing with the question of how minimum wages affect total employment. He examined the case of Cyprus in the time period 1960–2011. Vector auto regression (VAR) models concluded that an increase in minimum wage settings brought a negative impact on employment.
Lefebvre (
2012) examined the relationship between unemployment and retirement. He analyzed the panel data of twelve OECD countries: Australia, Canada, Finland, France, Germany, the Netherlands, Norway, Portugal, Spain, Sweden, the UK, and the USA, from the time period 1982–2003. The Australian research by authors
Staubli and Zweimuller (
2011) was also oriented on the relationship between retirement age and employment of older people. The authors analyzed men aged from 60 to 62.2 and women aged from 55 to 57.2, from the year 2000 to 2006.
Virjan and Crețu (
2015) analyzed the correlation between employment and productivity of the age category 55–64 years in Romania. They found out that there was not a strict correlation between labor productivity of older people and the employment rate.
Rožman et al. (
2016) analyzed the differences between older and younger employees. In order to recognize the differences in stereotypes in workplaces between the two age groups, they used the non-parametric Mann–Whitney U test.
Popović and Popović (
2011) completed research on dynamics and correlations between inflation and unemployment in the European Union for various time periods (1998–2007, 2000–2009, and 2000–2006).
Khan et al. (
2014) have recognized a possible relationship between real GDP growth and the unemployment rate. They analyzed Pakistan’s time series annual datasets from 1976 to 2010.
Morsheda and Nassar (
2015) researched the relationship between the unemployment rate, percent debt, and GDP. Hamid at al. have recognized the investment climate favorable for implementation of the Industry 4.0 business model (
Hamid et al. 2018).
Conversely, the estimated sign of the explanatory variable, duration of working life, was not consistent with the expected sign. Within the specification of the expected signs of independent variables, a negative correlation between unemployment of age category 55–64 and duration of working life was expected. The estimated relationship showed that if there was a one year increase in the duration of working life, the unemployment of age category 55–64 would also increase by 0.342%.
The manufacturing automation and smart factories, as a part of Industry 4.0, will bring unprecedented levels of efficiency and speed to businesses and manufacturers, accompanied by competency and organizational structure changes and adaptation requests of the workforce across the sectors. The EU improved slightly in the number of science, technology, engineering, and mathematics (STEM) graduates (19.1 graduates per 1000 people aged 20 to 29 years old in 2015, compared to 18.4 in 2013). There were 8.2 million ICT specialists in the EU in 2016, up from 7.3 million three years earlier. Based on the Digital Economy and Society Index (DESI) Report 2018, 43% of Europeans still do not have basic digital skills. This group has been recognized as people with low education levels, on low incomes, as well as the elderly and the retired (
Digital Economy and Society 2018). During the next five to ten years, Industry 4.0 will be embraced by more companies, boosting productivity across all German manufacturing sectors by €90 billion to €150 billion and productivity improvements on conversion costs, which exclude the cost of materials, will range from 15 to 25 percent. Industry 4.0 will also drive revenue growth, a wider variety of increasingly customized products, will drive additional revenue growth of about €30 billion a year, or roughly 1 percent of Germany’s GDP (
Gerbert et al. 2015).
7. Conclusions
Detected inconsistencies led the authors to re-explore the theoretical foundations of the model, which culminated into a specification treatment: the shorter the duration of working life, the lower the probability that the labor force aged from 55 to 64 would be unemployed, as with the shorter duration of working life, older people were expected to retire earlier, which was in turn expected to decrease the unemployment of age class 55–64.
The scatter plot of the unemployment of age category 55–64 and total unemployment clearly indicated positive correlations between these two variables. The various limitations should also be pointed out. The original model was composed of ten independent variables. However, there were many other variables which could eventually cause, or at least influence, the unemployment of age category 55–64. A very crucial independent variable was social benefits for the unemployed. This variable was not included in our model because of the datasets. The sample size consisted of twenty-two member countries of the European Union as the independent variable “the monthly minimum wage” was only included in the mentioned twenty-two countries—there are six countries of the European Union which do not apply a general statutory minimum wage.
Further research should integrate into the model, together with the direct factors of the unemployment of age category 55–64, the results of implementation of Industry 4.0, especially the impact of the five dimensions of the DESI, monitored by the European Commission, namely connectivity, human capital, use of internet service, integration of digital technology, and digital public services. The future of this research lies in the further development of the variables of the senior age category of employment by incorporating a wider array of sources and identifying appropriate weightings for their parameters. The significant role for Industry 4.0’s sustainable employment of the senior workforce will be strategic workforce planning, adaptation of roles, recruiting, and vocational training to prepare the workforce with the additional IT skills that will be required.


