1. Introduction
The topic of where to locate and how to arrange initial refueling stations for alternative fuel vehicles (AFVs) to encourage widespread public adoption has received considerable attention over the past few decades (
Sperling 1990;
Nicholas and Ogden 2006;
Melaina and Bremson 2008). Such efforts are important when considering effective pathways to mitigate growing levels of greenhouse gas emissions from the transportation sector. Increasingly, the AFV refueling station location literature has begun to specifically consider locations along transportation corridors that carry high amounts of passing traffic to support AFV adoption (
Kuby and Lim 2005;
Lin et al. 2008;
Chung and Kwon 2015). In urban areas, this means that station locations near limited-access highways and freeways are of particular interest, as they are conceivably uniquely able to meet refueling demand from long-distance trips passing by them, along with additional local residential and fleet demand (
Kelley 2017). However, little is known about the refueling behavior of early AFV adopters that use publicly-available AFV refueling stations near freeways in urban environments, nor about how they currently perceive, access, and consider other AFV stations in sparse refueling networks.
These are all essential considerations for regional or urban policies and planning strategies that rely, at least in part, on the inclusion of stations near freeways in an arrangement of stations that will encourage the public to consider transitioning to AFVs. Recent increases in sales of battery electric vehicles (BEVs), plug-in hybrid electric vehicles (PHEVs), compressed natural gas (CNG) vehicles, and hydrogen fuel cell vehicles (HFCVs) in the international vehicle fleet, coupled with growth in refueling infrastructure to support these vehicles, have made it more possible to study how early adopters are using such initial refueling infrastructure. Still, AFV refueling infrastructure remains sparse compared to that of vehicles that operate with liquid petroleum fuels. The need to collect empirical data on AFV refueling behavior in these initial infrastructure stages is important for future station location planning strategies that can facilitate a more convenient refueling infrastructure for AFV drivers in areas that currently lack it.
There are a number of existing station location modeling approaches and planning methods that have been constructed to recommend “best” locations for a limited set of stations to be placed across a city or region. All are based on assumptions about refueling behavior, which in turn influence their output recommendations. These differences carry important implications for the role that stations near freeways have in regional station plans. One of these is the flow-based station location modeling approach, first tailored to the problem of optimal AFV station location by
Kuby and Lim (
2005) in the Flow Refueling Location Model (FRLM). This, and the flow-based models that have followed it (e.g.,
MirHassani and Ebrazi 2012;
Capar et al. 2013), maximize the amount of origin-destination flows that can be captured by a set of initial stations in a region, prioritizing refueling demand that passes by key points in a regional road network. This means that locations along highways and freeway in regional networks, particularly those where multiple highways and freeways intersect, are commonly-recommended sites at which to build stations. Other modeling approaches consider placing stations along high-volume commuting corridors that facilitate longer distance trips or intra-city travel (
Sathaye and Kelley 2013;
Hwang et al. 2015;
Ghamami et al. 2016). Another set of models recommends that stations should be placed on highway corridors or busy roadways between activity clusters of likely early adopters (
Ogden and Nicholas 2011;
Brey et al. 2014). In this approach, refueling demand is generally met by stations near home locations of early adopters, while the stations along highways and freeways primarily support longer-distance travel. Some have explicitly tried to simultaneously consider and balance the two general classic contrasting objectives in the station location literature: traffic capture and demand coverage for a station within a certain distance of a home or work location (
Goodchild and Noronha 1987;
Hong and Kuby 2016;
Brey et al. 2016).
To date, though, all modeling approaches that recommend station locations on regional road networks are computed using relatively simple abstractions of those road networks due to the inherent problem structure of spatial optimization methods. As such, when they select locations at which to build stations, the digital representation of the “site” is a zero-dimensional network node. In the case of a flow-based model, for example, this node may represent a location where high-volume roadways intersect (i.e.,
Kuby et al. 2009). For models that operate on abstracted networks of a highway system, an assumption is either explicitly (
Hwang et al. 2015) or implicitly made (
Lin et al. 2008;
MirHassani and Ebrazi 2012;
Capar et al. 2013) that drivers do not leave the highway network to reach a station, and simply refuel when they reach the abstracted node. Drivers, though, cannot generally refuel directly at the center of a major freeway intersection in an urban area, needing to leave limited-access highways and freeways to reach a suitable site that could host a refueling station on nearby local or arterial roads.
These kinds of deviations and considerations required to refuel at a station near a freeway or freeway intersection are not currently accounted for in existing station location models. This is a critical shortcoming in the current applicability of models that recommend stations in these locations, because if drivers cannot easily exit the freeway, reach the station, and return to the freeway for all possible travel directions through a freeway intersection, the amount of refueling demand satisfied by a network node selected for such a station location may be inconsistent with any modeling result (
Kelley 2017). Further, while the time and effort required to leave and re-enter limited-access highways to reach refueling stations near freeways in urban environments may be an important consideration for early AFV adopters, other factors are likely to influence a driver’s willingness to use them. These include: station safety and comfort, an individual’s familiarity with the infrastructure, remaining fuel, fuel costs, range anxiety, congestion, and other factors that have a demonstrated impact on AFV travel and refueling behavior (
Caperello and Kurani 2012;
Carley et al. 2013). Station amenities and facility safety are important considerations for refueling station choice for those driving conventional vehicles along highways (
Wansink and van Ittersum 2004), though such considerations may be different for early adopters of AFVs in urban areas.
Despite their importance to regional station location planning approaches, there is little empirical data on how drivers refuel at these locations. Analysis of gasoline sales at refueling stations, demonstrates that AFV station locations near intersections of residential arterial roads and freeway entrances and exits could be promising (
Nicholas 2010), but drivers who refuel with gasoline are reacting to a well-developed refueling infrastructure where many stations can satisfy refueling demand in a variety of places. Some of the compressed natural gas (CNG) stations at which surveys were conducted in
Kelley and Kuby (
2013) are relatively close to major freeways and freeway intersections in Los Angeles, but that study did not measure how drivers perceived or accessed these stations, nor did it prompt drivers to list other stations they considered.
Additionally, it is also unknown to what degree AFV stations near freeways in urban areas currently serve both local and distant refueling demand at present, which is a metric of interest for station developers, regional planners, and station location modelers alike. Refueling trips are shown to be associated with activities and trip anchors as part of a tour (
Kang and Recker 2014;
Ji et al. 2015), but such an analysis has not yet been focused on how this behavior specifically corresponds to refueling events at stations near freeways. It is possible that nearby activity sites, such as shopping complexes, are frequently coupled with a refueling event when a driver needs to exit a freeway to refuel at a station while on an inter-urban trip. However, early AFV adopters may also be either willing or required to exit a freeway, refuel, and then return to the freeway with no other stop in the vicinity of the station before continuing their trip to an eventual destination.
It is also unknown what other stations these drivers consider, and to what extent those stations spatially correspond with a driver’s home location, refueling trip, or are either close to or far from freeway locations. There is a limited amount of literature on this topic, especially in the AFV refueling literature. When asking drivers to list all gasoline stations that they consider for refueling purposes,
Plummer et al. (
1998) found that stations along high-traffic arterial roads were prominent in drivers’ choice sets, and that while some also considered the station nearest their home, not all did. It is unknown to what extent early AFV adopters who do refuel near freeways also consider stations near their home locations, and to what extent such stations are reasonably close to their home location. That study also occurred in a relatively small city in Minnesota, and it is unknown if this would also be the case in an area where a high amount of travel is conducted along highways and freeways instead of only arterial roadways. While this suggests that stations near major arterials are important,
Plummer et al. (
1998) did not explore to what extent those refueling at such stations did or did not consider the station nearest their home, nor to what extent stations were available near their home location. It also did not explicitly evaluate other stations that may have also been convenient to observed refueling trips. It is possible that early AFV adopters who do refuel at stations near freeways also consider the station nearest to their home, or others convenient to their refueling trip. This study, then, includes an exploratory analysis of the revealed spatial proximity of other stations that early AFV adopters consider relative to their home and an observed refueling trip. Specifically, the focus is on how these correspond to observed refueling trip types. It does not generate and evaluate a full choice set of stations that these drivers consider, which are known to be latent (
Ben-akiva and Boccara 1985), though spatial considerations are important for generating choice sets (
Pagliara and Timmermans 2009). Instead, in this study, these spatial relationships are incorporated into an analysis that determines to what extent the proximity and consideration of some stations relative to home locations or the refueling trip have on certain refueling trip behaviors.
Given the need to understand the nature of refueling behavior of early AFV adopters at stations near freeways, the unknown variability in the ways that early AFV adopters refuel their vehicles at and perceive stations near freeways, and the importance of such data to the inclusion of these stations in developing AFV infrastructure planning methods, this paper addresses the following research questions: How do early adopters of CNG vehicles use, perceive, and consider refueling stations near freeways in the greater Los Angeles metropolitan area? What is the distribution of refueling trips drivers conduct when using these stations relative to freeway use and local trip activity sites? Finally, how do other stations considered by the driver, if any, spatially correspond to a driver’s home location and the observed refueling trip? Following these sections, this paper then specifies two logistic regression models that examine the factors that make drivers more or less likely to refuel at AFV refueling stations near busy freeways without making another nearby stop. These carry important implications for understanding the role that such stations serve in initial regional AFV infrastructure plans.
2. Data and Methods
2.1. Study Area and CNG Stations
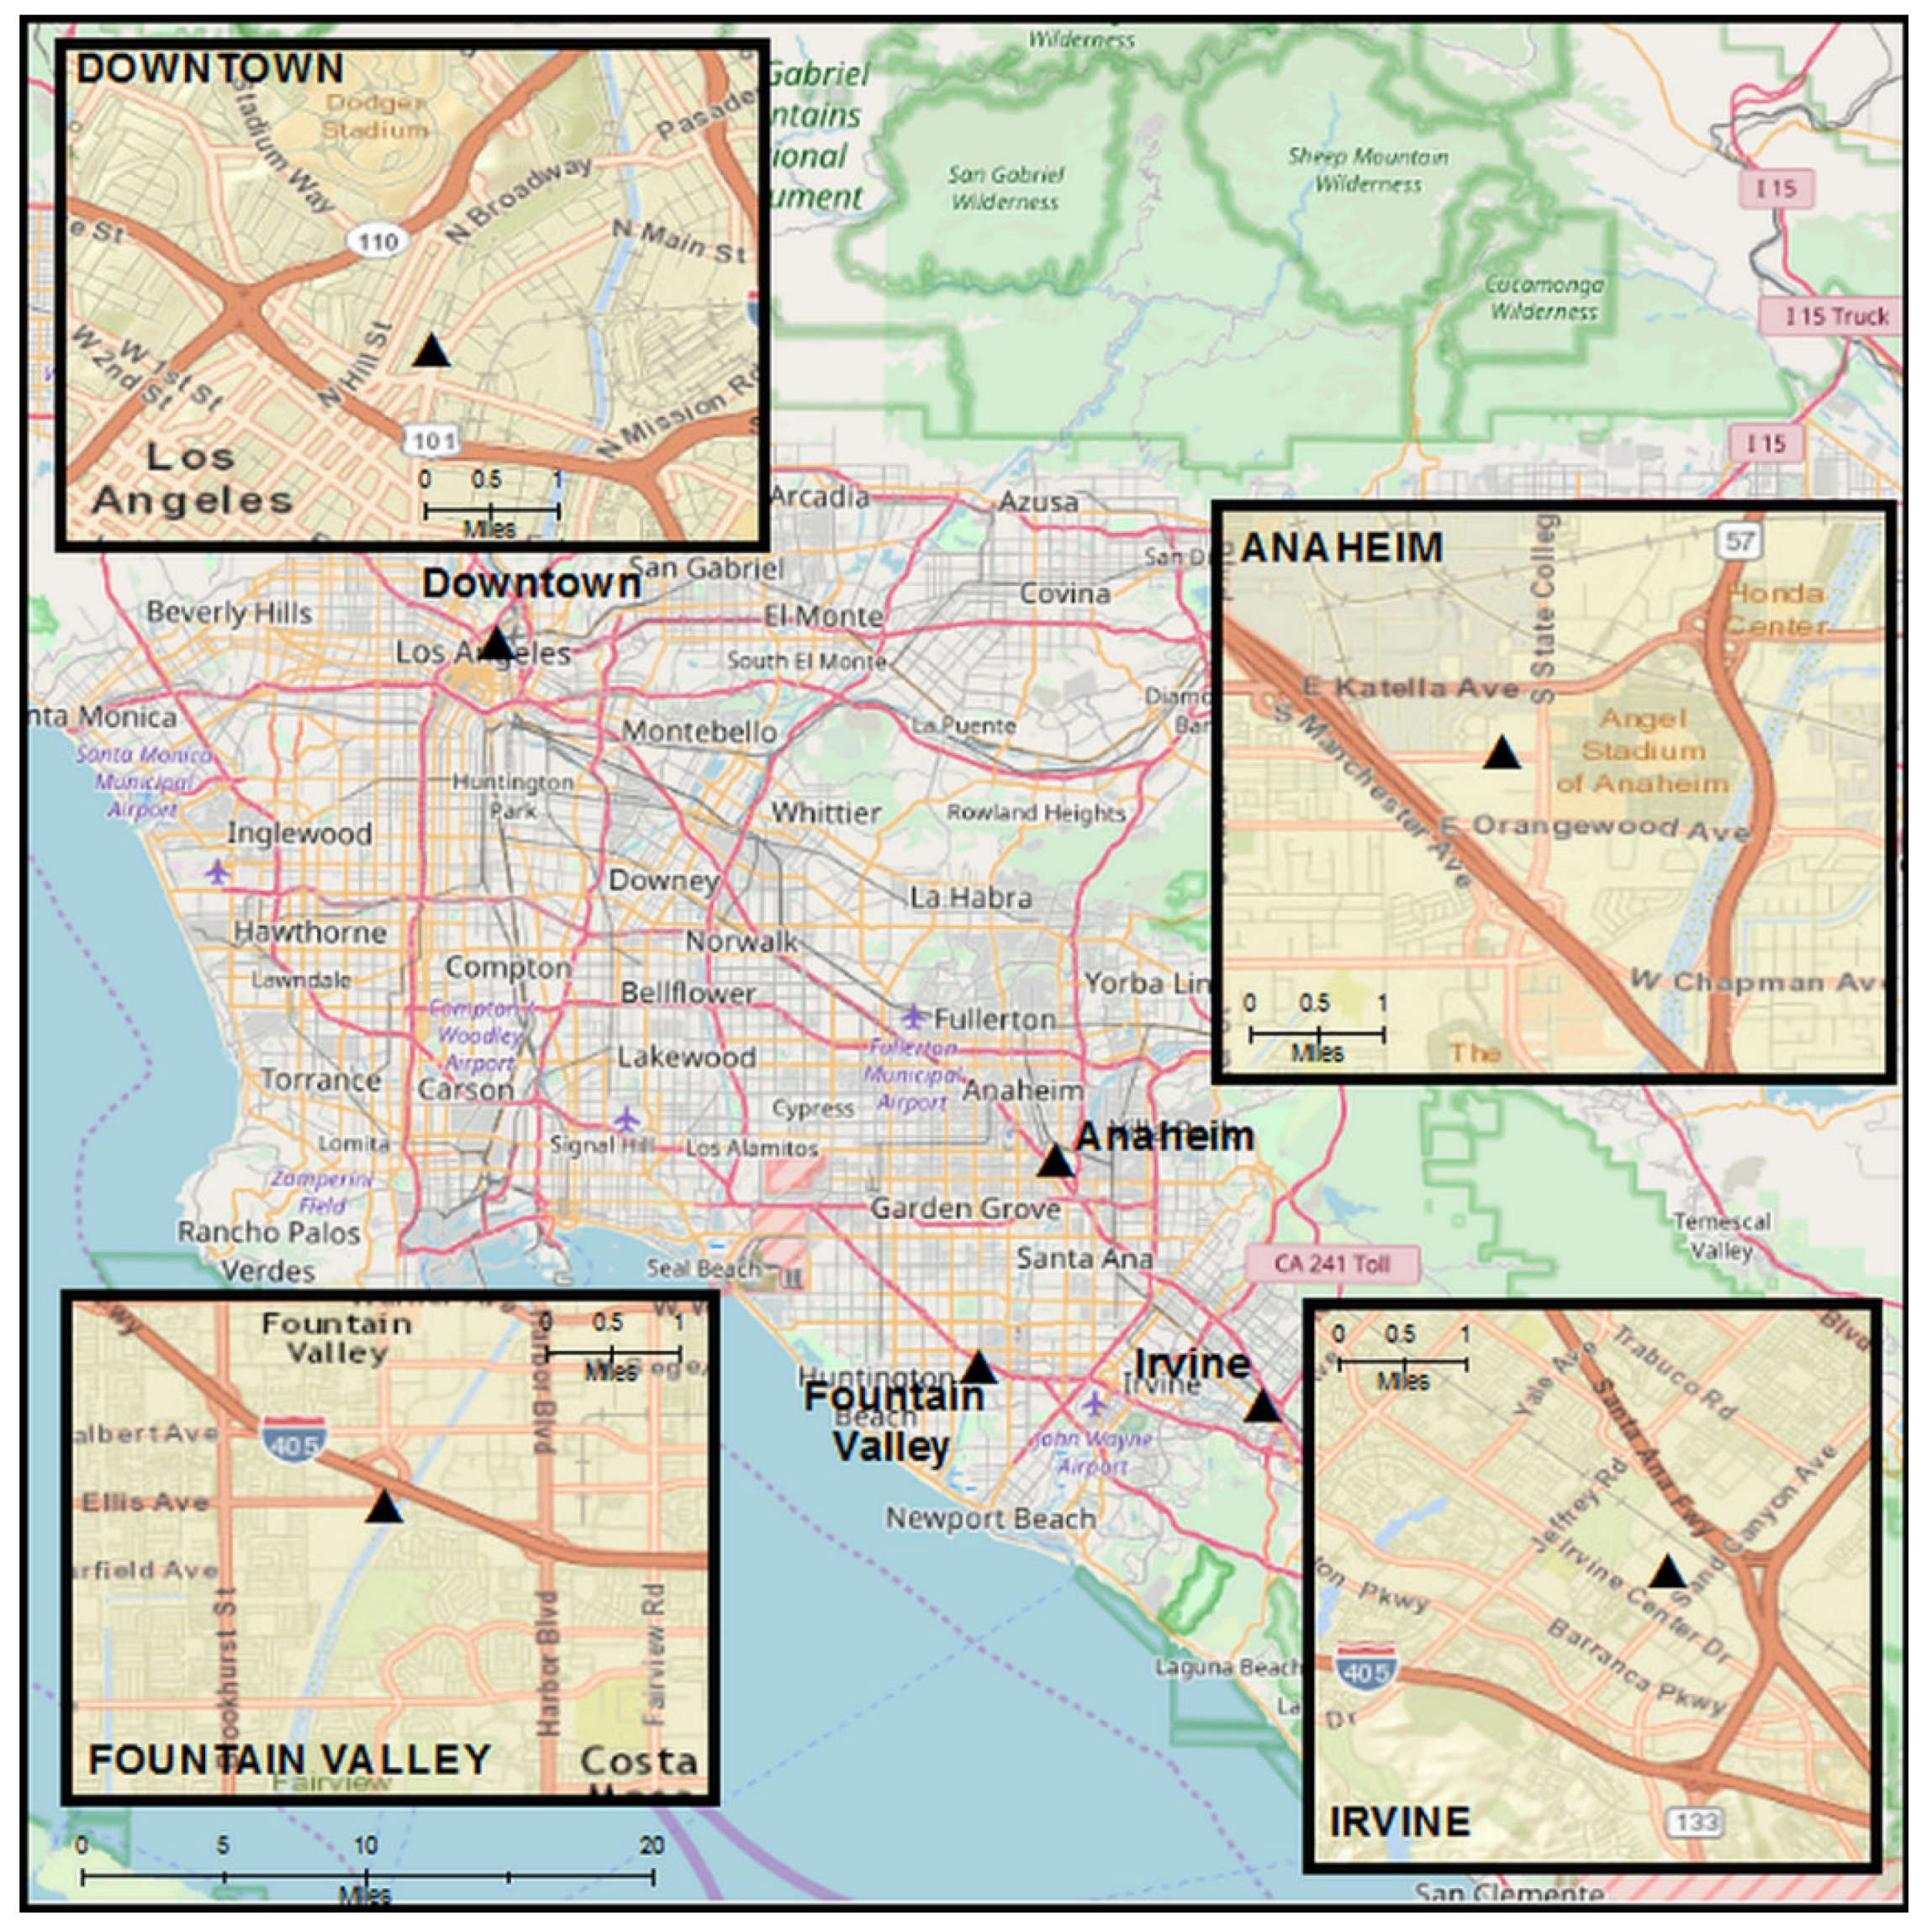
With permission from and coordination with Clean Energy Fuels and the Southern California Gas Company, both of which operated the majority of public CNG refueling stations in the greater Los Angeles area at the time of the study, an intercept survey was conducted in August 2014 at four different CNG stations near freeways in the metropolitan area (
Figure 1). CNG stations and drivers were the target population because the Los Angeles area had a relatively robust network of 72 stations open to the public for refueling at the time of the study. In this study, drivers of personally-owned CNG vehicles were interviewed by the author while they refueled their vehicles at a public CNG station. Fleet vehicles were not considered in this analysis. Unlike electric vehicles, CNG drivers at the time of the study were nearly completely reliant on a public refueling infrastructure to meet their refueling needs. These vehicles could be refueled in similar times to standard gasoline or diesel vehicles. This means that results from this study are more applicable to AFV refueling infrastructure recommendations that rely on public stations where refueling time is similar to that of a present-day gasoline or diesel vehicle, such as other CNG refueling networks, or those for HFCVs or liquid biofuels.
Stations at which surveys were collected were part of the network of 72 CNG stations open and available to the public at the time of the study, and were among the closest to freeway entrances and exits in the region. Interviews were conducted at stations in Downtown, Irvine, Fountain Valley, and Anaheim. Aside from being near major freeways, each station is also surrounded by a mixture of land use types, including office parks, industrial centers, retail outlets, and residential areas. The stations at Downtown, Fountain Valley, and Irvine were operated by Clean Energy Fuels, and the Anaheim station by Trillium and the Southern California Gas Company.
None of the stations offered similar amenities to modern gasoline refueling stations, and three of the stations shared space with larger civic or private complexes. The Irvine station is on the property of the City of Irvine’s government headquarters. The Anaheim station is in the parking lot of a Southern California Gas Company office complex, and the Fountain Valley station is part of the Orange County Sanitation District’s complex. In contrast, the Downtown station is a small, dedicated CNG refueling facility that is not co-located with another company base. All operated 24 h per day at the time of the study, and there were no station attendants or company personnel regularly on-site. Signage immediately surrounding the stations was sparse, and only the downtown station was readily visible from the road level upon entering the larger complex.
2.2. Survey Instrument
Surveys were conducted while drivers refueled their CNG vehicles at these locations, and each survey took about two minutes to complete. They were collected between the hours of 8 a.m. and 6 p.m. on weekdays, and two days each were dedicated to collecting surveys at each station, as part of the agreement with the station operators. Survey collection was stratified by time of day to control for differing commuting patterns or willingness to use the station at different times of day. After gathering some basic information about the time of day, vehicles owned by the respondent, and whether they had home CNG refueling, the first primary set of questions gathered spatial data. For these questions, drivers reported approximate stops before and after the refueling station, the trip purposes of those stops (home, work, shopping, social/recreational, school, or other) and their approximate home locations. Drivers reported approximate stops by indicating the closest major cross streets to each indicated location. These locations were then stored as point locations in a GIS environment, and were later used to estimate shortest-path travel routes, and shortest-path travel routes that also included a stop at the refueling station. To keep the focus on the observed refueling trip, the survey did not collect information about other travel behavior outside of the refueling trip, such as common travel destinations or common travel routes that the driver used. If applicable, drivers were asked to provide freeway exits used to reach the station and freeway entrances that they planned to use to continue their trip either immediately before or after the refueling event, or both. Drivers were then prompted to respond to a series of statements regarding how drivers perceived the convenience of the station’s location relative to the driver’s previous and next stops, its proximity to both the driver’s home and work locations, its accessibility from the freeway, visibility from the freeway, safety of the facility, and whether congestion impacted the choice to refuel here. Responses were recorded on a Likert scale of responses (1 = Strongly Agree to 5 = Strongly Disagree). These considerations likely contained some individual heterogeneity, but do provide some indications of how an early AFV adopter sample considers initial stations near freeways. Drivers then stated how often they refueled at this station and how they found the station the first time they refueled here. The full survey instrument is included as a
Supplementary Materials.
2.3. Route Generation, Proximity to Home, and Proximity to Other Considered Stations
The survey prompted drivers to indicate other stations that they refueled at or considered in addition to the survey site. For drivers that refueled less than 40% of the time at the station, they were asked to indicate their primary other refueling station. All drivers, though, were asked to list all other stations they refueled at or considered. Using a feature class provided by the Alternative Fuels Data Center created in October 2014 (
AFDC 2014), these stated other station locations could also be stored in a GIS environment. Here, these point data could be used to assess their relationship to (1) a driver’s home location; (2) the driver’s estimated refueling trip route; and (3) the station’s proximity to other limited-access highways and freeways.
First, the rank-order position of the refueling station and other stations considered out of all 72 publically-available CNG stations at the time of the study relative to a driver’s home location is established. This was assessed by generating shortest path travel routes between each respondent’s home location and all 72 stations using a detailed street network dataset of Southern California in ArcGIS’s Network Analyst. This identified if a driver either refueled at the closest station to home or considered it, but there is likely a high degree of heterogeneity in how close the closest station to home is across respondents across the region, given the sparse nature of the refueling structure. To standardize the proximity to home for this study, a network travel distance of six minutes is used as a critical threshold, which is the point at which CNG drivers in Los Angeles exhibit decay in their willingness to deviate on refueling trips (
Kelley and Kuby 2013). This deviation threshold, then, is the key metric in establishing both the spatial proximity of the survey site refueling station and other considered stations to both a drivers’ home location and the observed refueling route. To establish a station’s proximity to home locations, service area polygons are generated around home locations provided by a respondent in the GIS environment using ArcGIS’s Network Analyst, which identifies locations reachable on the network within six minutes of travel time from all home locations. Stations within those service areas are recorded, along with whether the driver considered them.
Next, the observed refueling route is generated using ArcGIS’s Network Analyst. Route length and travel times were calculated by generating a shortest path route using the previous and next stops provided by the respondents. Both trip length and travel time were stored as attributes along each network segment. These stops, stored as point data in the GIS environment, represented the route’s origin and destination, respectively. First, a shortest path route was generated between the previous stop and the next stop indicated by the respondents. Then, the station at which the survey was conducted is included as an intermediary stop, and a new route was created that represented the shortest path that left from the previous stop, went to the station, and then finished at the respondent-provided next stop. This helped to isolate the refueling trip, which was of primary interest to this study. The difference in travel time between the shortest path and the shortest path that included the station is the refueling route’s deviation.
Next, the other 71 CNG stations in the region are entered as intermediary stops between each driver’s given previous and next stops, creating 71 other routes that represented all possible routes that included a refueling station in the region. The travel time for each of these 71 routes is compared to the shortest travel path time between each given previous and next stop and the observed refueling route. This helps to determine the rank-order position of the refueling station at which the survey was conducted and other stations the driver considered relative to the route that minimized deviation for that refueling trip. These outputs are also used to determine if the survey station was reached within the critical six-minute deviation threshold. It also identifies if others were for the refueling route as well, which is also compared to the list of other stations that drivers indicated.
2.4. Freeway Trip Type Classifications
After refueling routes for each respondent were generated, the use of freeways relative to the station was determined in two steps. The first was to generate an estimated route for each driver who refueled at one of these stations, using the previous stop and next stop locations provided by the respondent, with the station as an intermediary stop. Each route was compared against estimated freeway use and freeway access points used to reach the station, if applicable. The second step involved comparing the estimated routes with the stated freeway entrances and exits provided by the drivers in the survey to check for consistency. In all cases, the freeway entrances and exits provided by the estimated routes created using the Network Analyst extension in ArcGIS matched those of the entrances and exits provided by respondents. Refueling travel paths that included freeway travel and station access are categorized as follows, with examples of each shown in
Figure 2:
Two freeway refueling trip. A driver leaves from their previous stop and travels along the freeway until they need to refuel. They exit the freeway and enter a local street network to reach a refueling station. After refueling, the driver returns to the freeway to reach their next stop without stopping at any other location near the station between the time they exited the freeway system and returned to it (
Figure 2a).
One freeway refueling trip, Version 1. A driver leaves their previous stop and enters the freeway network, exiting the freeway to reach a refueling station. After refueling, they do not immediately return to a freeway, instead traveling on local roads to reach their next stop nearby (
Figure 2b).
One freeway refueling trip, Version 2. A driver’s previous stop is located on a local street network near the station, which the driver traveled on to reach the refueling station. After refueling, the driver enters the freeway system to reach their next stop (
Figure 2b, with origin and destination reversed).
No freeway refueling trip. The previous stop, refueling station, and next stop are all on a local street network, and no freeway travel occurred relative to the refueling event (
Figure 2c).
Drivers who refueled on two freeway refueling trips (
Figure 2a) represent an interesting and important case when considering access and use of initial AFV stations in urban areas. Compared to the other refueling trip types, these drivers unambiguously left and returned to the freeway network in the middle of a trip to reach a refueling station for that purpose alone, while the other forms of refueling behavior relative to the freeway could conceivably include other objectives of which refueling may have been only a part. High observed levels of two freeway refueling trips would also indicate that station planning strategies and station location models that favor sites near major freeways could assume that, in urban areas, drivers will not always require other nearby trip activity locations to consider leaving a high-volume freeway to refuel before continuing to the destination. Since there are also no other amenities co-located with these stations, such as convenience stores or automotive repair shops, these factors are not assumed to influence a driver’s observed willingness to refuel at these stations.
For these reasons, drivers who refueled on two freeway refueling trips were isolated and compared against those who refueled otherwise, including drivers who did not use freeways to access the station and those that did so on only one segment of their trip relative to the station. Next, the volume of establishments, which represent possible trip activity sites near each station, was considered. A station located in an area where there simply are few nearby trip attractors may be more likely to capture two freeway refueling traffic than a station in an establishment-rich area. It is hypothesized that a relatively high volume of establishments near a station will represent an opportunity to combine trip purposes in addition to the refueling event, and will influence a driver’s willingness to refuel on a two freeway trip. To account for this, all establishments within one mile of each CNG station at the time of the study were included (
ReferenceUSA 2014).
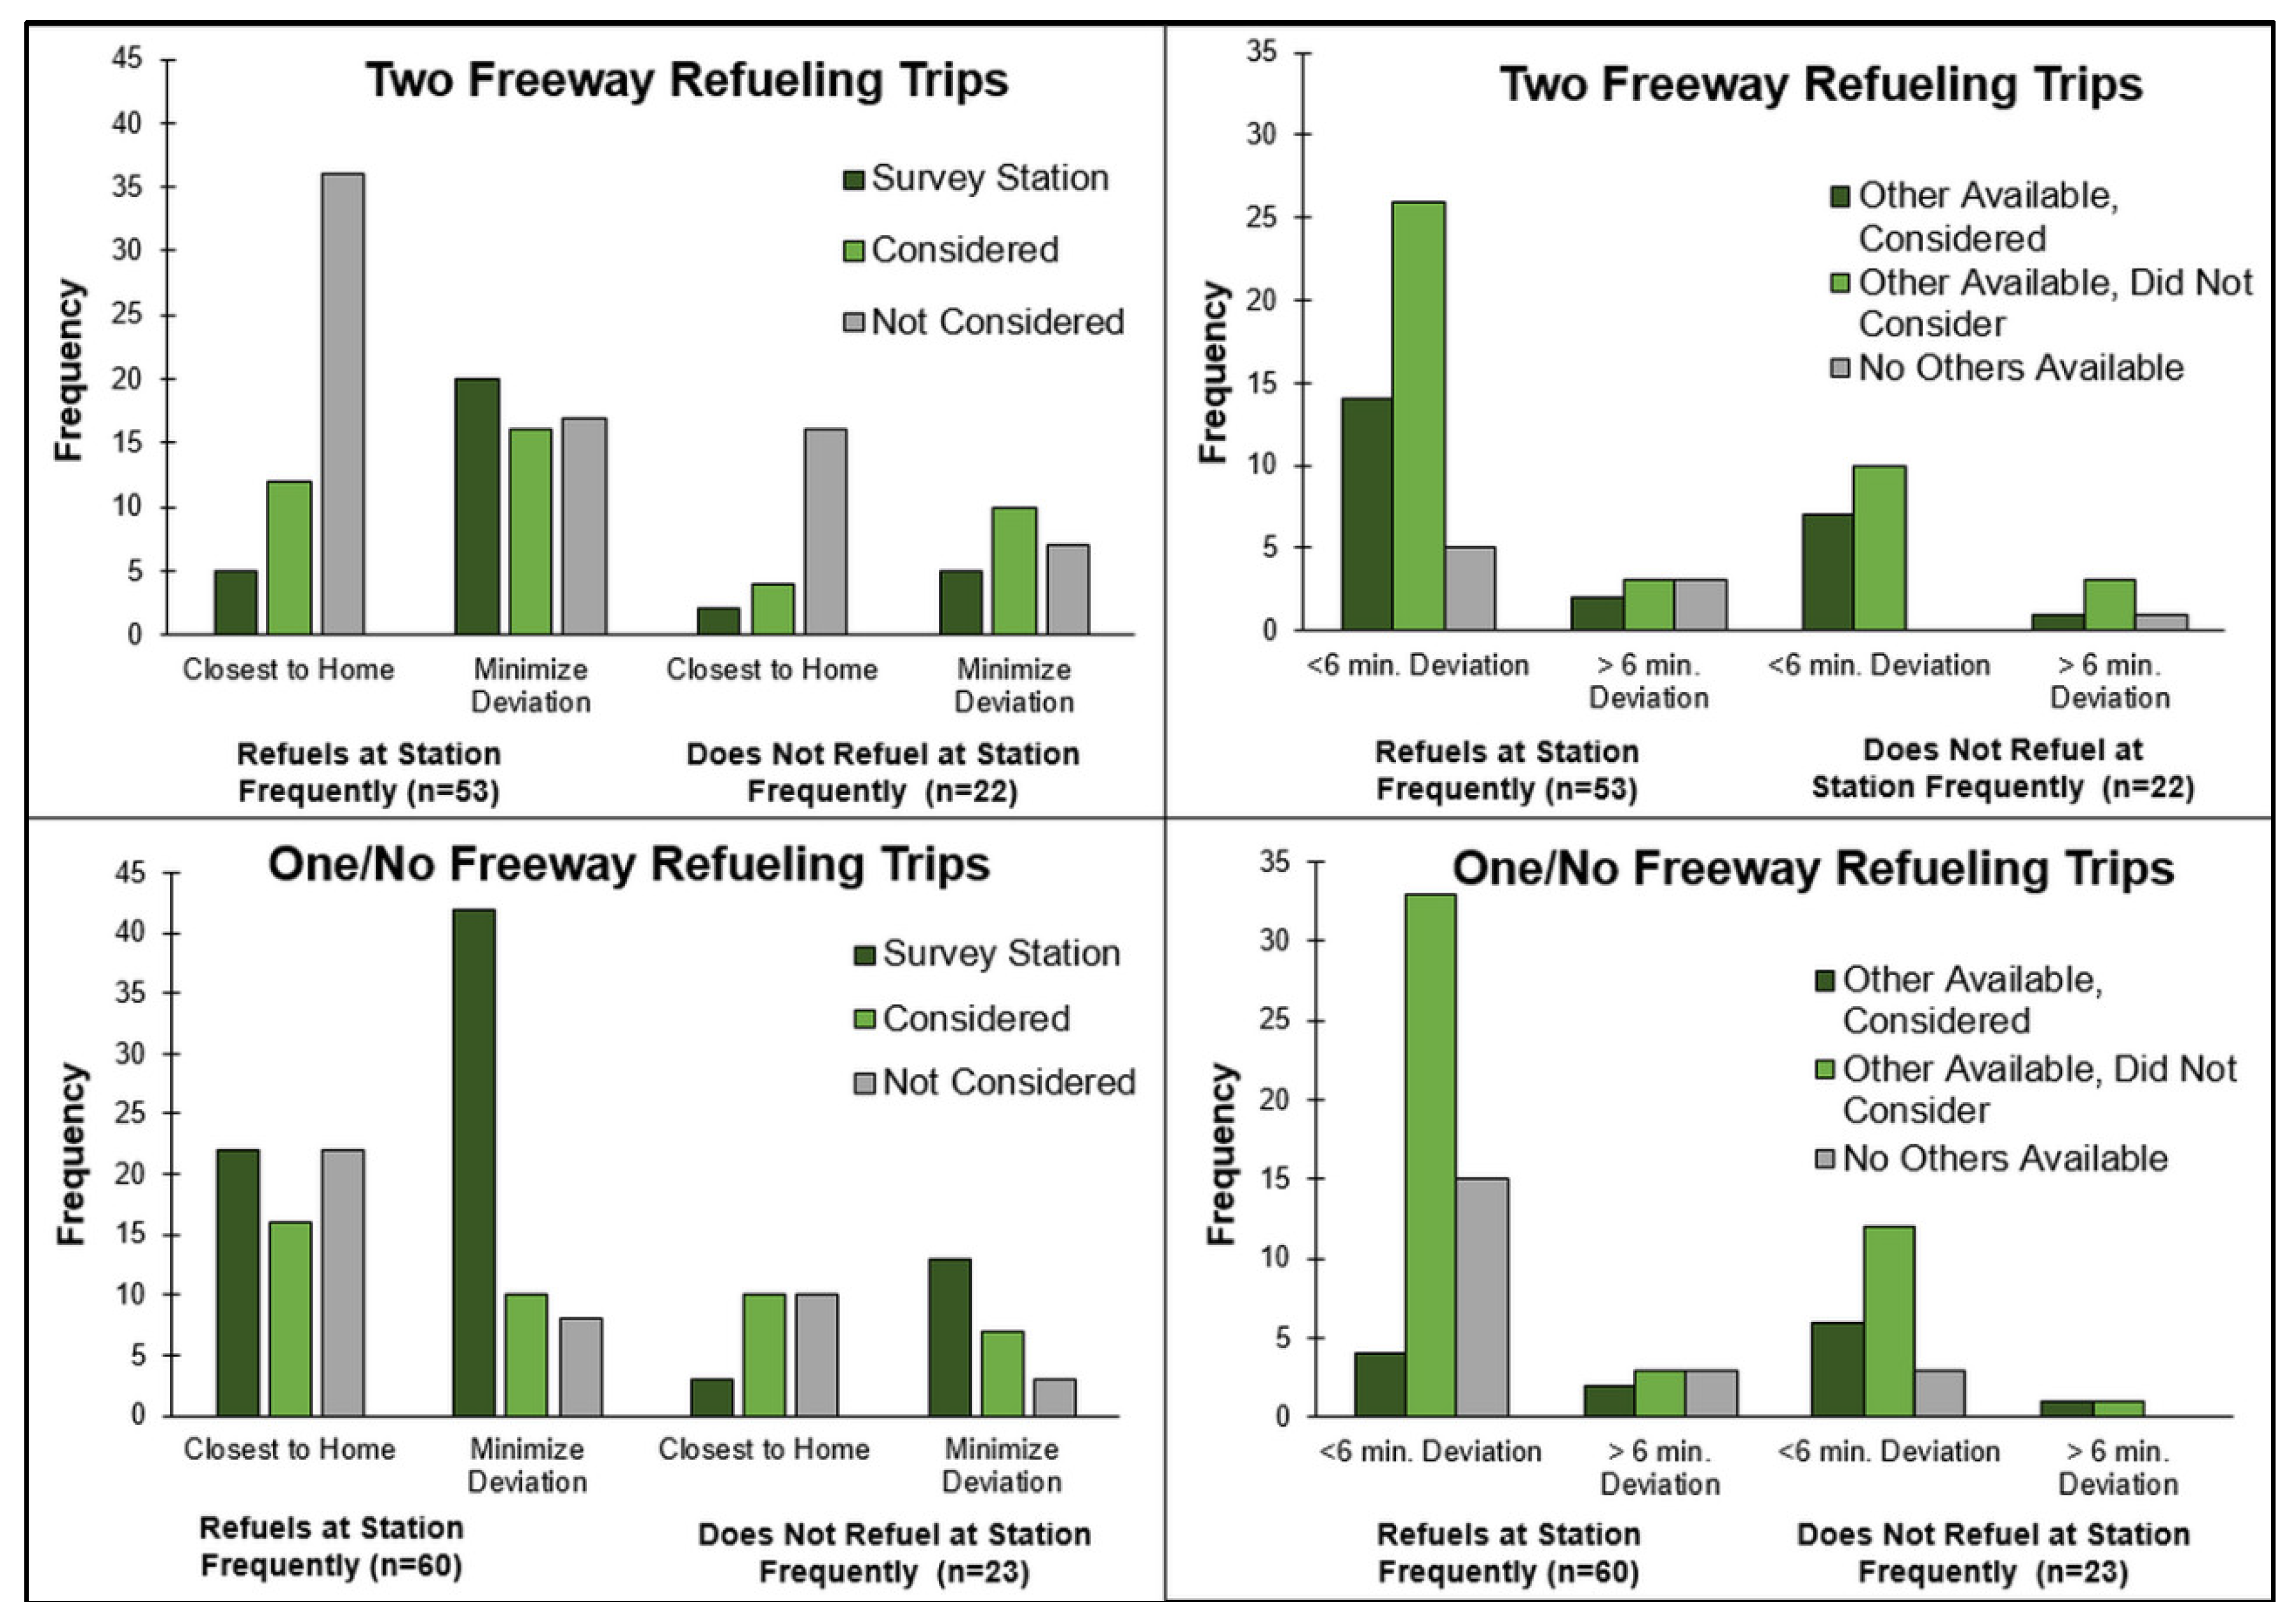
Descriptive statistics are first computed for drivers who refueled according to the freeway refueling trip classifications, along with the distribution of these observed refueling trip types across stations. Then, the locations of other stations noted by drivers were recorded, and these stations’ proximities to a driver’s home, estimated shortest path route that included the refueling station, and proximities to other freeways were recorded. Next, two binary logistic regression models are specified where the observation of a two freeway refueling trip or not is entered as the dependent variable. This modeling framework specifically considers the variation in station access relative to freeways when refueling at initial AFV stations in urban areas as the observed discrete choice of interest. It holds the driver’s choice of refueling at a station near a freeway consistent between all respondents, focusing on predicting the influences of refueling trip characteristics.
4. Discussion
The distribution of observed refueling trips relative to freeway use suggests that these CNG stations help to facilitate distant and disparate travel in the greater Los Angeles area in addition to local refueling demand, and that there are notable differences in trip, driver, and spatial proximity of the survey station or other considered stations relative to the driver’s home location and observed refueling trip. This sample and observation may not be representative, though, of eventual widespread use of AFVs and infrastructure elsewhere. It also is only representative of those drivers who refuel at CNG stations near freeways in Los Angeles, not of all CNG drivers in the region. CNG drivers in Los Angeles are likely to be more conditioned to and accepting of freeway travel than others, especially in a region where CNG drivers could use the HOV lane as a single occupant driver at the time of the study. They also may have chosen to refuel in the manner that they did simply because they were reacting to the set of stations available. It is important to note that the majority of publically-available CNG stations in Southern California were constructed to primarily serve refueling demand for commercial fleets, and while personal vehicle drivers use these stations, the spatial arrangement of stations and the way in which drivers access them could differ if primarily constructed to facilitate personal vehicle adoption and use.
The finding that congestion does not generally dissuade use of these stations, some of which are near notoriously slow-moving freeways, should be tempered somewhat since drivers of these vehicles were granted HOV lane access at the time of the study. Further, the term “congestion” often elicited a reaction from survey respondents outside the presence of heavy traffic volumes on the nearby freeways. Some respondents indicated that congestion at a station was a much larger factor in their refueling behavior than congestion along the freeway, and incorporating this factor would be of interest to future studies. Light-duty vehicle owners frequently expressed frustration upon arriving at stations and seeing heavy-duty fleet vehicles, such as buses and waste collection vehicles, refueling, since those refueling events could last up to 15 min. In fact, some surveys were completed by drivers while they were waiting for their turn to refuel behind such a vehicle. All stations featured pumps that could fill at either 3000 or 3600 psi, but some vehicles could only refuel using one of those pressure levels, further limiting the amount of “open” pumps available to drivers upon arrival at the station. With the limited number of CNG stations available in the region, drivers either had to wait for other vehicles to refuel, or proceed to another station if enough fuel remained in the driver’s tank. This interaction between heavy-duty vehicles and light-duty vehicles sharing a limited number of pumps at a small refueling facility is an interesting factor in refueling choice and was not considered in this study.
Station reliability was also frequently mentioned by drivers as a consideration that influenced station choice. If a particular station garnered a reputation of being unreliable or not filling tanks to near capacity, it may have impacted drivers’ willingness to consider it. Therefore, drivers may have chosen these stations and accessed them in the manner they did because they were more reliable than another that might have been perceived as more convenient or desirable. During the study period, some stations across the area had intermittent availability due to hardware failure, leaks, and other routine maintenance, although these four did not have such issues on the survey dates. With no attendant on-site, stations could potentially be unavailable for hours if such an issue were encountered. This could cause drivers to avoid that location not just at the time of repair, but could also jeopardize its future consideration if the station frequently malfunctioned. Since some survey respondents were active in online CNG communities that facilitate sharing of station conditions each day, willingness to consider certain stations during the time period of the survey could have been influenced by some of these reports.
This study also found that spatial correspondence of a station relative to a home location or an observed refueling trip differed in important ways between those who refueled with at least one nearby activity site and those who did not. The survey, though, did not ask drivers which stations they excluded from consideration and why, which could have provided insights into the types of facilities that early adopters systematically avoid, and might elicit some useful recommendations that would not emerge otherwise. Similarly, this study also did not ask drivers why they did indicate certain other stations. Listed stations were simply compared to a driver’s home location or the observed refueling route, though it is possible that drivers chose to indicate those stations were options for them for reasons aside from spatial proximity to home or a refueling route. Finally, including questions about respondents’ attitudes and perceptions about refueling stations or the refueling infrastructure in general would be helpful for future analysis. Additionally, sociodemographic and socioeconomic data of the drivers were not collected in this study, and some of these factors could have impacted a respondent’s willingness to consider other stations in relatively poorer or wealthier parts of the city, or to exhibit refueling trip type choice with respect to freeway use. The combination of these data would be valuable for future analysis in understanding refueling station choice in the region. Methodologically, it would help to generate robust choice sets for CNG drivers in the region, addressing some of the well-known presence of latency in individual choice sets, which this study did not conduct. From a policy standpoint, it could help station developers gain a better understanding of the types of locations that early AFV adopters prefer or avoid for future refueling stations. Such considerations would be useful to future analysis of driver and refueling behavior in a sparse AFV refueling infrastructure.
5. Conclusions
This study contributes an initial understanding of how early adopters of personally-owned CNG vehicles use, perceive, and consider AFV refueling stations when they are observed to refuel at stations near busy freeways in urban areas in a relatively sparse refueling station infrastructure. With the exception of the Downtown station, these stations are shown to attract a consistent balance of local and distant refueling demand that includes a high percentage of refueling trips that leave the freeway, reach the station, and return to the freeway with no other local stops on intra-urban trips. Additionally, the aggregate observed coverage of refueling trips at the four stations includes demand from across the majority of the Los Angeles metropolitan area. Outside of downtown station locations, the high observed level of two freeway refueling trip use may indicate that station developers do not need to co-locate stations near shopping complexes, office parks, or other major trip attractors for drivers to use them in an initial AFV refueling infrastructure. This observed behavior, though, may be unique to fast-fueling AFVs, such as CNG or HFCV adopters, as electric vehicle adopters may favor recharging sites with a greater number and variety of trip purposes. This warrants future attention in other geographic areas, particularly those that are not as polycentric as greater Los Angeles.
Of importance to future AFV station location plans, two freeway refueling trip drivers exhibited three key behaviors that should be addressed and incorporated in future station planning methods: (1) they largely did not consider the station closest to home for refueling purposes, though for many, there was not a station in relatively close proximity to their home; (2) they refueled at the station along their estimated shortest possible refueling path at a lower rate than those with at least one stop near the station; and (3) they refueled on longer trips and did so when their refueling tanks were at or below a quarter full more often than those with a nearby stop. While the third point is not especially surprising given the nature of the trips, the first two points signal a kind of refueling behavior that does not neatly align with the assumptions made in existing station planning methods that prioritize proximity to home or proximity to shortest path travel routes, and warrants further attention and integration in future station location planning.
Across respondents, drivers considered these stations to be safe, convenient, and accessible locations at which to refuel, and this was the case for drivers accessing stations both on local and distant trips. These findings mean that station developers may not have to be concerned with building initial AFV stations for a region near complex freeway interchange areas out of fear that drivers will avoid them. Station developers, location modelers, and regional planners interested in encouraging widespread regional adoption of AFVs that require refueling away from home should strongly consider constructing initial stations near freeways within an urban area. These stations can serve nearby residential and fleet refueling demand and refueling demand for drivers on shorter trips coupled with non-home or work activity, while also serving as convenient and effective refueling sites for those traveling from disparate and distant areas of the city that are passing by that are largely commuting trips.
The consistency of refueling trip type distributions across the Irvine, Anaheim, and Fountain Valley stations should be compared against stations near freeways in other urban areas in future studies, along with the dissimilarity of a station in a large city’s central business district. If this consistency is observed elsewhere, it would mean that station developers, location modelers, and regional planners would have a reasonable approximation of the balance of both local and distant trips made by people accessing stations proposed to be built in these locations that are vital to early AFV adoption. As public refueling infrastructure continues to grow for AFVs, perceptions relative to convenience, accessibility, and safety may evolve, and drivers could alter their use and perceptions of stations near freeways over time. These factors should be continued to be monitored for those accessing refueling stations in urban areas where stations for fast-fueling AFVs are considered to be an essential part of the infrastructure.


