An Analysis of Revenue and Expenses for Providers of Intellectual Disability Supports and Services

Research & Evaluation Institute at Woods Services, Langhorne, PA19047, USA
Soc. Sci. 2017, 6(4), 128; https://doi.org/10.3390/socsci6040128
Submission received: 13 September 2017
/
Revised: 10 October 2017
/
Accepted: 19 October 2017
/
Published: 27 October 2017
Abstract
:The 990 tax forms submitted by Pennsylvania intellectual disability providers were analyzed in an effort to quantify the fiscal health of the providers in this business segment. Tax forms from 2012, 2013, and 2014 from 85 agencies were studied. In each of the tax years and overall across the three periods, roughly one-third of the provider agencies had expenses that exceeded revenue. Despite this negative finding, net assets continued to increase.
1. Introduction
Government agencies have grown comfortable with a systematic underfunding of social services (Oss 2015). Oss suggested that this has been caused partly by governmental agencies not understanding the true costs of running businesses and partly by the willingness of social service agencies to subsidize the delivery of social services through donations, fundraising and other mechanisms. Oss (2015) went on to characterize the current funding of social services as being based on the questionable assumption that donations and charitable contributions will continue as a significant form of support.
The California Association of Regional Center Agencies (2015) described a pattern of underfunding that was thought to jeopardize the continued operation of the intellectual disability system. In New Jersey, a study by the ABCDNJ (ABCD New Jersey) provider organization revealed that from 2002 to 2012, the consumer price index (CPI) increased by 27.64%, roughly 2.5% per year. In marked contrast, the cost of living increases for community intellectual disability providers totaled only 7.6% over that same period. Clearly, the providers were losing buying power over this decade. In New York City, FEGS, a non-profit program supporting people with disabilities, announced on February 8, 2015 that it had a $20 million shortfall and would be closing programs. It had reportedly counted on government funding that did not arrive. FEGS filed for bankruptcy citing multiple causes, including the failure of funding agencies to cover the full cost of providing contracted services (Hrywna 2015). Advocates and intellectual disability providers in Pennsylvania have long been complaining that a systematic pattern of underfunding has jeopardized the welfare of their industry (Mercado 2015). The existence of a long waiting list for intellectual disability services is indicative of the magnitude of underfunding. In Pennsylvania, the waiting list is reported to be 13,597, including some 4908 individuals in need of emergency services (Pennsylvania Waiting List Campaign 2017).
Perhaps the most dramatic illustration of systematic underfunding of social services is in a recent longitudinal study completed by PAR, a Pennsylvania organization comprised primarily of agencies that provide supports and services to individuals who have an intellectual disability and/or autism. This study (Walker 2015) reviewed Pennsylvania funding trends from FY93–94 to FY2013–2014, noting that while the general state budget increased by about 90% over that time, funding for intellectual disability services increased by only 23–24%. This represents only a little over a 1% per year increase, while an increased number of individuals were receiving services and supports. While it is tempting to point the finger of blame at members of the executive branch, it is clear that at least in Pennsylvania, the legislature has not taken care of those whom former Pennsylvania Governor Corbett called “our most vulnerable citizens.” Walker’s data are summarized in Figure 1, with cumulative growth in spending plotted over time.
Despite the alleged underfunding of intellectual disability services, the Pennsylvania Office of Developmental Programs notes that providers are not failing, and that more has in fact been put into the system. The purpose of this study was to attempt to provide a cursory assessment of the fiscal health of non-profit organizations operating primarily in the intellectual disability field in Pennsylvania. Three specific questions are addressed: (1) Are agencies losing money? (2) Are net assets being maintained? (3) Is more funding entering the system?
2. Methods
2.1. Participants
The participants in this study were 86 provider agencies that were members of PAR in 2016. We note that several of the PAR members ran multiple businesses and filed multiple 990 tax forms. For the purposes of this study, each separate 990 was treated as a separate business. PAR is a Pennsylvania association that seeks to promote the welfare of agencies offering supports and services to individuals who have an intellectual disability and/or autism. This sample of 86 providers constitutes approximately 74% of the PAR membership. Inclusion was based solely on the availability of 990 Tax forms for 2012, 2013, and 2014 listed in Guidestar.
The discrepancy between the membership total and the sample would appear to be the function of a number of factors. Some PAR members are for-profit organizations, and as such, are not required to file 990 tax forms. Some agencies may file under different names than that with which they identify themselves as PAR members. Large national companies such as the Salvation Army and Catholic Charities may include the PAR affiliates in with the parent organization filing.
It should be noted that while all agencies provide supports and services in intellectual disability and autism areas, these are not the sole businesses of all of the providers. One must also note that a variety of funding streams, not only waivered group homes, fund these operations. Further, one must note that the net assets referenced in the 990 tax forms are not entirely derived from funds paid by the Pennsylvania Office of Developmental Programs and should not necessarily be expected to subsidize programs partially funded by the Office of Developmental Programs.
2.2. Data Collection
Guidestar was used to access the 2012, 2013, and 2014 990 tax forms for each member of PAR. From this tax form, the following information was copied: annual revenue, annual expenses, and annual net assets. We note that the 990 tax forms obtained from Guidestar are publicly available existing data, and that Institutional Review Board approval for protection of human subjects is not needed for analysis of publicly available existing data (United States Department of Health and Human Services 2009).
2.3. Data Analysis
The resultant data were entered into the Statistical Package for the Social Sciences (SPSS) for analysis. The analysis consisted of descriptive statistics regarding revenue, expenses, and net assets. The margin (sometimes called the net income) was calculated by subtracting expenses from revenue for each year for all of the study participants.
3. Results
The results section is structured in a manner consistent with the three specific questions.
3.1. Are Agencies Losing Money?
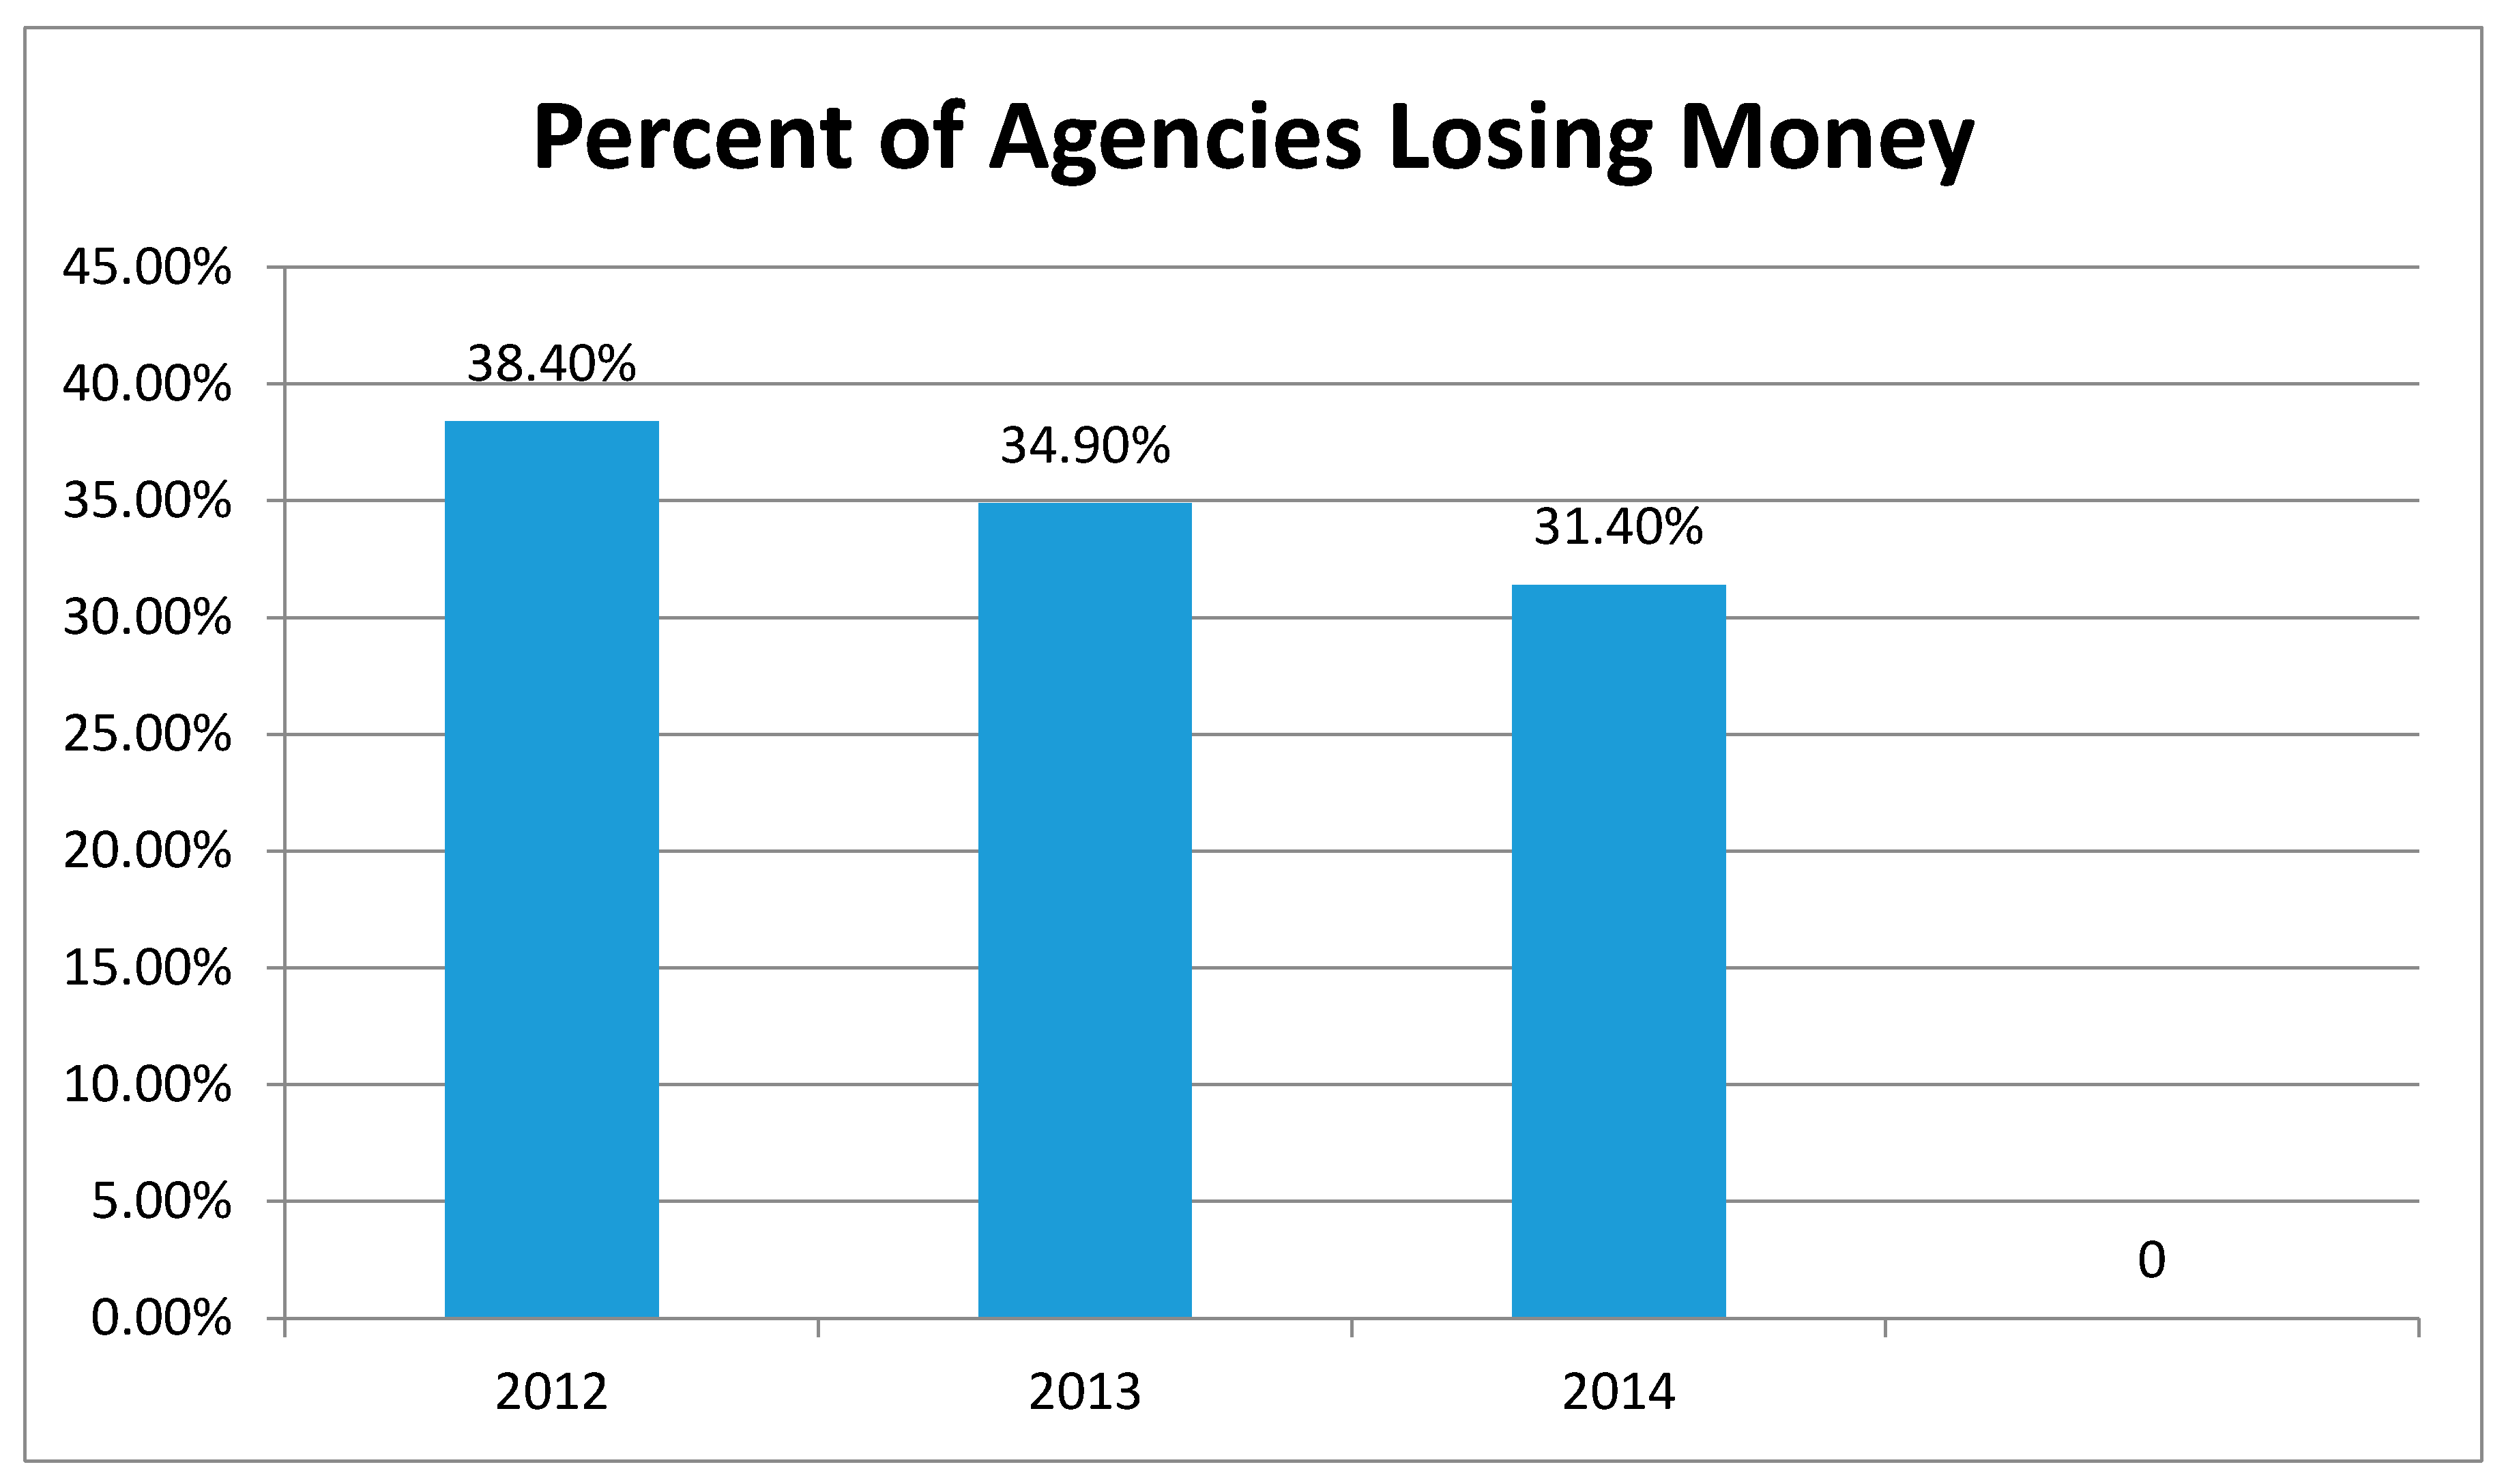
The data collected in this survey, presented in Figure 2, revealed that in 2012, 38.4% of the included agencies had expenses that exceeded revenue. There was a modest improvement in 2013, when 34.9% of the agencies had expenses that exceeded revenues. A modest improvement was also noted in 2014, when the percentage of agencies with negative margins fell to 31.4%. Revenues and expenses for 2012, 2013, and 2014 were summed to afford an aggregate perspective. Aggregating data typically enhances reliability (Strahan 1980). Using these combined fiscal data, we found that 32.6% of the agencies had expenses that exceeded revenues for the combined three year period. The pattern across the three years was consistent; about one-third of the provider agencies lost money each year. These data are presented in Figure 2.
A closer examination of the patterns of loss revealed that 11 (12.8%) of the agencies lost money in each of the three years of the study. Fourteen (16.3%) lost money in two years, and 29 (33.7%) lost money in only one year. Only 32 of the agencies (37.2%) did not lose money in at least one of the three years.
Despite the large percentage of programs that were reported to have lost money, most agencies did generate a positive margin. Over the three year period of this study, the margins were small in comparison to the amount of revenue being handled. The margins were reported to be less than 1% in 2012, 1.5% in 2013, and 1.6% in 2014.
3.2. Are Net Assets Being Maintained?
During the two year time period, net assets of the sample increased by about 15.7%, from an average of $7369.290 to $8,524,808. Sixty-three (63) providers (73.3%) increased net assets, and 23 providers (26.7%) decreased net assets. Net assets were uncorrelated with the dichotomous make money/lose money variable at 0.093 for 2012, 0.118 for 2013, and 0.120 for 2014. Similarly, net assets were not significantly correlated with the percentage margin. The values for 2013, 2013, and 2014 were 0.11, 0.13, and 0.12 respectively. There was no evidence to suggest that companies with greater net assets were any more or less successful in achieving a positive margin. The chart immediately below (Figure 3) reveals that net assets increased over the two years of the study.
3.3. Is More Funding Entering the System?
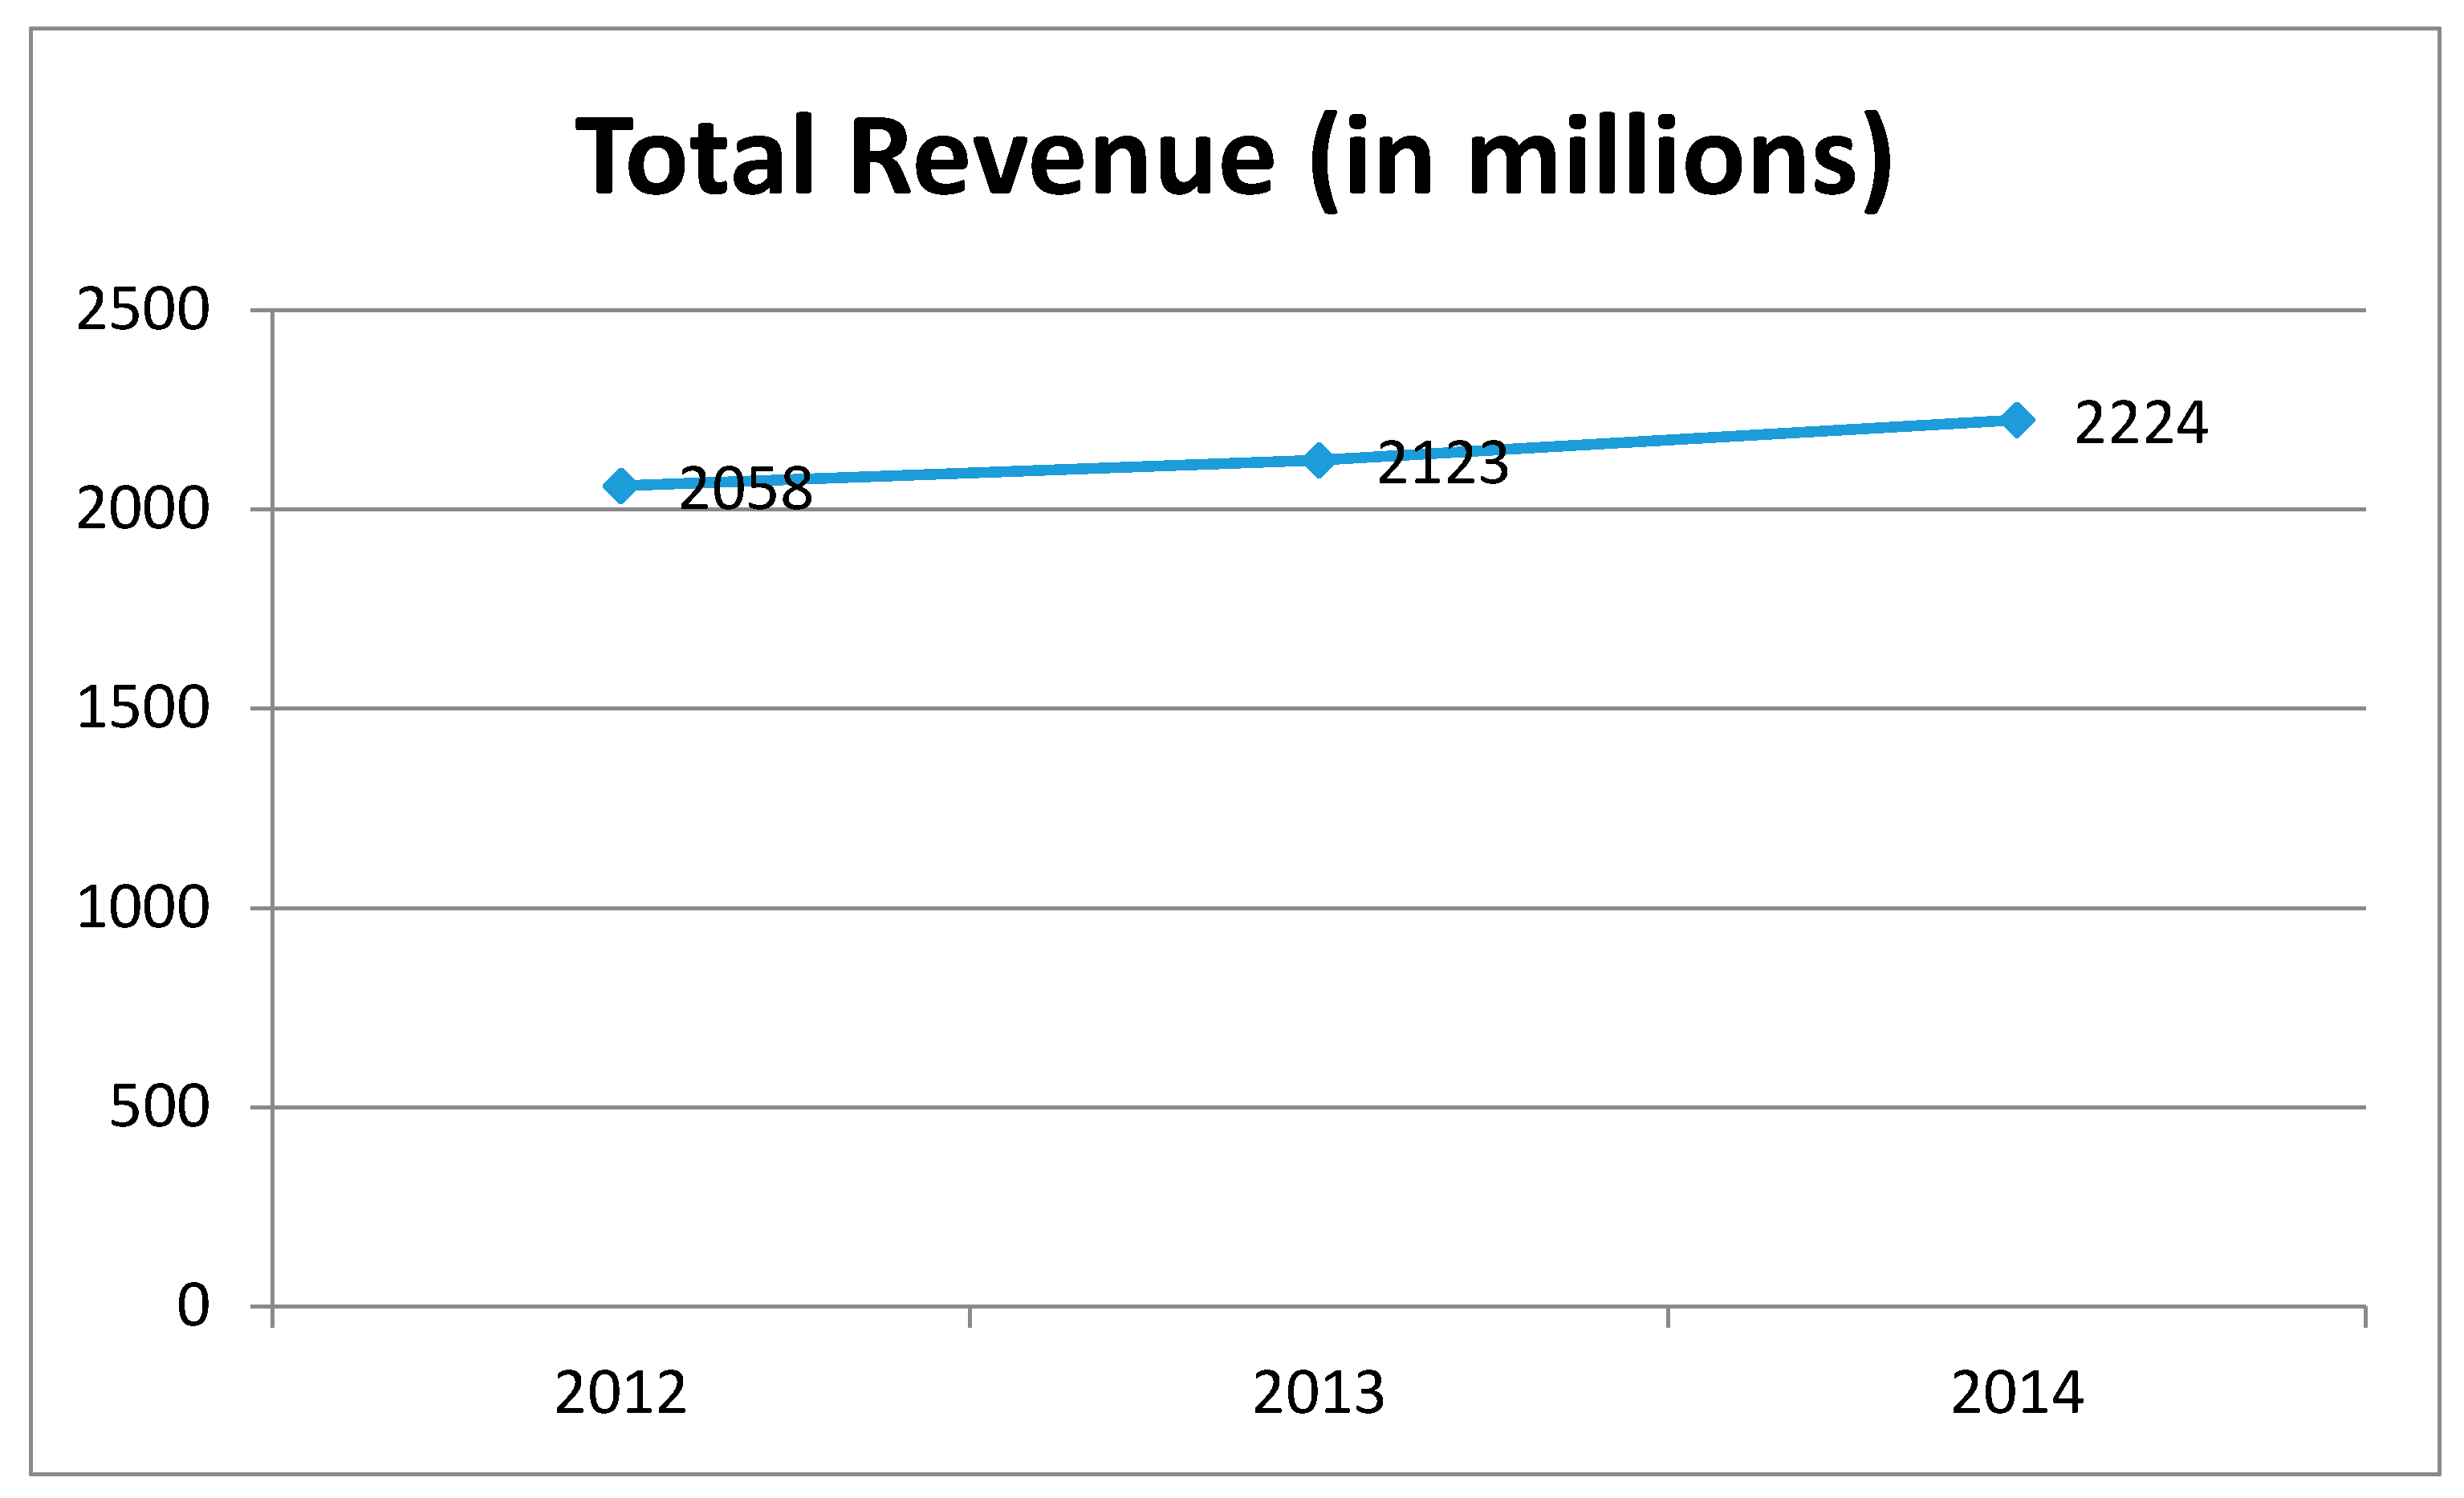
Figure 4 presents revenue over the three years of study. It is clear that the sample of providers increased in terms of revenue over the three year study period. Not all of this money was from the Pennsylvania Office of Developmental Programs, and not all of this money was even Pennsylvanian money. Across the two year period, revenue increased by about 8.1%. From 2012 to 2013, the increase was 3.1%, and from 2013 to 2014, the increase was 4.8% (we note that these two values do not sum to the overall value because of different denominators).
4. Discussion
Over a three year period, roughly one-third of our sample of intellectual disability agencies in Pennsylvania had expenses that exceeded revenues. About one-eighth of these providers lost money in each of the three years studied. One must question the long-term viability of a system of services for which one-third of the businesses lose money. It must be recognized that losses such as these must be subsidized in some manner. In many cases, agencies have essentially subsidized the inadequate governmental funding by dipping into their net assets. While this is reasonable in a crisis, it is not a sustainable way of conducting business. Others have increased fundraising efforts. One Philadelphia provider opened a for-profit business (bowling alley) to subsidize his non-profit social service efforts. In some cases, it seems reasonable to anticipate that those few funders who pay a reasonable cost for services provided are also paying for some of the services purchased by underfunded agencies.
The number of agencies losing money appears to be modestly declining. It is not clear whether this is a positive trend or merely an indication of slightly less water coming into the Titanic. Whether the percentage of agencies losing money is 38% or 31%, there are strong indications that the industry is unhealthy. Of course, a non-profit agency can continue to function with repeated annual losses. Typically, this is done by drawing on the net assets of the corporation. There will not be a 1:1 correspondence between annual losses and the status of net assets because net assets may grow for a number of reasons (stock market performance, bequests, donations, and real estate inflation). In such situations, net asset growth would be reduced by the amount used to cover losses in net income. Nevertheless, if the business portion of an agency is losing money, someone other than the primary funder is subsidizing the business for it to continue.
Net assets are arguably a better measure of corporate health than profit/loss ratios. As revealed above, losses can be sustained for many years by being offset by net assets. There are, however, limitations to the usage of net assets to offset losses. Net assets are not always liquid. In the case of many providers of intellectual disability supports and services, the net asset may be the home in which the supports and services are delivered.
Harvey and Tropman (2010) suggested several approaches that may have some utility in attempting to resolve this dilemma of expenses exceeding revenue. First, Harvey and Tropman counsel providers to reject all underfunded contracts. Rather than agreeing to make up any shortcomings via fundraising or drawing from one’s net assets, no contract should be signed if it fails to cover legitimate costs. It is unlikely that any construction company working on a government contract knowingly signs a contract under which it will lose money. One must wonder why a CEO in the intellectual disability field would sign such a contract. A second suggestion pertains to a form of social entrepreneurship in which providers share the costs of services or combine the purchasing power in order to decrease costs. This approach has been called shared services (Bergeron 2002). Harvey and Tropman (2010) suggested litigation as a third option, but the unfavorable outcome in the recent Idaho litigation would seem to discount this suggestion. For Armstrong et al. versus the Exceptional Child Center et al., the U.S. Supreme Court ruled that provider agencies lacked the standing to sue funders for failing to increase reimbursement rates (Heasley 2015).
The notion that providers need to have revenues that exceed expenses by at least a small amount has proven to be controversial. It has been argued that the retention of any sort of margin serves only to ensure that the money is not used for the benefit of people in need. While there is some degree of accuracy to this argument, one must recognize that the retention of margins is essential to the sustainability of non-profit agencies. Without margins, there are no provisions for emergency repairs, and the ability to borrow from banks is severely compromised. The rallying phrase of provider agencies has become “no margin—no mission.”
Net assets can buffer an agency through challenging fiscal times by subsidizing the underfunding from various governmental agencies. It must be noted, however, that many net assets are not liquid. Consider the real estate owned by many providers. Not only does it take considerable time to sell real estate, but in many cases, the real estate that must be sold is essential to the provision of supports and services. Nevertheless, one must consider the availability of net assets that may be used to offset the impact of annual losses. Consider the 11 provider agencies who lost money in 2012, 2013, and 2014. Projecting the losses to continue unchanged, it was determined that, on average, it would take a little over 16 years (16.54) to totally dissipate the net assets. The number of years until zero net assets was achieved ranged from 0.88 to 47.39 years for the 11 provider agencies. This, however, may present an overly optimistic picture, because if an agency has to sell its group homes to cover a loss, they no longer have group homes to operate. The low correlations mentioned above between net assets and the size of the margin indicate the relative independence of these two constructs. It must be noted that net assets are affected by the stock market, trends in giving, values of real estate, and a number of other factors, in addition to whether or not an agency earned a margin.
It must be recognized that while revenue has clearly increased, the data are somewhat difficult to interpret without reference to some measure of service units being provided. Given that there has been no rate increase for a number of years in Pennsylvania (in fact, a 10% reduction was imposed in 2012 (ARC of PA 2016)), the only reasonable explanation for increased revenue is that more individuals are being served. This is not truly an increase for providers of service, because they are now providing greater levels of service.
Is there a problem? Although an exceptionally large percentage of providers have expenses that exceed revenue, net assets increased by almost 16% over the three year study. Companies, at least on paper, are worth more than they were three years ago. This suggests some validity to the Commonwealth argument that providers are doing well. It does not, however, excuse the funding agencies from failing to pay for at least the complete cost of the services and supports they have purchased. It appears that when a funder is able to set prices for services and supports they purchase, all risk of the venture falls to the provider agency. Looking back to our original three questions, it appears that we can answer them as follows: (1) About one-third of provider agencies lose money each year. (2) Despite these losses, net assets have grown by about 16% over a three year period. (3) More money is entering the system, the value of which is likely offset by the provision of increased service units. Bradley (1996) has suggested that the field cannot rely on the political commitment to sustain the expansion of programs and services for individuals who have an intellectual disability. A greater reliance on available supports and services is needed. Perhaps this is why there appears to be growing support for adult foster care-type programs, which can offer community integration at lower costs than traditional group homes. Other alternatives may involve mergers and acquisitions that may save money through the use of shared services (Bergeron 2002).
A major limitation of this study is that it is a study of Pennsylvanian providers of intellectual disability services, and it is not clear the extent to which these findings may be applied to other states. Replications of this study in other states would be welcome.
Conflicts of Interest
The author declares no conflict of interest.
References
- ARC of PA. 2016. Available online: Thearcpa.org/file_download/inline/3c3a5130-83e9-4b32ba11b59f021667 (accessed on 9 October 2017).
- Bergeron, Bryan. 2002. Essentials of Shared Services. New York City: Wiley. [Google Scholar]
- Bradley, Valerie. 1996. Foreword. In Deinstitutionalization and Community Living: Intellectual Disability Services in Britain, Scandinavia, and the USA. Edited by D. Mansell and K. Ericcson. London: Chapman & Hall. [Google Scholar]
- Harvey, Thomas, and Tropman John. 2010. Death by a Thousand Cuts in Government Funds. Nonprofit Director 3: 10–21. [Google Scholar]
- Heasley, Shaun. 2015. Supreme Court Rules against Disability Providers. Disability Scoop. Available online: https://www.disabilityscoop.com/2015/03/31/supreme-court-disability/20178/ (accessed on 31 March 2015).
- Hrywna, Mark. 2015. FEGS get $10 million loan, files for bankruptcy. The Non Profit Times. March 19. Available online: http://www.thenonprofittimes.com/news-articles/fegs-gets-10-million-loan-files-for-bankruptcy/ (accessed on 9 October 2017).
- Mercado, Marilyn. 2015. Social services shortchanged by PA. budget crisis. Available online: http://www.lehighvalleylive.com/opinion/index.ssf/2015/08/social_services_shortchanged_b.html (accessed on 9 October 2017).
- Oss, Monica. 2015. Just Say No. Available online: https://www.openminds.com/market-intelligence/executive-briefings/just-say-no/ (accessed on 9 October 2017).
- Pennsylvania Waiting List Campaign. 2017. Available online: http://pawaitinglistcampaign.org (accessed on 10 September 2017).
- Strahan, Richard. 1980. More on Averaging Judges' Ratings: Determining the Most Reliable Composite. Journal of Consulting and Clinical Psychology 48: 587–89. [Google Scholar] [CrossRef]
- Association of Regional Center Agencies. 2015. On the Brink of Collapse. Available online: http://arcanet.or/wp-content/uploads/2015/02/on-the-brink-of-collapse.pdg (accessed on 9 October 2017).
- United States Department of Health and Human Services. 2009. Title 45, Code of Federal Regulation, Part 46. In Protection of Human Subjects; Washington: US Department of Health and Human Services. [Google Scholar]
- Walker, Shirley. 2015. Pennsylvania general budget spending and intellectual disability funding. Paper presented at the PAR General Membership Meeting, Harrisburg, PA, USA, September 30. [Google Scholar]
Figure 1.
Cumulative percentage spending of Pennsylvania general budget and Pennsylvania community intellectual disability spending.
Figure 1.
Cumulative percentage spending of Pennsylvania general budget and Pennsylvania community intellectual disability spending.

Figure 2.
Percentage of intellectual disability providers that lost money.

Figure 3.
Net assets (in dollars) of intellectual disability provider agencies.

Figure 4.
Total revenue (in millions).

© 2017 by the author. Licensee MDPI, Basel, Switzerland. This article is an open access article distributed under the terms and conditions of the Creative Commons Attribution (CC BY) license (http://creativecommons.org/licenses/by/4.0/).
Share and Cite
MDPI and ACS Style
Spreat, S. An Analysis of Revenue and Expenses for Providers of Intellectual Disability Supports and Services. Soc. Sci. 2017, 6, 128. https://doi.org/10.3390/socsci6040128
AMA Style
Spreat S. An Analysis of Revenue and Expenses for Providers of Intellectual Disability Supports and Services. Social Sciences. 2017; 6(4):128. https://doi.org/10.3390/socsci6040128
Chicago/Turabian StyleSpreat, Scott. 2017. "An Analysis of Revenue and Expenses for Providers of Intellectual Disability Supports and Services" Social Sciences 6, no. 4: 128. https://doi.org/10.3390/socsci6040128
Note that from the first issue of 2016, this journal uses article numbers instead of page numbers. See further details here.