Article

Effectiveness of Recycling Promotion and Education Initiatives among First-Generation Ethnic Minorities in Ontario, Canada

Department of Geography and Environmental Studies, Wilfrid Laurier University, 75 University Ave W, Waterloo, ON N2L 3C5, Canada
Soc. Sci. 2016, 5(2), 23; https://doi.org/10.3390/socsci5020023
Submission received: 27 December 2015 / Revised: 16 April 2016 / Accepted: 16 May 2016 / Published: 20 May 2016

Abstract

:
This study examines how first-generation ethnic minorities respond to different types of recycling promotion and education campaigns (P&E) used by municipalities in Ontario, Canada. A total of eight focus group sessions were conducted over an eight-week period to gauge participant attitudes and responses towards print (newspaper and signs) and electronic (websites) P&E messaging. Participants were asked to comment on message “recognition”, “clarity”, “the ability to increase recycling awareness” and “the ability to affect changes in recycling behavior”. Results from the focus group sessions suggest that none of the P&E mediums tested were able to increase recycling awareness or change recycling behavior in any meaningful way. First-generation ethnic minorities struggle with recognizing the central theme and purpose of P&E advertisements. Respondents also found existing campaigns excessively complex and confusing, and were not familiar with many of the terms and symbols used in existing P&E messaging. Other findings suggest that ethnic minorities are skeptical and distrustful of the municipalities’ intentions with respect to what they do with the waste after it is collected. The findings from this study lead to the recommendation that municipalities rethink and redesign recycling promotion and education initiatives to better engage minority communities.

Graphical Abstract

1. Introduction

“Where will the next recycled tonne come from?” is a question that has become top of mind for Ontario’s policy planners. For the better part of three decades, recycling has been a cornerstone of the province’s sustainability platform and is seen as a key driver towards a “closed loop economy”. However, provincial recycling rates have largely stalled in the past three years, and in fact, is trending downwards for the first time since the Blue Box program’s inception [1]. What makes this issue particularly salient is that in 2011, the Ontario Ministry of the Environment (MOE) set a provincial recycling rate target of 70% for all residential recyclable material. At the time, this move was heralded as a “step in the right direction towards a more sustainable Ontario” and was largely applauded by both municipal officials and the general public. At this juncture, however, municipalities are struggling with the concept of “incremental diversion”—how do they go after the material (and households) not being diverted or participating in recycling programs?
While many explanations have been put forward by stakeholders attempting to explain this unexpected drop in diversion (i.e., package light weighting, inefficiencies in municipal recyclables collection, etc.) a consideration that has been conspicuously absent from these conversations is how the “face” of Ontario’s recycler has changed. Ontario’s demography is rapidly changing, particularly for those in major urban cities. Visible minorities currently make up 25.9% of the province’s total population, a figure which has almost doubled between 2001 and 2011 [2]. Of this group, more than 85% identify as being a first-generation immigrant—wherein “first generation” refers to people who were born outside of Canada. How these changes in the province’s overall population affect recycling rates is poorly understood, but there is preliminary evidence to suggest that first-generation ethnic recyclers face significant barriers (both behavioral and structural) to participating in recycling initiatives.
In Lakhan’s examination of differences in self-reported recycling behavior between first- and second-generation South Asian immigrants in Ontario, it was observed that first-generation South Asians are less likely to participate in recycling initiatives, less likely to recycle for altruistic reasons, and often come from countries that lack conventional integrated waste management systems. In most minority households’ countries of origin, recycling (source separation at the point of generation) is neither encouraged, nor expected [3]. As noted by Medina [4], sorting recyclables is almost a societal taboo, as it is generally considered a subsistence activity carried out by the informal sector. There are also fewer opportunities to recycle due to a lack of mature integrated waste management infrastructure. The social and legal pressures to recycle that exist in Ontario are absent in most minority countries. As such, when first-generation immigrants move to Ontario, there may be a “cultural lag” with respect to recycling behavior. Until there is significant acculturation with respect to provincial waste management practices, first-generation minorities may express less concern for recycling, resulting in lower levels of recycling participation.
To help educate households about provincial recycling programs, municipalities undertake a series of promotion and education (P&E) initiatives designed to increase recycling awareness and levels of participation in source separation programs. Given the assumed effectiveness of P&E in promoting recycling, the province of Ontario has characterized P&E investments as a recycling best practice, reimbursing municipalities $1 per household for all P&E-related expenses [5]. Municipal P&E initiatives can take many forms (print and electronic media, door-to-door campaigns and special events) and is often communicated in multiple languages (to better engage the growing number of ethnic minorities in the province). However, as observed by Lakhan [6], municipal investments in recycling promotion and education were not shown to increase recycling rates in Ontario. What was not tested at the time was how households respond to different types of P&E initiatives.
This study seeks to examine this question, with a specific focus on how first-generation ethnic minorities respond to different types of recycling promotion and education literature. In a series of focus group sessions with first-generation visible ethnic minorities, participants were shown samples of recycling P&E (in print, poster and electronic forms) and asked to comment on their clarity, effectiveness and ability to affect changes in recycling behavior. This was done to gauge whether one form of P&E is more effective than others (i.e., websites may be better than newspaper), and what changes (if any) need to be made to better engage first-generation minority recyclers.
Given that first-generation minorities are making up an increasingly greater share of the overall population, and that these groups tend to report lower levels of recycling participation, it seems prudent to identify the most effective types of recycling P&E. There is a need to critically engage first-generation minorities to ensure their participation in household recycling. Assuming that there are barriers to recycling participation resulting from retained attitudes towards waste and recycling, municipalities need to design policies that specifically overcome said barriers in a way that is culturally relevant and tailored specifically to minority communities.

2. Literature Review

An integral component for the proper functioning of a municipal recycling system is ensuring public approval and participation [7,8,9,10,11]. The efficacy of the recycling system will largely be determined by a household’s ability to properly recognize recyclable material, what to do with recyclables separated from the waste stream, and the importance of recycling activity as a whole [12,13,14]. A popular tool employed by municipalities in raising levels of household awareness and participation in recycling initiatives is the use of promotion and education campaigns.
Table 1 below summarizes the types of P&E initiatives that can be used by municipalities.
While a rich scholarship exists on both recycling promotion and education and ethnic and racial variation in environmental belief and behavior (see [15,16,17,18]), comparatively few have examined the role of race and ethnicity as antecedents to recycling behavior, and fewer still on how ethnic minorities respond to P&E initiatives. This may be in part due to the sensitivity of attempting to explain behavior using racial and ethnographic variables. Particularly with a topic such as recycling, where participation is seen as a pro-social activity, explaining differences in behavior along racial/ethnic lines may leave some groups vulnerable to criticism or abuse.
With this in mind, there have been studies that have attempted to expand the existing literature on the profiles of recyclers to include racial and ethnic dimensions. Perry and Williams specifically examine recycling behavior of ethnic minorities in the United Kingdom [19]. Of note, this study found that variation in attitudes towards the environment and stated recycling behavior exist among ethnic groups, with certain minority groups (namely British Indians) expressing higher levels of recycling participation (despite lower levels of stated environmental concern) relative to the “white” British community [19]. This is in direct contrast to the findings by the Market and Opinion Research International group (MORI), which found that black and ethnic minority groups are less likely to recycle when compared to white Britons. Perry and Williams also found that ethnic minorities felt that they were not being effectively engaged by the local authority (municipalities) [19]. Interview results from the study suggest that recycling participation among ethnic minorities could be encouraged by increasing household awareness about “what you can put in the box” and “increasing the frequency of recyclable collection” [19]. Study participants also expressed a desire for the local authority to communicate information in their native language (i.e., Hindi, Gujarati, Italian, etc.).
Lakhan’s study [3] on differences in self-reported recycling behavior between first- and second-generation South Asians in Ontario, Canada found that there were significant differences in self-reported recycling behavior and stated levels of environmental concern between first- and second-generation South Asians. Second-generation South Asians viewed recycling more favorably, and indicated higher levels of recycling participation, recycling awareness and willingness to respond to recycling promotion and education literature. The study also found that source separation of recyclables was not a common waste management practice in first-generation respondents’ country of origin. A lack of past participation in recycling programs served as a barrier to recycling behavior, potentially explaining differences in levels of recycling participation between first- and second-generation South Asians in Ontario. Perhaps the most salient finding from Lakhan’s study is how first-generation South Asians responded to recycling P&E symbols [3]. When showed a picture of the 3R Mobius loop, more than 70% of first-generation respondents did not recognize the symbol and had no idea that it was associated with the environment or recycling. This was a particularly concerning result, in that much of the recycling P&E material in the province prominently displays the Mobius loop in its messaging—in some instances (as shown in Section 4.2), the Mobius loop is used in lieu of any reference to recycling. It is assumed that the Mobius loop is a universal symbol of recycling, but for first-generation South Asian minorities, it was “foreign” and “unrecognizable”.
It is with this in mind that this study was conceived. Despite the past successes of recycling P&E in promoting recycling, the current approach employed in Ontario does not appear to be working—at least with respect to improving household recycling rates. There is also preliminary evidence to suggest that existing P&E messaging may not be effectively engaging the province’s growing population of first-generation ethnic minorities. This study seeks to test the effectiveness of various recycling P&E mediums and messages among first-generation ethnic minorities. This is done to better understand what changes need to be made to design and deliver clear and effective P&E campaigns. As far as can be ascertained, this is the only study of its kind to examine how ethnic minorities respond to different types of recycling promotion and education.

3. Materials and Methods

3.1. Description of P&E Initiatives Presently Employed in Ontario

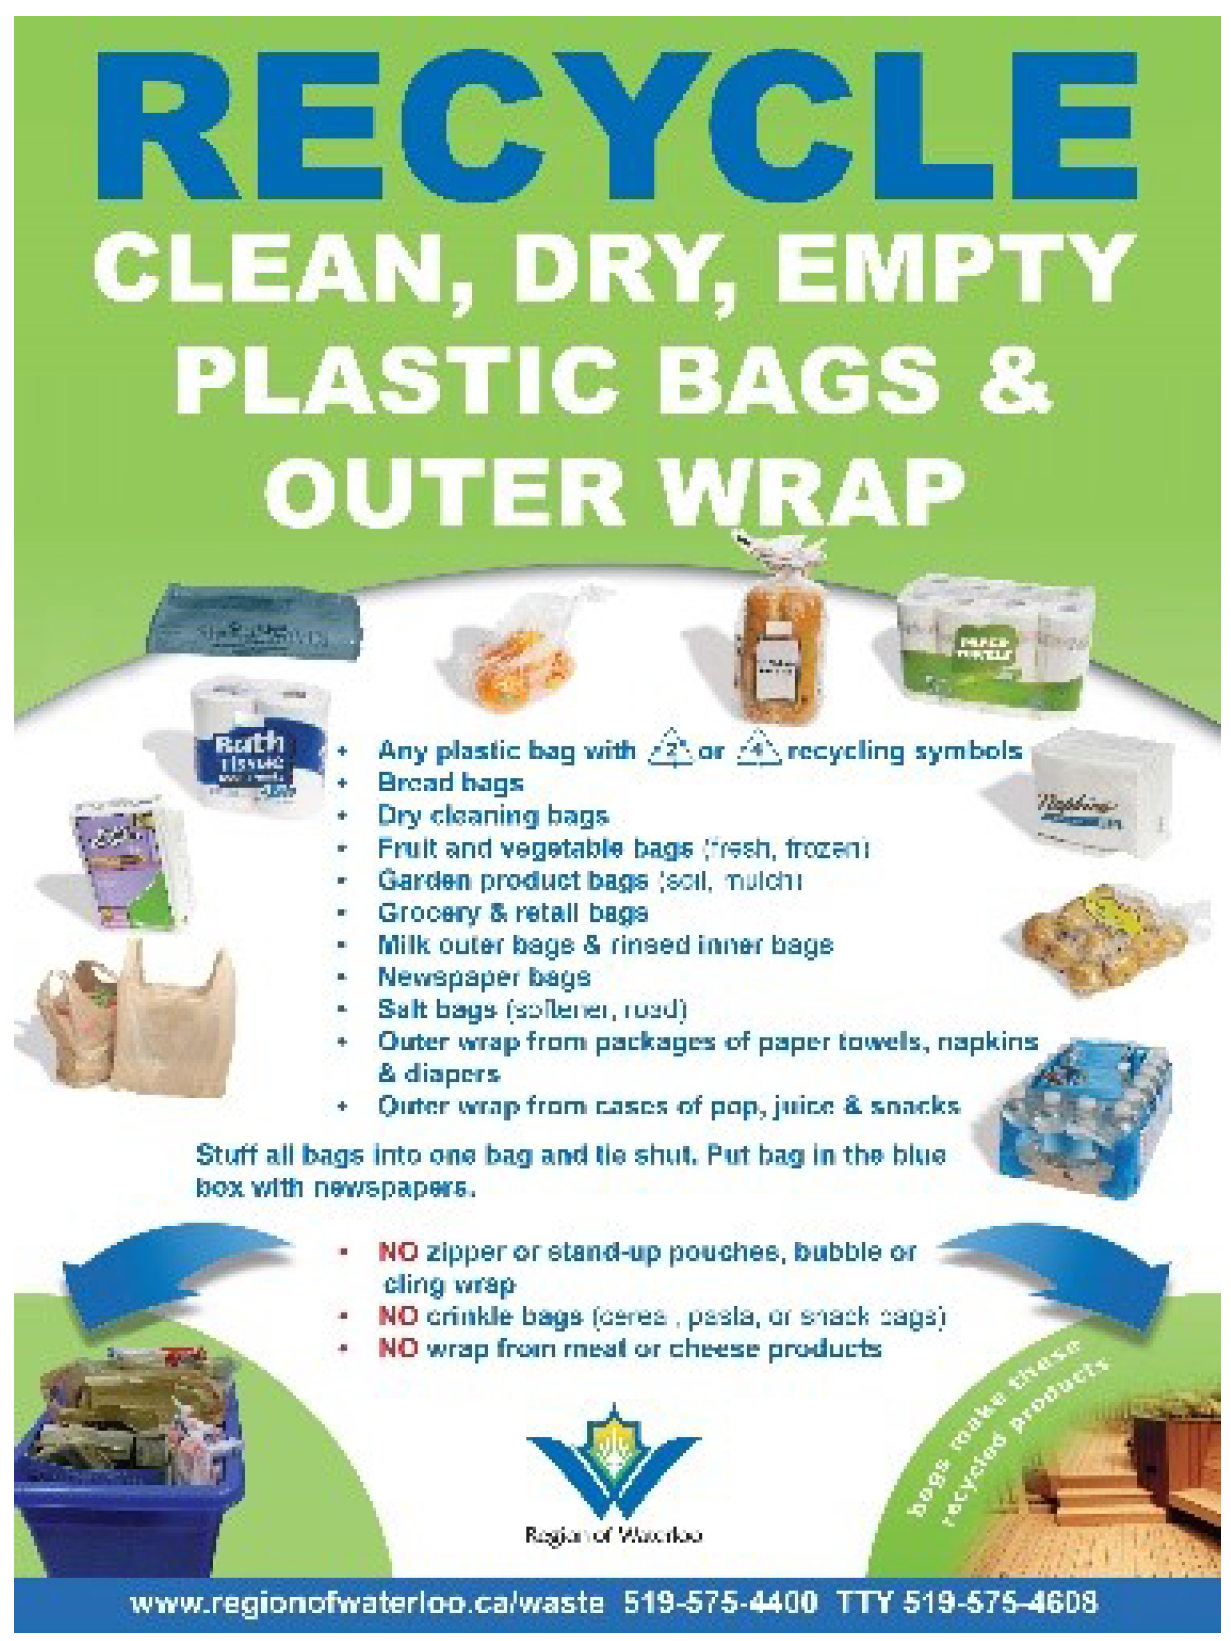
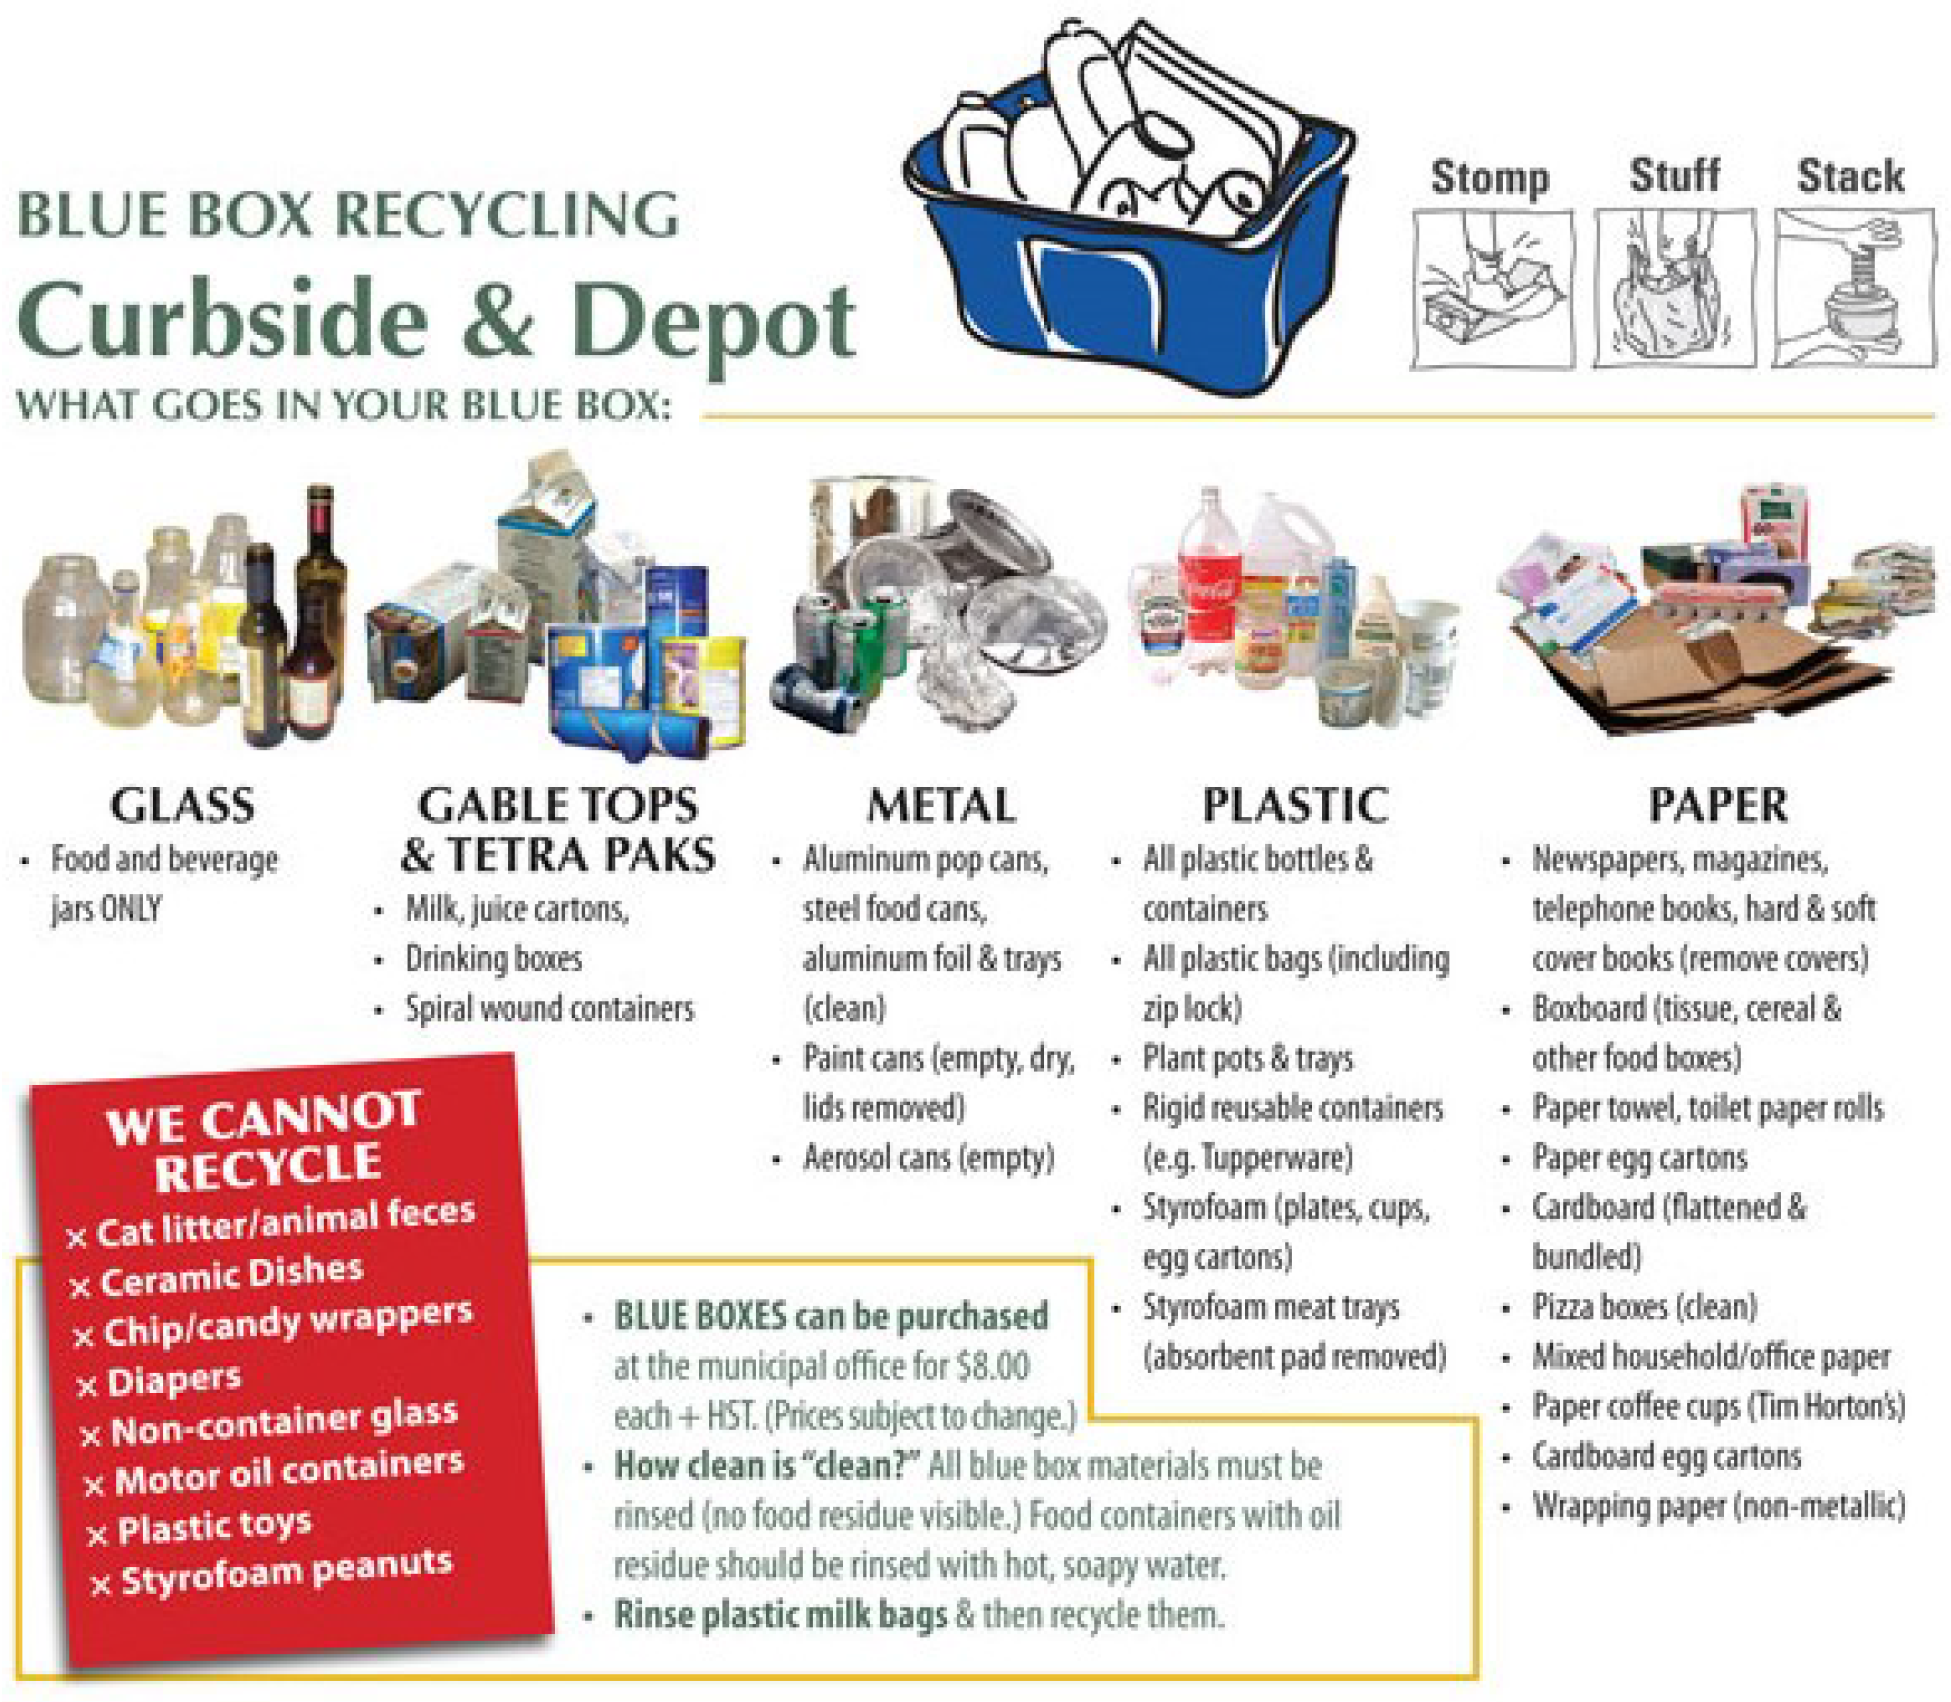
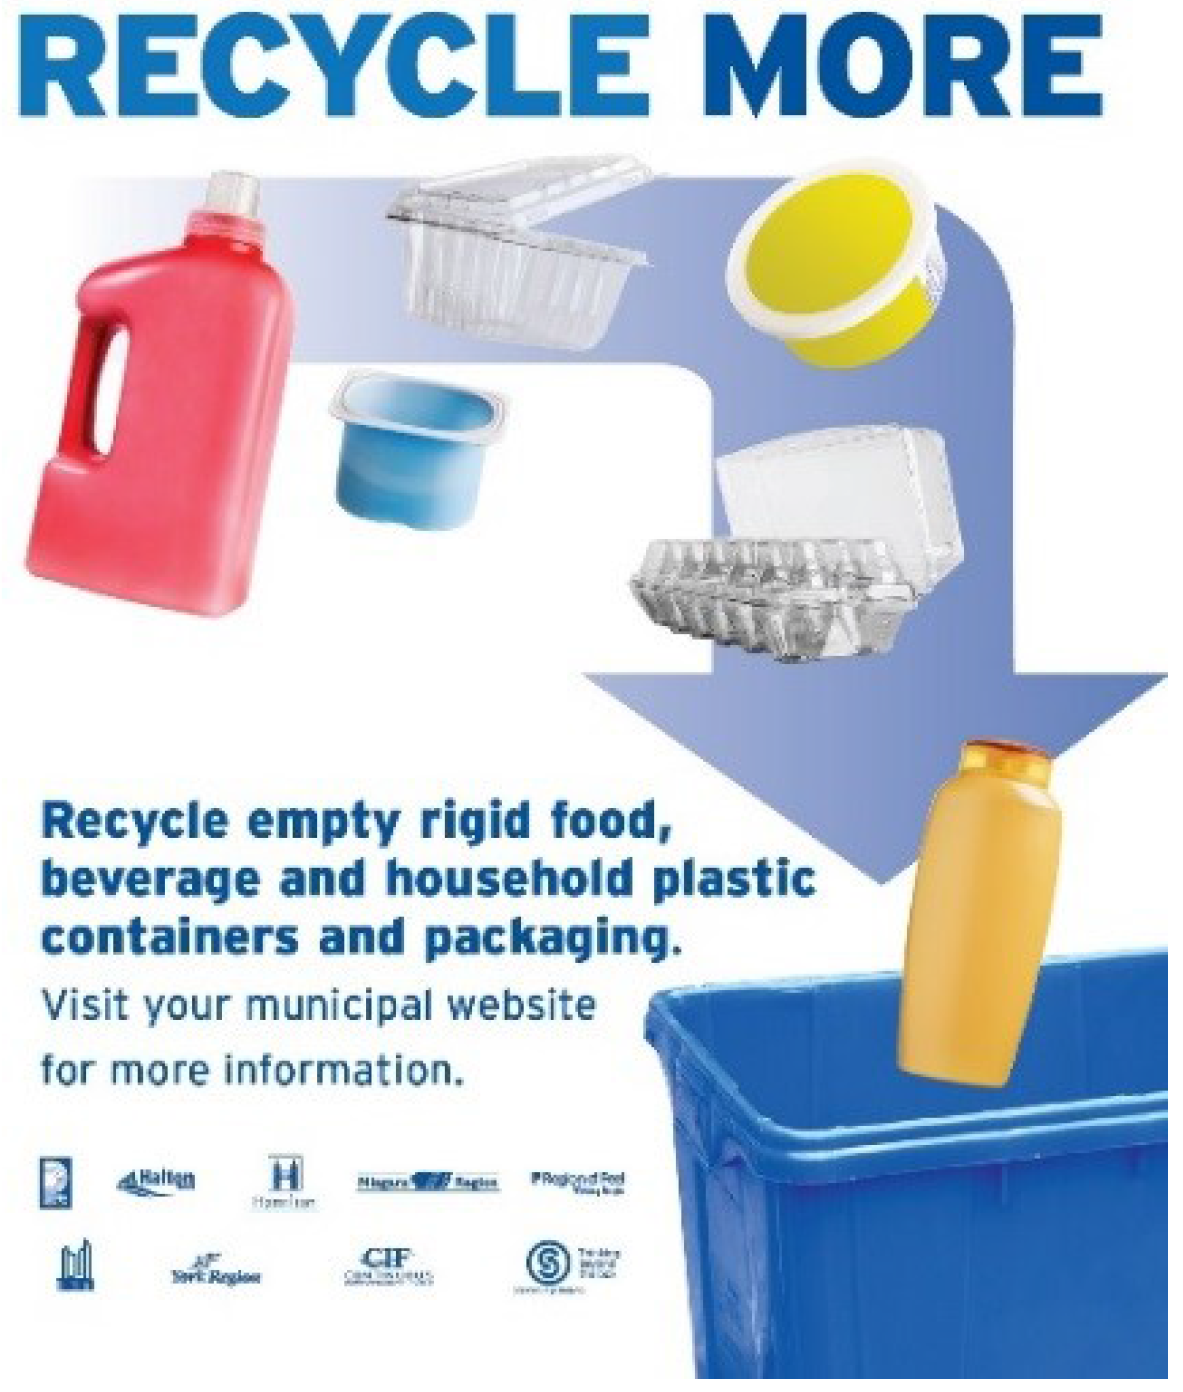
3.1.1. Recycling Promotion and Education through Leaflets, Pamphlets and Flyers

The most common form of recycling promotion and education employed by municipalities is newspaper advertisements, flyers, and inserts that communicate the what/when/where of recycling programs in the region. These advertisements are also most commonly used to advertise program changes and/or special events (i.e., unlimited garbage days, electronic take back events, etc.) As a means to engage members of Ontario’s minority communities, many of the province’s larger municipalities (Toronto, Peel Region and York Region), translate printed P&E materials into several languages. For example, the city of Toronto publishes all promotion and education literature in 6 different languages (that are most commonly used in the region). Municipalities also receive “in kind” provisions from newspaper publishers to advertise at a discounted rate in regional publications.

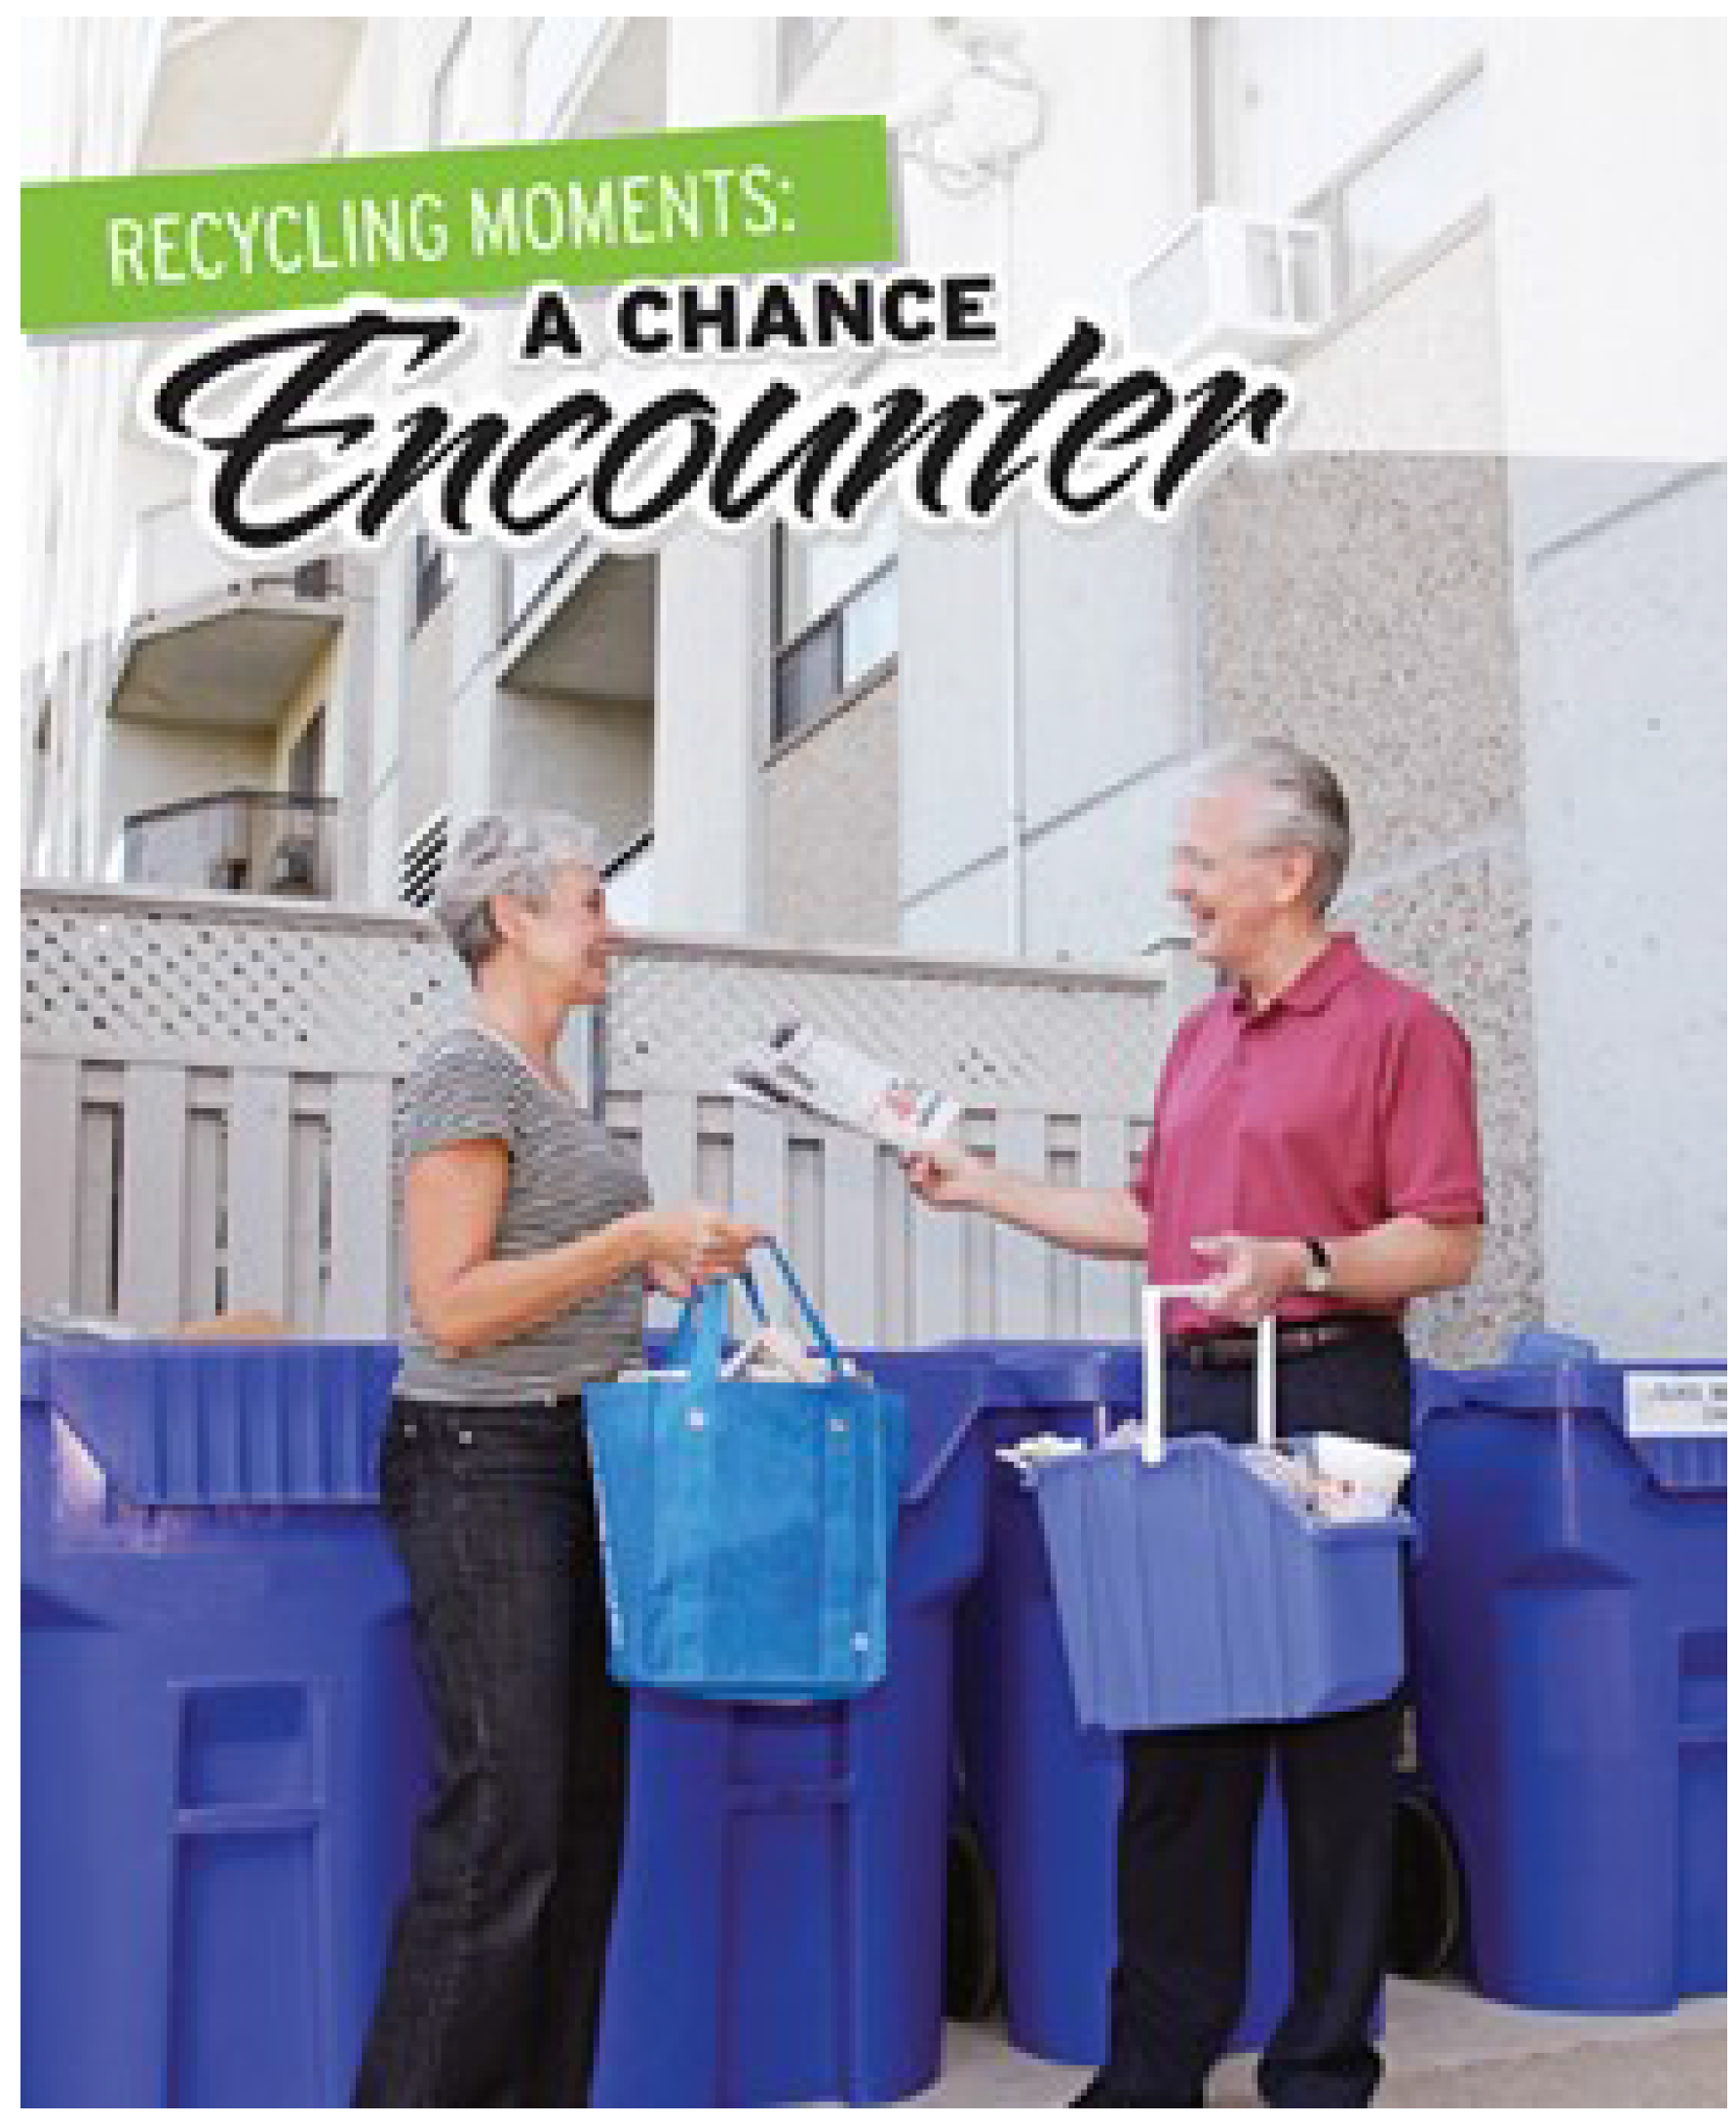
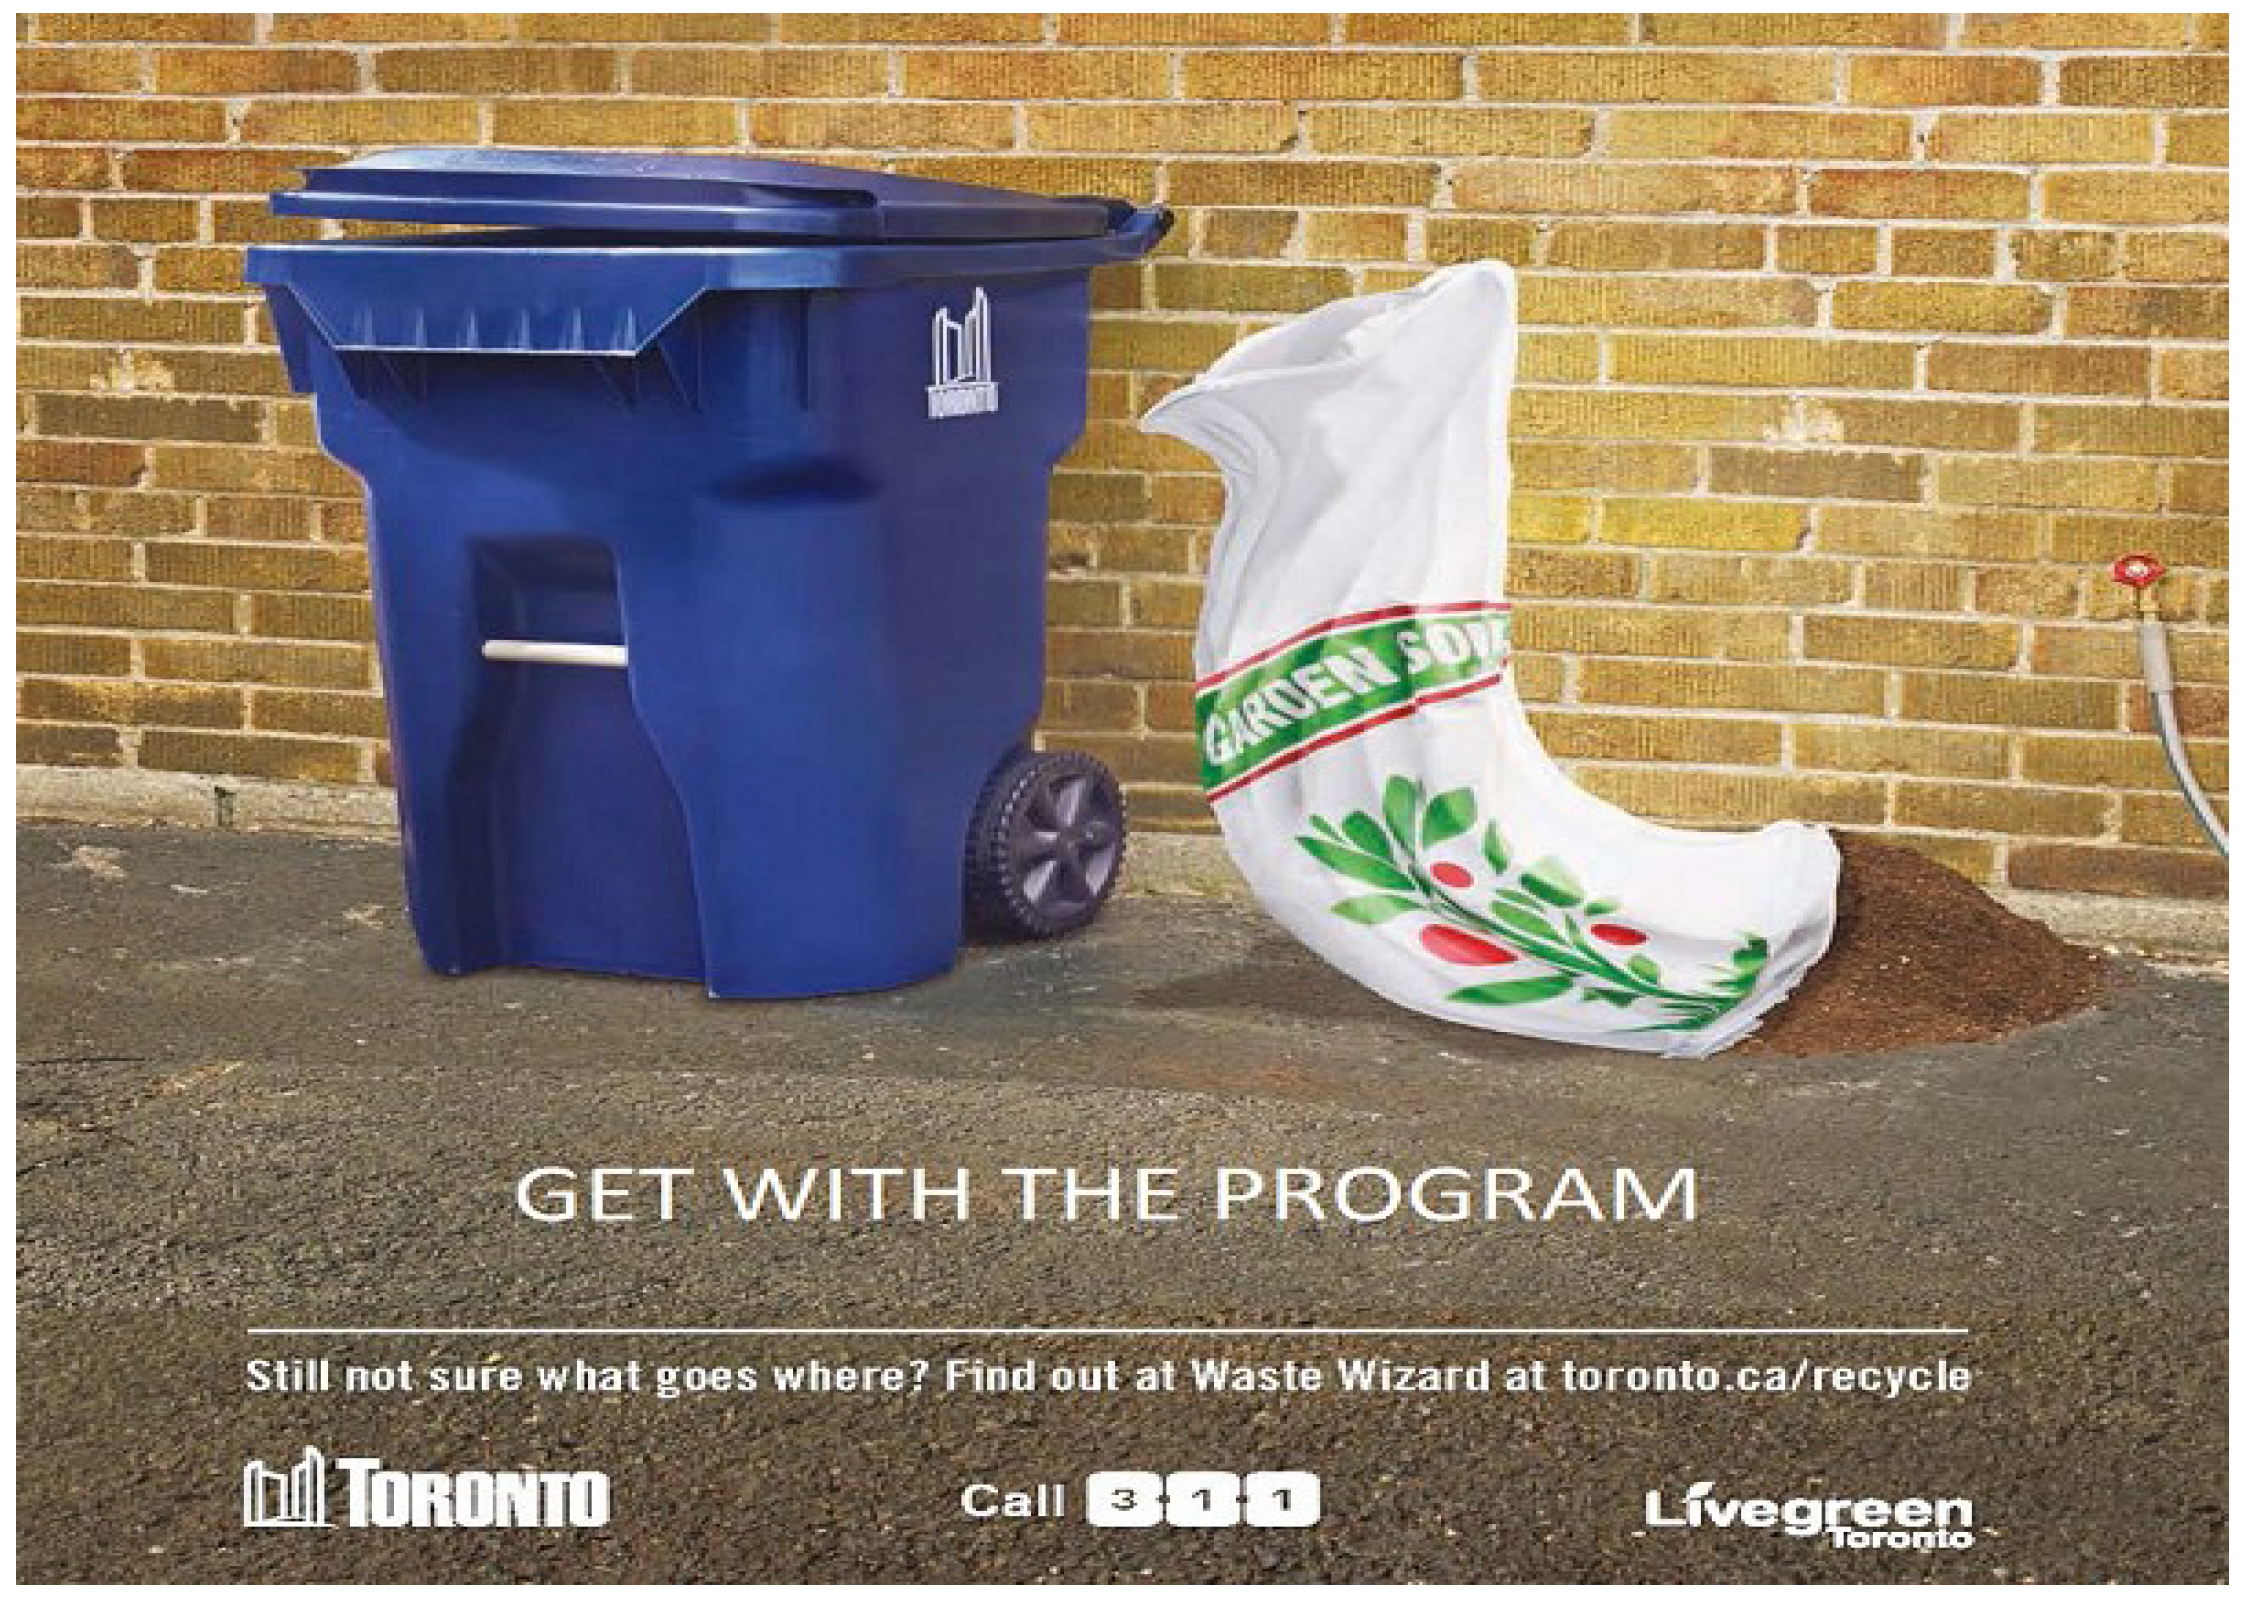
3.1.2. Recycling Promotion and Education through Signage

Several municipalities in the province have chosen to promote recycling promotion and education through public signage. This approach has proven to be popular in northern/rural communities and public spaces. Signs are used to communicate what are acceptable Blue Box materials, when materials will be picked up (or in the case of depot systems, where to bring recyclable material) and what not to place in recycling bins (this is an issue in public spaces, where recycling bins have high levels of organics contamination). Signs are designed to communicate messages simply and effectively, using high impact colors and recognizable symbols. Despite the popularity of signage as a promotion and education strategy, there has been little feedback from provincial municipalities as to whether they have been effective in driving diversion.

3.1.3. Promotion and Education Initiatives in Multi Residential Buildings

Multi residential dwellings (apartments, condos, etc.) in Ontario recycle at 1/3rd the rate of single family dwellings in Ontario (22% Recycling Rate Multi Residential vs. 68% Recycling Rate Single Family) [20]). As such, significant investments in recycling P&E initiatives specific to multi residential buildings have been undertaken by municipalities throughout the province. As of 2014, there were 13 active P&E multi residential projects listed on the Continuous Improvement Fund website [21]. These initiatives engaged multi res households using a variety of measures, including: pamphlets, posters, signage and door to door campaigns. While individual projects have demonstrated some successes using P&E to promote multi residential recycling, the biggest impediment to improved multi res diversion remains one of access and convenience.

3.1.4. Promotion and Education Initiatives through Direct Engagement

Perhaps the most successful (and costly) promotion and education strategy used in Ontario is directly engaging the public to educate and inform them about Blue Box recycling. Direct engagement can take many forms, including: door to door campaigns, visiting local schools and holding special events (barbeques, activity days, etc.) Many municipalities utilize some (or a combination) of these strategies to foster awareness about recycling initiatives and educates the community about the Blue Box program, its importance, and “what goes in the bin”. These types of initiatives have demonstrable and immediate effects on improving household recycling (at least in the short term), but it remains unclear as to whether these successes can be sustained over the long run—particularly if direct engagement initiatives cease. Direct engagement campaigns also tend to be the most costly type of P&E initiative, as it requires significant municipal resources and staff time.

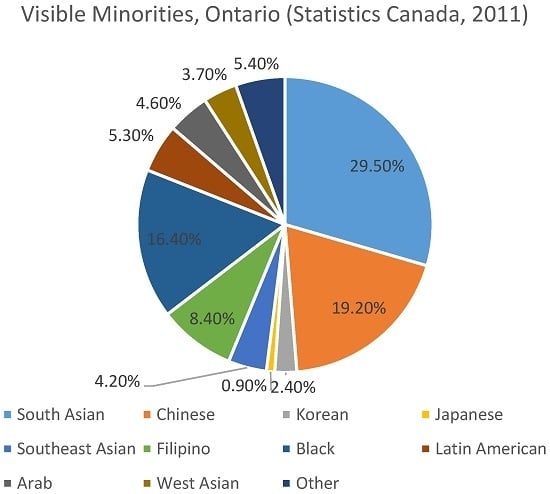
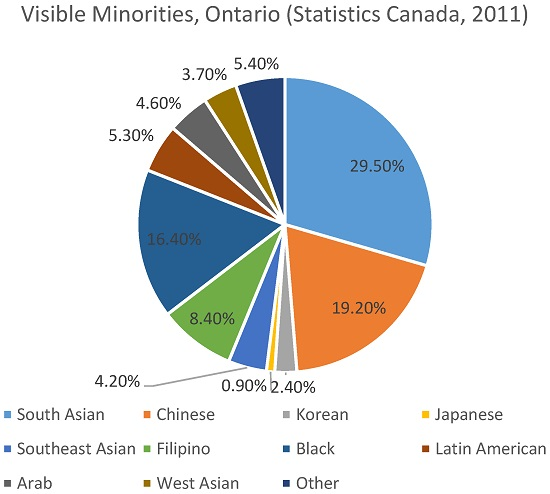
3.2. Description of Study Site

Ontario remains at the forefront of recycling initiatives and legislation, recognized as one of only three provinces in Canada to implement an extended producer responsibility scheme (EPR) for household recyclables. Residential and commercial waste diversion programs exist for MHSW (Material Hazardous or Special Waste), WEEE (Waste Electrical and Electronics Equipment), automobile tires, and printed paper and packaging (Blue Box) materials. Stewardship Ontario is the industry funding organization designated to collect fees on behalf of packaging producers to finance the operation of the Blue Box program.
Under provincial regulation O. Reg. 101/94, every municipality with a population of 5000 or more residents are obligated to operate a Blue Box program accepting at least five mandatory materials [22], plus three optional materials. A total of 23 packaging types have been classified as being eligible for inclusion in the Blue Box.
An estimated 3.2 million Ontarians identify as being a member of a visible minority group. These individuals make up more than half of Canada’s total visible minorities. Combined, the three largest minority groups in Ontario as per the Statistics Canada 2011 census were South Asians, Chinese and Black—which account for nearly two-thirds of all visible minorities in the province. Figure 1 provides the relative demographic breakdown of visible minorities in Ontario [2].

3.3. Study Design

Three geographic regions in Southern Ontario were targeted to conduct focus groups sessions. These include the City of Toronto, the Region of Peel (City of Mississauga and City of Brampton) and York Region (City of Markham, City of Vaughan). These groups were selected on the basis that they provide an adequate geographic representation of the province, and are home to more than 2.5 million residents who identify as being part of a visible minority group (approximately 46% of the total population of the region).
Focus group questions and topics were pre-tested and refined prior to conducting the official sessions. The pre-test allowed for wording refinements and changes to the ordering of the questions. Focus groups were conducted over an 8-week period beginning in February 2015 and running through April 2015. Teams of two facilitators and one site supervisor were sent to each focus group session. Sessions lasted for approximately 90 min, and were conducted at designated locations throughout the city (local churches/temples/mosques and schools had been previously engaged to provide a meeting space to conduct focus groups). Each focus group consisted of between 8 and 12 subjects (mean size of 9.63 participants). Facilitators were proficient in several languages (including English, French, Hindi, Punjabi, Farsi, Cantonese, Mandarin and Vietnamese), allowing questions to be asked in the language study participants were most comfortable with (in most instances).
Recruitment “booths” were set up in public space areas (malls, parking lots, etc.) to recruit potential study participants. Enumerators were asked to approach members of the public, explain who they were and the purpose of the study, and request approximately 2 h of the participant’s time to participate in the focus group. Local community organizations (religious institutions, cultural groups, etc.) were also contacted in advance to ask whether they could engage their membership/congregation and request their participation in the study. Study participants were compensated with their choice of a $50 gift card to a local grocery chain, Tim Horton’s Café and Bake Shop or Amazon.ca.
Potential study participants were screened to ensure that they fit the study’s target demographic. Study participants had to self-identify as being part of a visible minority group (as defined by Statistics Canada) and be a first-generation immigrant. While all reasonable efforts were taken to ensure a representative sample that approximates the province’s relative demographic breakdown of ethnic minorities, the total number of participants tended to be more heavily weighted towards South Asian and Asian respondents. Members of Ontario’s Latin American and African ethnic groups are underrepresented in this study. It should also be noted that people who are amenable to participating in a focus group session may be biased towards recycling behavior. This is often difficult to control for, as a prescreen question of “Do you recycle?” will almost always elicit a positive response (given the negative connotation associated with non-participation in recycling).
Table 2 below summarizes the relative demographic breakdown of focus group participants.
Table 3 below provided summary statistics of focus group participants.
A total of 77 individuals participated in eight focus group sessions over the two-month period of the study. Three focus groups each were conducted in the Region of Peel and the city of Toronto, with the remaining two conducted in York Region. Each focus group session was tape recorded by the site supervisor and was later electronically archived and analyzed using Provalis Word Stat, Microsoft Excel and Microsoft Word. Word Stat was used to code, summarize and categorize interview responses. Microsoft Excel and Microsoft Word were used to record frequency counts and percentage distribution of responses. Participants were informed that their participation was voluntary, and that their refusal to participate in or to withdraw from the study carried no penalty or loss of any benefits. Participants were told that they were under no obligation to answer questions that they were uncomfortable with. All answers provided were anonymous, and any publication or use of responses could not be traced back to individuals. All 77 study participants chose to remain in the study and consented to having their opinions and responses recorded and analyzed.
A potential limitation of this study is its reliance on frequency counts when gauging ethnic minority responses towards P&E messaging. As an example, particularly vocal members during focus group sessions may bias the results if they repeated key terms multiple times. Facilitators were asked to control for this by giving each focus group participant equal opportunity to express their opinions and thoughts. However, it should be noted that frequency results may be misleading as coded responses were not attributed to specific participants. Results were recorded and summarized on aggregate from all focus group sessions.
Of note, facilitators were instructed to provide no personal input or opinions during the session. They were however given the discretion to ask follow up questions where they felt it was necessary.

4. Results and Discussion

To gauge participant responses and attitudes towards municipal promotion and education material, focus groups were shown a series of print (newspapers and signs) and electronic media, and asked to answer a series of questions with respect to the following:
(1)
Recognition
(2)
Clarity
(3)
Ability to increase recycling awareness
(4)
Ability to change recycling behavior

4.1. Response to Recycling Promotion and Education Advertisements in Newspapers

The most common medium for municipalities to promote recycling initiatives are through newspaper advertistements. Figure 2, Figure 3 and Figure 4 are sample recycling P&E advertisements presently used in Greater Toronto Area newspapers.

4.1.1. Recognition

Focus groups were provided with sample newspapers (when possible, the local newspaper for the region was used) that included one (or more) samples of recycling P&E messaging. Participants were not instructed to specifically look for the P&E advertisements, and instead were given 10 min to read through the paper and asked to comment on the articles/advertisements/symbols that they most remembered.
At this point in of the study, focus group participants had not been shown samples of recycling P&E in newspapers (although when explaining the purpose of the study during the consent stage, participants were notified that they would be asked to comment on a range of recycling promotion and education initiatives).
  • Question 1: “What were the things/topics you most remember from reading the newspaper?”
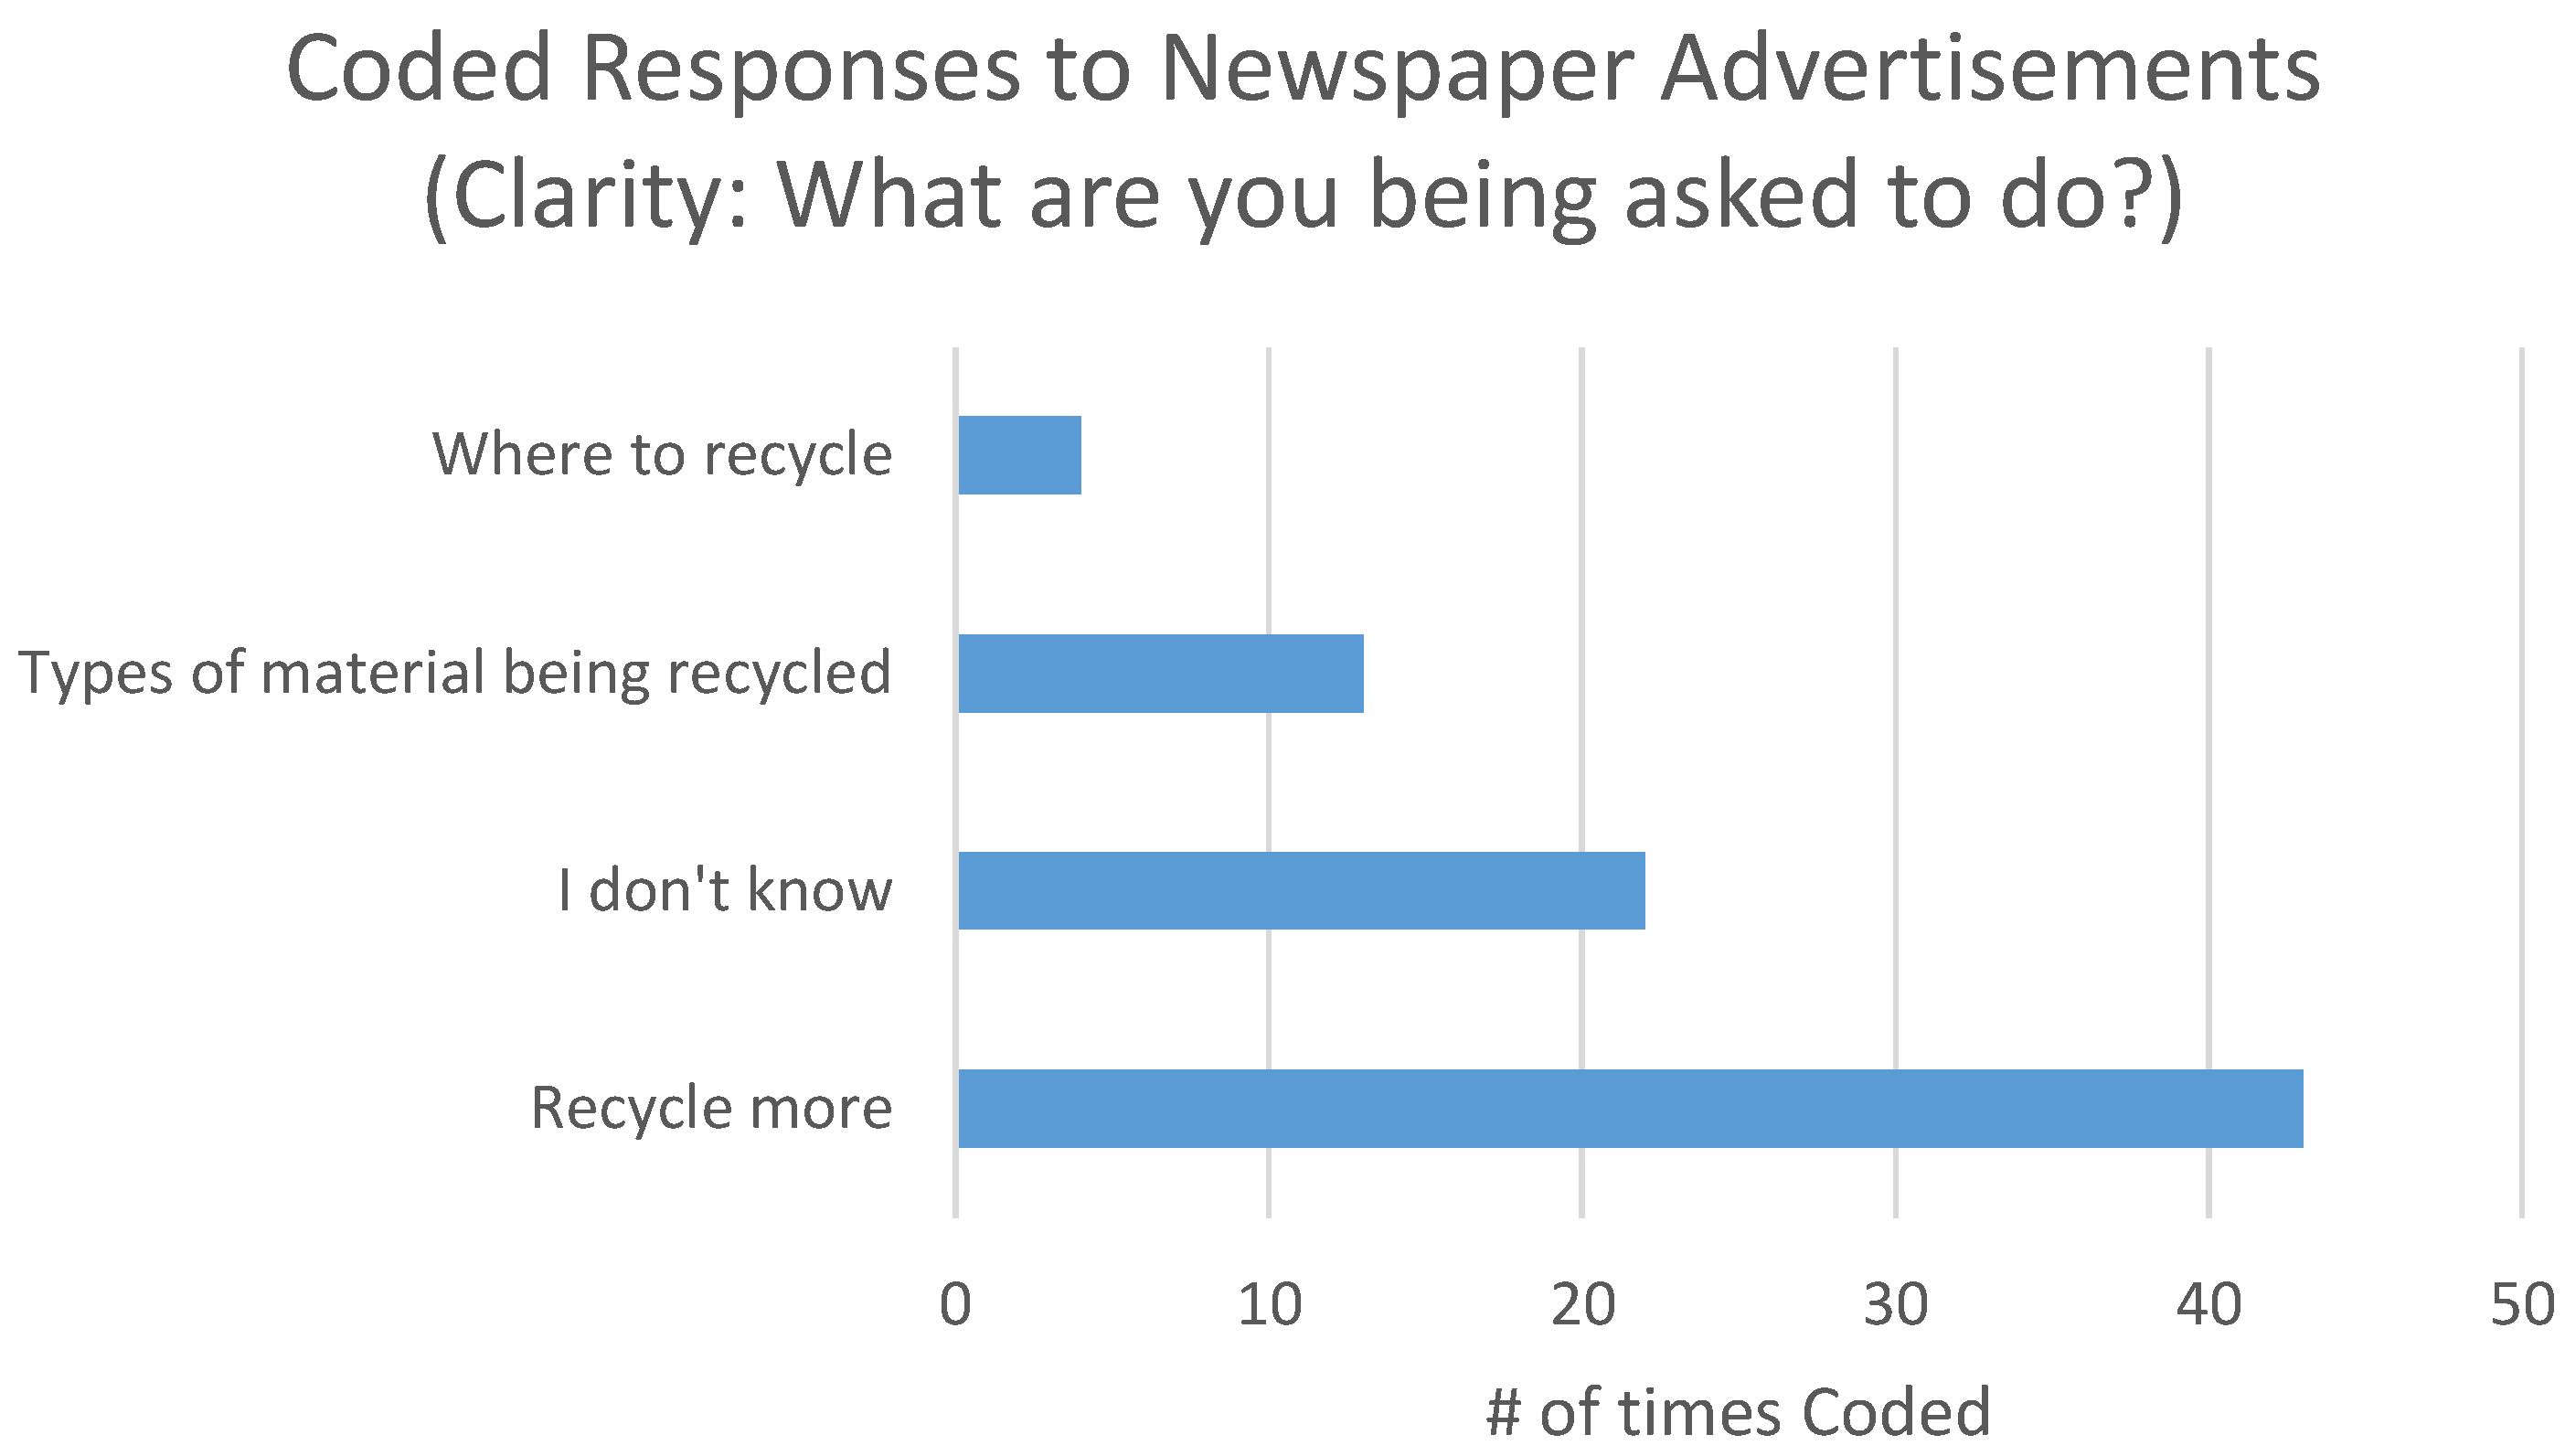
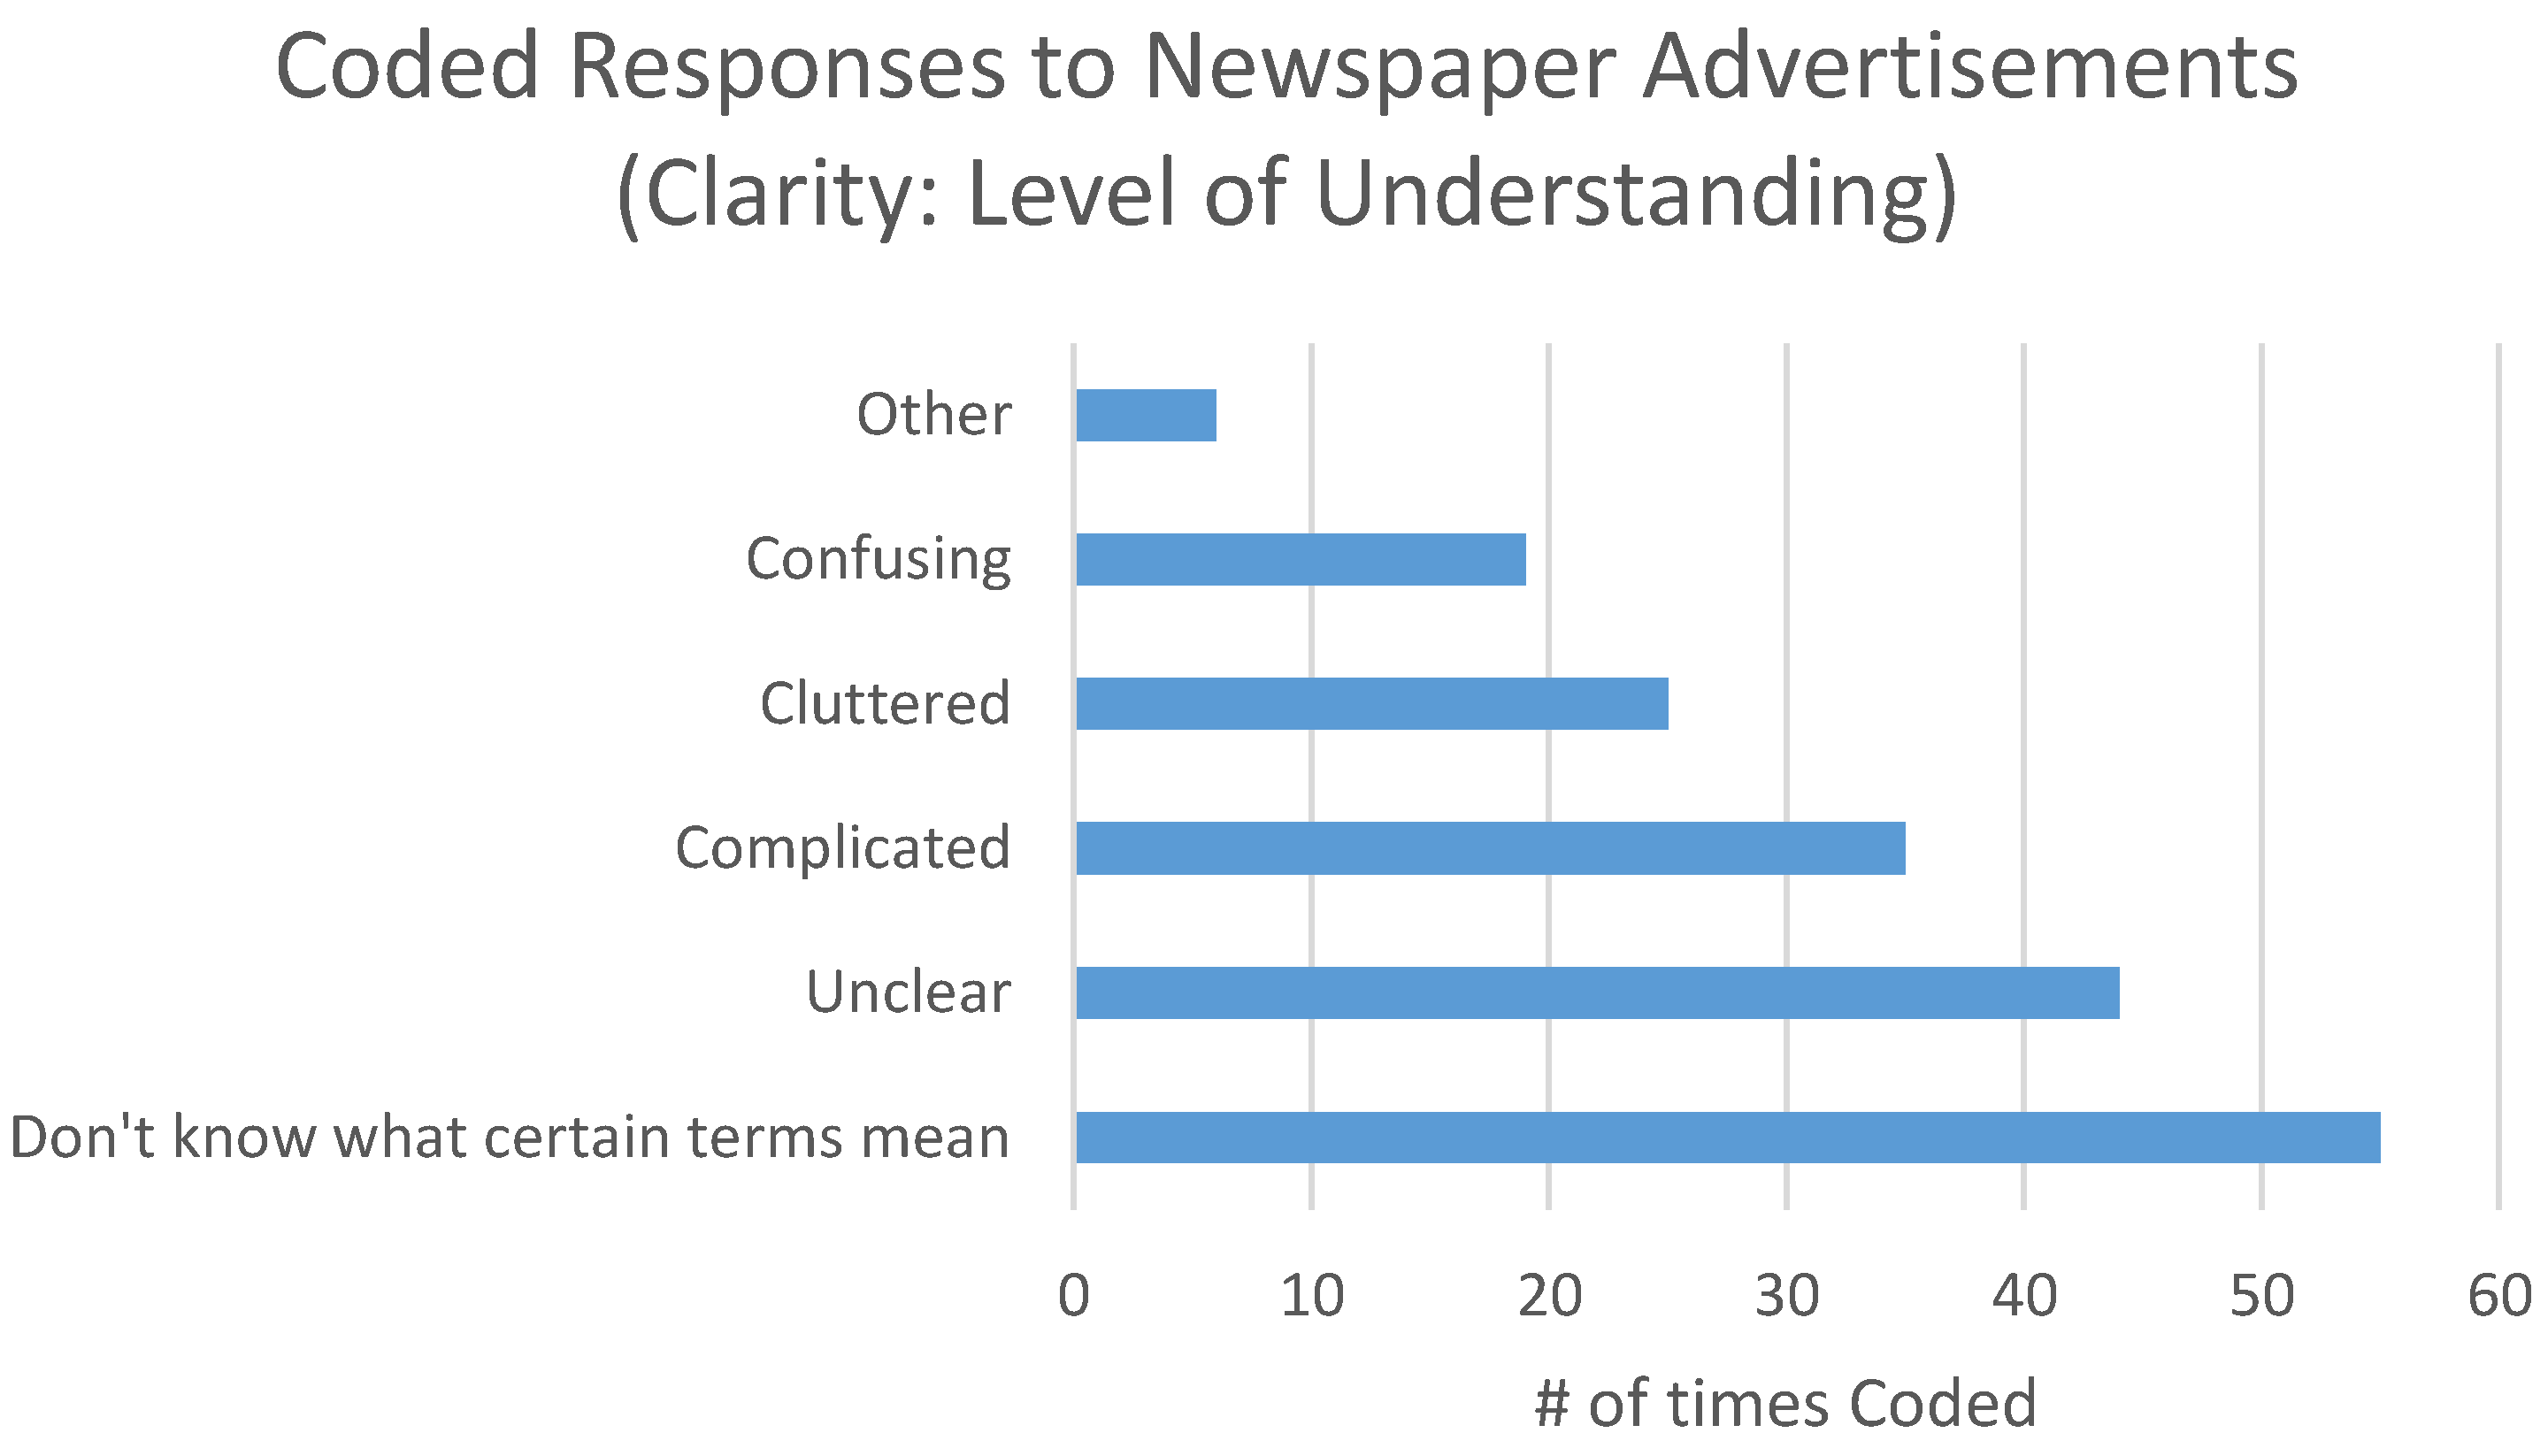
The initial question did not ask the focus group to specifically comment on the recycling P&E advertisements. Instead, participants were asked about what they remembered/noticed the most from reading the paper. This was done to establish a baseline as to where P&E advertisements rank relative to other newspaper content. The most frequently coded response during the focus group sessions was “Grocery Advertisements” (coded 54 times) followed closely by “Headline Story” (coded 47 times). “Classified”, “Help Wanted” and “Local Sports” rounded out the top five responses given by focus group participants. Figure 5 below illustrates the most frequently coded responses. Of note, recycling P&E advertisements was coded only 5 times across all 8 focus group sessions. This is not an entirely surprising result—study participants are drawn to the issues/topics that are most relevant to them. When facilitators followed up this question with “Why did you notice these things?” anecdotes such as “I need to see what’s on sale for doing my shopping this week” and “I am looking for an apartment to rent” were recorded. Recycling is not seen as an immediate priority for most households.

4.1.2. Clarity

In order to assess first-generation ethnic minority response to newspaper P&E advertisements, facilitators showed each focus group sample P&E literature (that were taken directly from local newspapers, see Figure 2, Figure 3 and Figure 4) and asked to comment on the “clarity of the message”. Did they understand the purpose and intent of the message, i.e., what type of material to recycle, where it goes etc.?
  • Question 1: “What do you think this advertisement is asking you to do?”
In Figure 6, the most frequently coded response provided by study participants was “Recycle More” (coded 43 times). “I don’t know” was the second most frequently coded response (22 times). Of note, “The types of material that should be recycled” was recoded only 13 times. While 2 of the 3 sample P&E advertisements were intended to inform households about “What Goes in the Blue Bin”, focus group participants did not seem to identify this as the central purpose of the advertisement. The only other response coded during the focus group sessions was “Where to recycle” (coded 4 times). None of the sample P&E advertisements specified where to recycle (with respect to locality), so it is unclear as to whether respondents meant where to put recyclables (i.e., Blue Box) or where to drop off recyclable material (i.e., Recycling Depot).
  • Question 2: “Is the information presented in this advertisement is clear and easy to understand?”
Given that focus group participants did not seem to fully understand the “intent” of the sample P&E advertisements, facilitators asked participants to comment on the effectiveness of the advertisement itself. Was it well designed and easy to understand?
Figure 7 below summarizes the coded responses provided during focus group sessions. Responses suggest that sample promotion and education literature was unclear (coded 44 times), complicated (coded 35 times) and cluttered (coded 25 times). Of particular note, the most frequently coded response was that the ads contained language/terminology that the respondents were not familiar with (coded 51 times). Ethnic minorities (and arguably, most households) have no idea what a Tetra Pack, thermoform, gable top etc. container is. These are industry and sector-specific terms that the general public may not be familiar with. As such, their use in recycling P&E advertisements seems inappropriate. With that being said, encouraging the recovery of these particular materials is necessary given that they are recycled at approximately 1/8th the rate of other Blue Box materials (newsprint, cardboard, aluminum, steel and glass) [1]. Developing effective P&E strategies to encourage the recovery of “fringe” materials is an issue that requires increased attention from municipal policy planners.

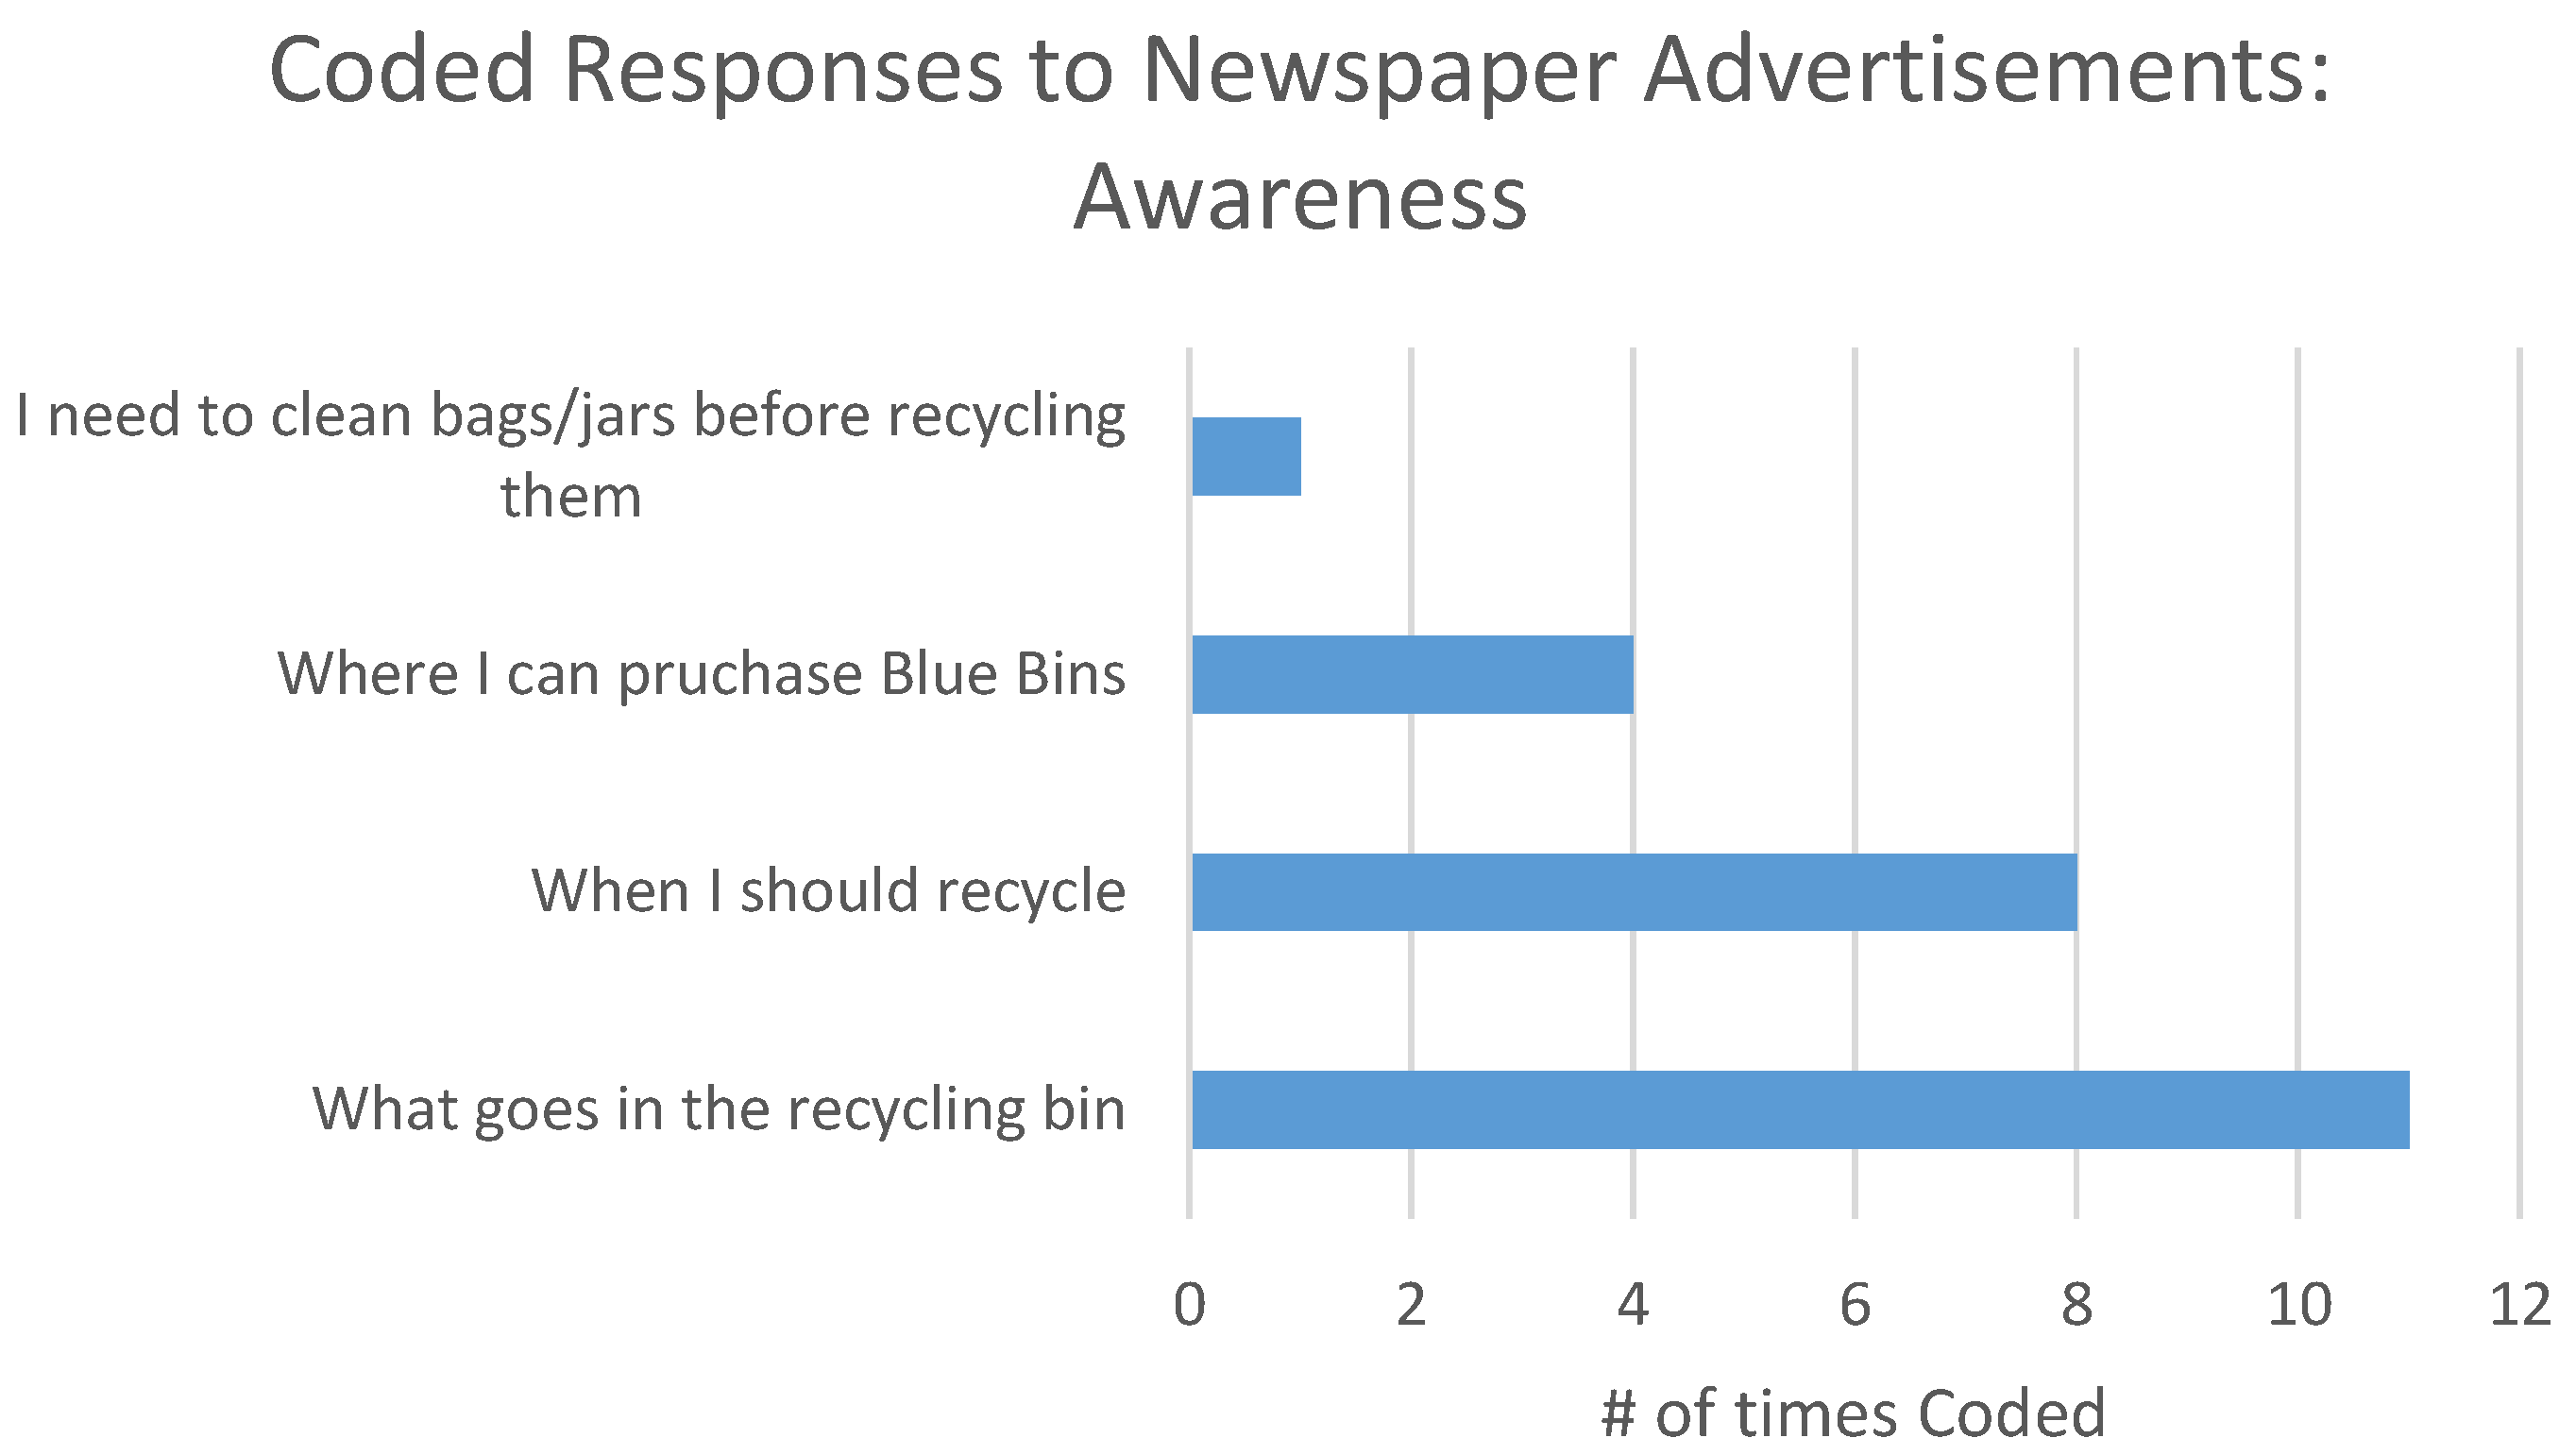
4.1.3. Ability to Increase Recycling Awareness and Modify Recycling Behavior

After providing focus groups approximately 30 min to review and respond to sample P&E messaging (asking them to comment on awareness and clarity), facilitators asked participants to comment on whether the sample promotion and education advertisements were likely to increase recycling awareness or modify recycling behavior. Given that this is the intended function of P&E messaging, it seems prudent that their efficacy, particularly for groups that are less inclined to participate in recycling initiatives, be tested.
  • Question 1: “Are you more likely to recycle because of the information contained in the sample advertisement?”
Overwhelmingly, focus group participants indicated that they would not recycle more as a result of the P&E advertisements they were shown (Some variation of the answer “no” was given 63 times). However, the reason for this was seemingly not attributed to the P&E advertisements being poorly designed or ineffective. The majority of focus group participants (75 of 77) indicated that they were already participating in their cities recycling programs, and as such, P&E advertisements encouraging them to recycle was unnecessary. This result is not consistent with our current understanding of existing levels of recycling participation among minority households, and exceeds the provincial average for all households by more than 10% [3]. While there is no way to confirm levels of recycling participation among focus group participants, there is a precedence in the literature for people to overstate their participation in a pro-social behavior such as recycling [23,24]. This issue is particularly acute in a group setting, where respondents may be less inclined to answer truthfully if they fear that they will be judged for their actions (or inaction in this particular instance)
  • Question 2: “Does the information presented in this advertisement raise your awareness about your municipalities recycling program?”
Only 14 of the 77 focus group participants indicated that the sample P&E newspaper advertisements increased levels of recycling awareness (versus 60 respondents who said “No” to the question, and 3 who said they weren’t sure). Figure 8 summarizes the distribution of coded response for respondents who answered yes during the sessions. “What goes in the bin” was coded 11 times (anecdotes provided during the focus group sessions indicate that households were surprised that grocery bags and detergent bottles were considered recyclable). “When I should recycle”, “Where Blue Bins could be purchased” and “Cleaning bags/jars” rounded out the answers provided by respondents. Of note, of the respondents who were made aware that additional Blue Bins could be purchased from the municipality, all indicated that were unwilling to do so. The sentiment was that if they were being forced to participate in source separation programs, they should not incur any additional expense beyond the time it takes to separate recyclables.

4.2. Response to P&E Signage
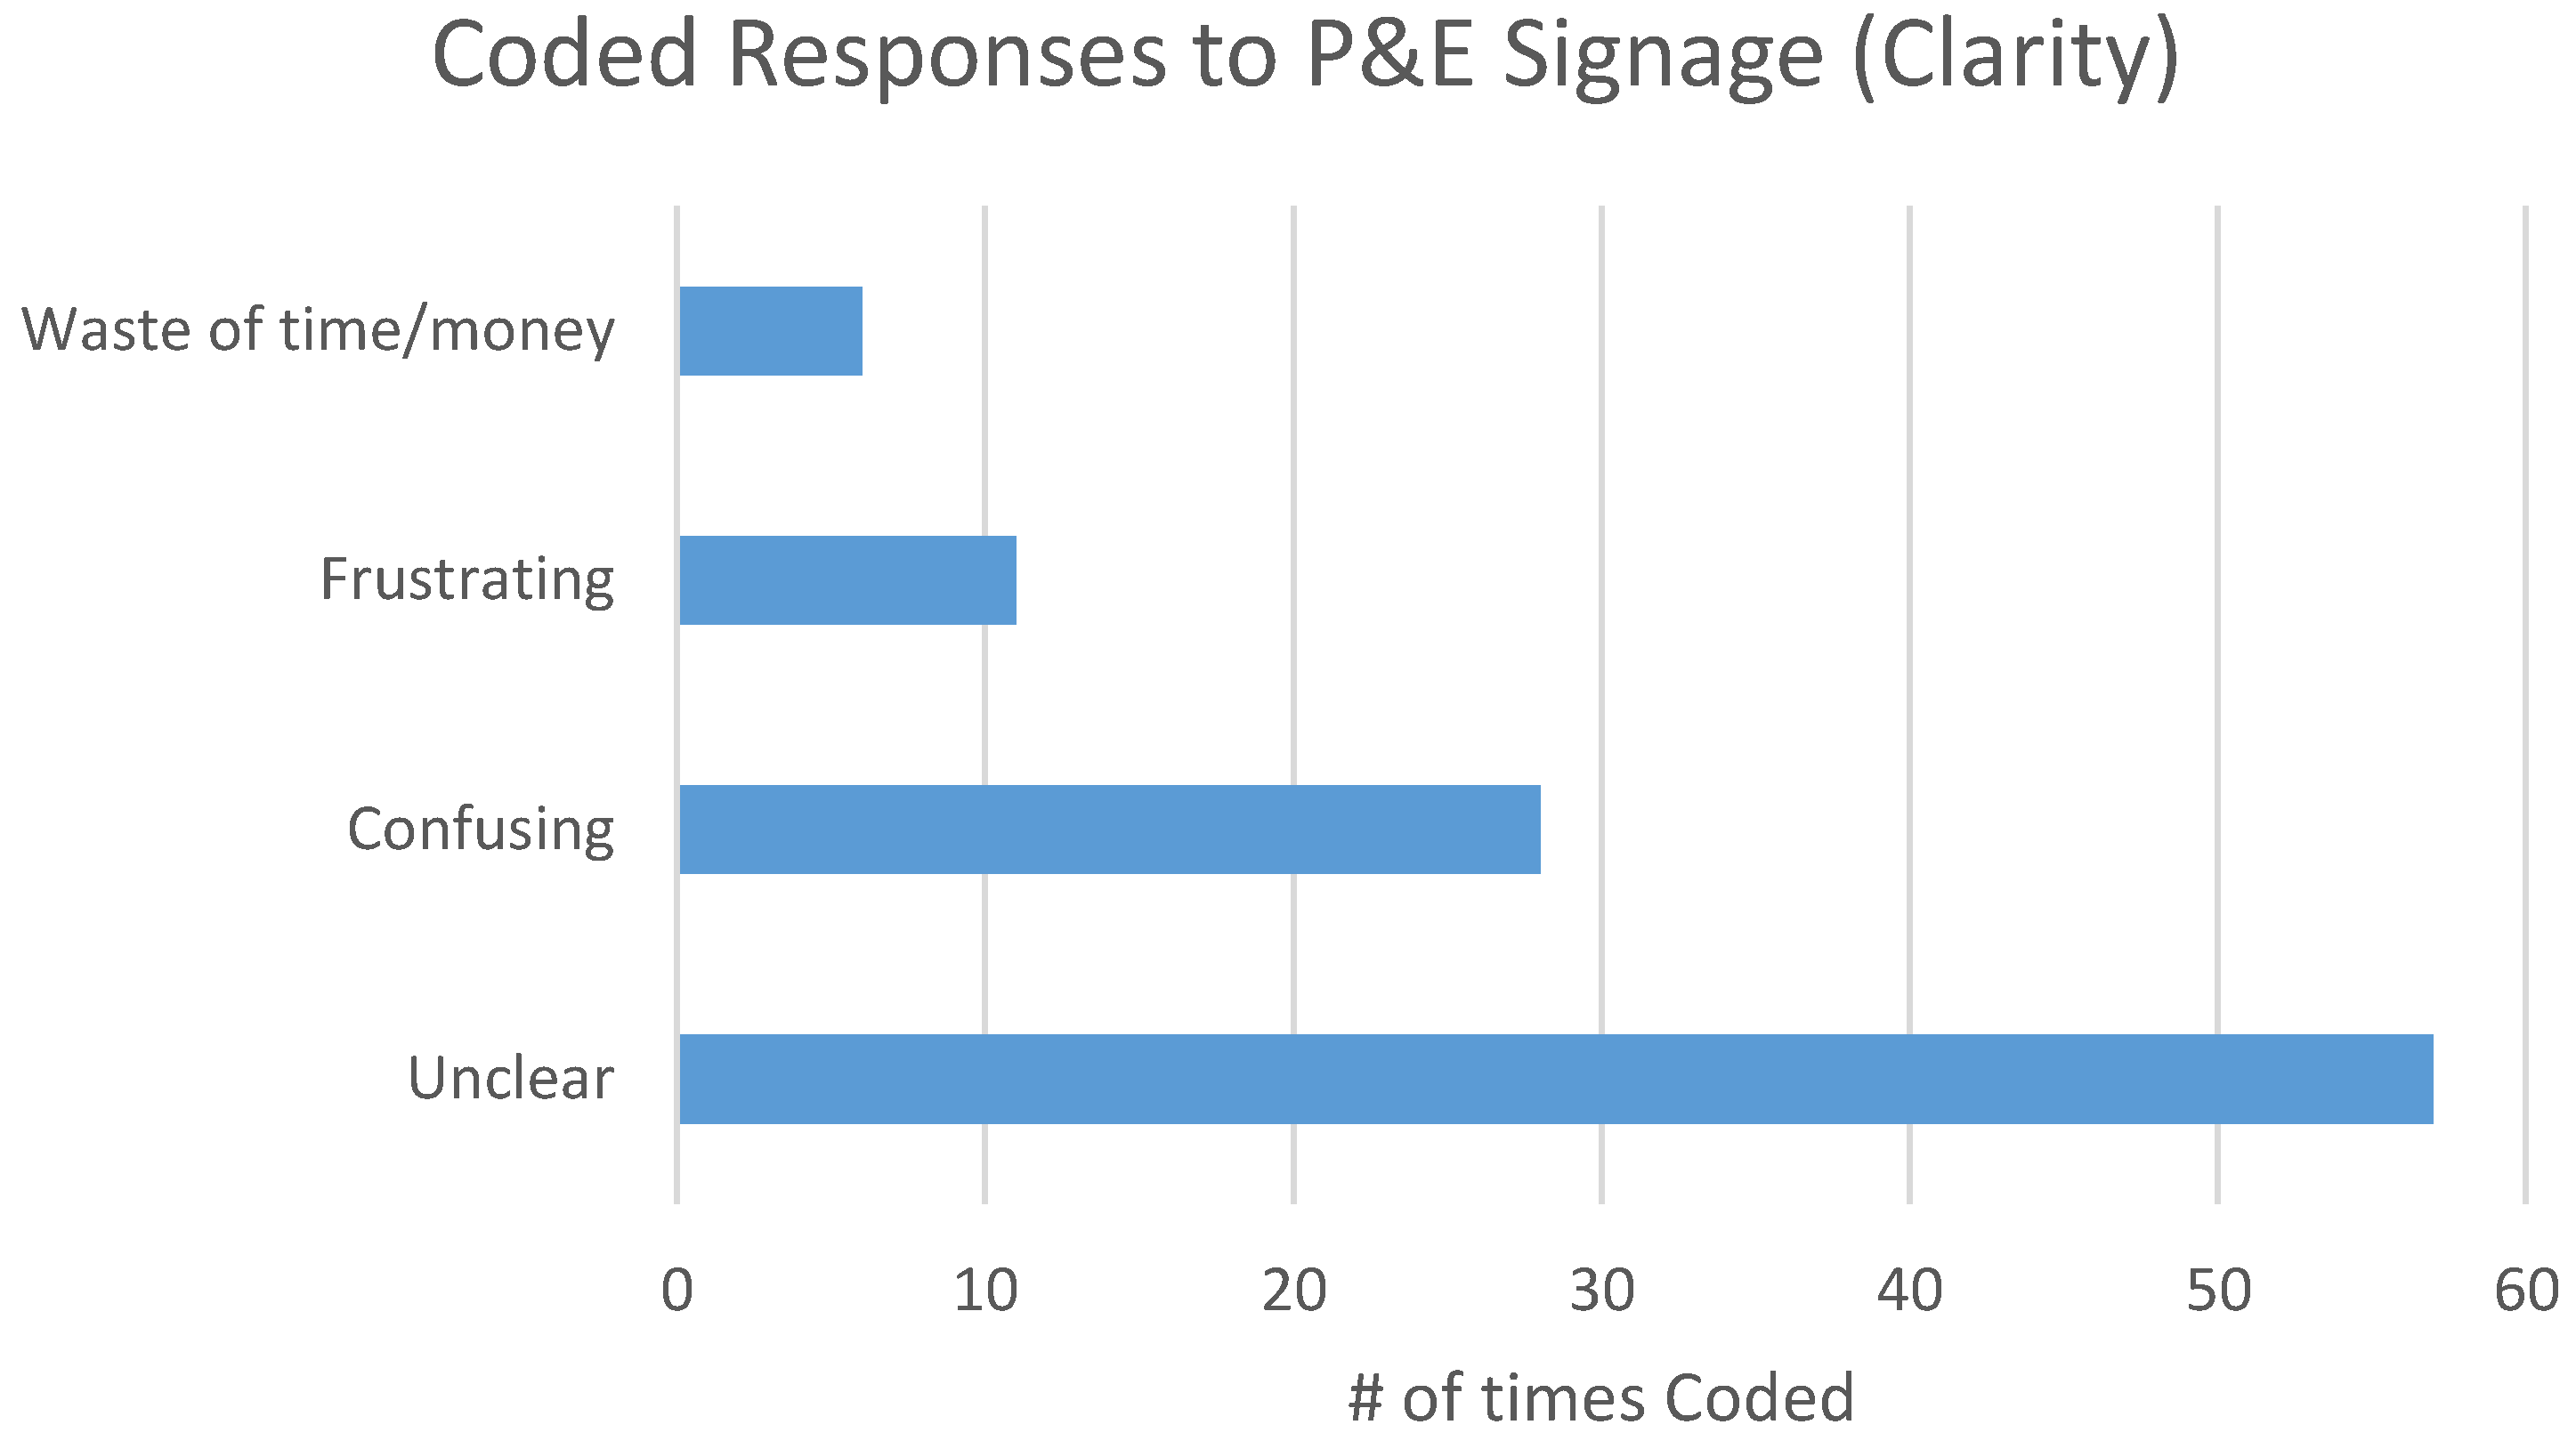
Figure 9, Figure 10 and Figure 11 are sample P&E advertisements presently found in the Greater Toronto Area. These signs are commonly found in subway and bus advertisements, transit shelters and other highly visible public areas. Unlike newspaper advertisements, P&E signage tends to be more visually oriented with far less accompanying text. The purpose is to capture the audience’s attention and communicate a clear and succinct message.
Each focus group was shown each of the above images for approximately 5 min, and provide feedback with respect to three of the four criteria listed in Section 4 (it was not possible to gauge levels of recognition with respect to P&E signage in a focus group setting—this is a potential limitation of this study. Gauging how often ethnic minorities notice P&E signage in a public setting would be useful in helping municipalities develop the most engaging and recognizable campaigns).

4.2.1. Clarity

  • Question 1: “What do you think these advertisements are asking you to do?”
The most frequently coded response during focus group sessions was “I don’t know” (coded 54 times). This result was somewhat unexpected, but not principally inconsistent with Lakhan’s previous study examining South Asian responses to P&E advertisement [3]. The Mobius loop/strip, which is featured prominently in each of the sample P&E signs currently used in the GTA, is not a readily recognizable symbol of recycling among ethnic minorities (despite previous expectations to the contrary). In two of the three poster samples, no mention of the word “recycling” was even used—the signs consisted of a picture of the Mobius loop with little to no accompanying text. While prominently displayed in most recycling schemes in North America and Europe, the symbol is not associated with recycling or the environment in other areas. Anecdotes provided during focus group sessions suggested that many had never seen the Mobius loop outside of having their Blue Boxes being branded with the symbol. Even then, most assumed that the Mobius loops was a “municipal symbol” as opposed to one communicating the reduce, reuse and recycle mantra.
21 study participants reported “Recycle More” when asked to respond to the purpose of the P&E signage. Of note, 17 of the 21 respondents did not know that these advertisements were specific to the Blue Box program. Given that the sample P&E signs did not specifically refer to the Blue Box or printed paper and packaging materials, respondents assumed that this was a general message to promote all recycling. This might serve as a useful insight for municipal policy planners, who may be able to maximize investments in recycling P&E by creating “general recycling messages/branding” as opposed to material/stream-specific messaging. At present, each of Ontario’s stewardship programs (Used Tires, Waste Electronics, Hazardous Waste and Printed Paper and Packaging) are responsible for financing, designing, and delivering their own P&E materials. While this is an obvious necessity given the very different nature in which these material streams are collected and managed within the system, a unified P&E campaign that creates a stronger link between the importance of recycling and sustainability may be a useful initiative. As noted by Lakhan, the motivation for recycling among first-generation ethnic minorities is largely driven by a perceived legal obligation [3]. The importance of recycling with respect to promoting resource conservation and environmental stewardship is not seen as being a primary motivator of recycling among first-generation ethnic minorities in Ontario.
  • Question 2: “Is the information presented in this advertisement clear and easy to understand?”
Consistent with the findings from the previous question, 57 respondents indicated that sample P&E signage was not clear or easy to understand. Given that the Mobius loop featured so prominently in the sample signs, and that so few respondents associated the Mobius loop with recycling activity, most respondents did not know what the purpose of the advertisement was. The accompanying text of “Get with the program” was also a source of confusion among focus group participants, in that they did not know what “the program” was referring to. Anecdotes provided during focus sessions suggest that this was actually a point of aggravation among study participants—in 6 instances, a variation of the phrase “Wasting my/tax payer’s money” was used to describe P&E signage. An illustration of coded responses can be found in Figure 12. An unexpected theme that emerged during focus group sessions is that there appears to be an antagonistic view of municipalities among ethnic minorities. While this will be elaborated on in Section 4.4, the notion that “municipalities could not be trusted” was a recurring topic during sessions.
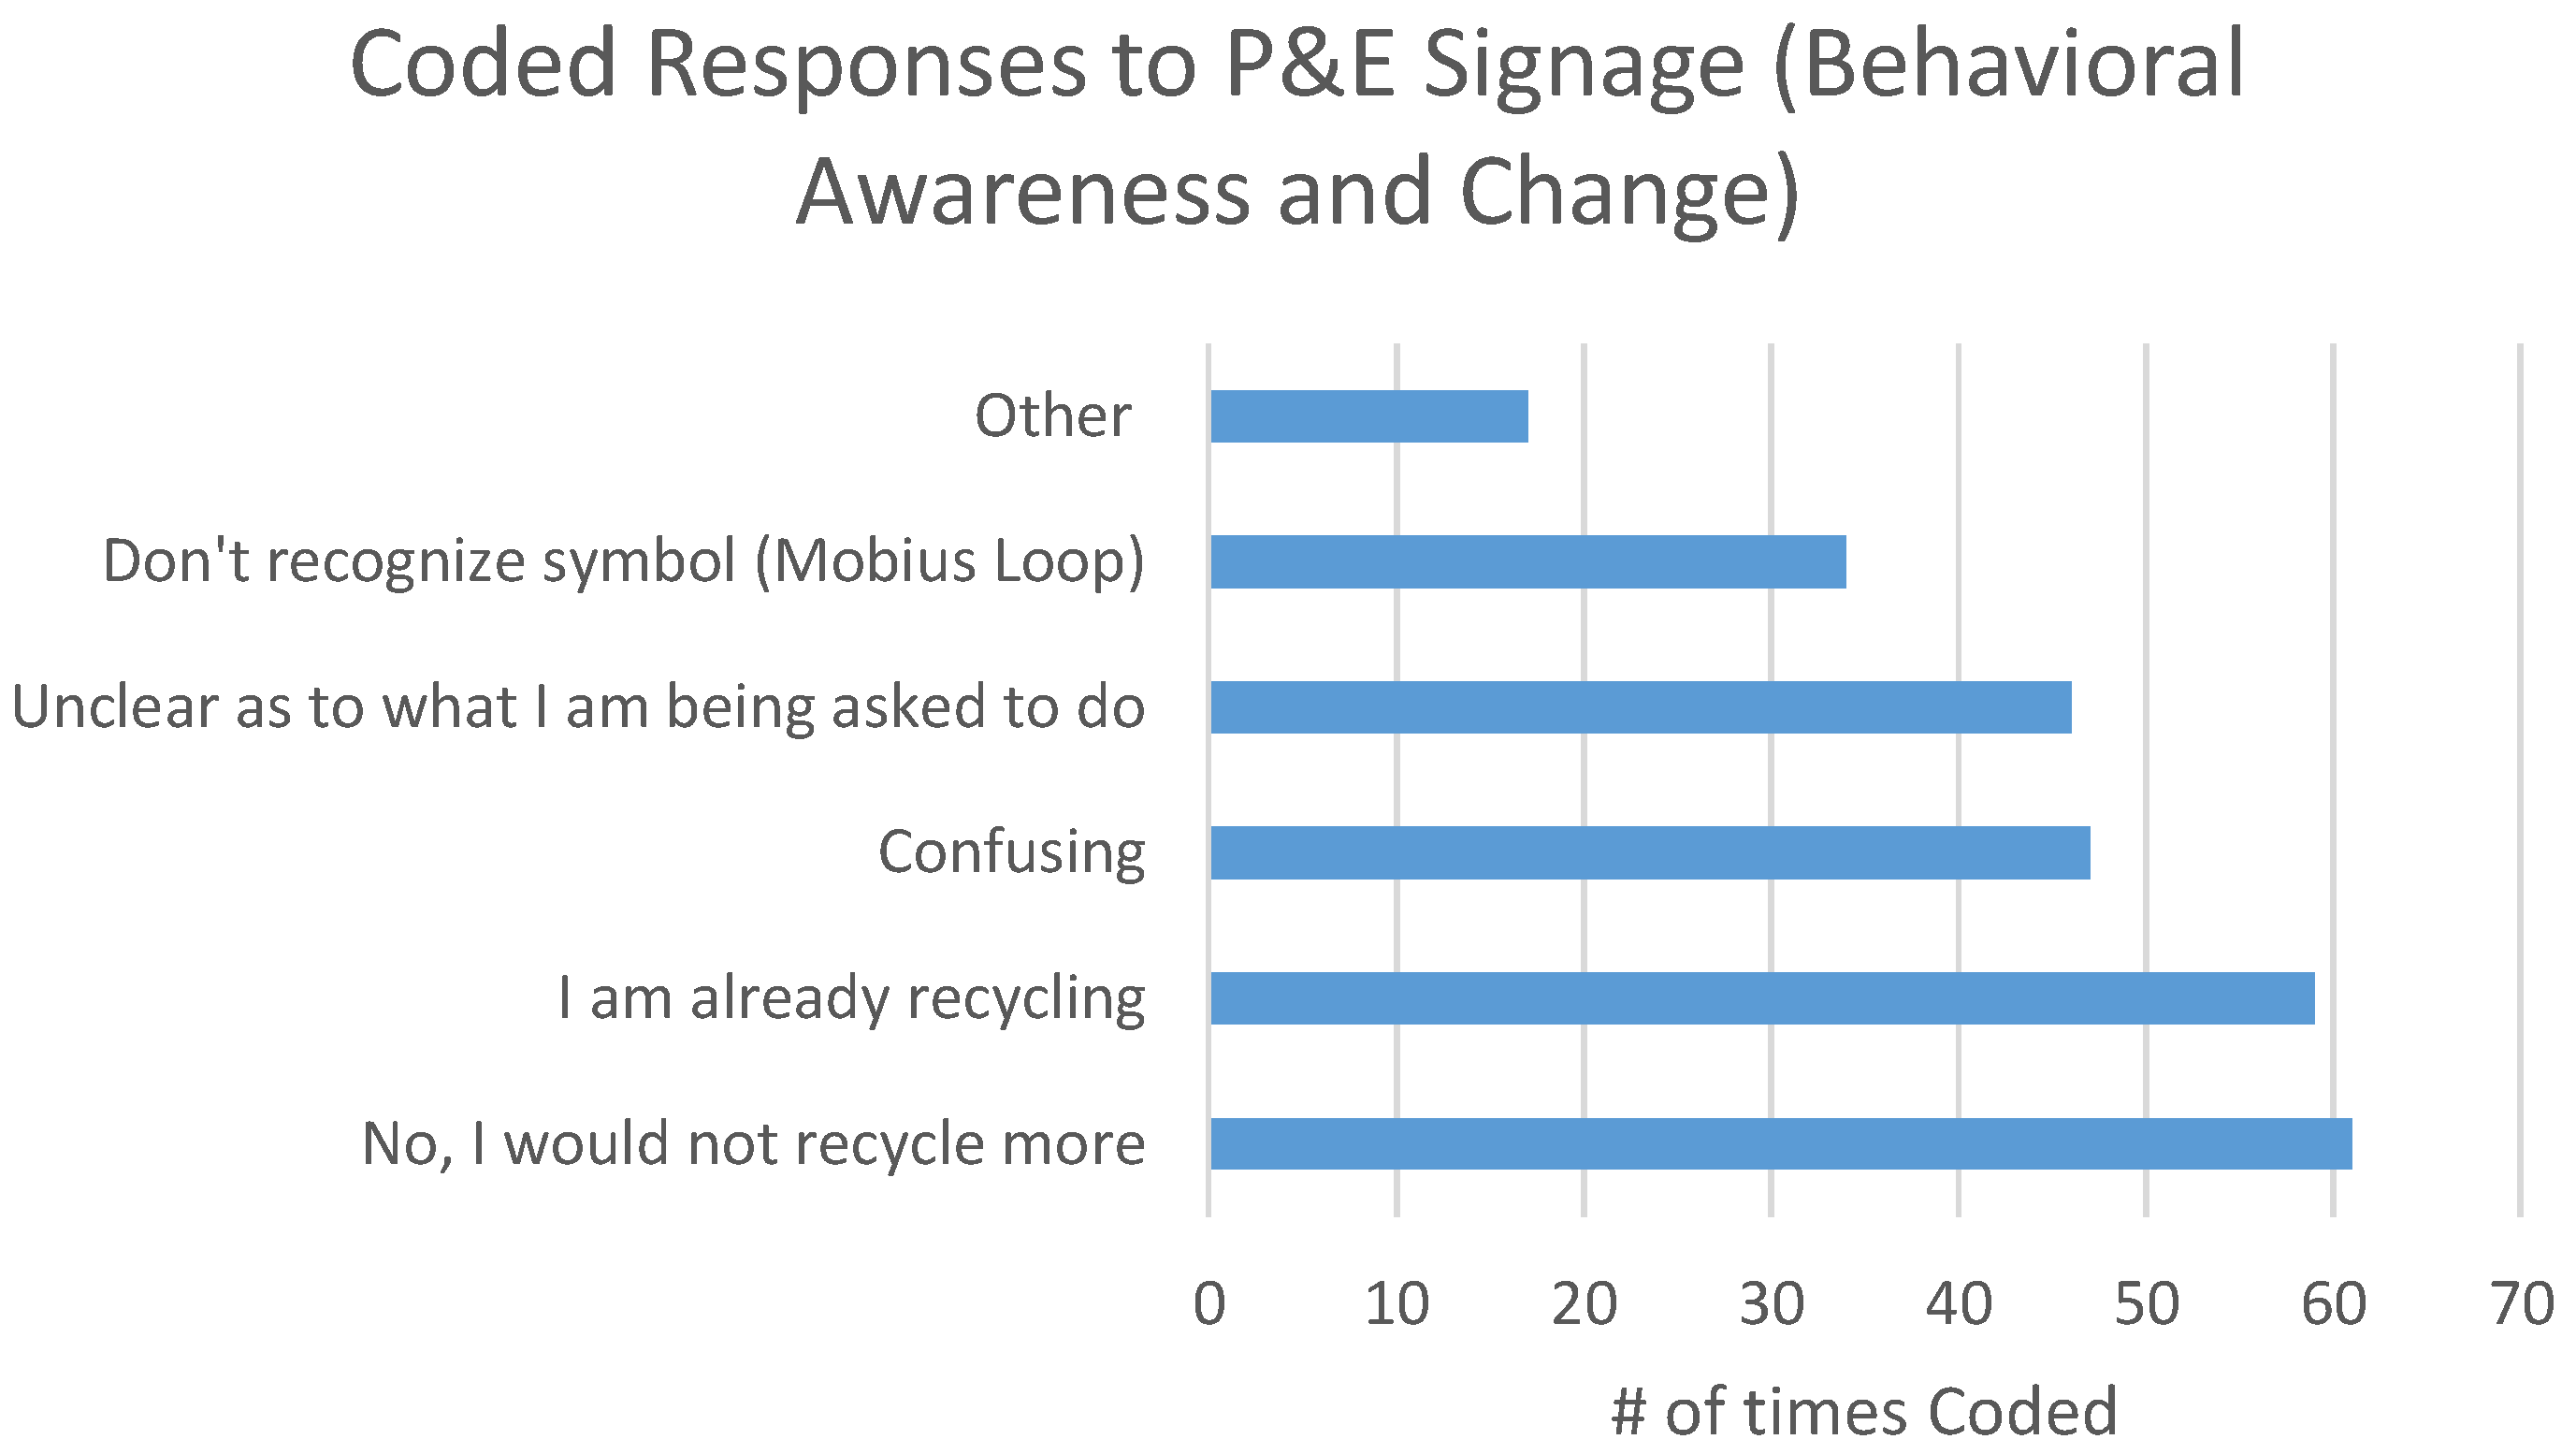
  • Question 3: “Are you more likely to recycle because of the information contained in the sample advertisement?”
  • Question 4: “Does the information presented in this advertisement raise your awareness about your municipalities recycling program?”
The results for questions pertaining to behavioral change and recycling awareness were combined, as in both instances, there was almost universal consensus among study participants that (a) they would not recycle more as a result of the advertisements and (b) recycling awareness did not increase as a result of advertisements (full results of coded responses shown in Figure 13). Once again, this failure to respond to sample P&E signage is attributed to the lack of clarity with respect to what the Mobius loop symbolizes. Without stronger linkages between P&E signage and what the municipality is asking households to do, the message is ultimately lost on ethnic minorities. With that being said, designing more prescriptive/detailed P&E signage is often more challenging relative to other P&E mediums (such as newspapers and online resources). As noted in Section 4.2, P&E signs are not designed to be “text heavy”. Visuals and symbols are often used in lieu of written content to deliver the intended message—while this has proven to be an effective method in Read’s examination of recycling P&E in England [25], effectiveness of P&E signs is predicated on audience recognition of the visuals contained within the advertisement. In the absence of recognition, P&E signage does not engage or resonate with the intended audience in any meaningful way.

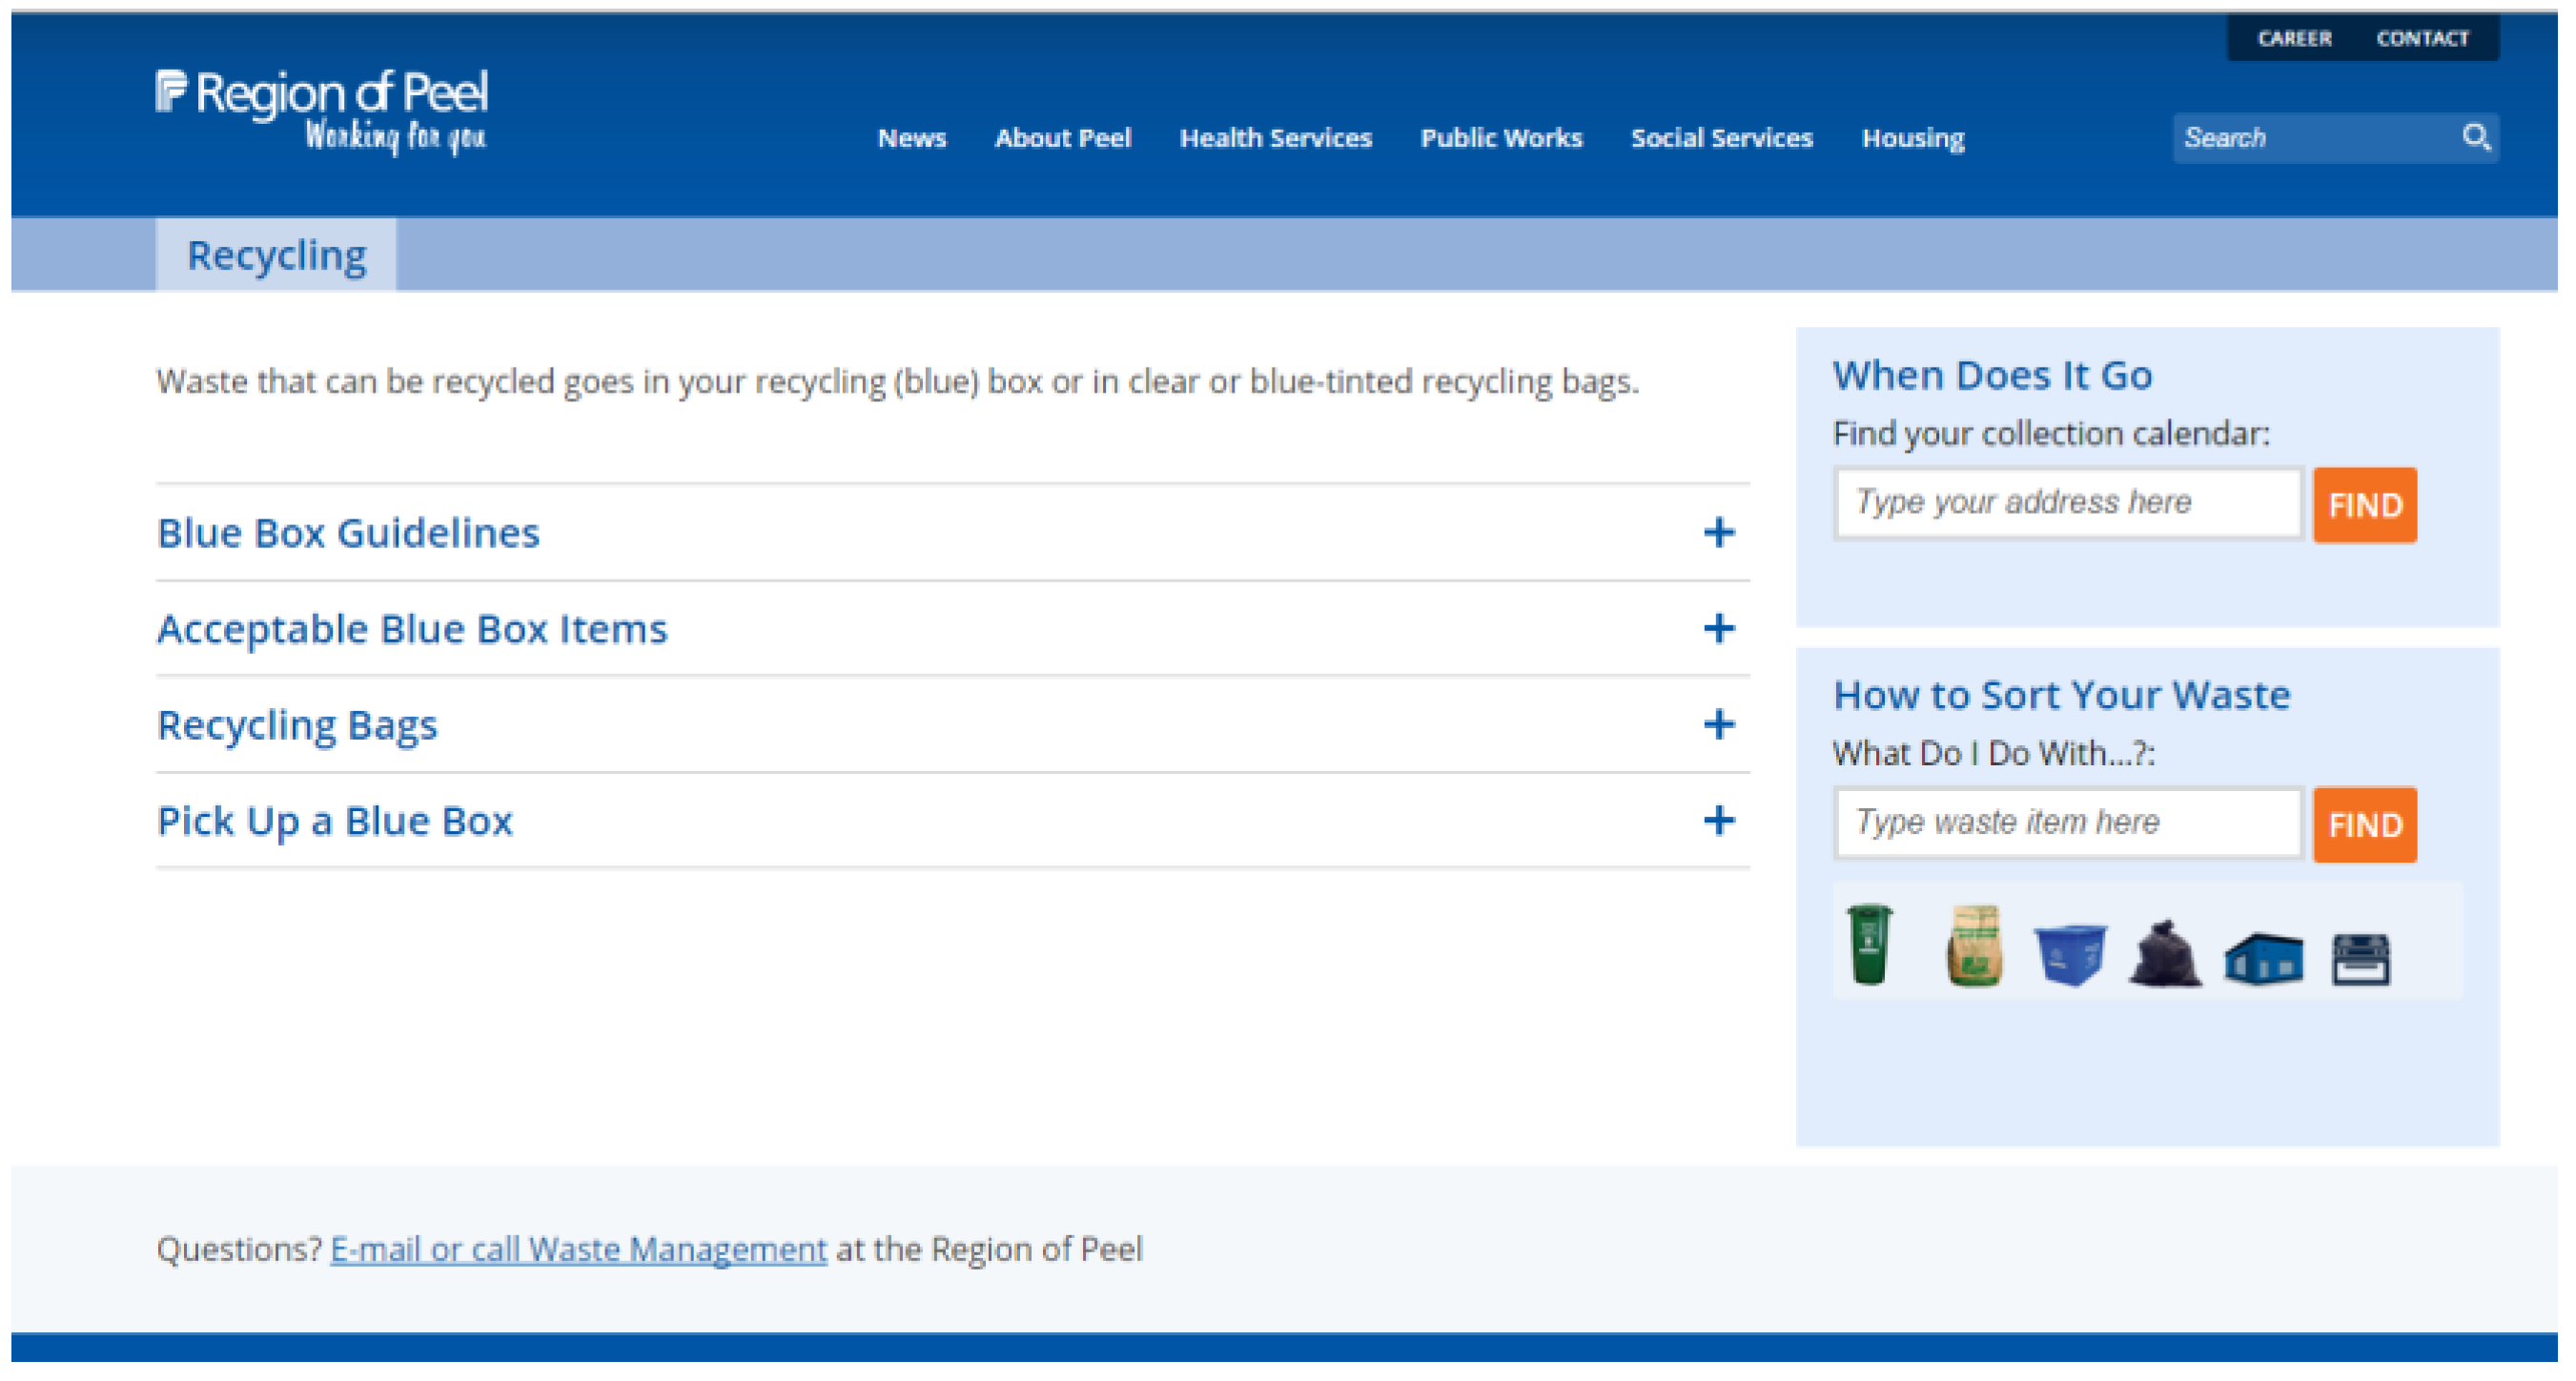
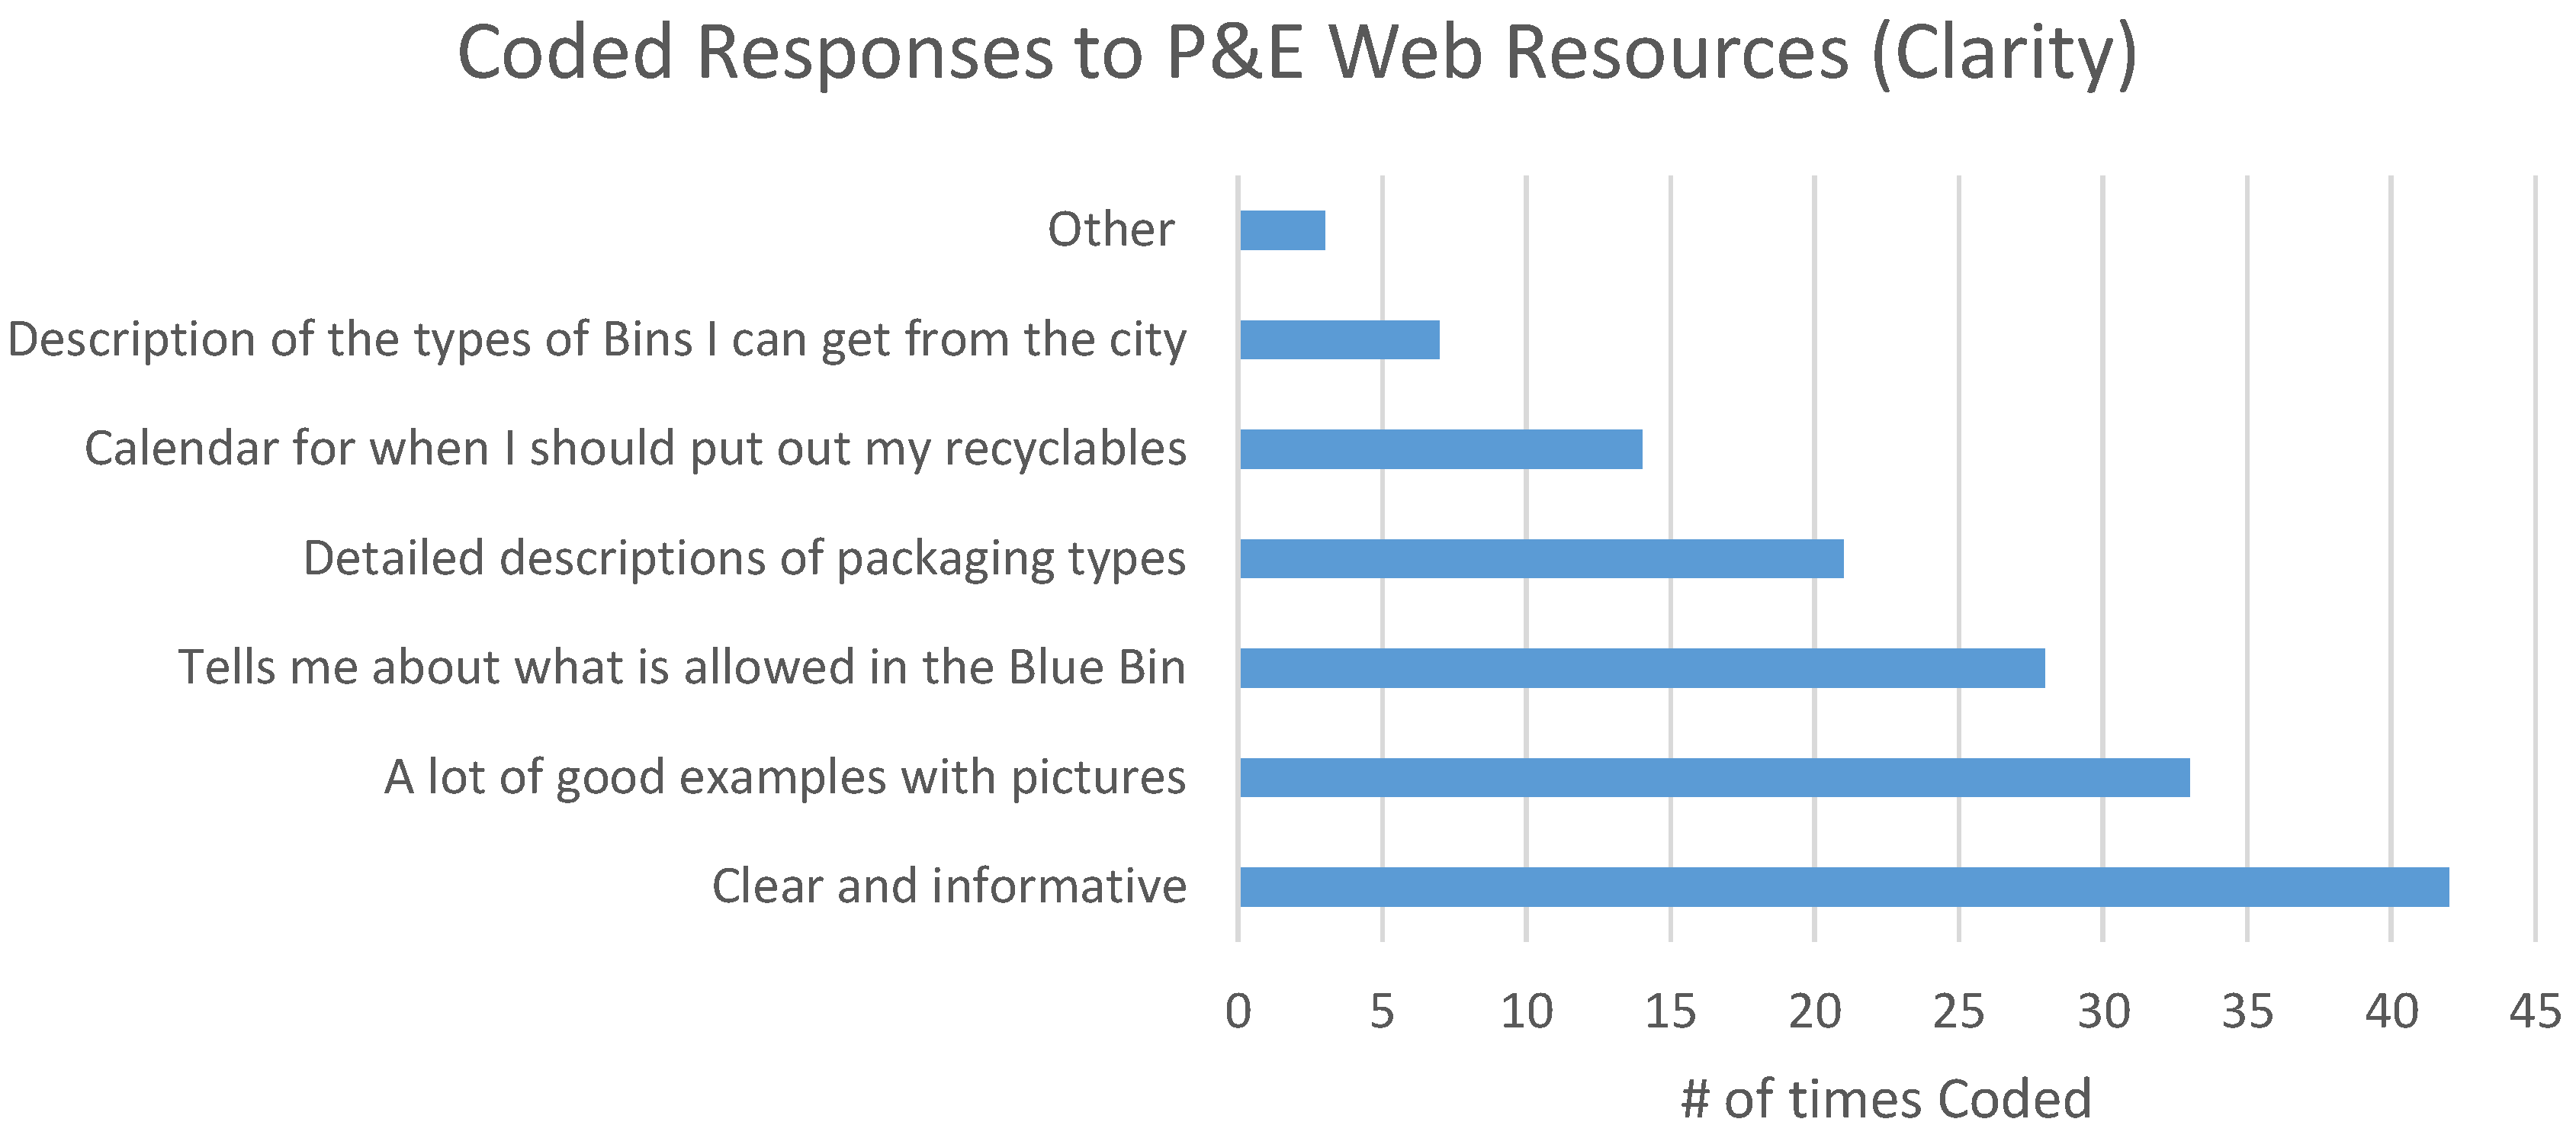
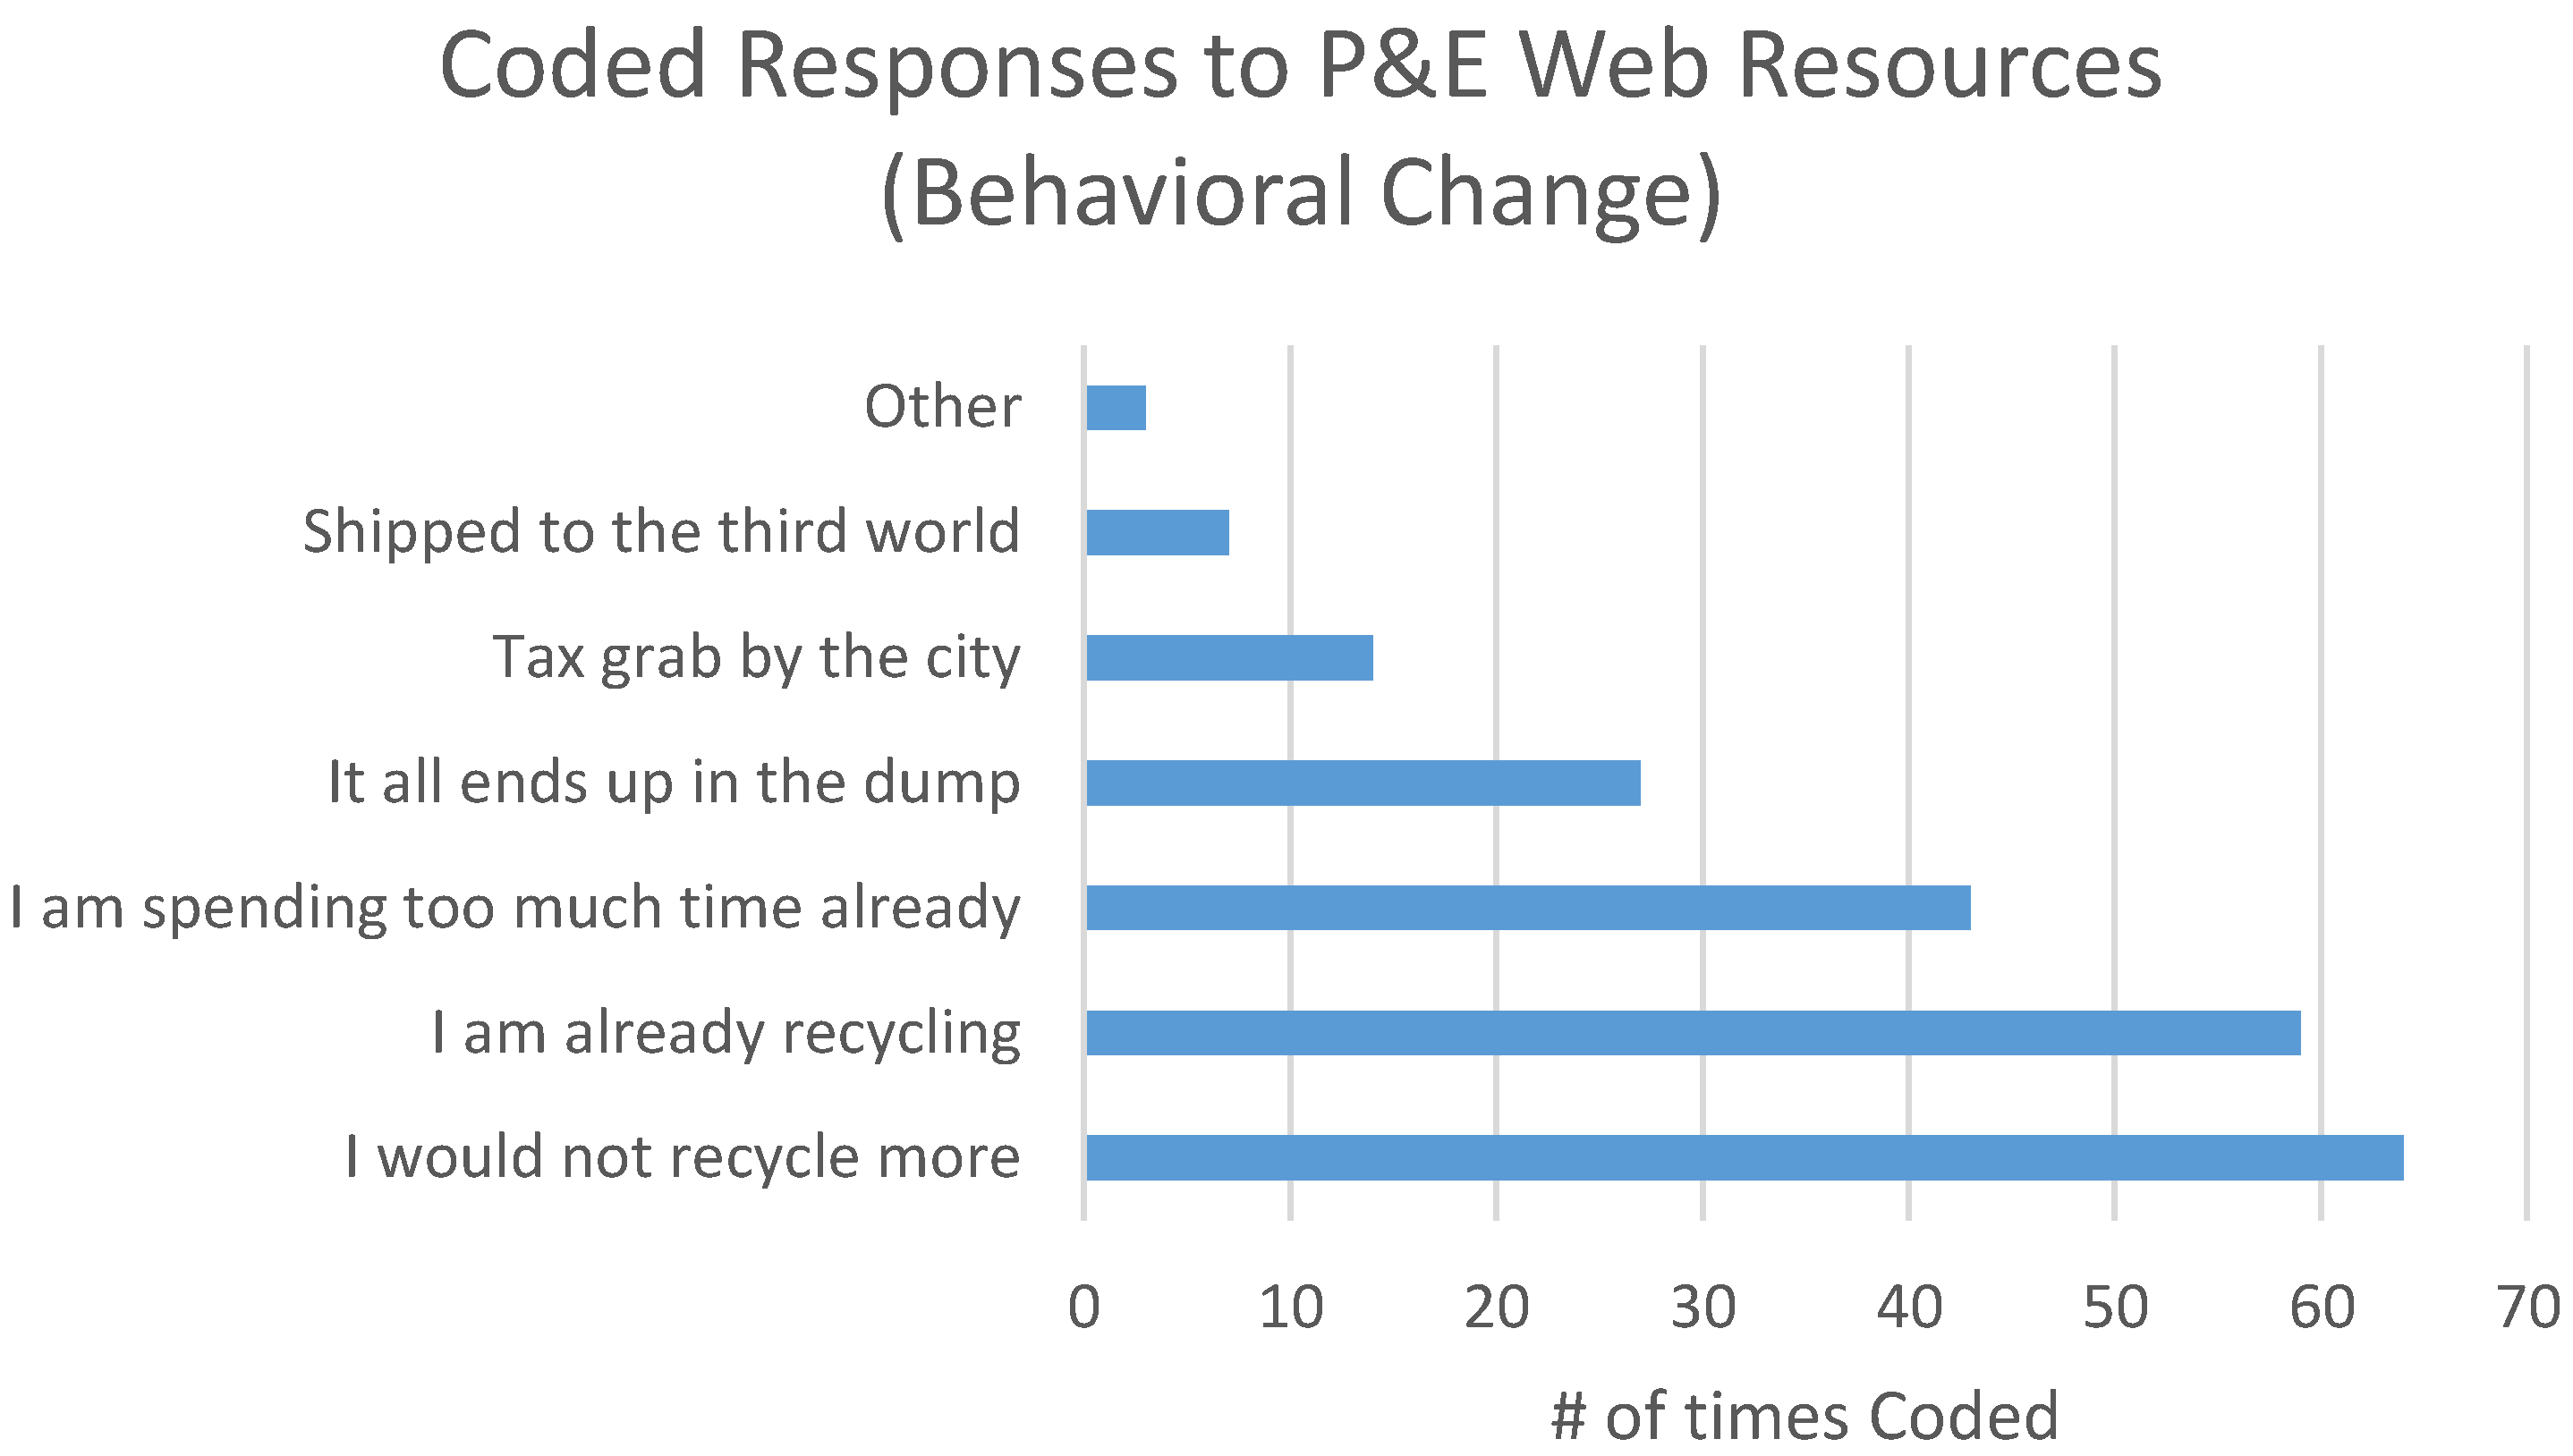
4.3. Response to P&E Web Resources

Figure 14, Figure 15 and Figure 16 are sample screenshots of municipal web sites describing the region’s waste management programs, recycling initiatives and news updates regarding garbage and recycling pickup.
Each member of the focus group was provided with a laptop to navigate P&E web resources. Participants were given 20 min (total) to navigate and review each of the municipal web sites. Facilitators were instructed to observe the focus groups, record the time it took for each participant to find the correct online resource, and tell participants when to switch to a different municipalities web site. Recording participant times (to find the correct resource) was not officially used in the analysis, and was only used as a “check” to see if participants were successfully able to navigate to the website and were answering truthfully when asked if they were able to do so. As a means to avoid (or at the very least, control) for study participants misreporting, the times recorded by facilitators would be used to verify the answers provided during focus group sessions.
Each of the websites shown to focus groups could be translated in up to 14 different languages using the built in “Google Translate” feature. This allowed study participants to select the language they were most comfortable using.
Focus groups were asked to comment on ease of access, clarity, and perceived effectiveness of P&E web resources. Of note, testing for recognition was replaced by “ease of access” when gauging the efficacy of P&E web resources. Focus groups were asked to navigate to the “waste management” section of the municipality’s web site from the city’s home page. Unlike newspaper and print media, there are no specific online advertisements related to recycling promotion and education. Municipalities devote specific sections of their web sites to issues related to regional waste management and recycling. Thus, recognition is not an appropriate measure of P&E effectiveness with respect to online resources.

4.3.1. Ease of Access

  • Question 1: “How easy was it for you to find the city’s web site on waste management and recycling?”
This question had to be revised several times during pre-testing, as there was initially some confusion regarding what constitutes “easy” or “difficult” (the original phrasing of the question asked participants to comment on whether it was difficult to find the waste management web page). Other alternatives that had been tested include “did it take you a long time to find the web page?”—the inherently subjective assessment of difficulty and time made it difficult for pre-test participants to accurately answer the question. Also, pre-test participants expressed concerns over being judged if they answered that it was difficult for them to find the web page (tacitly implying that they were not technologically savvy). For this reason, the term “easy” was used (in lieu of difficult or time consuming), as it was a value positive statement. Though this did not overcome the issue of subjectivity, pre-test participants viewed this statement more favorably relative to other alternative phrasing.
48 of 77 focus group participants expressed difficulty in navigating to and within municipal waste websites (commonly coded phrases included “It’s hard to find the information I’m looking for”). This result was consistent with the timed observations recorded by facilitators. The mean time for survey participants to navigate from the municipal home page to the waste management resource page was 4.4 min. In 26 instances, focus group participants were unable to successfully locate one or more of the waste management resource pages.
The second most frequently coded response for this question was that the municipality’s web pages were often translated incorrectly (coded 33 times), making it difficult to locate the appropriate waste related resource. While the Google translate feature was available on each of the municipal web sites, the translation was often inaccurate (mistranslated words and phrases, grammar, etc.). 24 study participants indicated that this was actually insulting to them—anecdotes recorded during the sessions include “If you’re not going to do it properly, don’t bother doing it at all” and “It shows how much they (the municipality) care about us”. The notion of “us” and “them” was a recurring theme during the focus group sessions. There was a sentiment that municipalities catered to “white” households and ignored (or placed less emphasis on) the needs of ethnic minorities.
Some participants felt that the areas they lived in received inferior and/or less frequent waste management services. Personal anecdotes of “Garbage is piling up in my building, but the city does nothing” and “I called the city about what to do with my television, and they said I would have to take it to the recycling center. They picked up my (white) neighbors old television though”. It is important to highlight that the potential reasons for a perceived lack of service are unlikely (or at least, not readily apparent) to be motivated by racial bias on the part of the municipality. In the two anecdotes provided above, both can explained by either infrastructural impediments/deficiencies (i.e., building/property managers are required to arrange garbage collection with either the municipality or a private contractor; many buildings do not have an area specifically designated for recyclable materials generated by multi residential households) and a lack of understanding about how programs are operated (no municipality in the Greater Toronto Area will collect waste electronics directly from households—however, households may arrange for a private service provider to collect waste electronics curbside for a fee). Facilitators were instructed to provide no input during the session, so no attempts were made to clarify these misconceptions.
With the above in mind, the topic of potential racial bias in the delivery of municipal services is a topic deserving of continued investigation. As noted by [26,27], the marginalization of ethnic minorities is closely tied to socioeconomic inequality, so it is difficult to divorce the issue of perceived lack of waste management services (on the part of visible minorities) from issues related to institutional racism and discrimination.
  • Question 2: “Is the information on the website clear and easy to understand?”
Generally speaking, the content contained on municipal web pages were considered clear and easy to understand (responses indicating agreement with the statement were coded 42 times). Despite the challenges in finding the waste resources website and issues surrounding mistranslation, study participants found that web sites provided more detailed content relative to other forms of recycling P&E being tested. Positive comments with respect to “What goes in the Blue Bin” and “Description of the different types of packaging material” were coded 28 and 21 times respectively (see Figure 17 for distribution of all coded responses). Unlike newspaper advertisements and P&E signage, municipal web sites can provide more detailed descriptions and examples to inform readers/viewers.
  • Question 3: “Does the information presented in this advertisement raise your awareness about your municipalities recycling program?”
As observed in Question 2, focus group participants indicated that online resources were more informative relative to other mediums of P&E, and as a result, significantly increased recycling awareness (coded 45 times). Participants indicated that the accompanying visual examples on the website (e.g., pictures of various types of packaging, examples of how to properly wash jars and bottles before putting it in the Blue Box, etc.) were useful in helping increase recycling awareness (the how and where to recycle). However, 16 respondents indicated that online resources did not increase recycling awareness in any meaningful way. Anecdotes noted during the sessions indicate that a language barrier was the primary impediment to increasing awareness among participants who responded “No” to this question. As noted previously, while the Google translate feature was available on the website, mistranslations resulted in confusion among some focus group participants. Municipalities also have a propensity to use sector-specific terms in P&E messaging, i.e., describing juice boxes as Tetrapacks or Asceptic Cartons, or laundry detergent as high density polyethylene, etc. These terms often confused study participants, which is perhaps why visual examples proved so successful in raising awareness. A person may not know what a spiral wound container is, but they recognize the product when shown a picture of it.
  • Question 4: “Are you more likely to recycle because of the information contained in the sample advertisement?”
Perhaps the most interesting finding from this part of the focus group sessions is that despite increased recycling awareness, 64 of the 77 study participants said that they would not recycle more as a result of online P&E resources. Once again, the majority of respondents said that they were already recycling, and did not necessarily see the purpose of P&E initiatives. As shown in Figure 18, coded responses from the focus group sessions include “I am already recycling” (coded 59 times), “I’m not going to spend more time than I already am” (coded 43 times) and “It’s all just going to end up in the dump anyways” (coded 27 times). The last comment was of particular interest, in that there was a perception among focus group participants that the city was not actually recycling the material that they collected. A number of respondents were under the impression that the municipality charged residents for recyclables collection (as a tax grab), but secretly sent the material to landfills. In 7 instances, respondents thought that garbage was being shipped overseas to developing countries. Once again, facilitators were instructed not to correct these misconceptions. One respondent indicated that “back home, I would see big shipments of garbage come from other countries and be dumped in open pits”. This practice is expressly forbidden in Ontario; as municipal household waste cannot be shipped outside of the province. Why study participants feel this way, and whether these reflect the attitudes and opinions for ethnic minorities as a whole remains a curiosity and a topic worthy of additional investigation.

4.4. General Findings from Focus Groups

Of note, there was very little variation with respect to recognition, message retention and ability to affect behavioral change, irrespective of the medium used. In many instances, participants failed to identify the central “message” and “purpose” of P&E campaigns, and reported that existing P&E campaigns would not alter existing waste management practices in any meaningful way. Anecdotes provided during focus group sessions suggested that participants did not fully understand the “Why”? of the message—they are being asked to recycle, but for what purpose (no clear linkages between recycling and the environment/sustainability)? As a tangent to this point, many participants indicated that they would like to know more about what happens to their recyclables once collected by the municipality. “Intense Skepticism/Distrust” could be used to characterize the relationship between minority households and the municipality. As noted in Section 4.3, some respondents seemed to think that the municipality would just throw all collected material in a landfill, or alternatively, ship waste to developing/third world economies. Preliminary evidence from the focus group seems to suggest that P&E messaging fails as visible minorities are ambivalent/unsure about the municipality’s intentions. Stated alternatively, minority groups do not view the municipality as a “trusted authority” on waste related issues. This begs the question, who would these groups trust?
While not originally included in the scope of focus group topics and related questions, after the first round of sessions, the survey was amended to ask participants “Who would you most likely influence your decision to recycle or participate in recycling programs?” Religious/community leaders, family, friends and extended community network were the most frequently coded answers. More than 80% of focus group participants who were asked the question said that they would recycle more if a religious authority instructed them to do so (priest, pundit, imam, etc.). It would appear that with respect to recycling promotion and education, it is not necessarily the message that is most important, but the person/group delivering it. This suggests that alternative methods of recycling promotion and education delivery be explored. Engaging community partners in designing and delivering P&E campaigns may be a more effective method for encouraging household recycling participation among first-generation visible minority groups. This is a topic that requires significant attention, as to date, municipalities have been responsible for the design and delivery of recycling P&E services. However, if the above findings can be substantiated, it would suggest that community groups are better equipped to deliver targeted and relevant P&E messaging (with respect to recycling) relative to the municipality. A preferable solution may be for municipalities to partner with community groups, providing them with the necessary resources and support to design the most effective (and engaging) P&E campaigns possible.

5. Conclusions

This study examined how first-generation ethnic minorities respond to different types of recycling promotion and education initiatives, including both through print (newspaper and signs) and electronic (websites) media. Using data collected from eight focus group sessions conducted across three major Canadian cities, it was found that none of the promotion and education campaigns (P&E) mediums being tested (newsprint, signs and websites) were able to increase recycling awareness or alter recycling behavior. Results from focus group sessions suggest that visible minorities struggle with message recognition and retention, and have difficulty with sector-specific terminology used by municipalities to describe packaging material. Respondents also indicated that they were not familiar with symbols commonly found in existing P&E advertisements (i.e., the “Mobius loop”), which impeded the clarity of the message (and subsequently had little effect on levels of recycling awareness). Other salient findings gleaned from open-ended interview questions suggest that ethnic minorities are skeptical of the municipalities’ intentions with respect to what they do with the waste and why they are asking households to recycle. Comments suggesting that the quality of waste management services was somehow “racialized” (wherein visible minorities receive fewer or inferior services) were also made by several respondents during focus group sessions. Perhaps the most interesting finding from the focus groups is that the type of P&E initiative (whether a newspaper advertisement, poster, or sign, etc.) may not matter when it comes to engaging first-generation ethnic minorities. Who delivers the message with respect to the “what, where and why?” of recycling appeared to matter more than the medium of P&E used. Community leaders were viewed more favorably (relative to the municipality) when respondents were asked to indicate who they were likely to listen to with respect to waste management programs and policies.
This study highlights the need for municipal waste managers to rethink existing approaches towards recycling promotion and education, particularly when attempting to engage minority communities. While recycling P&E has been demonstrably successful in encouraging household recycling participation during a program’s onset, subsequent analysis suggests that Ontario’s P&E approaches need to be revisited. Investments in recycling P&E do not lead to appreciable increases in municipal recycling rates in Ontario [6]. Further underscoring this point, existing methods of recycling P&E fail to encourage recycling behavior or increase recycling awareness among first-generation ethnic minorities. While these findings point to a lack of promotion and education effectiveness, they do not necessarily suggest that recycling P&E initiatives should be eliminated. Recycling P&E clearly has its place in every municipal waste manager’s tool box, but the central message (and the target audience) needs to be changed. The message about the “the importance of recycling” is already out in Ontario—for second- and third-generation Ontarians who have grown up with the Blue Box program, recycling is largely habitual. However, the types of material being recovered and the demography of the households participating in the program remain largely unchanged over time. If Ontario hopes to improve incremental diversion, recycling promotion and education will need to be tailored to target specific materials (which are not presently being recovered, i.e., composite packaging, other plastics) and new Ontarians (first-generation ethnic minorities and their families). As this study has illustrated, this may be easier said than done—all prior forms of recycling promotion and education tested did not resonate with focus group participants in any meaningful way. However, this may be an opportunity for the province to adopt new and innovative approaches to recycling P&E messaging and delivery. Ontario’s situation is not unique—first-generation ethnic minorities are making up an increasingly larger share of urban populations across the country. As such, now more than ever, there is a need to “think outside the box” and develop campaigns that communicate the what, when, where and why of recycling in a culturally relevant way. There exist significant barriers in encouraging first-generation ethnic minorities to recycle, but there is also a great opportunity to galvinize millions of new Canadians to reduce, reuse and recycle. The “next tonne” will not come from Mr. and Mrs. Smith living in a single-family house in the suburbs—instead, it is likely to come from Mr. and Mrs. Singh living in the multi-residential apartment in the city’s core.

Acknowledgments

The author would like to acknowledge the assistance of Scott Slocombe for his assistance and guidance throughout this study. This study did not receive funding from any external agencies.

Conflicts of Interest

The author declares no conflict of interest.

References

  1. Waste Diversion Ontario. “Blue Box Tonnage Highlights and Summary.” 2014. Available online http://www.wdo.ca/content/?path=page82+item35931 (accessed on 6 May 2015).
  2. Stats Canada. “2011 Canadian Census.” 2011. Available online: http://www12.statcan.gc.ca/census-recensement/index-eng.cfm (accessed on 7 May 2015).
  3. Calvin Lakhan. “Differences in self reported recycling behavior among first and second generation South Asians in Ontario.” Resource Conservation and Recycling 4 (2015): 34–43. [Google Scholar]
  4. Martin Medina. The World’s Scavengers: Salvaging for Sustainable Consumption and Production. Lanham: AltaMira Press, 2007. [Google Scholar]
  5. Stewardship Ontario. “Blue Box Program Enhancement and Best Practice Assessment Project.” 2007. Available online: http://www.stewardshipontario.ca/bluebox/pdf/eefund/KPMG_final_report_vol1.pdf (accessed on 4 June 2015).
  6. Calvin Lakhan. “Exploring the relationship between municipal promotion and education investments and recycling rate performance: An Ontario case study.” Resources Conservation and Recycling 11 (2014): 222–29. [Google Scholar] [CrossRef]
  7. Małgorzata Grodzińska-Jurczak, Marta Tarabuła, and Adam D. Read. “Increasing participation in rational municipal waste management: A case study analysis in Jaslo City (Poland).” Resources Conservation and Recycling 38 (2006): 67–88. [Google Scholar] [CrossRef]
  8. Deborah Simmons, and Ron Widmar. “Motivations and Barriers to Recycling: Toward a Strategy for Public Education.” Journal of Environmental Education 22 (1990): 13–18. [Google Scholar] [CrossRef]
  9. Margaret A. Reams, and Brooks H. Ray. “The Effects of Three Prompting Methods on Recycling Participation Rates—A Field-Study.” Journal of Environmental Systems 22 (1993): 371–79. [Google Scholar] [CrossRef]
  10. Peter Tucker. “Normative Influences in Household Waste Recycling.” Journal of Environmental Planning and Management 42 (1999): 63–82. [Google Scholar] [CrossRef]
  11. Nicky Mee, Debbie Clewes, Paul S. Phillips, and Adam D. Read. “Effective implementation of a marketing communications strategy for kerbside recycling: A case study from Rushcliffe, UK.” Resources Conservation and Recycling 42 (2004): 1–26. [Google Scholar] [CrossRef]
  12. Seonaidh McDonald, and Rob Ball. “Public participation in plastics recycling schemes.” Resources Conservation and Recycling 22 (1988): 123–41. [Google Scholar] [CrossRef]
  13. Tom Evison. “An Evaluation of the Effectiveness of Local Authority Recycling and Waste Awareness Publicity and Promotions.” Master’s Thesis, Luton University, Bedfordshire, UK, September 1988. [Google Scholar]
  14. Tom Evison, and Adam D. Read. “Local authority recycling and waste: Awareness publicity/promotion.” Resources Conservation and Recycling 32 (2001): 275–91. [Google Scholar] [CrossRef]
  15. Julie Owens, Sharyn Dickerson, and David L. Macintosh. “Demographic Covariates of Residential Recycling Efficiency.” Environment and Behavior 32 (2000): 637–50. [Google Scholar] [CrossRef]
  16. Irina Safitri Zen, Zainura Zainon Noor, and Rafiu Olasunkanmi Yusuf. “The profiles of household solid waste recyclers and non-recyclers in Kuala Lumpur, Malaysia.” Habitat International 42 (2014): 83–89. [Google Scholar] [CrossRef]
  17. Gonzalo Díaz Meneses, and Asunción Beerli Palacio. “Recycling Behavior: A Multidimensional Approach.” Environment and Behavior 37 (2005): 837–60. [Google Scholar] [CrossRef]
  18. Dustin T. Duncan, Jared Aldstadt, John Whalen, Kellee White, Marcia C. Castro, and David R. Williams. “Space, Race, and Poverty: Spatial Inequalities in Walkable Neighborhood Amenities? ” Demographic Research 17 (2012): 17–26. [Google Scholar] [CrossRef]
  19. Renee Gedar Perry, and Ian Williams. “The participation of ethnic minorities in kerbside recycling: A case study.” Resources, Conservation and Recycling 49 (2007): 308–23. [Google Scholar] [CrossRef]
  20. Stewardship Ontario. “Consultation Archives.” 2012. Available online: http://stewardshipontario.ca/bb-consultation-archives#2011 (accessed on 8 March 2013).
  21. Continuous Improvement Fund. “CIF, Funded Projects.” 2014. Available online: http://cif.wdo.ca/projects/index.htm#BestPractices (accessed on 15 June 2015).
  22. Ministry of the Environment and Climate Change. “Ministry of the Environment. Ontario Environmental Protection Act: Ontario Regulation 101/94. Recycling and Composting of Municipal Waste.” 2011. Available online: http://www.e-laws.gov.on.ca/html/regs/english/elaws_regs_940101_e.htm (accessed on 8 June 2015). [Google Scholar]
  23. Jacquelin Burgess, Carolyn M. Harrison, and Petra Filius. “Environmental communication and the cultural politics of environmental citizenship.” Environment and Planning 30 (1998): 1445–60. [Google Scholar] [CrossRef]
  24. Nancy Newhouse. “Implications of attitude and behavior research for environmental conservation.” The Journal of Environmental Education 22 (1991): 26–32. [Google Scholar] [CrossRef]
  25. Adam D. Read. “Making waste work-making UK national solid waste strategy work at the local scale.” Resources, Conservation and Recycling 26 (1999): 259–85. [Google Scholar] [CrossRef]
  26. Robert D. Bullard. Dumping in Dixie: Race, Class, and Environmental Quality. Boulder: Westview Press, 1990. [Google Scholar]
  27. Daniel R. Faber, and Eric J. Krieg. “Unequal Exposure to Ecological Hazards: Environmental Injustices in the Commonwealth of Massachusetts.” Environmental Health Perspectives 110 (2002): 277–88. [Google Scholar] [CrossRef] [PubMed]
Figure 1. Visible Minorities in Ontario.
Socsci 05 00023 g001
Figure 2. Sample Newspaper Advertisement # 1.
Socsci 05 00023 g002
Figure 3. Sample Newspaper Advertisement # 2.
Socsci 05 00023 g003
Figure 4. Sample Newspaper Advertisement # 3.
Socsci 05 00023 g004
Figure 5. Coded Responses to Newspaper Advertisements (Recognition).
Socsci 05 00023 g005
Figure 6. Coded Responses to Newspaper Advertisements (Clarity: What are you being asked to do?).
Socsci 05 00023 g006
Figure 7. Coded Responses to Newspaper Advertisements (Clarity: Level of Understanding).
Socsci 05 00023 g007
Figure 8. Coded Responses to Newspaper Advertisements (Awareness).
Socsci 05 00023 g008
Figure 9. Sample Sign # 1.
Socsci 05 00023 g009
Figure 10. Sample Sign #2
Socsci 05 00023 g010
Figure 11. Sample Sign #3.
Socsci 05 00023 g011
Figure 12. Coded Responses to P&E Signage (Clarity).
Socsci 05 00023 g012
Figure 13. Coded Responses to P&E Signage
Socsci 05 00023 g013
Figure 14. Sample Web Page #1 (Peel Region).
Socsci 05 00023 g014
Figure 15. Sample Web Page #2 (York Region).
Socsci 05 00023 g015
Figure 16. Sample Web Page #3 (City of Toronto).
Socsci 05 00023 g016
Figure 17. Coded Responses to P&E Web Resources (Clarity).
Socsci 05 00023 g017
Figure 18. Coded Responses to P&E Web Resources (Behavioral Change).
Socsci 05 00023 g018
Table 1. Types of Promotion and Education (P&E) Initiatives.
TypePurpose
Leaflets, Pamphlets and FlyersRaise levels of consumer recycling awareness. Could be used in very general terms (i.e., promoting the importance of recycling, or being tailored to the specific characteristics of a given community)
Radio, Web and Television AdvertisementsRaise levels of consumer recycling awareness. Could be used in very general terms (i.e., promoting the importance of recycling, or being tailored to the specific characteristics of a given community)
Door-to-Door CampaignsInforms consumers about recycling initiatives at a local level
Product LabelingIndicates the recyclability of a particular product
Bin AdvertisementsInforms consumers about what materials belong/do not belong in recycling bins. Generally used in public spaces (i.e., parks, malls, etc.)
Table 2. Ethnic Breakdown of Study Participants.
EthnicityNumber of Participants
South Asian29
Asian (non-Filipino)22
Filipino/South East Asian8
Black (African/Caribbean)7
Middle Eastern4
Other (Latin American, Polynesian, Mixed Ethnicty)7
Table 3. Summary Statistics of Household Survey Participants.
VariableMean/Percent
Gender49.2% 1
Age41.2
College51.5% 2
Income$45,000–$60,000 3
1 Percentage of respondents who identified as being male (else female); 2 Percentage of respondents with college education or higher; 3 Respondents were asked to select from ranges of income that best represents their earnings, not actual values.

