Article

Reliability and Validity of the Multidimensional Locus of Control IPC Scale in a Sample of 3668 Greek Educators

by
Ntina Kourmousi
1,*,
Vasiliki Xythali
1,2 and
Vasilios Koutras
2
1
Primary Education Directorate of Eastern Attica, 150 Lavriou Ave & 4 Andrikou str., 15454 Glyka Nera, Greece
2
Early Childhood Education, University of Ioannina, P.O. Box 1186, 45110 Ioannina, Greece
*
Author to whom correspondence should be addressed.
Soc. Sci. 2015, 4(4), 1067-1078; https://doi.org/10.3390/socsci4041067
Submission received: 19 September 2015 / Revised: 2 November 2015 / Accepted: 3 November 2015 / Published: 9 November 2015

Abstract

:
The Multidimensional Locus of Control IPC Scale (IPC LOC Scale) is an instrument for assessing the locus of control on adults. The aim of the present study is to translate the IPC LOC Scale and evaluate its reliability and validity in a sample of Greek teachers. Data were collected from a nationwide sample of 3668 educators of all levels and specialties. The Cronbach’s alpha coefficient was used to determine the internal consistency reliability. A confirmatory factor analysis (CFA) was conducted in order to test the construct validity of the questionnaire. Validity was further examined by investigating the correlation of the IPC LOC Scale with the Rosenberg self-esteem scale (RSES) and its association with several demographic and work-related data. Internal consistency reliability was satisfactory with a Cronbach’s alpha above 0.70 for all LOC dimensions. CFA confirmed that the items composing the three subscales of the IPC LOC Scale measure the same construct. Also, the root mean square error of approximation (RMSEA), the comparative fit index (CFI) and the goodness of fit index (GFI) values were 0.053, 0.951, and 0.937, respectively for the three-factor model, further confirming the manufacturer’s theory for the three latent variables, Internality, Powerful Others, and Chance. Intercorrelations and correlation coefficients between the IPC LOC Scale and the RSES were significant, while age and sex differences were also found. The Greek version of the IPC LOC Scale was found to have satisfactory psychometric properties and could be used to evaluate the locus of control in Greek teachers.

1. Introduction

The Locus of control is a rather complex construct that refers to where a person places the primary causation of events in his/her life, whether or not he/she feels that he/she is in control of their outcomes [1,2]. Internal versus external control of reinforcement, often referred to as the locus of control, refers to the “degree to which persons expect that a reinforcement or an outcome of their behavior is contingent on their own behavior or personal characteristics versus the degree to which persons expect that the reinforcement or outcome is a function of chance, luck, or fate, is under the control of powerful others, or is simply unpredictable” ([3], p. 489).
The concept of locus of control derives from Rotter’s social learning theory. In his seminal monograph, Rotter [2] suggested that people generally identify either an internal or an external locus of control in their lives. Those with an internal locus of control believe that they control their own lives, while people with an external locus of control tend to believe that life is generally controlled by outside forces, either other people, or events, or even chance [4]. Moreover, he believed that an individual’s locus of control will influence their reward expectancy and behavior [2,3]. It is not surprising that the locus of control may be a determinant trait that influences personality and behavior. In numerous studies it has been associated with various psychological constructs, such as motivation, self-esteem, well-being, academic and professional attainment, etc. [4,5,6].
The original Rotter’s scale was not designed to examine specific domains, but to gain a weak insight into a person’s interpretation across all domains, thus suggesting that the locus of control is a personality trait. Questioning the validity of Rotter’s “lumping expectancies of fate, chance and powerful others together under the rubric of external control” ([7], p. 1), Levenson [7] proposed that the locus of control is a multidimensional construct. She introduced a three-dimensional model [7,8], the one the present study examines, which includes an Internal, a Powerful Others, and a Chance subscale. She differentiated between two types of external influence, on the basis that people who consider the world as unordered and chaotic would behave and think differently from people who believe in an ordered world controlled by powerful others—such as political leaders, parents or God—where a possibility of control exists [7]. Levenson herself has proved and justified the split of externality [9], while other studies have confirmed the three dimensions in different settings and populations [10,11]. The scale has been translated and validated in numerous countries [12,13,14,15], while it has also been adapted into many other scales, such as the Multidimensional Health Locus of Control Scale [16,17,18,19,20] and the Fetal Health Locus of Control Scale [21].
Self-esteem and locus of control. Research on the relationship between self-esteem and locus of control has shown that the two constructs are significantly related, with a tendency for high self-esteem to be strongly linked to an internal locus of control, an individual’s perception that he or she can determine his or her own choices in life [22,23]. For example, Wang et al. [24] associated self-esteem and internal locus of control with educational and occupational attainment, showing that individuals with high self-esteem, who attribute success to internal causes, tend to be more motivated and successful. These constructs seem to be connected, influencing other variables in the same direction [23].

2. Methods

2.1. Participants

A total number of 3668 questionnaires were collected from educators of all levels and specialties. Sample characteristics are shown in Table 1. Of the participants, 1030 were men (28.1%) and 2638 were women (71.9%), while the mean age was 44.4 (SD = 8.7); 31.5% belonged to the ≤40-year-old age group, 36.4% to the 41–49-year-old age group, and 32.2% to the ≥50-year-old age group. Most of them were married (63%) and the mean number of working years at school was 14.9 (SD = 9.5). The majority of the teachers worked in the public sector (89.1%) and mostly full-time (90.6%), while few worked in private educational institutions (10.9%) and part-time (9.4%). Two out of three educators (66.9%) had a Bachelor degree, almost one third held a Master (28.9%), and a small number a PhD (4.2%).
Table 1. Sample characteristics.
N (%)
Sex
Men1030 (28.1)
Women2638 (71.9)
Age, mean (SD)44.4 (8.7)
Age
≤401147 (31.5)
41–491326 (36.4)
≥501174 (32.2)
Family status
Single1015 (27.8)
Married2298 (63.0)
Separated74 (2.0)
Divorced226 (6.2)
Widowed34 (0.9)
Years of working experience at school, mean (SD)14.9 (9.5)
School
Public3267 (89.1)
Private401 (10.9)
Higher degree
Bachelor2452 (66.9)
Master1059 (28.9)
PhD154 (4.2)
Working status
Part time344 (9.4)
Full time3324 (90.6)

2.2. Measures

Locus of Control. The original Multidimensional Locus of Control IPC Scale [7] consists of 24 items that measure an individual’s locus of control. All items are scored on a six-point Likert scale, ranging from −3 (Strongly Disagree) to +3 (Strongly Agree). The scale yields three distinct factors. The Internality subscale consists of eight items (items 1, 4, 5, 9, 18, 19, 21, 23), measuring the degree of a person’s faith in his/her own abilities and capacity to control the outcome of his/her life’s events (e.g., “Whether or not I get to be a leader depends mostly on my ability.”). The Powerful Others subscale also contains eight items (items 2, 6, 7, 10, 12, 14, 16, 24) which assess the extent to which a person feels that his/her course of life is steered by people of power who usually control the fate of the weak (e.g., “I feel like what happens in my life is mostly determined by powerful people.”). The Chance subscale consists of eight items (items 3, 8, 11, 13, 15, 17, 20, 22), estimating the perceptions according to which luck and fate determine a person’s life, thus leaving him/her with limited if any control in various life situations (e.g., “To a great extent my life is controlled by accidental happenings.”). Each subscale produces a unique score by adding up the eight responses on it and adding to the sum a constant of +24 to eliminate negative sums. Therefore, each respondent receives three scores (each one ranging from 0 to 48) indicative of his/her relative view on each of the three dimensions. An individual could score high or low on all three dimensions.
Self-esteem. The Rosenberg Self-Esteem Scale (RSES) [25] is one of the most well-validated measures of global self-esteem. It evaluates general feelings of self-worth and self-acceptance, with items such as “On the whole, I am satisfied with myself”. It consists of 10 items and is scored on a four-point Likert scale, ranging from 0 = Strongly Disagree to 3 = Strongly Agree. It produces a total score that can range from 0 to 30. Scores between 15 and 25 are within normal range, with high scores indicating higher levels of self-esteem. The Greek version, with satisfactory psychometric properties, was used in the present study [26].
Demographic information. Participants were asked to report personal characteristics such as age, sex, education level, and family status, and job-related ones such as the type of educational organization (private or public) they worked for, years of teaching experience, and their working status (part-time or full-time).

2.3. Procedure

The research was conducted from April to June of the school year of 2014. During this period, the questionnaire was electronically posted on different days on the official Greek site for schools and educators www.sch.gr (to which 99.8% of elementary and secondary schools are linked), on various official sites of teachers’ associations (i.e., www.pekade.gr, www.p-e-f.gr, www.inital.gr, etc.) and on all relevant educational sites (i.e., www.specialeducation.gr, www.alfavita.gr, www.omep.gr, etc.). The questionnaire was anonymous and, after selecting to open a link titled “Do you want to find out your scores on Self Esteem, Emotional Intelligence and Problem Solving?”, the participating teachers were informed on its first page about its structure and the aim of the study. They were also informed that, by completing the questionnaire, they would get information concerning the aforementioned skills along with their scores. The information package included clarifications about the factors that affect these traits, as well as general advice on how to enhance them.

2.4. Translation

The IPC LOC Scale was translated into the Greek language from the original questionnaire, as recommended in the literature review [27,28]. Two professional translators, native speakers of the Greek (i.e., target) language who are fluent in the English (i.e., source) language proceeded with independent forward translations into the target language. The preliminary Greek version that was developed was then translated back into the original language by a professional translator. These two versions, the back-translation and the original scale, were compared and changes were made in case of any discrepancies between the two. The produced scale was then reviewed by an expert committee who gave their feedback. Subsequently, it was administered to a small group of teachers, volunteers in the cognitive debriefing phase of the present study, so that the questionnaire items’ clarity and comprehension could be further evaluated. After this final feedback, the final Greek version described below was produced.

3. Statistical Analysis

A confirmatory factor analysis (CFA) using maximum likelihood procedure was conducted in order to examine how well the IPC LOC model fits the data. The variance of the latent constructs was fixed at one, during parameter estimation, and the factors were allowed to be correlated. The fit of the CFA model was evaluated using the chi square (χ2), the comparative fit index (CFI), the goodness of fit index (GFI), and the root mean square error of approximation (RMSEA) [29]. For the CFI and GFI indices, values close to or greater than 0.95 are thought to reflect a good fit to the data [30]. RMSEA values of less than 0.05 indicate a good fit, while values as high as 0.08 suggest a reasonable fit [30]. A non-significant chi square statistic could also indicate a good fit; however, chi square is usually sensitive to sample sizes and is usually found significant for large sample sizes such as ours [29]. The scale’s internal consistency reliability was determined by the calculation of Cronbach’s α coefficient. Scales with reliabilities equal to or greater than 0.70 are considered acceptable. Validity was further assessed with the correlations (Pearson’s r) of IPC LOC Scale dimensions with the self-esteem scale. Correlation coefficients between 0.1 and 0.3 are considered low, between 0.31 and 0.5 moderate, and over 0.5 high. Differences of age and sex on LOC scales were determined by the use of Student’s t-test and analysis of variance (MANOVA). In order to control for multiple testing the Bonferroni correction was used. p-values reported are two-tailed and the statistical significance level was set at 0.05. The analyses were conducted using SPSS and AMOS (SPSS, Chicago, IL, USA) Statistical Software.

4. Results

4.1. Internal Consistency Reliability

Mean values, correlations, and Cronbach’s alpha coefficients for the IPC LOC Scale subscales and items are presented in Table 2. All the IPC LOC Scale subscales exceeded the minimum reliability standard of 0.70. Cronbach’s alpha was 0.74 for Internality, 0.79 for Powerful Others, and 0.79 for Chance. The mean value was 27.88 (SD = 4.88) for Internality, 14.51 (SD = 6.76) for Powerful Others, and 13.40 (SD = 6.78) for Chance.
Table 2. Mean values, correlations, and Cronbach’s alpha coefficients.
MeanSDCorrected Item-Total CorrelationCronbach’s Alpha if Item DeletedCronbach’s Alpha
Internality27.884.88 0.74
Item 10.681.230.470.72
Item 4−1.071.330.400.71
Item 50.671.010.480.69
Item 9−0.371.590.450.68
Item 180.401.070.450.70
Item 190.710.900.440.71
Item 211.230.780.500.72
Item 230.980.890.550.73
Powerful Others14.516.76 0.79
Item 2−1.181.370.600.75
Item 6−1.241.300.500.77
Item 7−1.691.140.660.74
Item 10−0.351.480.530.76
Item 12−1.011.290.590.75
Item 14−0.991.400.430.78
Item 16−1.101.370.200.81
Item 24−2.031.050.480.77
Chance13.406.78 0.79
Item 3−0.411.440.570.76
Item 8−0.891.570.500.77
Item 11−1.551.300.520.77
Item 13−0.891.460.500.77
Item 15−1.661.250.440.78
Item 17−1.931.140.580.76
Item 20−0.881.250.510.77
Item 22−1.601.270.390.79

4.2. Results from CFA

The results of CFA confirmed the three-dimensional model, as it fitted the data well. The RMSEA, CFI, and GFI values were 0.053, 0.951, and 0.937, respectively. None of the item cross-loadings exceeded the item loadings on the intended latent construct. Factors’ loadings were high and ranged from 0.63 to 0.85, indicating a strong association between the latent factors and their respective items. The chi-square test of the model was significant (χ2 = 2768.6, df = 242, p < 0.05).

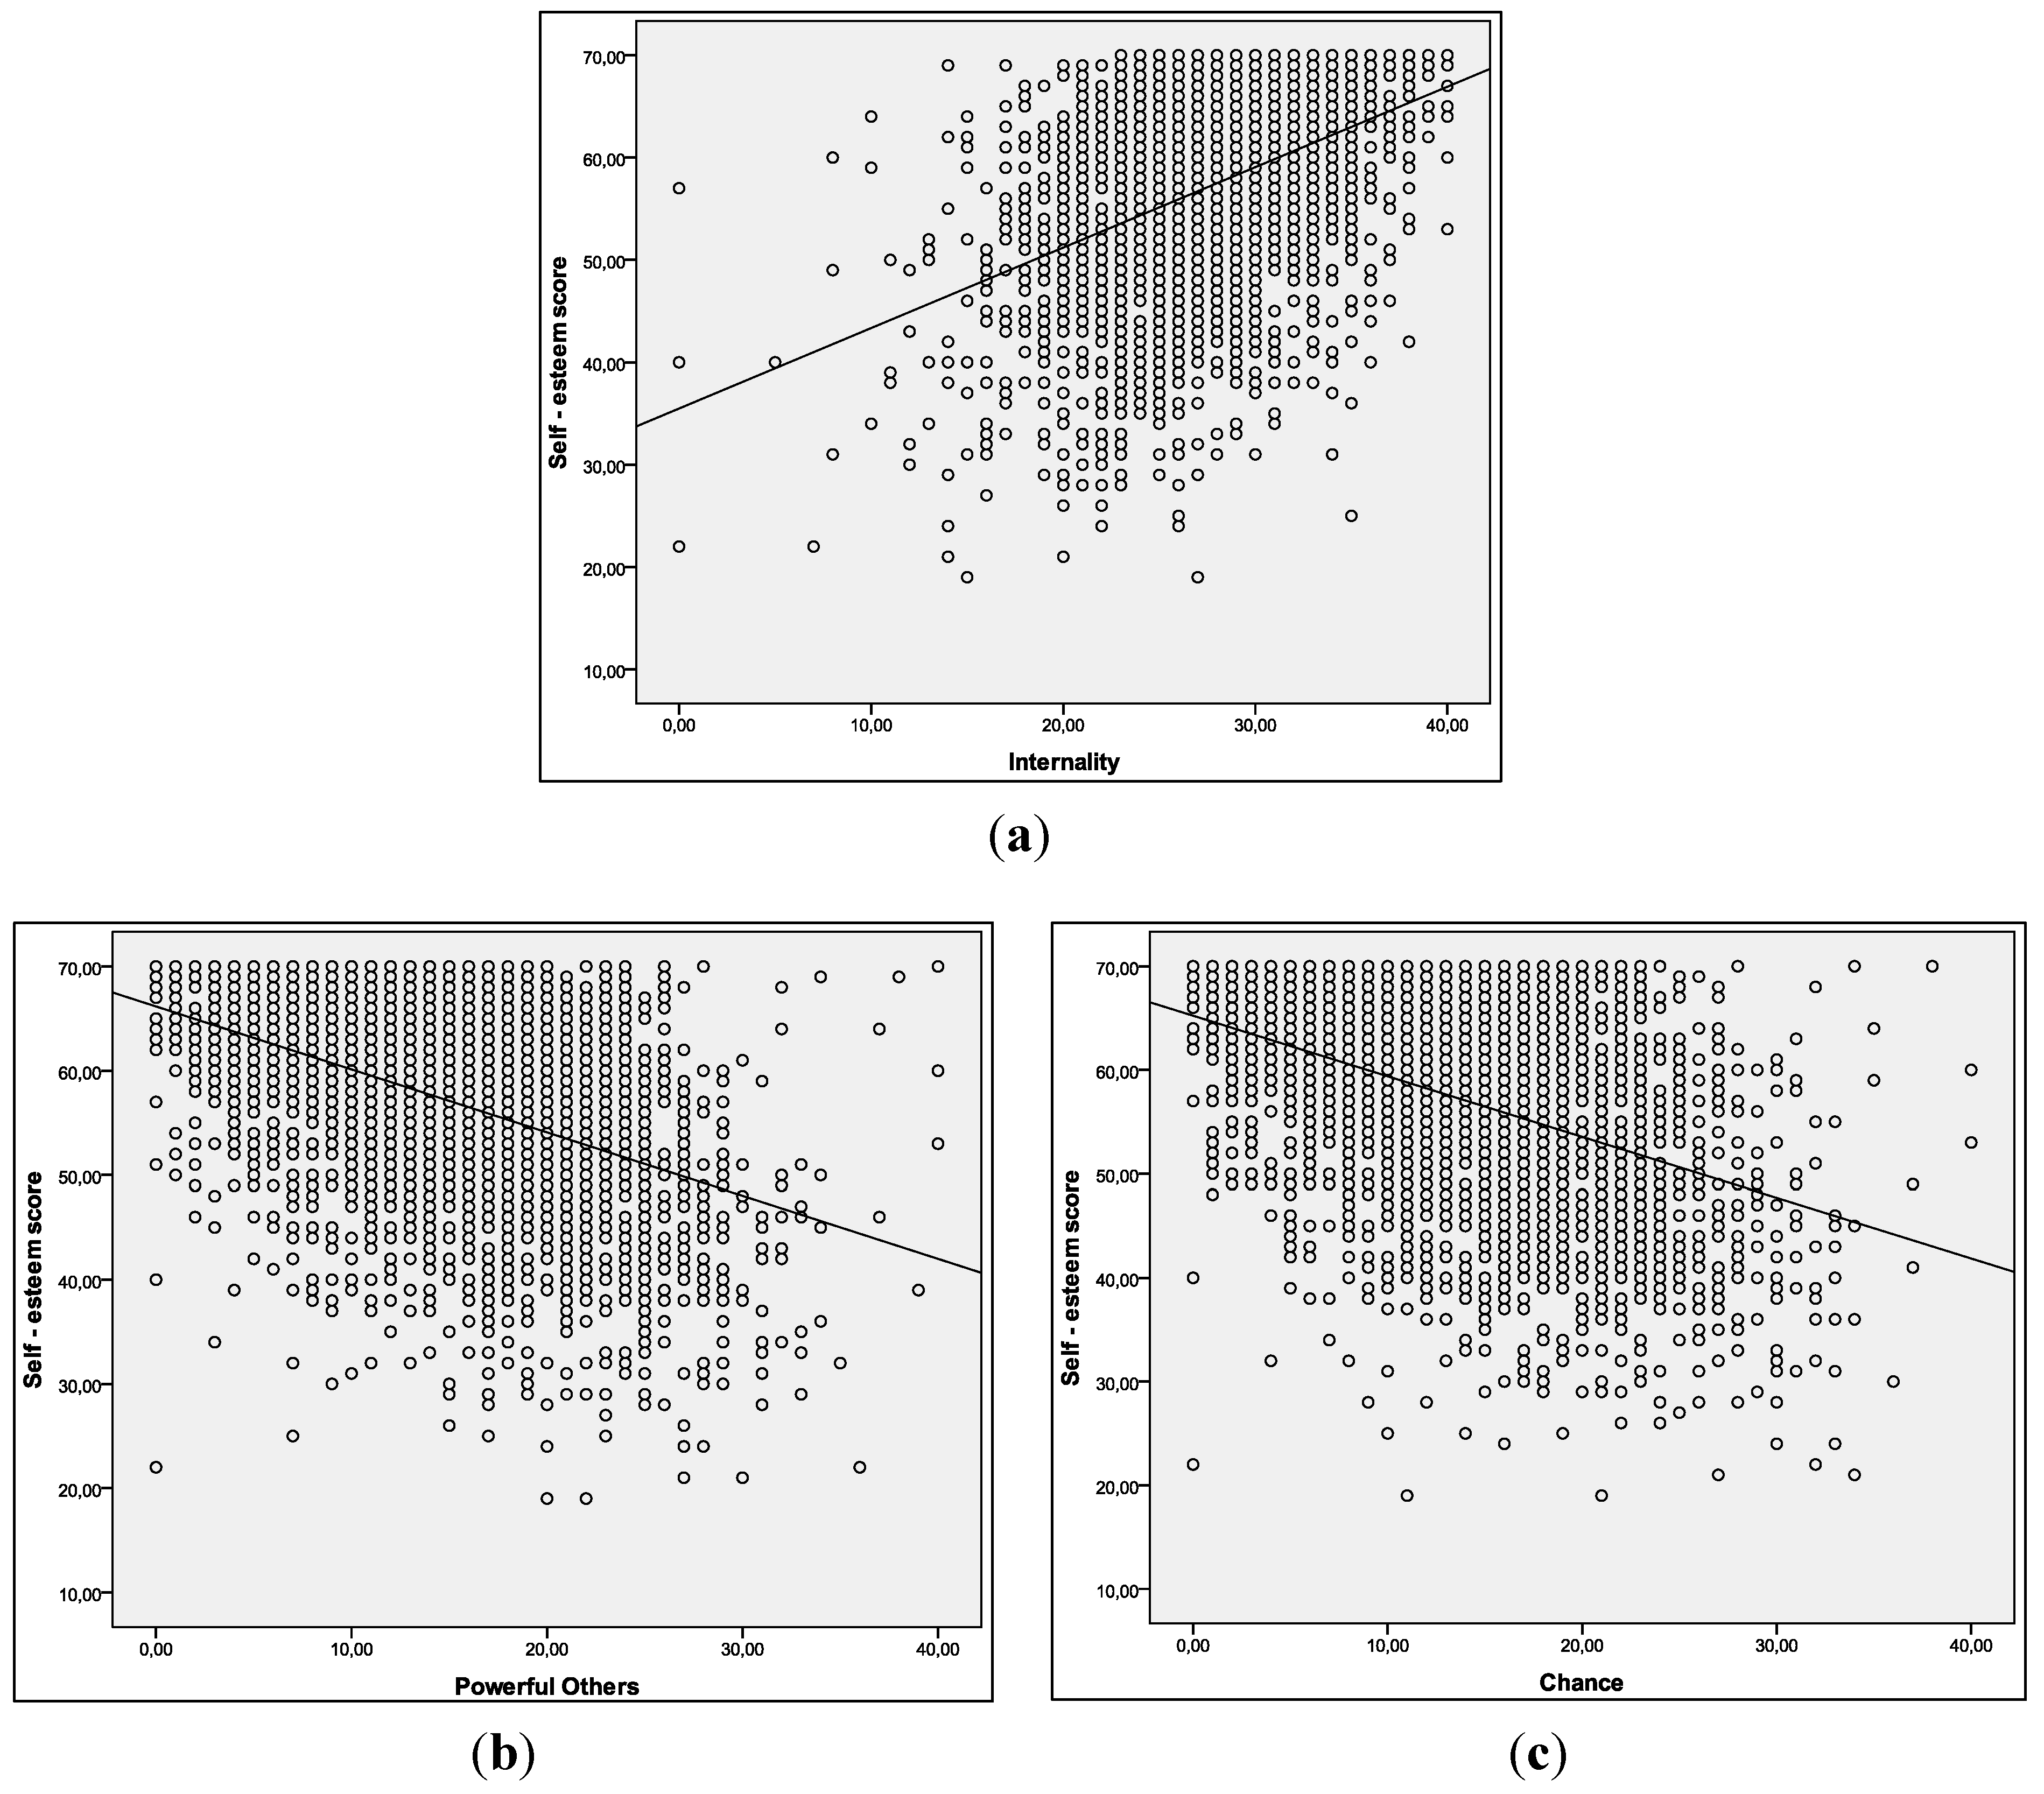
4.3. Convergent Validity

The intercorrelations of the IPC LOC scales are shown in Table 3. Chance was highly and positively correlated with Powerful Others, while a lower although significant correlation was found between Internality and both Powerful Others and Chance. Correlation analysis of IPC LOC Scale dimensions with the self-esteem scale (Table 3) revealed a moderate positive correlation between self-esteem and Internality and a moderate negative correlation between self-esteem and both Powerful Others and Chance (Figure 1a–c, respectively).
Table 3. Intercorrelations of the Multidimensional Locus of Control IPC Scale questionnaire and correlation coefficients of its dimensions with the self-esteem scale.
Powerful OthersChanceSelf-Esteem Score
Internality−0.35−0.270.41
Powerful Others1.000.67−0.44
Chance 1.00−0.42
Note: p-value < 0.001 for all correlation coefficients.
Figure 1. (a) Correlation between self-esteem and Internality; (b) Correlation between self-esteem and Powerful Others; (c) Correlation between self-esteem and Chance.
Socsci 04 01067 g001

4.4. Sex and Age Effects

Table 4 presents the mean scores of the IPC LOC scales by sex and age. A significantly greater score was found on Internality for men in comparison to women. In contrast, women had a higher score on the Powerful Others subscale compared with men. No sex differences were found for the Chance subscale. As far as age effects, significant differences emerged for all the subscales. Lower scores on the Internality subscale were found for those under 40 years old compared to those between 41 to 49 years old (p < 0.001) and to those of 50 years old and above (p < 0.001). On the other hand, the mean scores on the Powerful Others and Chance subscales decreased as the educators’ age increased (p < 0.05 for all multiple comparisons).
Table 4. Sex and age differences on IPC LOC Scale dimensions.
Internality Powerful Others Chance
Mean (SD)pMean (SD)pMean (SD)p
Sex
Men28.51 (5.14)<0.001 *12.97 (6.67)<0.001 *13.29 (6.75)0.505 *
Women27.64 (4.75) 15.11 (6.55) 13.45 (6.8)
Age
≤4027.16 (4.74)<0.001 **16.08 (6.41)<0.001 **14.12 (6.84)<0.001 **
41–4928.19 (4.67) 14.42 (6.46) 13.41 (6.72)
≥5028.25 (5.14) 13.07 (6.76) 12.72 (6.73)
* Student’s t-test; ** ANOVA.

5. Discussion

The Multidimensional Locus of Control IPC Scale consists of three separate dimensions: Internality, Powerful Others, and Chance. In the presented study, the main aim was to examine the psychometric properties of the Greek version of the IPC LOC Scale in a sample of educators of all levels and specialties. Through the confirmatory factor analysis, the three dimensions indeed emerged as three distinct factors, as the corresponding items loaded to each factor clearly as expected. The three-dimensional model of Levenson [7] was further corroborated by the fact that all three factors’ loadings were high, while none of the item cross-loadings exceeded the item loadings on the intended latent dimension. The RMSEA value was 0.053, whereas both the CFI and GFI values were more than 0.93. The chi-square test of the model was significant, a finding that was anticipated for a large sample size such as ours [29].
All the IPC LOC subscales exhibited a satisfactory reliability standard above 0.70. The internal consistency reliability of the three IPC LOC subscales is comparable to the one reported by the original scale’s manufacturer [7] and by other researchers [11].
The intercorrelations of the IPC LOC subscales were all found to be significant. Internality was negatively linked to both Powerful Others and Chance at a low degree, while the two latter subscales were positively correlated with each other, a finding similar to that reported by the scale’s manufacturer [7]. The high positive correlation of Chance with Powerful Others (r = 0.67) could be due to the devastating financial crisis that has been dominating Greece for the past six years, leading people to feelings of helplessness and lack of control over the outcomes of events in their lives.
The correlation analysis of the IPC LOC Scale dimensions with the self-esteem scale attempted to show the convergent validity of the IPC LOC scale. Even though all the correlation coefficients were rather low, they were all statistically significant. A moderate positive correlation between self-esteem and Internality and a moderate negative correlation between self-esteem and both Chance and Powerful Others were found. Similar to our results, self-esteem has been continuously linked to internal locus of control [22,23].
Regarding the subscales, Internality had the highest mean score (almost double), followed by Chance and Powerful Others. This finding agrees with similar results in other western countries, such Germany and the USA [13]. Internality emerged as a significant factor between the two sexes, as men reported higher scores than women. Female educators, on the other hand, had higher scores than their male colleagues on Powerful Others. These differences could be attributed to the psychological characteristics of the two sexes, and are consistent with the results of research conducted in the last two decades, according to which females tend to be more external than males on most locus of control measures [31]. The subscale Chance did not yield statistically significant differences between women and men. This finding contradicts the results of a cross-cultural study [13] and other similar studies [12] in which women also scored higher on Chance.
All the subscales revealed differences concerning the age of the participants. As age increased, Internality increased as well. Conversely, as the educators’ age increased, the mean scores on the subscales Powerful Others and Chance decreased. This finding is in contrast with previous studies which found that older people tend to have a more external orientation [12,32]. Nevertheless, it could be explained by the fact that older educators may take responsibility for their actions and attribute their accomplishments or their mistakes to themselves rather than to others or chance. Although Levenson [7] suggested that Internality is most open to change over time, while the external dimensions are more impervious, our findings indicate that all three may be able to change. The results of various studies on sex and age differences on the Multidimensional IPC LOC scale do not allow for solid conclusions to be made.

6. Strengths and Limitations

The main strength of the present study is the large sample of the participating educators. Another strong point is that we have included teachers of all levels and specialties. Moreover, we were able to confirm the three-dimensional model that was introduced by Levenson [7]. Nonetheless, there are limitations in this study.
It was not feasible to test the IPC LOC Scale’s sensitivity to change over time, since the design of the study was cross-sectional. Additionally, test-retest reliability was also not examined in the current study.

7. Conclusions

The results of the present study offer substantial evidence that the IPC LOC Scale seems to be a reliable and valid instrument for measuring locus of control in Greek educators, providing information for three different dimensions of locus of control.

Acknowledgments

We would like to thank all the teachers that took time to complete our online questionnaire, and who by doing so contributed significantly to our study.

Author Contributions

N.K. designed and conducted the study, with the help of V.X. and with the supervision of V.K. She provided the statistical analysis, drafted the manuscript, and together with the other authors reviewed its final form.

Conflicts of Interest

The authors declare that they have no competing interests.

Abbreviations

CFA: Confirmatory Factor analysis;
CFI: Comparative Fit Index;
GFI: Goodness of Fit Index;
RMSEA: Root Mean Square Error of Approximation;
IPC LOC Scale: Internality, Powerful Others and Chance Multidimensional Locus of Control Scale;
RSES: Rosenberg Self-Esteem Scale.

References

  1. Herbert M. Lefcourt. Locus of Control: Current Trends in Theory & Research. New York: Psychology Press, 2014. [Google Scholar]
  2. Julian B. Rotter. “Generalized expectancies for internal versus external control of reinforcement.” Psychological Monographs: General and Applied 80 (1966): 1–28. [Google Scholar] [CrossRef]
  3. Julian B. Rotter. “Internal versus external control of reinforcement: A case history of a variable.” American Psychologist 45 (1990): 489–93. [Google Scholar] [CrossRef]
  4. Rita Halpert, and Russ Hill. The Locus of Control Construct’s Various Means of Measurement: A Researcher’s Guide to Some of the More Commonly Used Locus of Control Scales. Beach Haven: Will to Power Press, 2011. [Google Scholar]
  5. Kate Bodill, and Lynne D. Roberts. “Implicit theories of intelligence and academic locus of control as predictors of studying behaviour.” Learning and Individual Differences 27 (2013): 163–66. [Google Scholar] [CrossRef]
  6. Maria-Doina Schipor, and Ovidiu-Andrei Schipor. “Motivation and Locus of Control: Relational Patterns Activated in Training for Teaching Career.” Procedia-Social and Behavioral Sciences 128 (2014): 420–25. [Google Scholar] [CrossRef]
  7. Hanna Levenson. “Reliability and Validity of the I, P, and C Scales—A Multidimensional View of Locus of Control.” 1973. Available online: http://files.eric.ed.gov/fulltext/ED087791.pdf (accessed on 1 September 2015). [Google Scholar]
  8. Hanna Levenson. “Differentiating among internality, powerful others, and chance.” In Research with the Locus of Control Construct. Vol. 1. Assessment Methods. Edited by Herbert M. Lefcourt. New York: Academic Press, 1981, pp. 15–63. [Google Scholar]
  9. Hanna Levenson. “Activism and Powerful Others: Distinctions within the Concept of Internal-External Control.” Journal of Personality Assessment 38 (1974): 377–83. [Google Scholar] [CrossRef]
  10. Barbara L. Kennedy, Gregory V. Lynch, and John J. Schwab. “Assessment of locus of control in patients with anxiety and depressive disorders.” Journal of Clinical Psychology 54 (1998): 509–15. [Google Scholar] [CrossRef]
  11. Angela Roddenberry, and Kimberly Renk. “Locus of control and self-efficacy: Potential mediators of stress, illness, and utilization of health services in college students.” Child Psychiatry & Human Development 41 (2010): 353–70. [Google Scholar] [CrossRef] [PubMed]
  12. Jos F. Brosschot, Winifred A. Gebhardt, and Guido L. R. Godaert. “Internal, powerful others and chance locus of control: Relationships with personality, coping, stress and health.” Personality and Individual Differences 16 (1994): 839–52. [Google Scholar] [CrossRef]
  13. Günter Krampen, and Hans-Jürgen W. Wieberg. “Three Aspects of Locus of Control in German, American, and Japanese University Students.” The Journal of Social Psychology 113 (2010): 133–34. [Google Scholar] [CrossRef]
  14. Rosina C. Lao. “Levenson’s IPC (Internal-External Control) Scale: A Comparison of Chinese and American Students.” Journal of Cross-Cultural Psychology 9 (1978): 113–24. [Google Scholar] [CrossRef]
  15. G. Loas, Roland Dardennes, P. Dhee-Perot, and V. Leclerc. “Operationalization of the ‘locus of control’ concept: Translation and first validation study of the Levenson control scale (IPC: The internal powerful others and chance scale).” Annales Medico-Psychologiques 152 (1994): 466–69. [Google Scholar] [PubMed]
  16. Aya Kuwahara, Yoshikazu Nishino, Takayoshi Ohkubo, Ichiro Tsuji, Shigeru Hisamichi, and Toru Hosokawa. “Reliability and Validity of the Multidimensional Health Locus of Control Scale in Japan: Relationship with Demographic Factors and Health-Related Behavior.” The Tohoku Journal of Experimental Medicine 203 (2004): 37–45. [Google Scholar] [CrossRef] [PubMed]
  17. Vanessa L. Malcarne, Senaida Fernandez, and Lise Flores. “Factorial Validity of the Multidimensional Health Locus of Control Scales for Three American Ethnic Groups.” Journal of Health Psychology 10 (2005): 657–67. [Google Scholar] [CrossRef] [PubMed]
  18. Mahdi Moshki, and Fazlollah Ghofranipour. “Iranian version of Form B of the Multidimensional Health Locus of Control Scales among the youth.” Journal of Clinical Nursing 20 (2011): 1561–67. [Google Scholar] [CrossRef] [PubMed]
  19. Kenneth A. Wallston. “The validity of the multidimensional health locus of control scales.” Journal of Health Psychology 10 (2005): 623–31. [Google Scholar] [CrossRef] [PubMed]
  20. Kenneth A. Wallston, Barbara Strudler Wallston, and Robert DeVellis. “Development of the Multidimensional Health Locus of Control (MHLC) Scales.” Health Education & Behavior 6 (1978): 160–70. [Google Scholar] [CrossRef]
  21. Sharon M. Labs, and Sandy K. Wurtele. “Fetal Health Locus of Control scale: Development and validation.” Journal of Consulting and Clinical Psychology 54 (1986): 814–19. [Google Scholar] [CrossRef] [PubMed]
  22. Taisir M. Abdallah. “Self-esteem and locus of control of college men in Saudi Arabia.” Psychological Reports 65 (1989): 1323–26. [Google Scholar] [CrossRef]
  23. Jens C. Pruessner, Mark W. Baldwin, Katarina Dedovic, Robert Renwick, Najmeh Khalili Mahani, Catherine Lord, Michael Meaney, and Sonia Lupien. “Self-esteem, locus of control, hippocampal volume, and cortisol regulation in young and old adulthood.” NeuroImage 28 (2005): 815–26. [Google Scholar] [CrossRef] [PubMed]
  24. Li-Ya Wang, Edward Kick, James Fraser, and Thomas Jerome Burns. “Status attainment in America: The roles of locus of control and self-esteem in educational and occupational outcomes.” Sociological Spectrum 19 (2010): 281–98. [Google Scholar]
  25. Morris Rosenberg. Society and the Adolescent Self-Image. Princeton: Princeton University Press, 1965. [Google Scholar]
  26. David P. Schmitt, and Jüri Allik. “Simultaneous Administration of the Rosenberg Self-Esteem Scale in 53 Nations: Exploring the Universal and Culture-Specific Features of Global Self-Esteem.” Journal of Personality and Social Psychology 89 (2005): 623–42. [Google Scholar] [CrossRef] [PubMed]
  27. Guillermo Solano-Flores, Eduardo Backhoff, and Luis Ángel Contreras-Niño. “Theory of Test Translation Error.” International Journal of Testing 9 (2009): 78–91. [Google Scholar] [CrossRef]
  28. Fons Van de Vijver, and Ronald K. Hambleton. “Translating tests: Some practical guidelines.” European Psychologist 1 (1996): 89–99. [Google Scholar] [CrossRef]
  29. Ralph O. Mueller. Basic Principles of Structural Equation Modelling. New York: Springer-Verlag, 2000. [Google Scholar]
  30. Litze Hu, and Peter M. Bentler. “Cutoff criteria for fit indexes in covariance structure analysis: Conventional criteria versus new alternatives.” Structural Equation Modeling: A Multidisciplinary Journal 6 (1999): 1–55. [Google Scholar] [CrossRef]
  31. Adrian C. Sherman, Graham E. Higgs, and Robert L. Williams. “Gender differences in the locus of control construct.” Psychology and Health 12 (1997): 239–48. [Google Scholar] [CrossRef]
  32. James R. Lumpkin. “The relationship between locus of control and age: New evidence.” Journal of Social Behavior & Personality 1 (1986): 245–52. [Google Scholar]

