Article

Hierarchical and Non-Hierarchical Linear and Non-Linear Clustering Methods to “Shakespeare Authorship Question”

School of English Literature, Language and Linguistics, University of Newcastle, Newcastle upon Tyne, Tyne and Wear NE1 7RU, UK
Soc. Sci. 2015, 4(3), 758-799; https://doi.org/10.3390/socsci4030758
Submission received: 1 July 2015 / Revised: 12 August 2015 / Accepted: 6 September 2015 / Published: 17 September 2015

Abstract

:
A few literary scholars have long claimed that Shakespeare did not write some of his best plays (history plays and tragedies) and proposed at one time or another various suspect authorship candidates. Most modern-day scholars of Shakespeare have rejected this claim, arguing that strong evidence that Shakespeare wrote the plays and poems being his name appears on them as the author. This has caused and led to an ongoing scholarly academic debate for quite some long time. Stylometry is a fast-growing field often used to attribute authorship to anonymous or disputed texts. Stylometric attempts to resolve this literary puzzle have raised interesting questions over the past few years. The following paper contributes to “the Shakespeare authorship question” by using a mathematically-based methodology to examine the hypothesis that Shakespeare wrote all the disputed plays traditionally attributed to him. More specifically, the mathematically based methodology used here is based on Mean Proximity, as a linear hierarchical clustering method, and on Principal Components Analysis, as a non-hierarchical linear clustering method. It is also based, for the first time in the domain, on Self-Organizing Map U-Matrix and Voronoi Map, as non-linear clustering methods to cover the possibility that our data contains significant non-linearities. Vector Space Model (VSM) is used to convert texts into vectors in a high dimensional space. The aim of which is to compare the degrees of similarity within and between limited samples of text (the disputed plays). The various works and plays assumed to have been written by Shakespeare and possible authors notably, Sir Francis Bacon, Christopher Marlowe, John Fletcher, and Thomas Kyd, where “similarity” is defined in terms of correlation/distance coefficient measure based on the frequency of usage profiles of function words, word bi-grams, and character triple-grams. The claim that Shakespeare authored all the disputed plays traditionally attributed to him is falsified in favor of the alternative authors according to the stylistic criteria and analytic methodology used. The result of this validated analysis is empirically-based, objective, and involves replicable evidence which can be used in conjunction with existing arguments to resolve the question of whether or not Shakespeare of Stratford-upon-Avon wrote all the disputed plays traditionally attributed to him.

1. Introduction

The question of identifying the real author of the Shakespearean works is known as “Shakespeare authorship question”. Some literary scholars, traditionally known as anti-Stratfordians, questioned Shakespeare’s authorship of specific plays, arguing that someone else other than Shakespeare either actually wrote these plays or collaborated with him in writing them. Some even went so far in their claims as to suggest that these plays were written by a group of playwrights [1,2,3,4,5]. Most, Shakespearean scholars, including modern-day ones, traditionally known as Stratfordians, strongly believe that Shakespeare actually wrote all of the works traditionally attributed to him. The literature shows that there is no historical record or agreement among scholars as to the exact date of scholarly doubt concerning Shakespeare’s authorship, but, as early as 1628, Thomas Vicars listed many authors by name, with only one exception: “that author who takes his name from shaking and spear”. This circumlocution is curious, and is consistent with Vicars knowing Shake-speare (as the writer’s name was often spelled) was a pen name. Hyphenated names in the Elizabethan era (other than Fitz-Gerald, etc) were typically assumed names. Also, according to some other resources [6,7,8,9], Shakespeare’s authorship was not questioned until the middle of the nineteenth century and probably before that, when around 1845, Shakespeare was promoted to the status of the best dramatist of all time. Since then, debate has raged over these claims. The current state of the debate remains unresolved and literary scholars’ reactions towards Shakespeare’s authorship question are sharply divided on whether or not the works traditionally attributed to Shakespeare are actually the writings of a man called William Shakespeare of Stratford-upon-Avon.
The literature on the Shakespeare authorship question is so extensive and is often contentious. Several scholarly studies have been devoted to the topic. Among the most widely cited studies are, for example, [1,8,10,11,12,13,14,15]. The most recent dedicated studies are, for example, James Shapiro’s Contested Will [16] or the essays collected in Paul Edmondson and Stanley Wells, (eds.) Shakespeare Beyond Doubt [17]. However, in this literature, the different arguments against or for the attribution fall into seven or eight categories described by a mixture of internal and (circumstantial) external pieces of evidence, such as Shakespeare’s social position and personal life, education and literacy background, documentary record, last will and testament, and finally the spelling of the “Shakespeare”. In a number of different cases, the same pieces of evidence, interpreted differently by both sides of the debate, have been used in support of their opposing arguments. Also, in the literature, there is a body of evidence for and against each one of the authorship suspect candidates proposed, for example, see [8,18,19]. The present paper does not aim to provide an expanded account on every claim made by “anti-Stratfordians” and “Stratfordians” in this debate, but rather it presents a summary of the most commonly discussed reasons that are often taken against/for the case for Shakespeare. According to anti- Stratfordians, there are at least four reasons for Shakespeare not authoring the works attributed to him:
(1)
Shakespeare’s writing style differs from one work to another in terms of divergent vocabulary use and different sentence structures. The copresence of more unrelated writing styles in Shakespeare’s works gives each an enhanced force as indicators of different author or multiple authors.
(2)
If Shakespeare had written all the plays, poems, and sonnets traditionally attributed to him, he would never have had time to keep his career as a businessman and landowner.
(3)
A documentary record fails to show that Shakespeare attended grammar school or received knowledge in classical literature and rhetoric. Based on this, the works attributed to Shakespeare were in a literary style and this indicates that these works were written by a person capable of a high literary style not by a person of only moderate or lacked education.
(4)
A documentary record in the late sixteenth and early seventeenth centuries also fails to show Shakespeare as a playwright or poet. Rather, that evidence shows only that his career is a businessman and real-estate landlord, and this means that there is no explicit evidence in Shakespeare’s life connecting him to any of the plays and sonnets attributed to him.
The existence of such reasons suggested the possibility of alternative authors for the true authorship of Shakespeare’s works. Various possible authorship candidates have been proposed [20] notably: Sir Francis Bacon, Christopher Marlowe, John Fletcher, Thomas Kyd, William Stanley, Edward de Vere, Earl of Oxford, Earl of Derby, Roger Manners, Mary Sidney Herbert, etc. Although, it is difficult to determine the exact number of those candidates, but, according to some sources [20], there are more than eighty suspect authors. The exact list of Shakespeare authorship candidates who may have written the works attributed to Shakespeare is available on “List of Shakespeare authorship candidates” from Wikipedia, the free encyclopedia.
Seen from the eyes of Stratfordians, the claim that Shakespeare was not the true author of specific works is incorrect and literally far-fetched. The Stratfordians also have their own reasons to believe that Shakespeare’s hand in all the works attributed to him is beyond a reasonable doubt. Some of these are:
(1)
The historical record of Shakespeare attests to the fact that Shakespeare authored 38 plays, 154 sonnets, and 5 poems. These works bear Shakespeare’s name which had explicit evidence and historical validity from Shakespeare’s own time. Much of this evidence comes either from “public sources, such as many title pages of plays and poems published in his lifetime, and references in works by other writers such as Francis Meres, who in 1598 named Shakespeare as the author of twelve plays, and John Weever, who wrote a poem addressed to Shakespeare” or from “manuscript sources, such as references in accounts of court performances, many entries in the Stationers’ Register (a volume in which publishers and printers were required to register the works they intended to publish), a note about Hamlet by the writer Gabriel Harvey, and William Drummond’s notes of his private conversations with Ben Jonson” [21].
(2)
There are no documents explicitly suggesting someone else wrote Shakespeare’s works. The only evidence on this question is that “the Shakespeare who wrote the plays was the man of Stratford-upon-Avon is provided by his monument in Holy Trinity Church, which compares the man of Stratford with great figures of antiquity, by Ben Jonson’s verses in the First Folio, which call him the, ‘sweet swan of Avon’, and, also in the Folio, by verses by Leonard Digges, which refer to his ‘Stratford monument’”. There is also much indirect evidence like the fact that “visitors to Stratford during the seventeenth century sought to learn more about its most famous former inhabitant” [21].
(3)
Interpreting the historical and biographical information about Shakespeare for evidence to reject his authorship to the advantage of another author(s) is a much contested one at the time. Mere evidence with a biographical interpretation of literature is not a marker to attribute authorship.
In conclusion, as things stand, the evidence from both sides may be related to their claims but still be insufficient to prove them. Establishing the case for either side of the authorship debate using traditional or literary stylistic analysis is beyond the scope of this paper, and we leave this task to the literary scholars or critics to use their own methods to see whether or not Shakespeare actually wrote all the plays traditionally attributed to him. Instead, the aim here is to help resolve “Shakespeare authorship question” by bringing further and more empirical evidence based on a mathematically-based methodology, i.e., cluster analysis, to bear on it.
The reminder of the discussion is organized into five sections. The first section looks at the authorship attribution problem, which is the topic of the present paper. It begins with a brief overview of authorship attribution and stylometry, then reviews existing attempts on the Shakespeare authorship question. The second outlines the methodology and the stylistic criteria used in this paper. In the third cluster analysis is applied to relevant digital texts using four clustering methods, and the results are presented and interpreted. The fourth and final section concludes the discussion.

2. Authorship Attribution

Authorship attribution has historically been part of the more general field of stylometry, whose aim is to augment the qualitative methods used in traditional philology and literary criticism for the study of text with theoretical tools and methodologies drawn on the one hand from linguistics and on the other from mathematics and statistics. As its name implies, the aim of the subdiscipline is to identify the authorship of text where this is disputed or unknown. In general, authorship attribution addresses a situation in which there is an anonymous or disputed text and a set of writers who are thought to be reasonable candidates for authorship of it. Sample texts from the candidate authors are studied to determine the characteristic style of each, and these characteristic styles are compared to that of the text of interest to determine which of the candidates is the most likely author. There are many types of authorship attribution problems and these are discussed in [22,23,24].

2.1. Stylometry

The history of stylometry goes back to the work of Jewish scholars in antiquity, who attributed the Torah to Moses based on the analysis of the style and the structure of verses in the Torah and the subsequent books of Old Testament. At that ancient period, two early practices of stylometry are identified: (i) counting of the number of verses, words, and letters in addition to the number of occurrences of certain words in each book of the Old Testament to ensure accuracy in transcription; and (ii) looking for hidden meanings in letter patterns and for the numbers that could be derived from them.
More recently, eighteenth and nineteenth centuries Europe saw a growing interest in the problems of authorship attribution, notably for the purpose of identifying the authorship of older works such as the Iliad and the Odyssey, the different books of the Bible, and the works of Shakespeare. In 1713, for example, Richard Bentley considered the question of whether the Odyssey was written by the same poet as the Iliad, concluding on the basis of stylistic features that a single poet composed the Iliad for male listeners and the Odyssey for women. In 1795, Heinrich Wolf argued, again on the basis of stylistic features, that the Iliad and the Odyssey were created before the invention of writing, and that the poems they contained must be regarded as a collection of songs or short stories that had originally composed one by one. In 1787, the Shakespearean scholar Edmond Malone argued that the three parts of Henry VI were not really written by Shakespeare, to whom they were traditionally attributed.
Perhaps the most influential contribution to the field of authorship attribution is that by the English mathematician Augustus de Morgan, who in 1851 gave new insights into how an authorship attribution problem of a given text can be solved. One of these insights, which related to the classical problem of the authorship of the biblical Epistle to the Hebrews, was to compare different-length words used in Greek text generally with those in the other Pauline epistles. To solve the problem of authorship, de Morgan suggested, in his own words, to “count a large number of words in Herodotus—say all the first book—and count all the letters; divide the second numbers by the first, giving the average number of letters to a word in that book…do the same with the second book. I should expect a very close approximation…” [25]. Attempts to develop his quantitative method and to find new methods had continued by de Morgan himself in 1880 and by other researchers to examine an author’s a literary style up until 1890, where Wincenty Lutoslawski [26], polish philosopher, set out the basics of stylometry in his “Principes de stylométrie”, published in 1890, introducing it for the first time as a method for “measuring stylistic affinities”. On the early attempts in this field see, for example, [18].
As for the recent developments, the appearance and widespread diffusion of information technology in the second half of the twentieth century rendered the digital representation of text together with the abstraction and analysis of data from digital text readily practicable, and as a result stylometry has developed rapidly. Developments in stylometric authorship attribution have focused on the one hand on identification of suitable textual criteria for attribution, and on the other on development of effective quantitative methods for the analysis of data based on such criteria.
Stylometrists generally assume that one part of an author’s writing style is conscious, deliberate, and open to imitation or borrowing by others. The other is sub-conscious, that is, independent of an author’s direct control, and far less open to imitation or borrowing. Stylometry focuses on the unconscious part of an author’s writing style and assumes that at least some aspects of it are constant across his or her literary output. Stylometrists further argue that these constants can be identified and applied to areas like authorship attribution on the basis of quantitative criteria using computational methods [27].
The main foci in the development of stylometry have been (i) identification of unconscious characteristic stylistic features, called discriminators or variables, which can reliably be claimed to characterize the styles of individual authors and to distinguish them from the styles of others; and (ii) identification of specifically quantitative analytical methods which generate and use data derived on the basis of such variables in stylometric applications such as authorship attribution. The stylometric literature contains a large number of textual features suggested as discriminators of authorship, such as word and sentence length, number of characters and syllables, punctuation marks, vocabulary use, fragments of words (character n-grams), collocation of words (word n-grams), function word frequencies, content word frequencies, word frequencies, position of words within sentences, parts of speech and re-write rules [28,29]. Lexical features, in particular, have prevailed the majority of stylometric studies thus far this decade has seen the use of syntactic and semantic features as criteria for authorship due to the great improvements in recent years in the reliability of parsing and part-of-speech tagging technology, but there is still a significant error rate with this technology, particularly for non-standard and earlier forms of English and for other languages. The stylometric literature also contains a large number of quantitative methods for analysis of data based on such criteria in order to generate useful results [28,30,31,32]. Historically, attribution methods used in authorship attribution were statistical univariate methods measuring a single textual feature, for example word length, sentence length, frequencies of letter n-grams, and distribution of words of a given length in syllables. Common univariate methods are T-test, which compares the averages of two samples, and Z-score, which calculates the mean occurrence and the standard deviation of a particular feature and compares it within the normal distribution table. These univariate methods were used to analyze texts in terms of a single stylometric criterion or two and the results derived from them are therefore described as a simple form of statistical analysis. Today, univariate methods are far less popular in the domain of authorship attribution than they once were. More recently, therefore, multivariate data analytical methods have increasingly been used. These are essentially variations on a theme: cluster analysis.
Cluster analysis aims to detect and graphically to reveal structures or patterns in the distribution of data items, variables, or texts, in n-dimensional space, where n is the number of variables used to describe an author’s style. There is a large number of cluster analysis methods and a large literature associated with each [33,34]. Apart from a few attempts using hierarchical cluster analysis methods and principal components analysis with authorship attribution [32,35,36,37,38,39], to the best of my knowledge, until recently, little work has been done using cluster analytical methods with authorship attribution problems. This is understandable, since the domain of stylometry is still at an early stage of development and we can expect expansion in the use of cluster analytical methods as multivariate tools in the resolution of different authorship problems. However, the results from these studies show that cluster analysis methods are proven to be the best performing methods in authorship attribution: works by the same author can be grouped according to their genre or writing styles and authors can be distinguished from one another: the work x of author A can be different from or similar to his/her work y or work z, and the work of author A can be distinguished from the work of author B or author C or disputed work(s) (D, E, F, etc.).
As a final point, the domain of stylometry and authorship attribution indicates that:
Despite a very large number of proposed stylistic criteria, there is little agreement on which are valid, and
Similarly, there is little agreement on which quantitative analytical methods give the most useful and reliable results, and there is again very little work on formal assessment of their validity.

2.2. Previous Stylometric Works on the Shakespeare Authorship Question

The Shakespeare authorship question has attracted so much attention and many non-traditional, or computer-assisted, authorship attribution attempts have been made towards the solution of this problem. The stylometric interest in this debate probably began in 1901 when Thomas Corwin Mendenhall, on the basis of his “quantitative analysis of writing style” [40], examined [41] the word length frequency distribution for all the works written by Shakespeare and Bacon and compared the results. The comparison results showed that each author had very different word length frequency distribution and the conclusion was that Bacon was not likely to have written Shakespeare’s works. In the same study, Mendenhall also measured the word length frequency distribution of Christopher Marlowe and compared it to that of Shakespeare’s. The results found that Marlowe’s word length frequency distribution was in a close agreement with that of Shakespeare, suggesting Marlowe as a putative co-author of the Shakespeare plays. Another early attempt was made in 1901 by Thorndike, who examined the relative frequency of contractions in the late plays written by Shakespeare and Fletcher. The results showed that Shakespeare and Fletcher used the same contractions (i.e., pronominal forms) at different frequencies in Henry VIIII, suggesting that these works have been written jointly by Shakespeare and Fletcher [28].
Slater [42] used a set of words and rare words, and examined them in a selection of works written by Shakespeare (including the questioned play Edward III) and by other alternative candidate authors. Slater found that Edward III was very likely written by Shakespeare [43].
A study by Merriam [39], who used principal components analysis to examine the use of function words and content words in a selection of works written by Shakespeare, Marlowe, and other authors of the time, found that eight Shakespeare plays were more closely similar to nine Marlowe works (seven plays and two translations from Latin) than to the other twenty eight Shakespeare plays. In another study, Matthews and Merriam [44], which used multi-layer perception neural networks to classify a selection of works written by Shakespeare and Fletcher, found that The Double Falsehood and The London Prodigal had the characteristics of Fletcher’s writing style, Henry VIII had Shakespeare’s writing style, and The Two Noble Kinsmen had the characteristics of both authors’ writing styles. The results suggested that Shakespeare collaborated with Marlowe and Fletcher to write these works.
A study by Craig and Kinney [45] showed similar results to that of Merriam [39] and Matthews and Merriam [44] when examined a large number of works by Shakespeare and a few suspect authors using multivariate data analysis methods. The results from this study, as reported, indicated that only a few of the Shakespeare disputed works were closely similar to that of his remaining works.
Yang et al. [20] used information categorization approach based on word rank order and the frequency of different words applying Phylogenetic analysis to examine “Shakespeare-Marlowe authorship problem”. They used forty five plays from Shakespeare’s and eight works from Marlowe’s writings. The results indicated that the majority of Shakespeare’s questioned works were not written by Marlowe and that Edward III was more likely to have been written by Marlowe than Shakespeare.
A very recent stylometric study by Fox et al. [43] examined the use of function words and part ofspeech usage frequencies in a corpus made of a selection of works from the respective writings of Shakespeare, Marlowe, and other Shakespeare’s contemporaries. The results showed that there were significant similarities between Shakespeare’s and Marlowe’s works that were not reached by the other authors in the analysis and that Marlowe was likely to have helped Shakespeare or contributed to one or more of his plays, in particular Henry VI, Part I.
In summary, many studies have used stylometric authorship attribution to examine the Shakespeare authorship question. To date, given the number of disputed plays examined and the possible suspect authors involved, the various studies have reached mixed conclusions:
(1)
Shakespeare was responsible for the writing of the early plays traditionally attributed to him. At the same time, the impact of Bacon and Marlowe on Shakespeare’s writings during this stage of his career as a playwright is very significant.
(2)
Sir Francis Bacon was not likely to have written Shakespeare’s plays.
(3)
Marlowe did have an enormous influence on Shakespeare’s works; while he is not the creator of the whole Shakespeare’s oeuvre, his contribution is seriously considered. In other words, Edward III, Henry VI trilogy, Richard II, and Richard III, or major part of them, are likely to have been written by Marlowe.
(4)
John Fletcher was likely to have written Henry VIII or even contributed to it. The possibility of Fletcher’s involvement in helping Shakespeare to write some other plays was not ruled out.

3. Methodology

3.1. Corpus

Prior to outlining the overall corpus composition, the discussion will first focus on the respective collection of texts, addressing the issue of representing the authorial information contained in them.
The most difficult part of the corpus compilation process was to select a collection of (digital or electronic) texts widely agreed upon among most literary scholars as belonging to the candidate authors involved in this study and to prepare them for inclusion in the corpus. The preparation process will be dealt with later in due course of this section. The problems with attributing controversial texts from the Elizabethan period literature are well known in quantitative authorship attribution studies [45] and easily explained. Most Elizabethan plays were published without the playwright’s name and some literary scholars believe that there are no texts that can be definitely attributed to Shakespeare or his contemporaries. Some (un)successfully contested texts are linked to a group of authors rather than a particular author. This may make it impossible to tell whether the distinctiveness of the proposed individual writing styles is about a single author or a group of authors. In many cases, a play has (been claimed to have) multiple authors. Here are a few examples advanced by some literary scholars:
Dido, Queen of Carthage, is at best a collaboration between Christopher Marlowe and Thomas Nashe, though scholars have typically sought to limit Nashe’s involvement. It is therefore, at the least, a contested play and cannot be used to generate Marlowe’s profile.
Doctor Faustus exists in two early versions (1604 and 1616), both printed long after Marlowe’s death and known to have been subjected to revision by other hands (Henslowe’s Diary records payments made for them). It is therefore not exclusively Marlowe’s, and cannot be included to generate his authorial profile.
The Jew of Malta was printed in 1633, long after Marlowe’s death, because it was revived for Caroline performance. The 1633 quarto includes two prologues and an epilogue added by Thomas Heywood, and unclear whether further revisions were made to Marlowe’s text. Even if the prologues and epilogue are removed, the authenticity of the text remains in doubt.
Thomas Kyd’s authorship of Arden of Faversham is far from conclusive. The general scholarly consensus is that Shakespeare is responsible for a sizeable amount, if not the entirety, of the play. Kyd and Marlowe are other likely candidates for collaborators. Kyd’s authorship of 1 Hieronimo is equally contentious.
Cymbeline was first printed in 1623 and setting information (such as “in the garden of Cymbeline’s palace”), not evident in the early texts, was typically added to the nineteenth century editions of Shakespeare.
Hamlet, King Lear, Richard III, and Titus Andronicus are not disputed. These are all Shakespeare’s canonical works. Titus is a collaboration with George Peele.
However, serious challenges to Shakespeare’s authorship of these plays were made by other literary scholars [46,47].
Despite all this, the researcher followed most editors and used the electronic editions that refer to those authors as the actual authors. The researcher believes that they are still suitable or detectable for generating authorial profiles, but not to the extent one wishes.
Having addressed the issue of representativeness in our corpus design, the discussion shall now turn to the actual texts that made up the corpus in this study. The corpus consisted of forty two digital electronic copies of the texts: nine works belong to Sir Francis Bacon, six works to William Shakespeare (five history plays and one tragedy), seven works to John Fletcher (tragic-comedies), seven works to Christopher Marlowe (five tragic-histories and two tragedies), four works to Thomas Kyd (tragedies), and nine disputed works (six history plays and three tragedies). These works were saved in an ASCII (txt.doc) format and assembled into the corpus. These works are shown in Table 1.
Table 1. Forty-two digital electronic works.
No.Author & Work TitleCode
1Translations of the philosophical works BaconTr1
2Translations of the philosophical worksBaconTr2
3Translations of the philosophical worksBaconTr3
4Translations of the philosophical worksBaconTr4
5Translations of the philosophical worksBaconTr5
6Translations of the philosophical worksBaconTr6
7F. Bacon from the tower of London pleads for mercy with King JamesBaconLet
8The history of the reign of King Henry the seventhBacon Henry1
9The history of the reign of King Henry the seventhBacon Henry2
10John Fletcher-Rule a wife Fletwife
11John Fletcher—The Faithful Shepherdess FletFaithful
12John Fletcher—The Humorous Lieutenant FletLieutenant
13John Fletcher—The Tragedy of BonducaFletBonduca
14John Fletcher—The Wild Goose ChaseFletChase
15John Fletcher—The Woman’s PrizeFletPrize
16John Fletcher—Wit Without MoneyFletMoney
17Christopher Marlowe—Dido, Queen of CarthageMarDido
18Christopher Marlowe—Edward IIMarEdward
19Christopher Marlowe—The tragedy of Dr. FaustusMarFaust
20Christopher Marlowe—The Jew of MaltaMarMalta
21Christopher Marlowe—Massacre at ParisMarMassacre
22Christopher Marlowe—Tamburlaine, Part 1MarTamb1
23Christopher Marlowe—Tamburlaine, Part 2MarTamb2
24William Shakespeare—Cymbeline, King of BritainShaCymbeline
25William Shakespeare—History of Henry IV, Part IShaHenry1
26William Shakespeare—History of Henry IV, Part IIShaHenryII
27William Shakespeare—History of Henry VShaHenryIII
28William Shakespeare—History of King JohnShaKing
29William Shakespeare—History of Richard IIShaRichard
30Thomas Kyd—Arden of FevershamThoArden
31Thomas Kyd—IeronimoThoIeronimo
32Thomas Kyd—The tragedy of Soliman and Perseda ThoPerseda
33Thomas Kyd—The Spanish TragedieThoSpanish
34Disputed—King EdwardDisEdward
35Disputed—The Tragedy of Hamlet, Prince of DenmarkDisHamlet
36Disputed—History of Henry VI, Part IDisHenryI
37Disputed—History of Henry VI, Part IIDisHenry2
38Disputed—History of Henry VI, Part IIIDisHenryIII
39Disputed—History of Henry VIIIDisHenry8
40Disputed—The Tragedy of King LearDisLear
41Disputed—Richard IIIDisRichard
42Disputed—Titus AndronicusDisTitus
Another practical difficulty that arises at this stage consisted in finding respective electronic works for the suspect authorship candidates, particularly Bacon, working to some degree within the same genre and around the same time period to that of Shakespeare’s (disputed) works. This is the reason why other principal suspect authors (e.g., Edward de Vere) were not involved in this study (i.e., de Vere works are not plays). The most the researcher could do however is to use any Bacon’s work in history available in an electronic form to see, if it happens to work, which profile text will turn out to reveal unpredicted links or similarities to any of the disputed profile text(s). More specifically, the researcher used Bacon’s five books of his translations of the philosophical works, the history of the Reign of King Henry the seventh, and Bacon’s letter from the tower of London from pleads for mercy with King James. Because there were significant variations in the lengths of Bacon’s works, the researcher divided them into nine sub-texts in an attempt to make them equal in length to the other texts in the corpus. The researcher also used Fletcher’s Wit Without Money though it is a generally accepted collaboration with Francis Beaumont to add additional work into his corpus texts. For the purpose of the attribution analysis, the researcher classified the nine works (HenryVI-1, HenryVI-2, HenryVI-3, Henry III, Richard III, Edward III, Hamlet, King Lear, and Titus Andronicus), which are traditionally attributed to Shakespeare, as disputed texts or as if we did not know anything about their (contested) authorship. The researcher also excluded Shakespeare’s Pericles, prince of Tyre because it is a generally accepted collaboration with George Wilkins. Finally, the dates for these publicly available online digital electronic works cannot be exact because of the nature of the historical record for this time period, but they were collected from University of Virginia Library and The Project Gutenberg E-Book library.
Nevertheless, before relying on these electronic texts, the researcher proof-read them by comparing them to their publically-available printed editions [48,49,50,51,52] to make sure that the information or content provided by these texts free from any corrupted samples (authorial, editorial, and experimental) or any transmission errors occurred by copying or scanning them. However, the comparison showed that the actual lexical content of the online digital electronic editions didn’t change much from edition to edition, and lexical content was all the researcher was interested in. These texts were also stripped of textual inclusions not original to each candidate author such as editorial comments and footnotes, line numbers, and so on. This was done computationally and the results were subsequently proofread to correct any remaining errors or omissions.

3.2. Stylistic Criteria: Function Words, Word N-Grams, and Character N-Grams

Two pressing questions confronted the researcher in this study:
(1)
Which stylistic criteria should be selected to describe the texts?
(2)
Which analytical method(s) should be used to analyze these texts on the basis of the selected stylistic criteria? The second question will be dealt with in Section 3.3.3.
Due to the complexity of the textual and bibliographical issues contained in the corpus texts as acknowledged above, the researcher came to the conclusion that function words, word n-grams, and character n-grams are by far the most suitable for generating authorial profiles in the current application, assuming that these don’t change much from edition to edition, and this was all the researcher interested in. Also, these criteria are considered more reliable authorial stylistic descriptors in comparison to other lexical or word-level descriptors [22,29,53].
For this 3-stage- analysis, 135 function words, 100 word bi-grams, and 24930 letter tri-grams were examined and their frequency of occurrences in the disputed works compared with the corresponding values obtained from the works by each candidate author in the corpus.

3.3. Data Representation and Vector Space Model

Vector Space Model (VSM) was used to represent our data mathematically. The reason for using this model is that it is simple to understand and adequate to compute proximity between vectors in vector space. The forty two texts were converted into 42 vectors in a high dimensional space, and the 135 function words, 100 word bi-grams, and 24930 letter tri-grams counted in the corpus were stored in these vectors. A 42 × 135 DFW, 42 × 100 Dbigram, and 42 × 24930 Dtrigram data matrices were computationally generated. Each of the 42 rows of DFW represents a function word frequency profile for a corresponding text and each of the 135 columns represents a different function word, and the value at any DFW ij (for i = 1..42, j = 1..135) is the number of times that function word j occurs in text. Each of the 42 rows of Dbigram represents a word bi-gram frequency profile for a corresponding text and each of the 100 columns represents a different word bi-gram, and the value at any Dbigram column is the number of times that word bi-gram j occurs in text i. Similarly, each of the 42 rows of Dtrigram represents a character triple-gram frequency profile for a corresponding text and each of the 24930 columns represents a different character tri-gram, and the value at any Dtrigram column is the number of times that character tri-gram j occurs in text i.
DFW (function data matrix), Dbigram, (word bigrams data matrix) and Dtrigram (character trigrams data matrix) were transformed in two ways: dimensionality reduction and length normalization prior to cluster analyzing them.

3.3.1. Dimensionality Reduction

High dimensionality of data is a potential problem for any cluster analysis and this had a particular relevance in the current application. Given the aim was to generate DFW, Dbigram, and Dtrigram in which the row vectors are the texts and the column variables are function words, word bi-grams, and character triple grams, there were 135 variables in DFW, 100 variables in Dbigram, and 24930 in Dtrigram.
The frequencies of these variables were calculated, sorted into descending order of magnitude, and plotted. The result is shown in Figure 1a,b, where the vertical axis represents frequency and the horizontal one the column frequencies:
Figure 1. (a) The distribution of function word frequency matrix DFW; (b) distribution of word bi-grams frequency matrix Dbigram.
Socsci 04 00758 g001
Figure 1a,b shows that there are a few relatively high-frequency function words and word bi-grams, a moderate number of medium-frequency ones, and a large number of low-frequency ones. There is considerable scope for dimensionality reduction here; a conservative reduction would be to keep the 60 highest-frequency columns in DFW and the 30 highest-frequency columns in Dbigram, discarding the rest. The same was done for Dtrigram, and it does not need to be repeated. More specifically, given the aim was to cluster analyze the 42 texts on the basis of the differences among them, the criterion for doing so was to measure the variance of the 135 variables in DFW, the 100 variables in Dbigram, and the 24930 variables in Dtrigram to identify the most significant ones. The variance of a set of variable values is the average deviation of those values from their mean and is expressed by the function:
v = ( i   =   1 n ( x i     µ ) 2 ) / n
The application of variance/standard deviation to dimensionality reduction was straightforward: from the calculated, sorted, and plotted variance of the 135 columns in DFW, the 100 in Dbigram, and the 24930 columns in Dtrigram, we removed all variables with low variance on the grounds that they contributed little to differentiation of the texts, and decided on a threshold selection.
The effect of a variable-selection process was a 42 × 60 for DFW, a 42 × 30 for Dbigram, and a 42 × 40 for Dtrigram. The selected features from each data matrix are shown in Table 2, Table 3 and Table 4 respectively.
Table 2. 60 function words selected from a 42 × 135 DFW.
Function words
the of i you and my he in me a to which was your that thou her thy thee ye it or as
which so this be not in on why thus yet only soon still both us who how such all
with him be by for have will she our shall do what had o but not then now
Table 3. 30 word bi-grams selected from a 42 × 100 Dbigram.
Words bi-grams
and now- and with- and so- of that- of thy- with thy- on thee- in he-to my-and that-
and a- ye to- of the- from he- but to- a- in our- of it- yet i- with us-me and- not to-
in all- me and-as it- to he-but that-it to-that by- and as
Table 4. 40 character tri-grams selected from a 42 × 100 Dtrigram.
Character tri-grams
sti- uch- our- thr- men- tin- upo- ate- are- may- all- wel- ful- low-ity- uth-any-you-but-
ady- day-now-nor-new-ton-can- tre-ndi- tur- ide- ond- nto- sen-giv-red-ery-ord-not-fou
The stylometric criteria selected were now ready to define a 42-dimensional frequency profile vector for each text in the corpus. Each profile vector was a point in 42-dimensional vector space, and cluster analytic methods were used to determine the distribution of profile vectors in the space.

3.3.2. Text Length Normalization

The forty two texts varied considerably in length, ranging from 59 Kb to 690 Kb. The disparity of length, if uncorrected in DFW, Dbigram, and Dtrigram, severely skews any clustering results of data matrix. For example, Figure 2 shows a linear hierarchical cluster analysis of a 42 × 60 DFW.
The number to the right of each of the text names is the size of words in the text; there is a clear and very strong tendency to cluster by length. The essence of the problem now is that we need a clustering structure that reveals the proximities among the vectors in terms of, in this example, the function word frequency profiles, not length. To adjust DFW, and avoid the skew in the clustering results, in each row vector of DFW, the count for a given variable was multiplied by the mean document length, then divided by the total number of frequency counts occurring in that row vector. This normalization was relative to mean text length across a collection using the mathematical function:
M i =   M i ( µ l e n g t h ( C i ) )
Figure 2. A linear hierarchical cluster analysis of a 42 × 60 DFW using Squared Euclidean distance and an increase in sum of squares prior to text length normalization.
Socsci 04 00758 g002
The effect of this is that the frequencies in the vectors that represent long texts were decreased while the frequencies of the vectors that represent short ones were increased. For texts that were near or at the mean, little or no change occurred at all in the corresponding vectors. A linear hierarchical cluster analysis is applied on a 42 × 60 DFW that is dimensionality-reduced and length-normalized. The result of this is shown in Figure 3, where clustering by text length is removed.
Figure 3. A linear hierarchical cluster analysis of a 42 × 60 dimensionality-reduced and length-normalized DFW using Squared Euclidean distance and an increase in sum of squares.
Socsci 04 00758 g003

3.3.3. Cluster Analysis Methods

Hierarchical and non-hierarchical linear and non-linear clustering methods were used in the present analysis. There are two main reasons for this:
(1)
In the current application, the function that generated DFW, Dbigram, and Dtrigram may not be known, and the strong suspicion must be that the generating function was nonlinear, but this is not certain. Even if the generating function is nonlinear, however, there is no guarantee that every data set it generates will contain non-linearities. In general, data that contains significant non-linearity must be analyzed using a nonlinear clustering method; use of a linear method in such a case misrepresents the structure of the data to greater or lesser degrees, depending on the nature of the non-linearity. In a linear method, the distance between two points in a space is taken to be the length of the straight line joining the points, or some approximation to it, whereas in a non-linear method, the distance between the two points is the length of the shortest line joining them along the surface of the curved-surface and where this line can but need not be straight. Depending on the amount of curvature, the difference between the two measures can be significant, and can therefore significantly affect analysis based on it. Given the difficulty of determining the presence of non-linearity in high-dimensional data and given also the implications of non-linearity for the present analysis cannot be ignored, and because hierarchical methods are linear, the additional method or methods used must be non-linear to take account of non-linearity and accommodate the possibility that the DFW, Dbigram, and Dtrigram contain significant non-linearities [33].
(2)
It is recognized that a single class of methods cannot safely be relied on [34,54], and that at least one additional method or class of methods must be used to corroborate the results from hierarchical analysis. Given that we selected a hierarchical method, the additional method or methods used must be non-hierarchical. Each clustering method provides a different mathematical view of what constitutes a cluster and how clusters can be identified, and interprets such agreement as was found among them as an indication of the intrinsic or “true” structure of the data. Specifically, we attempted to establish the validity of cluster results by applying a variety of different clustering methods to the same data and to compare the results: a clear convergence on one particular cluster structure was held to support the validity of that structure with respect to the data.

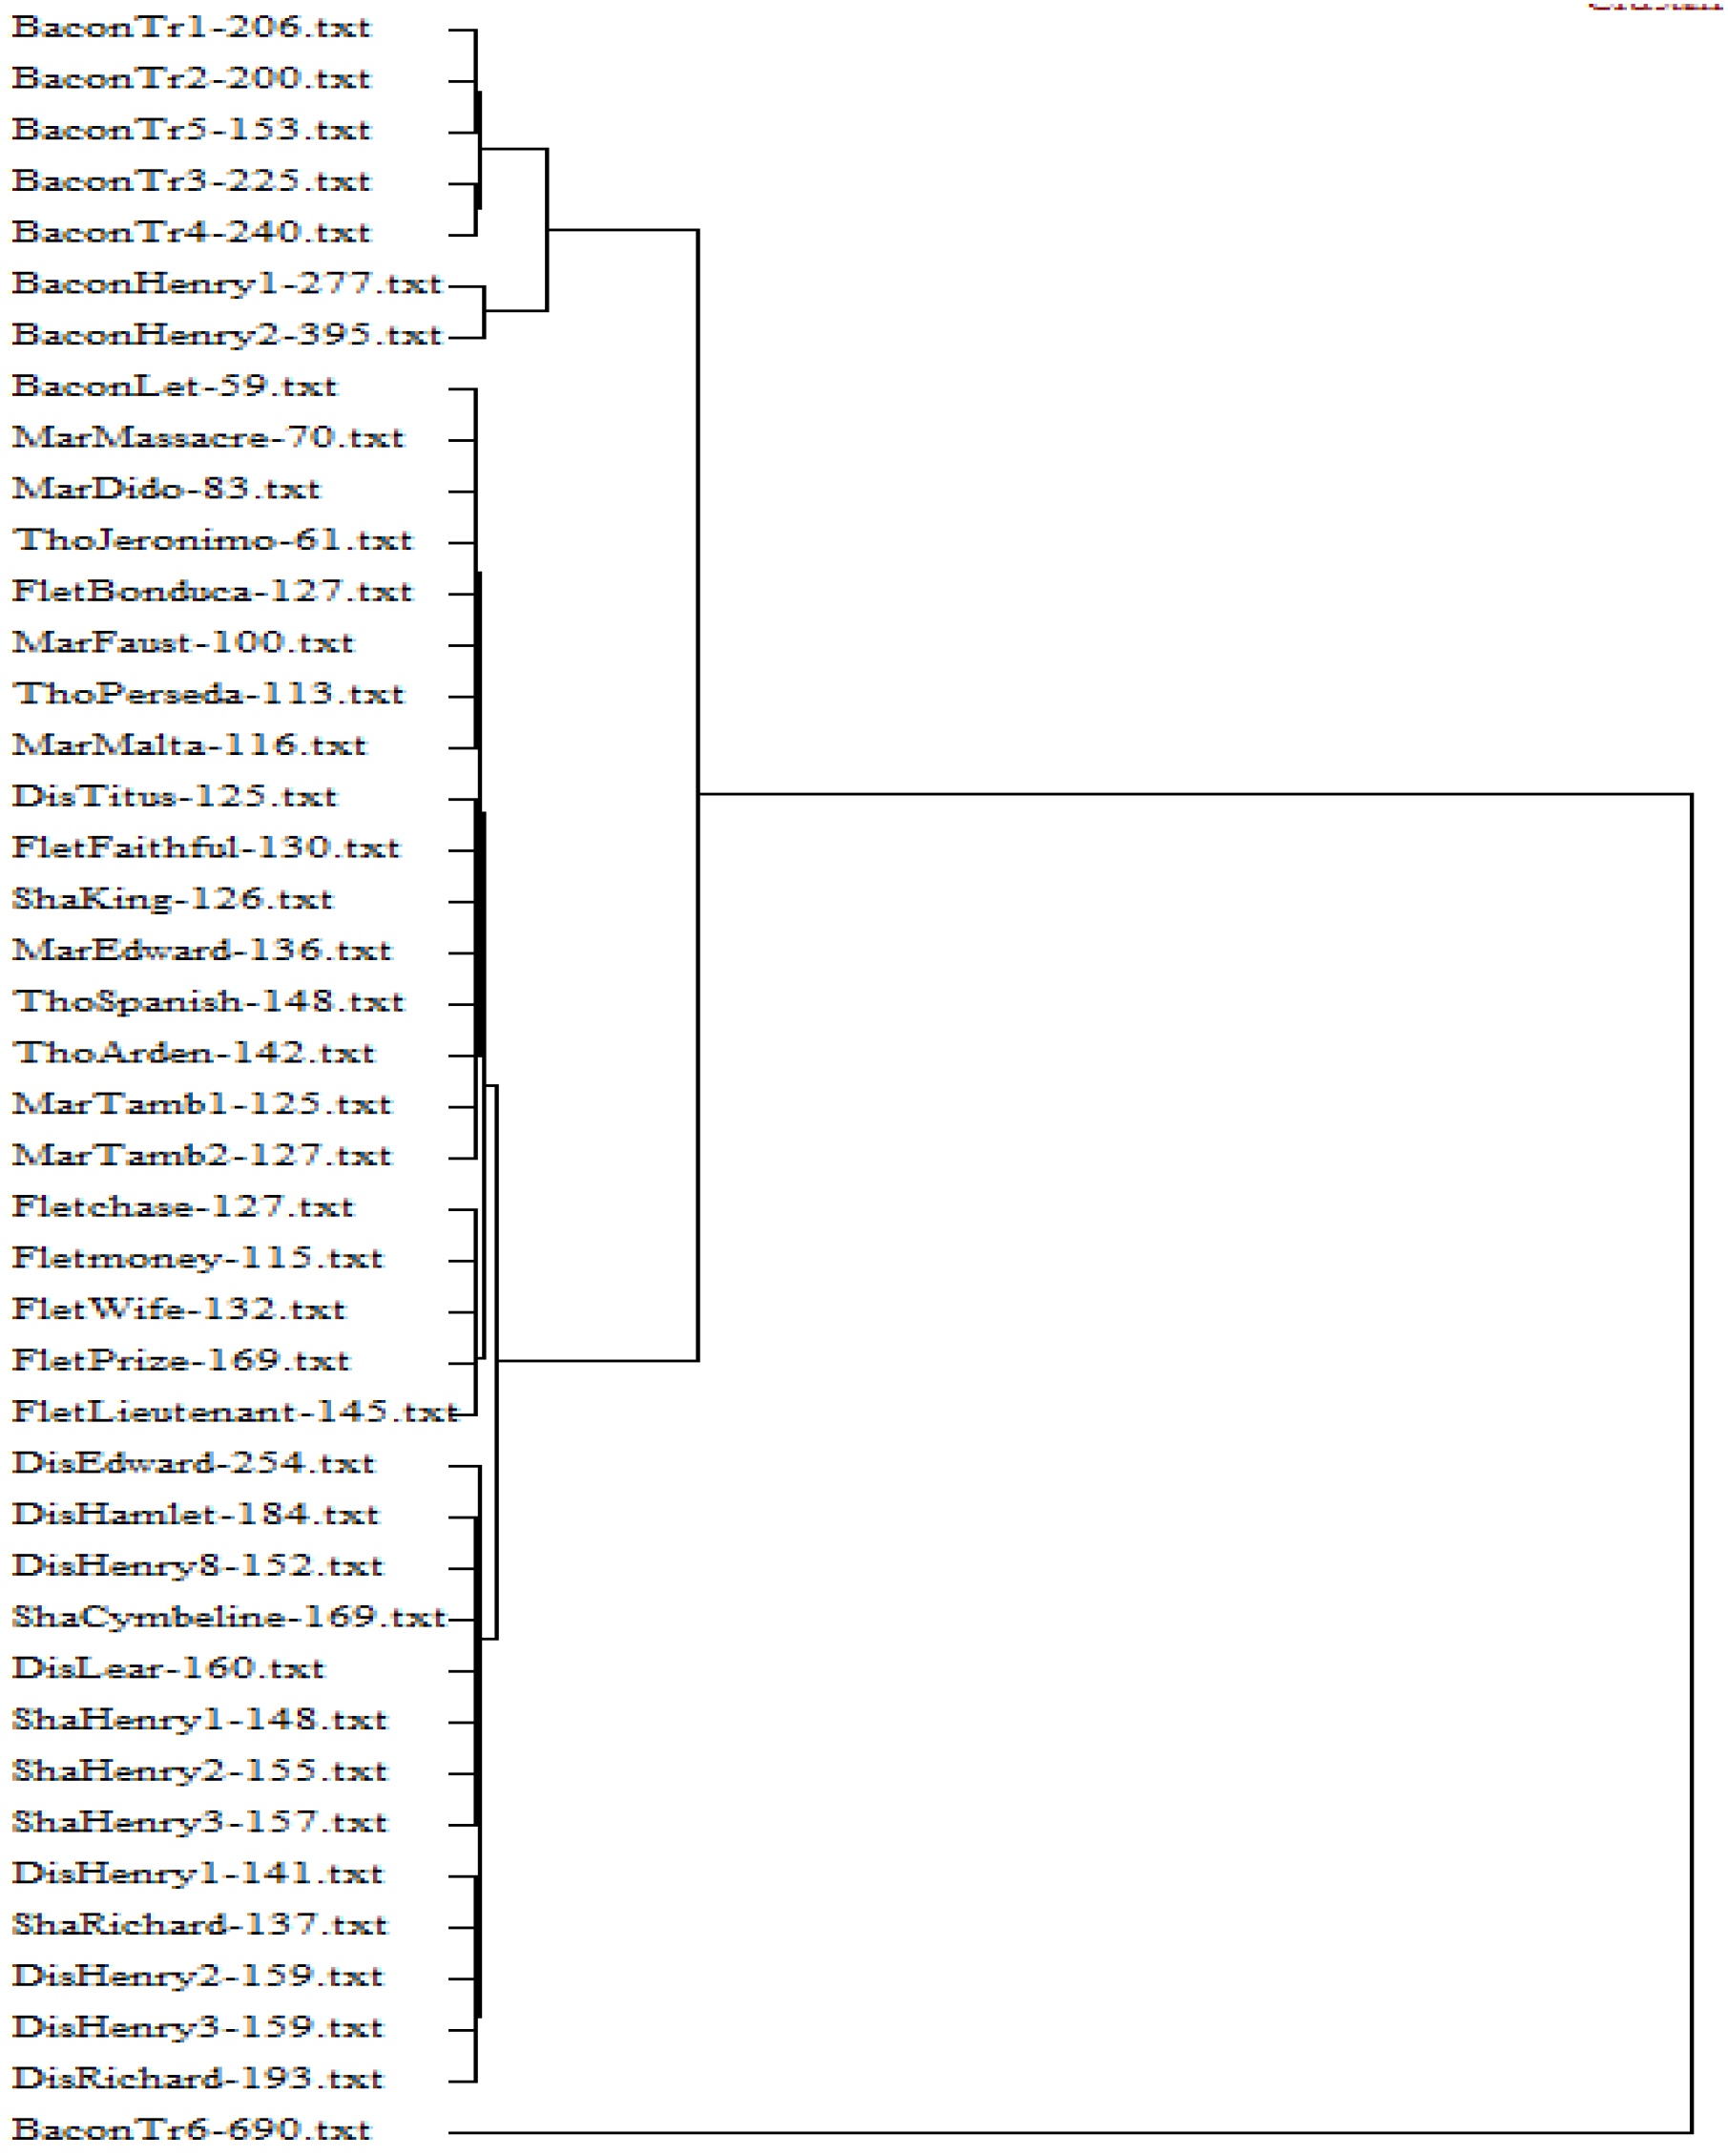
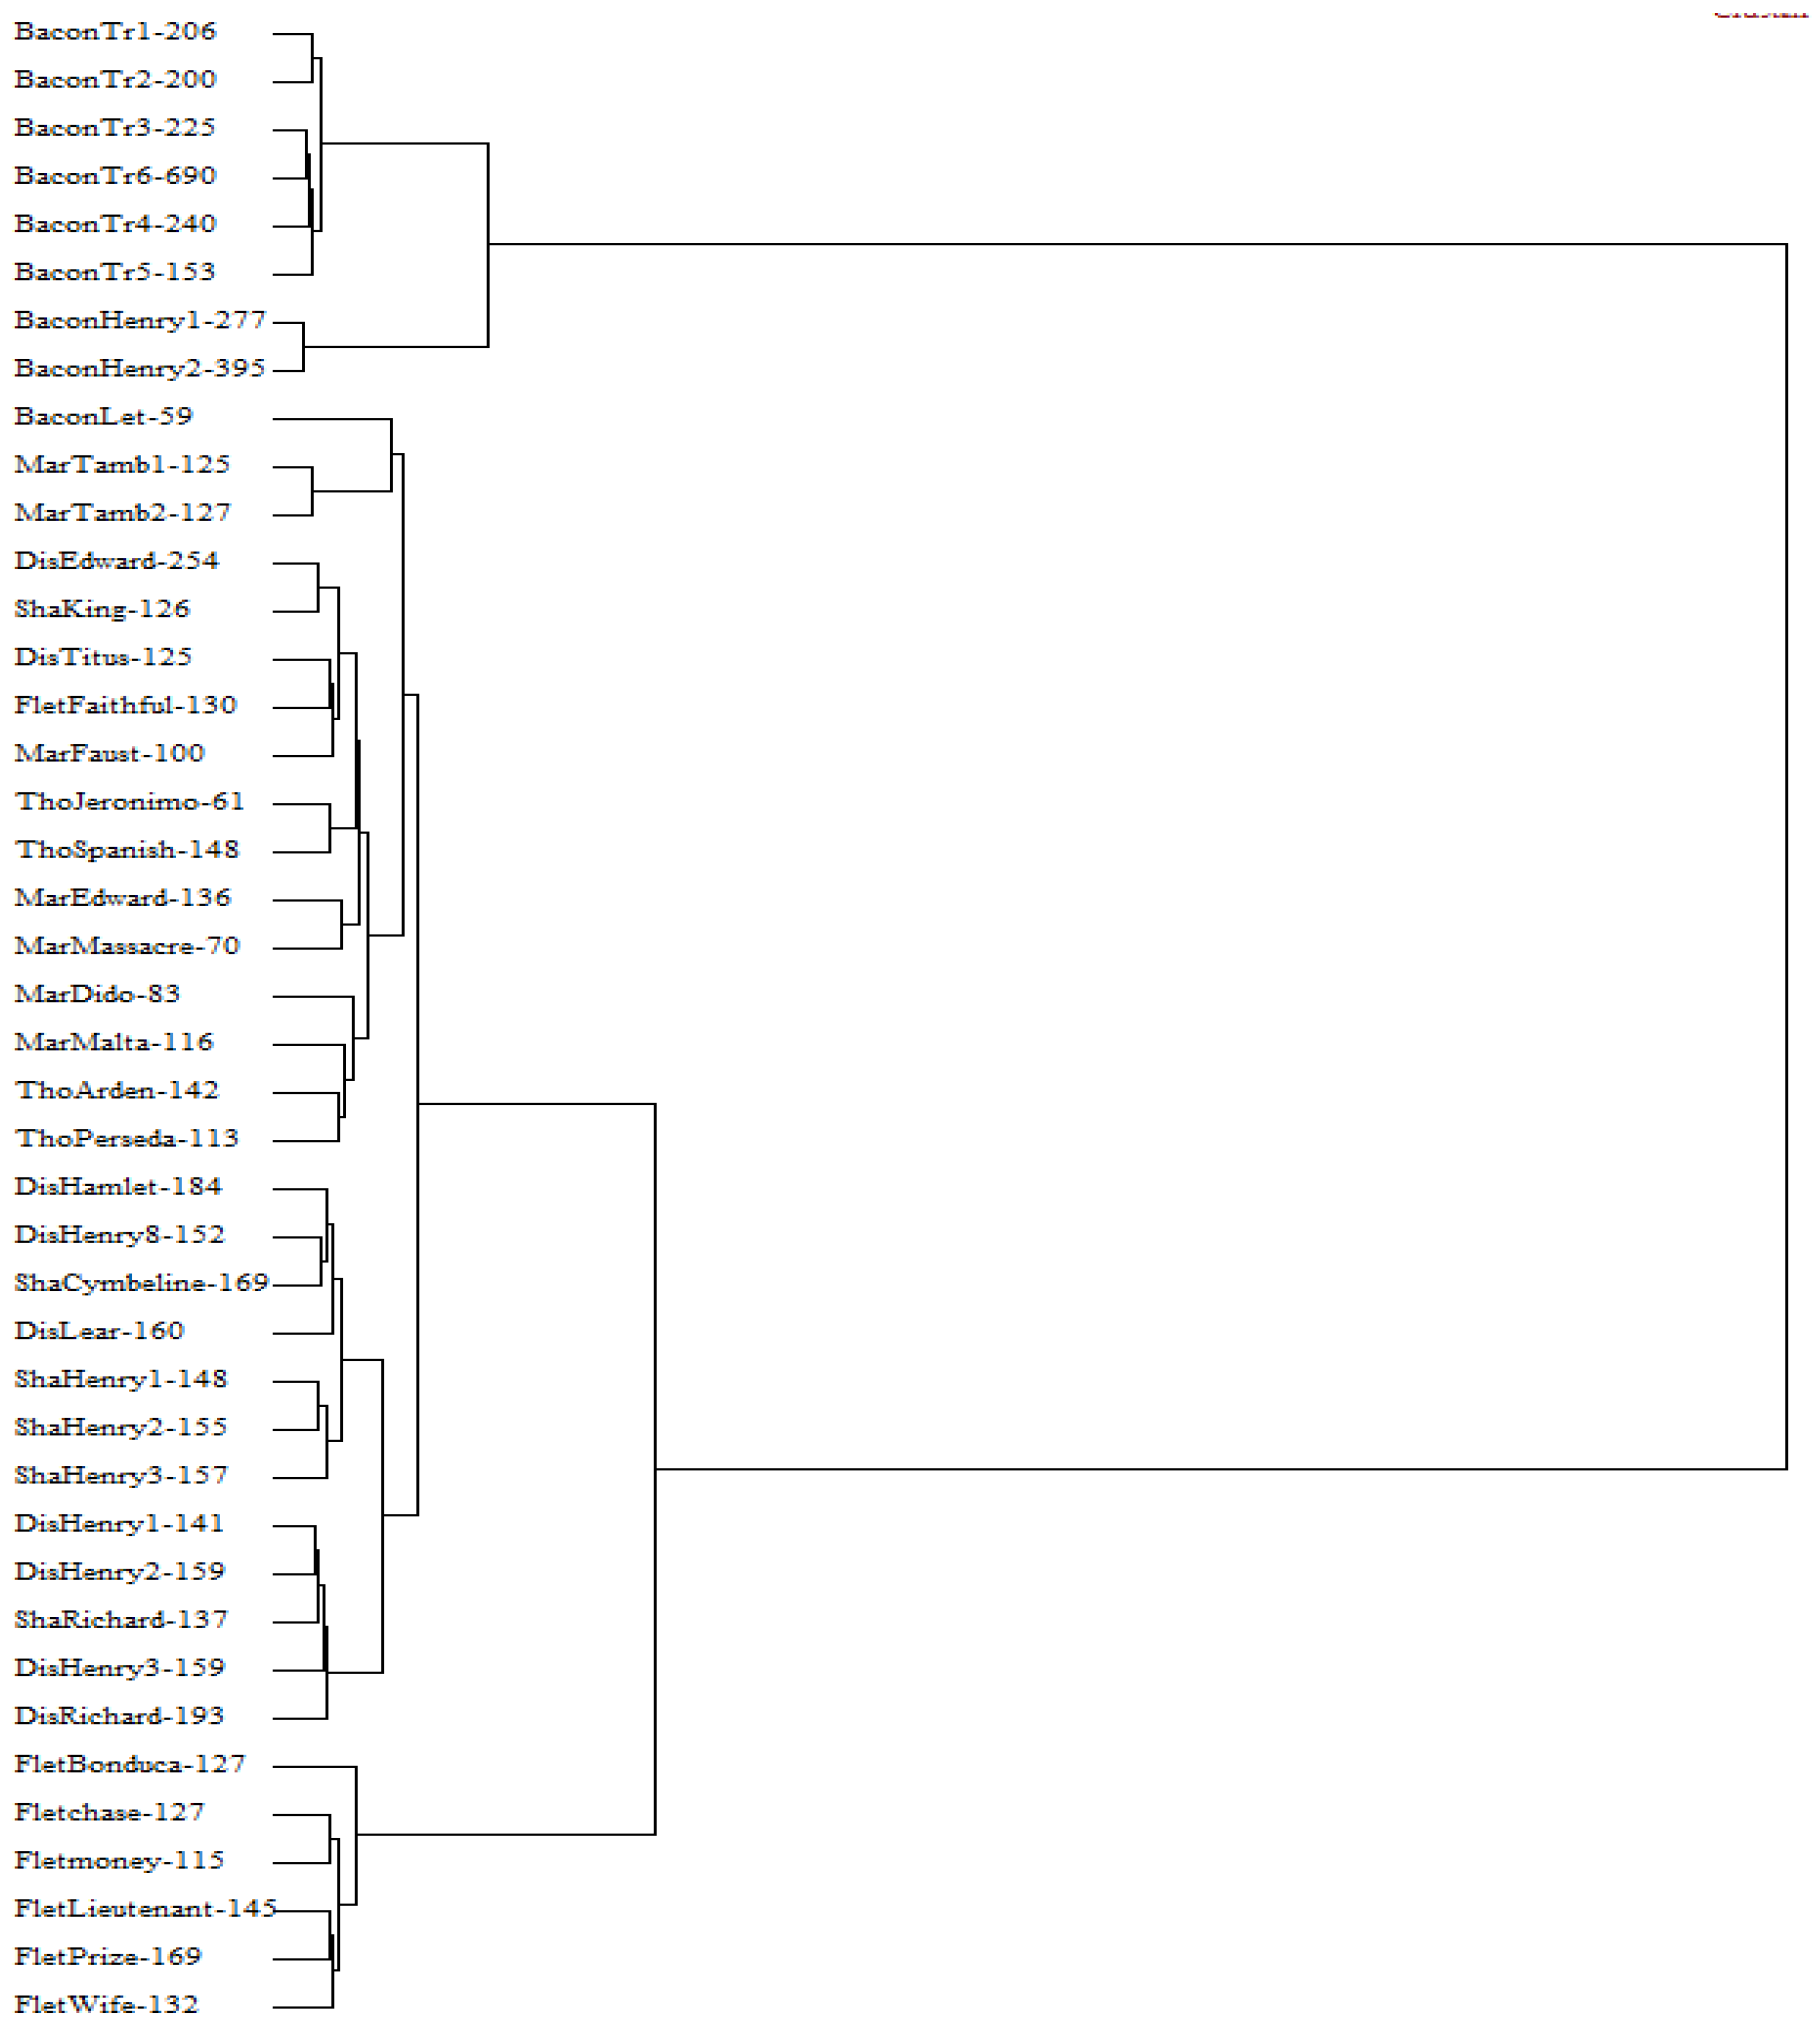
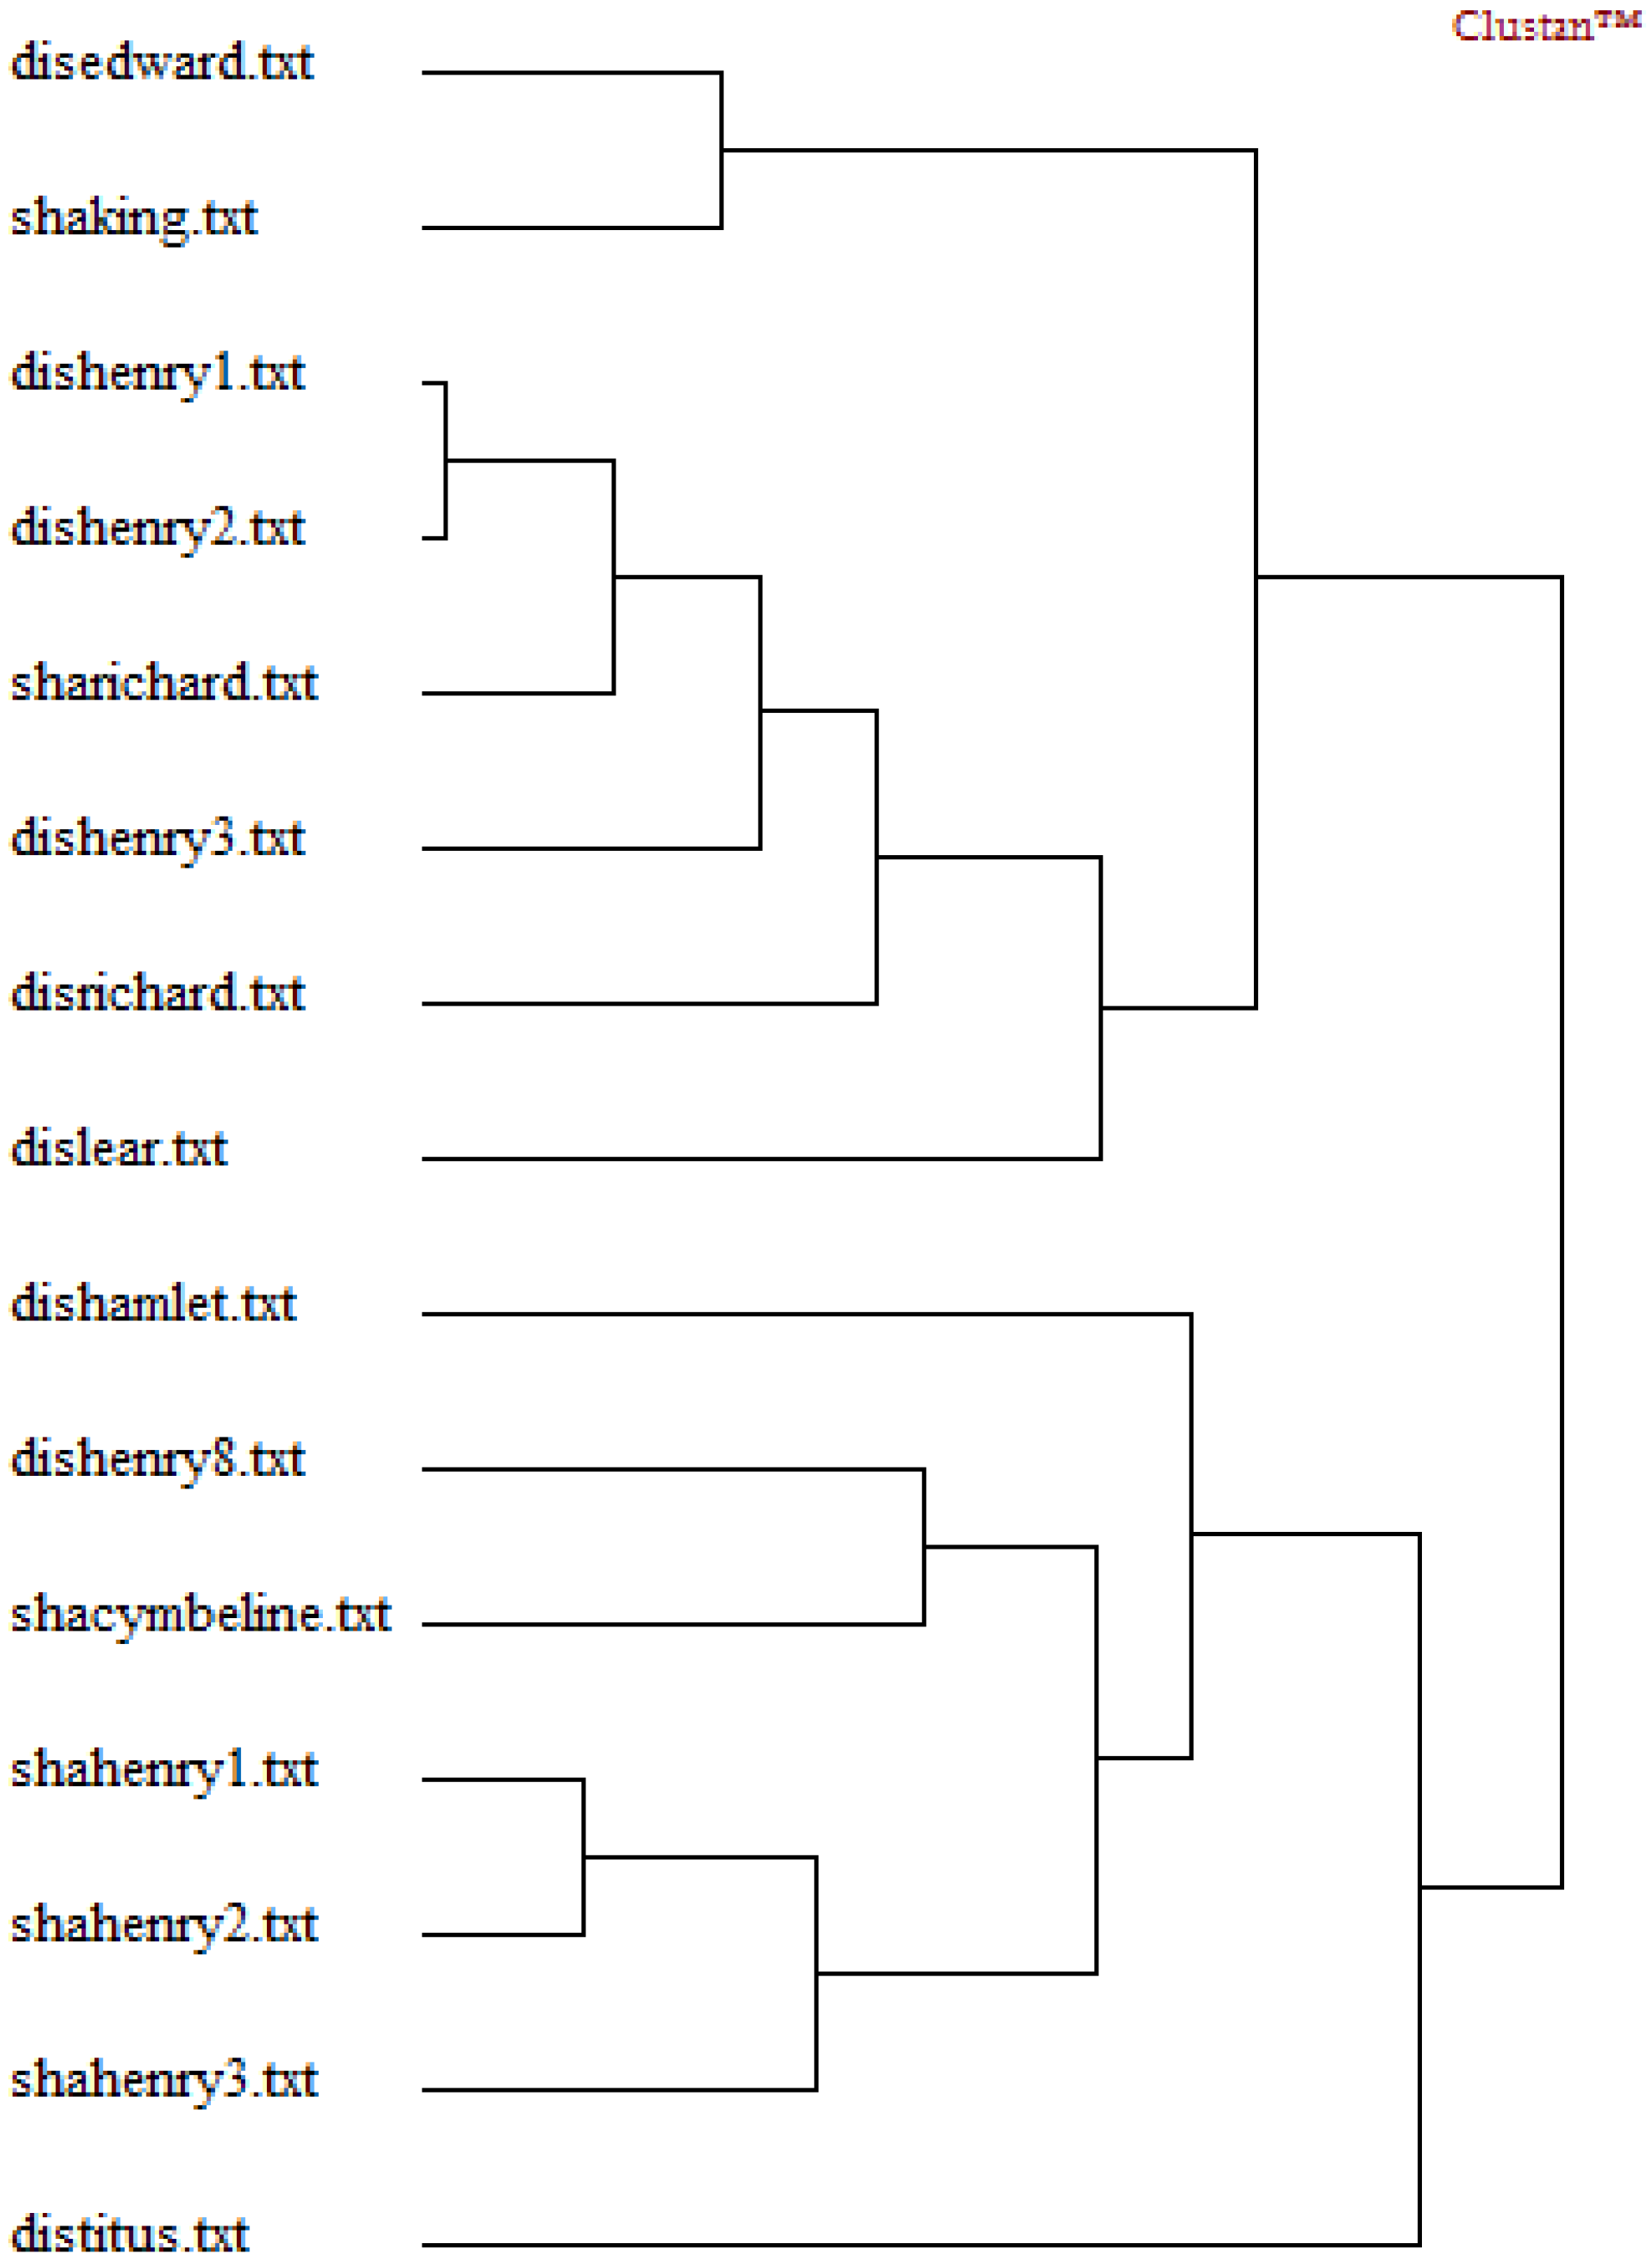
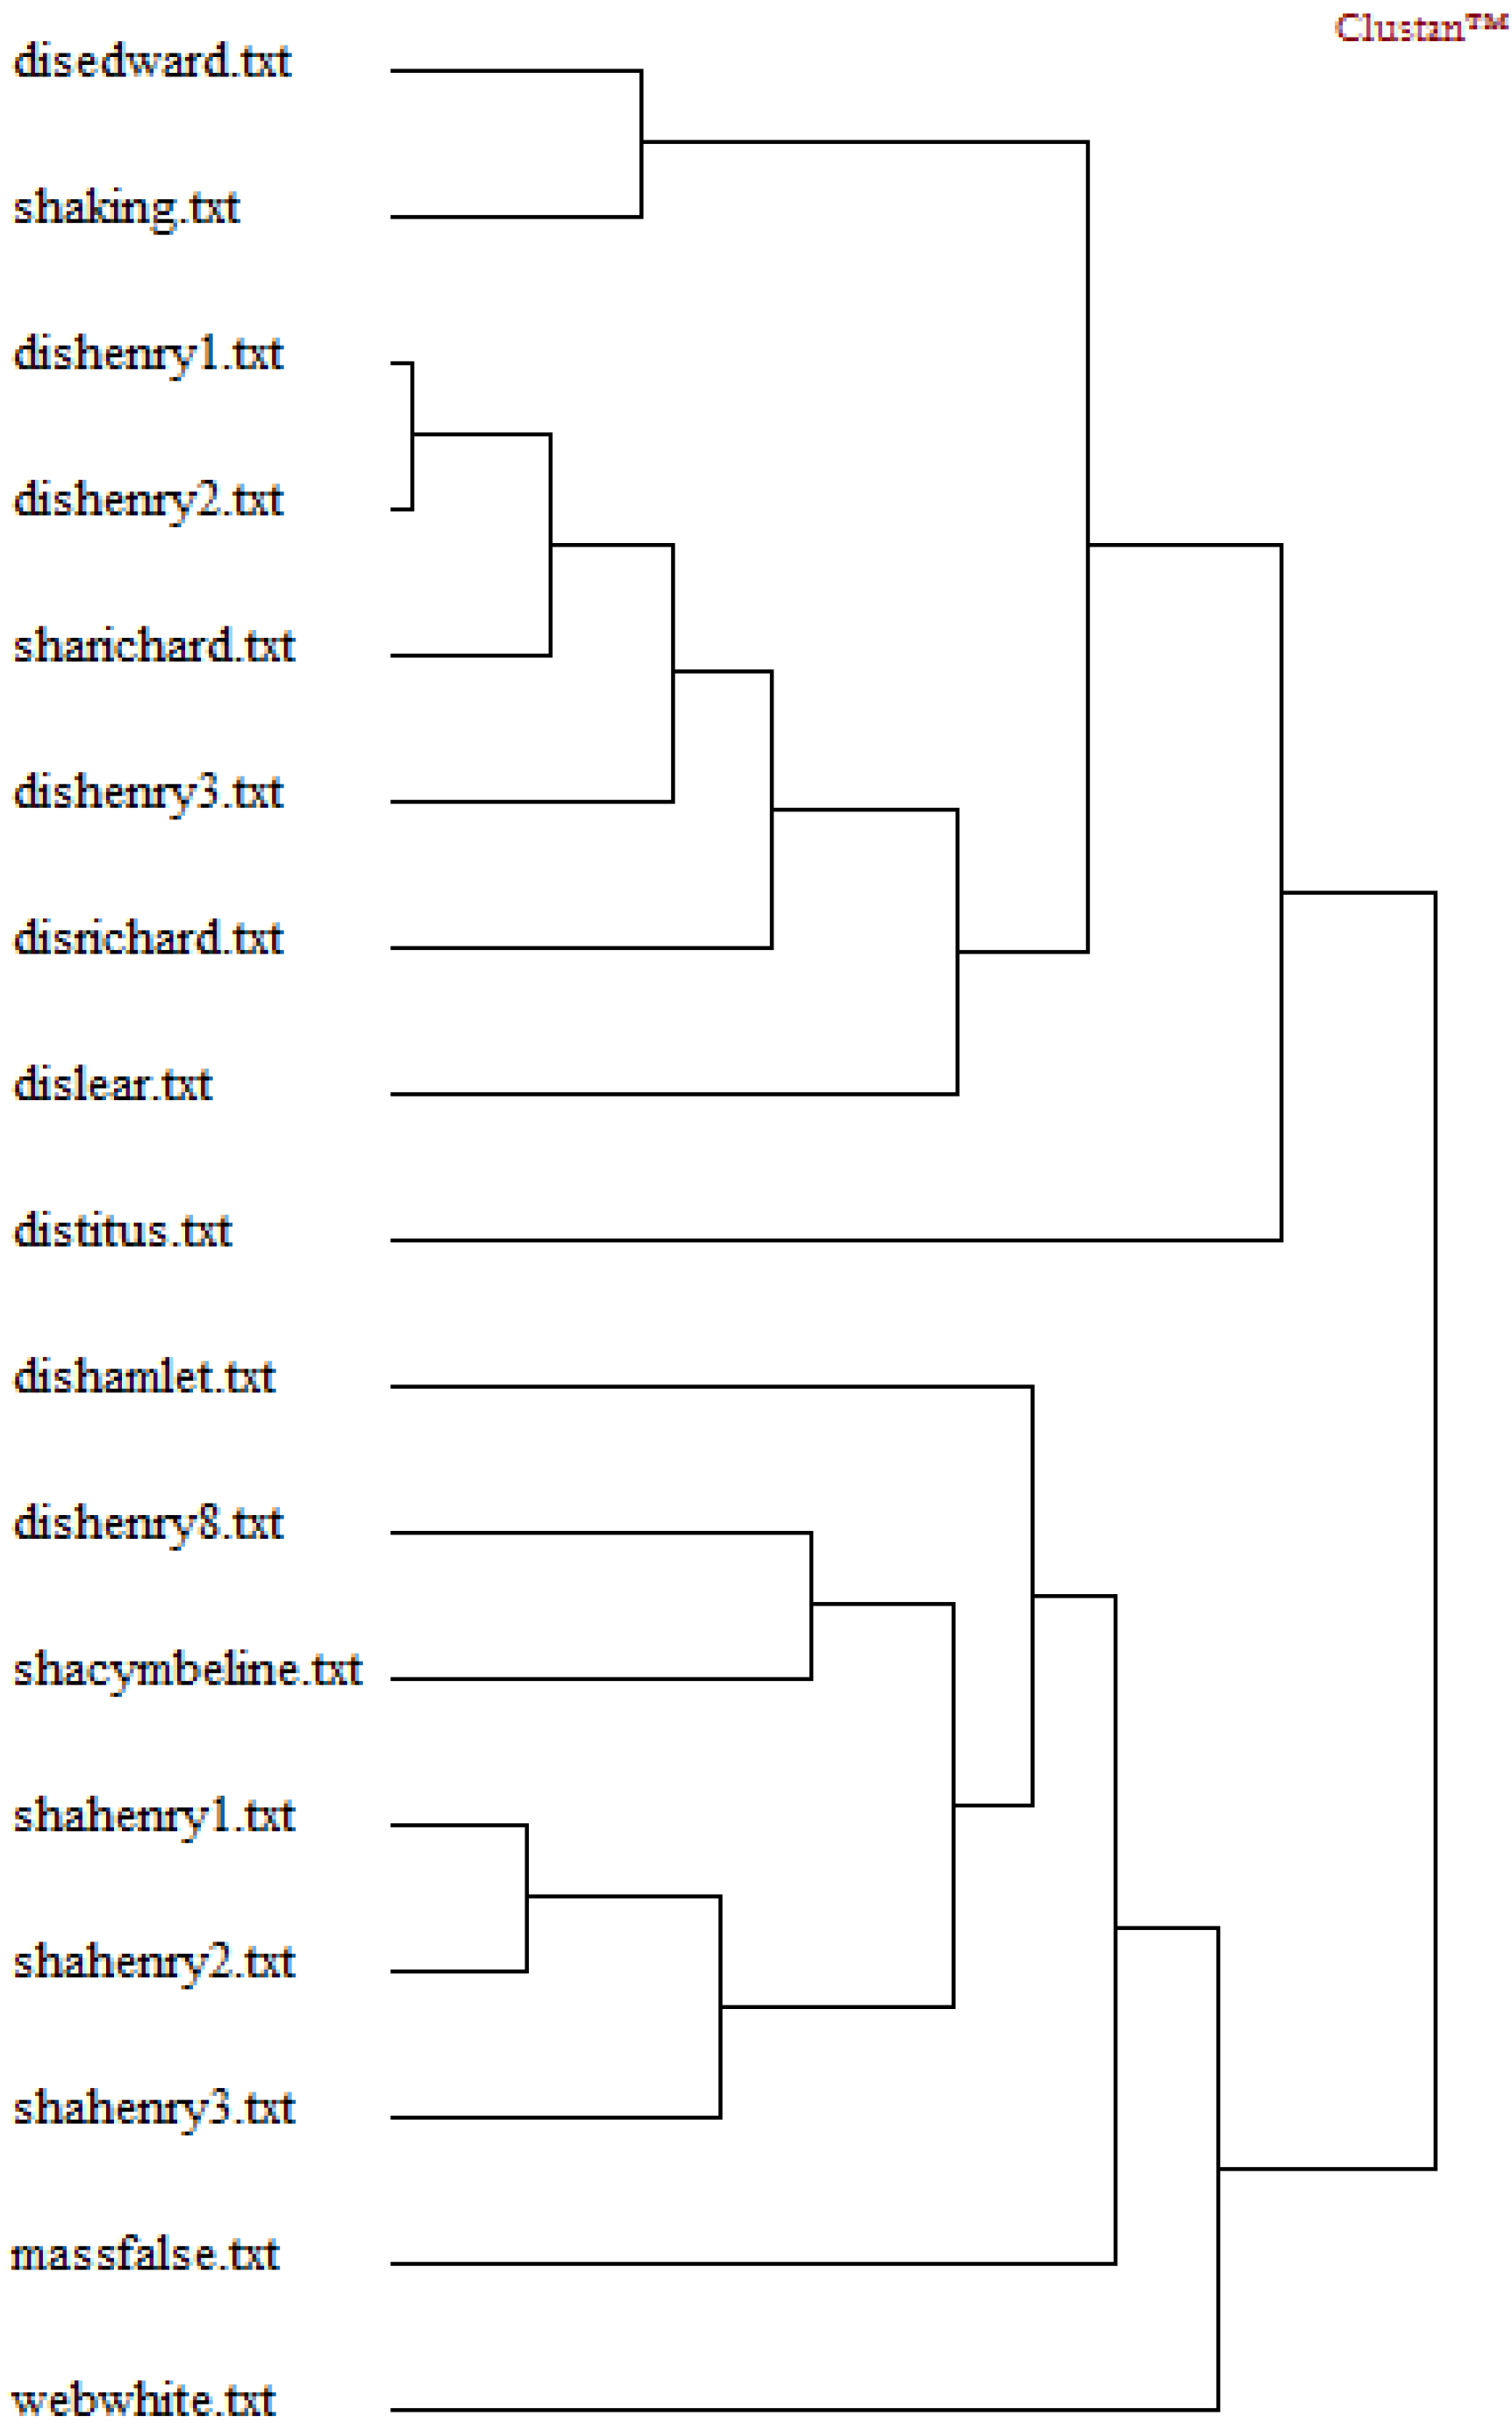
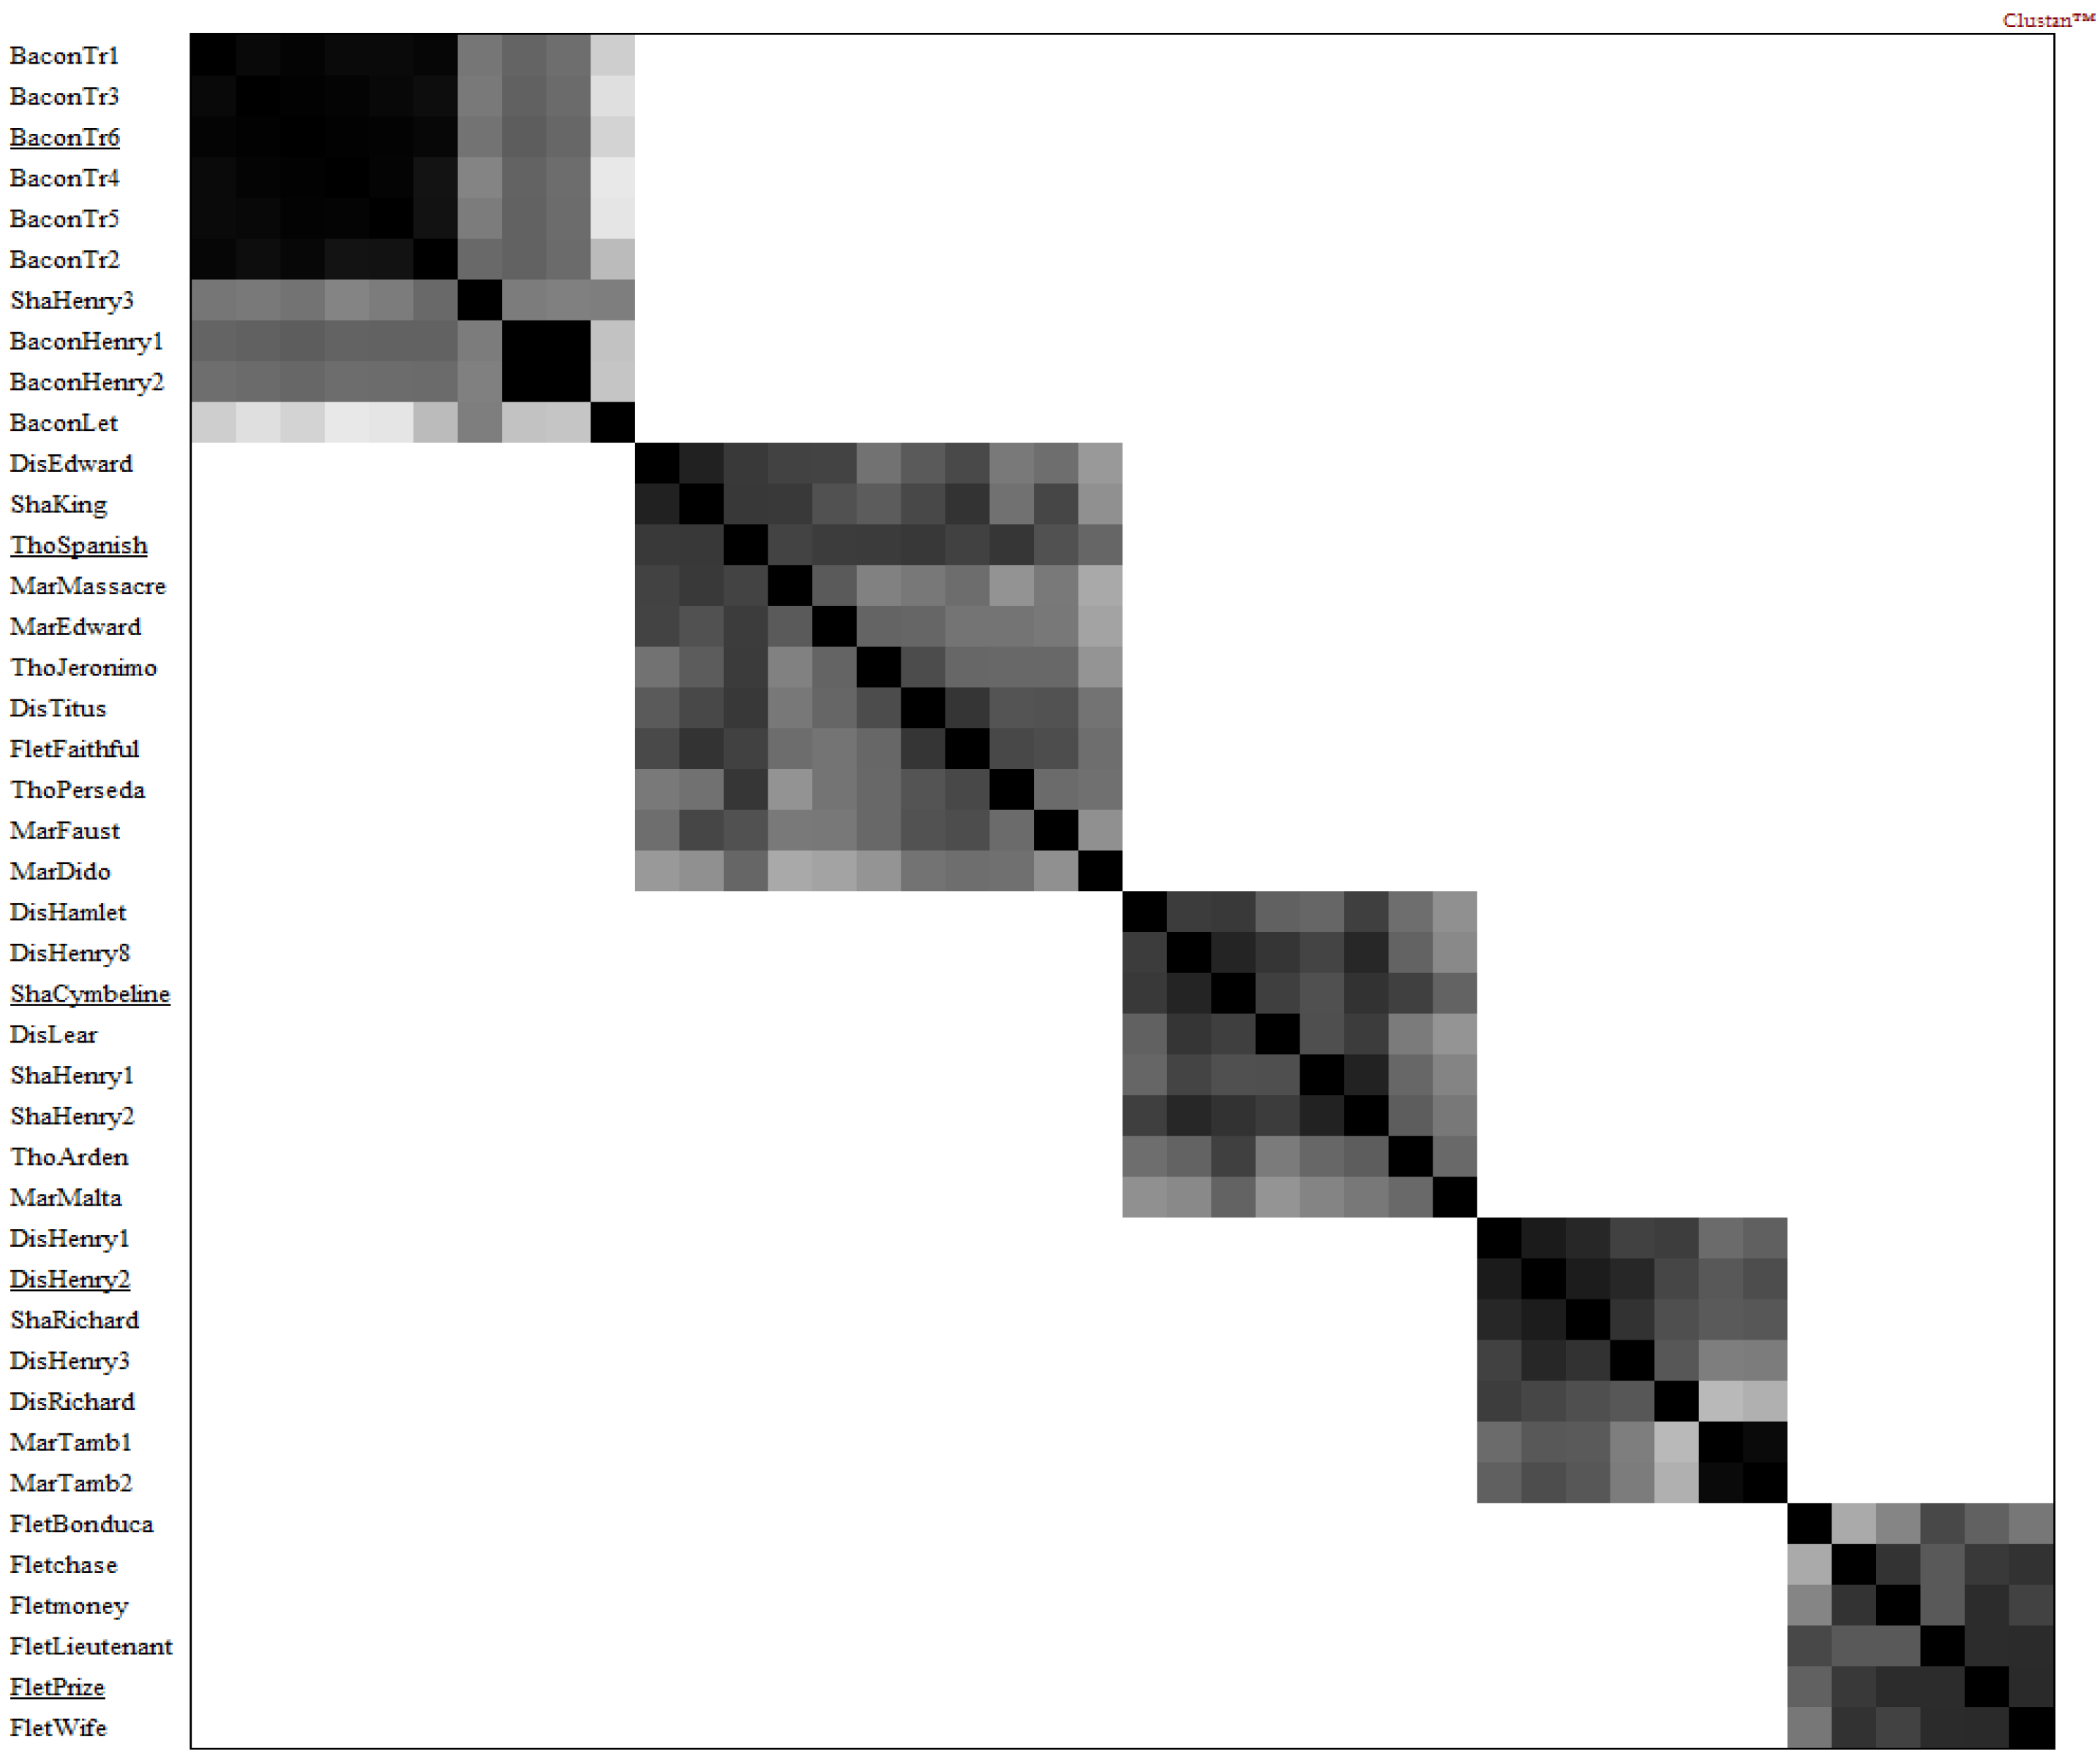
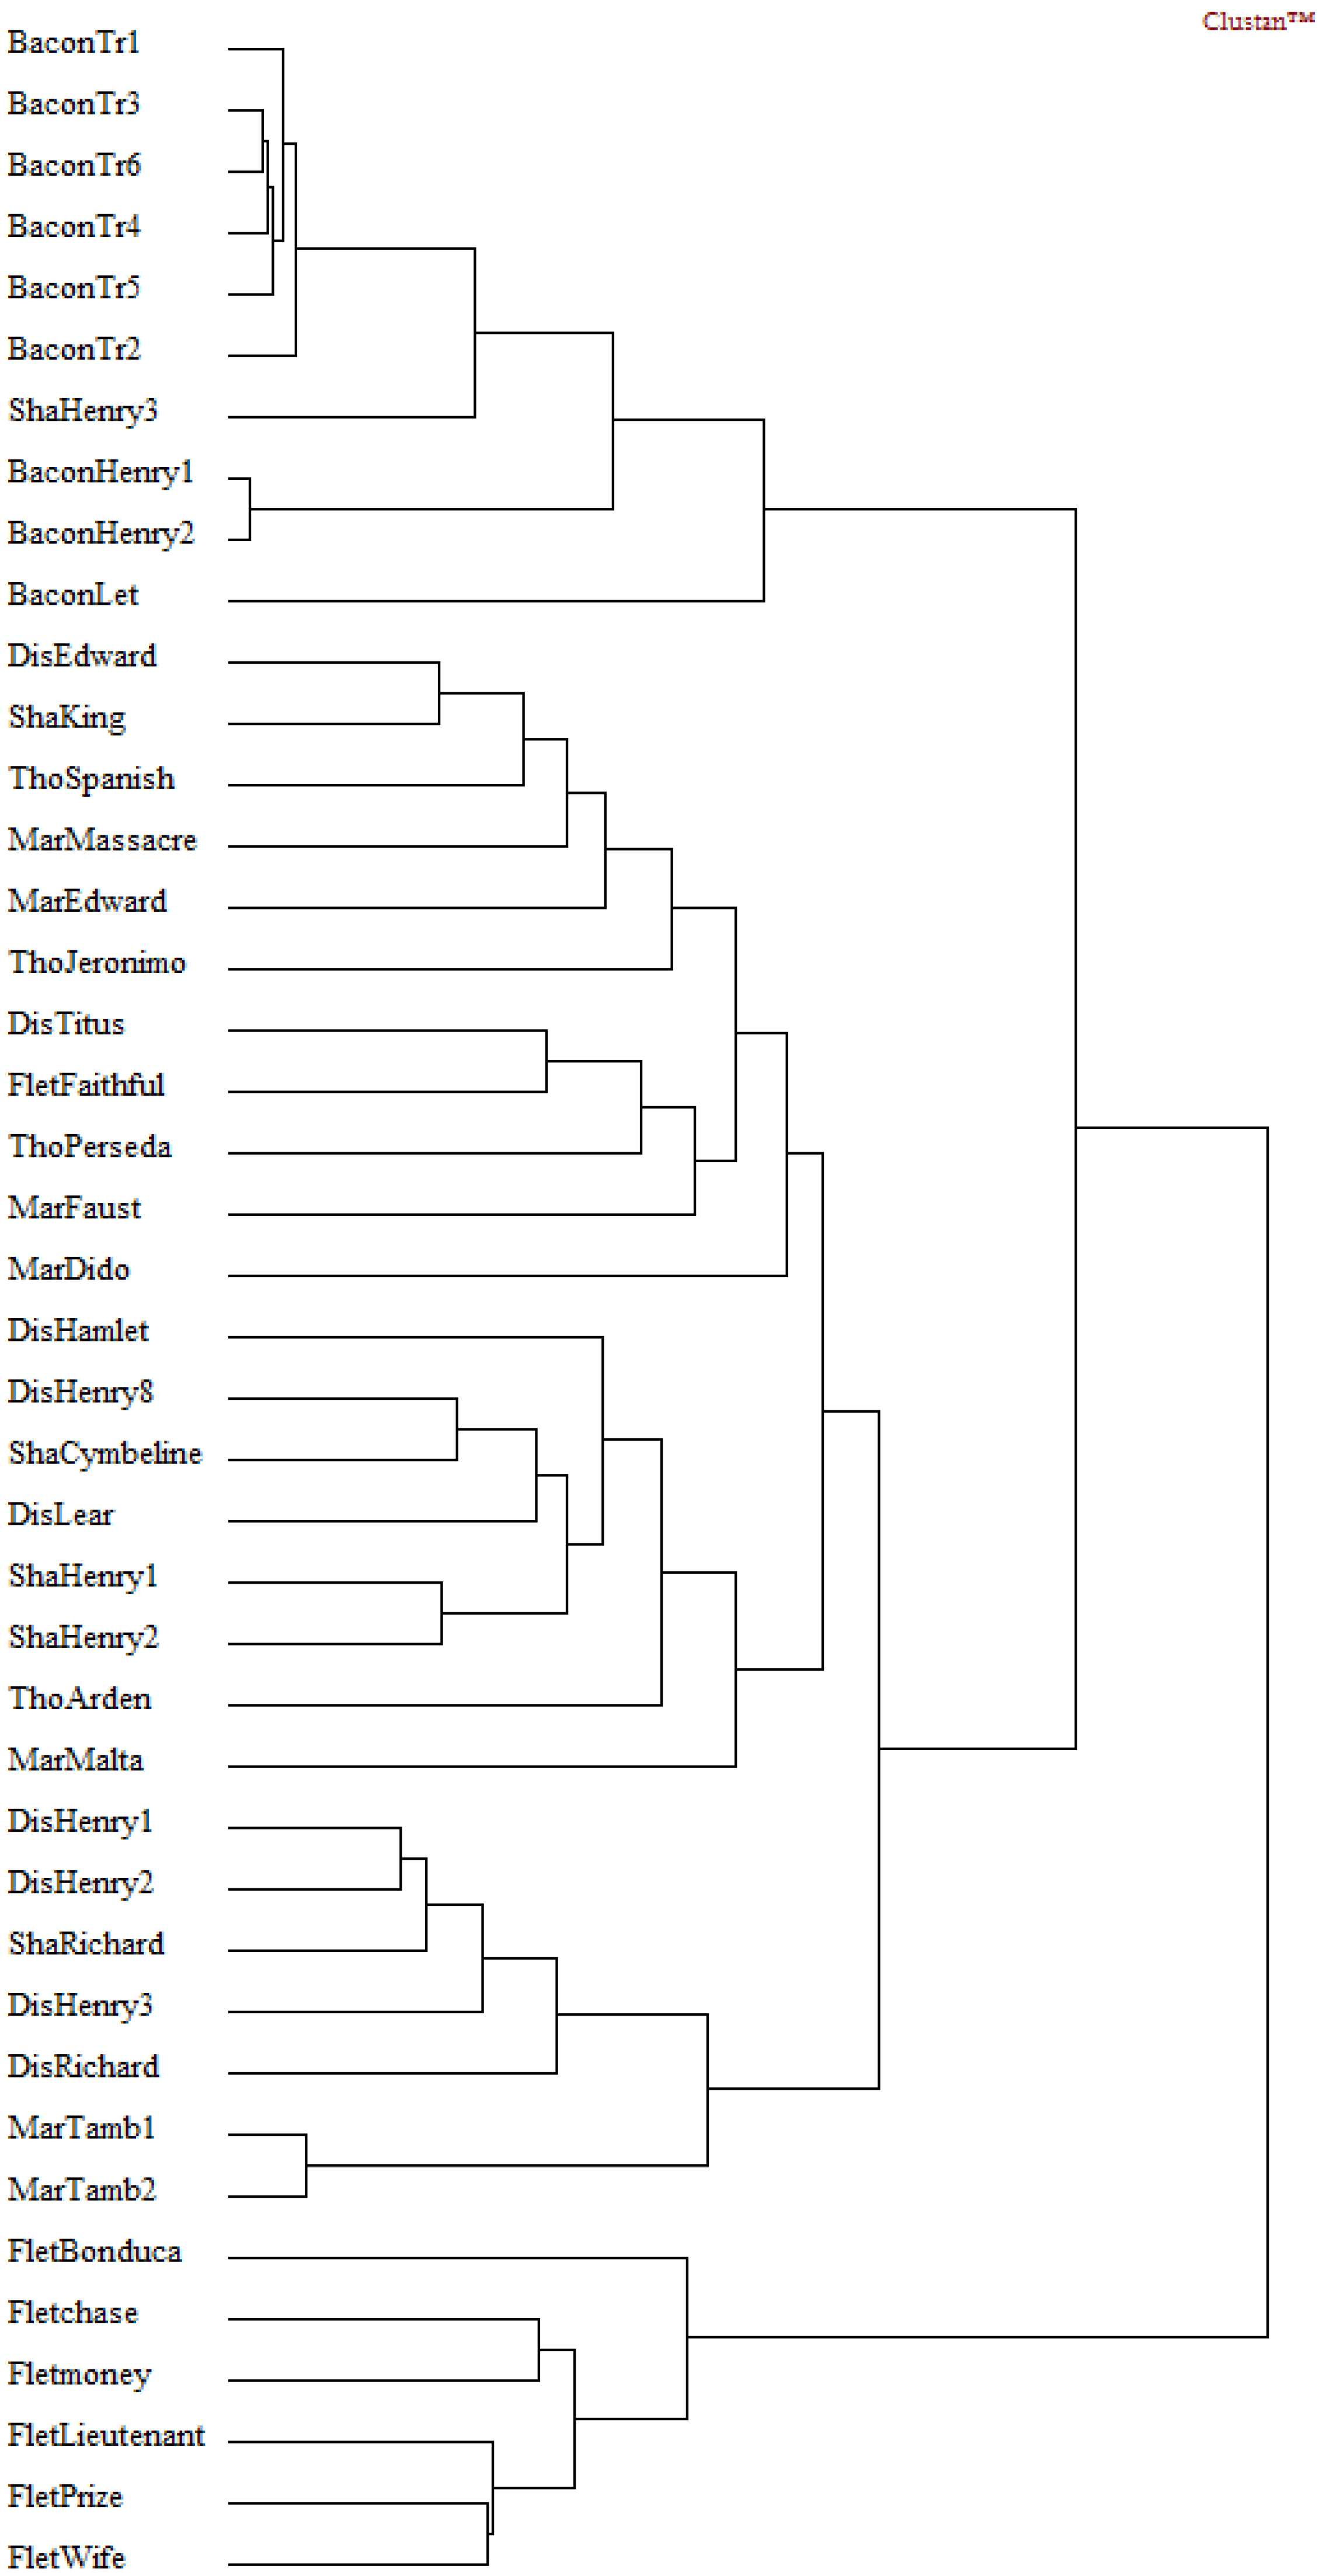
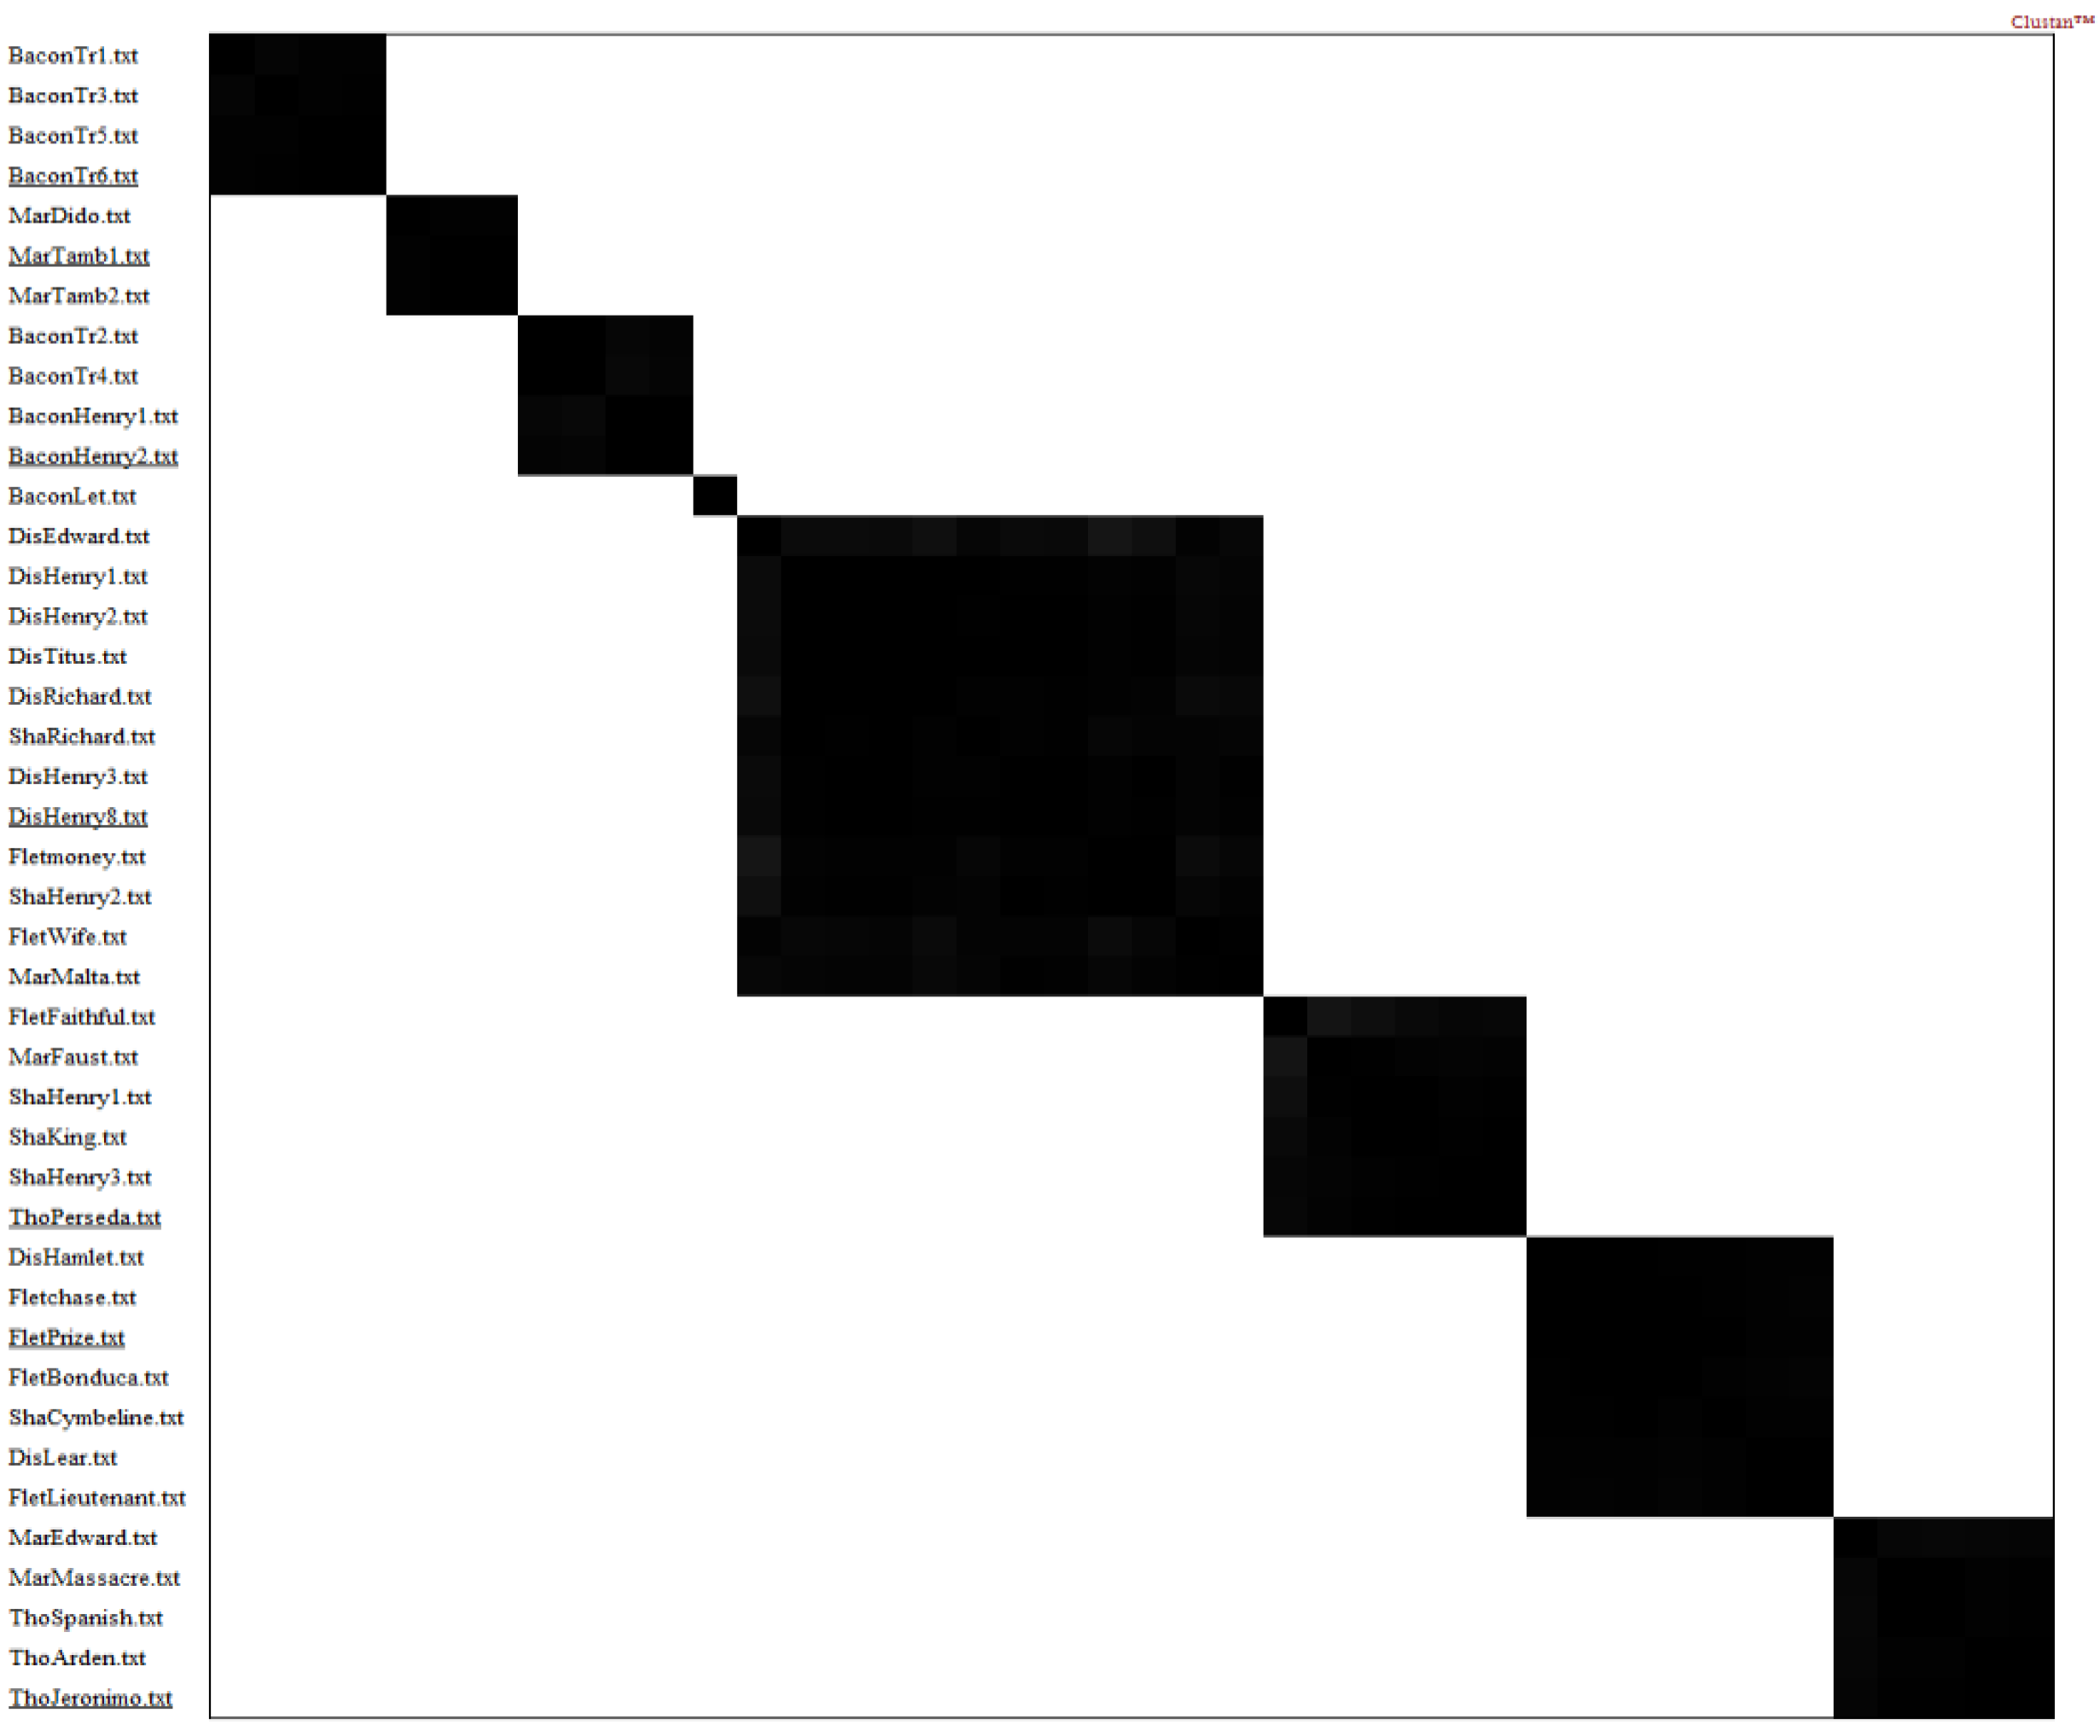
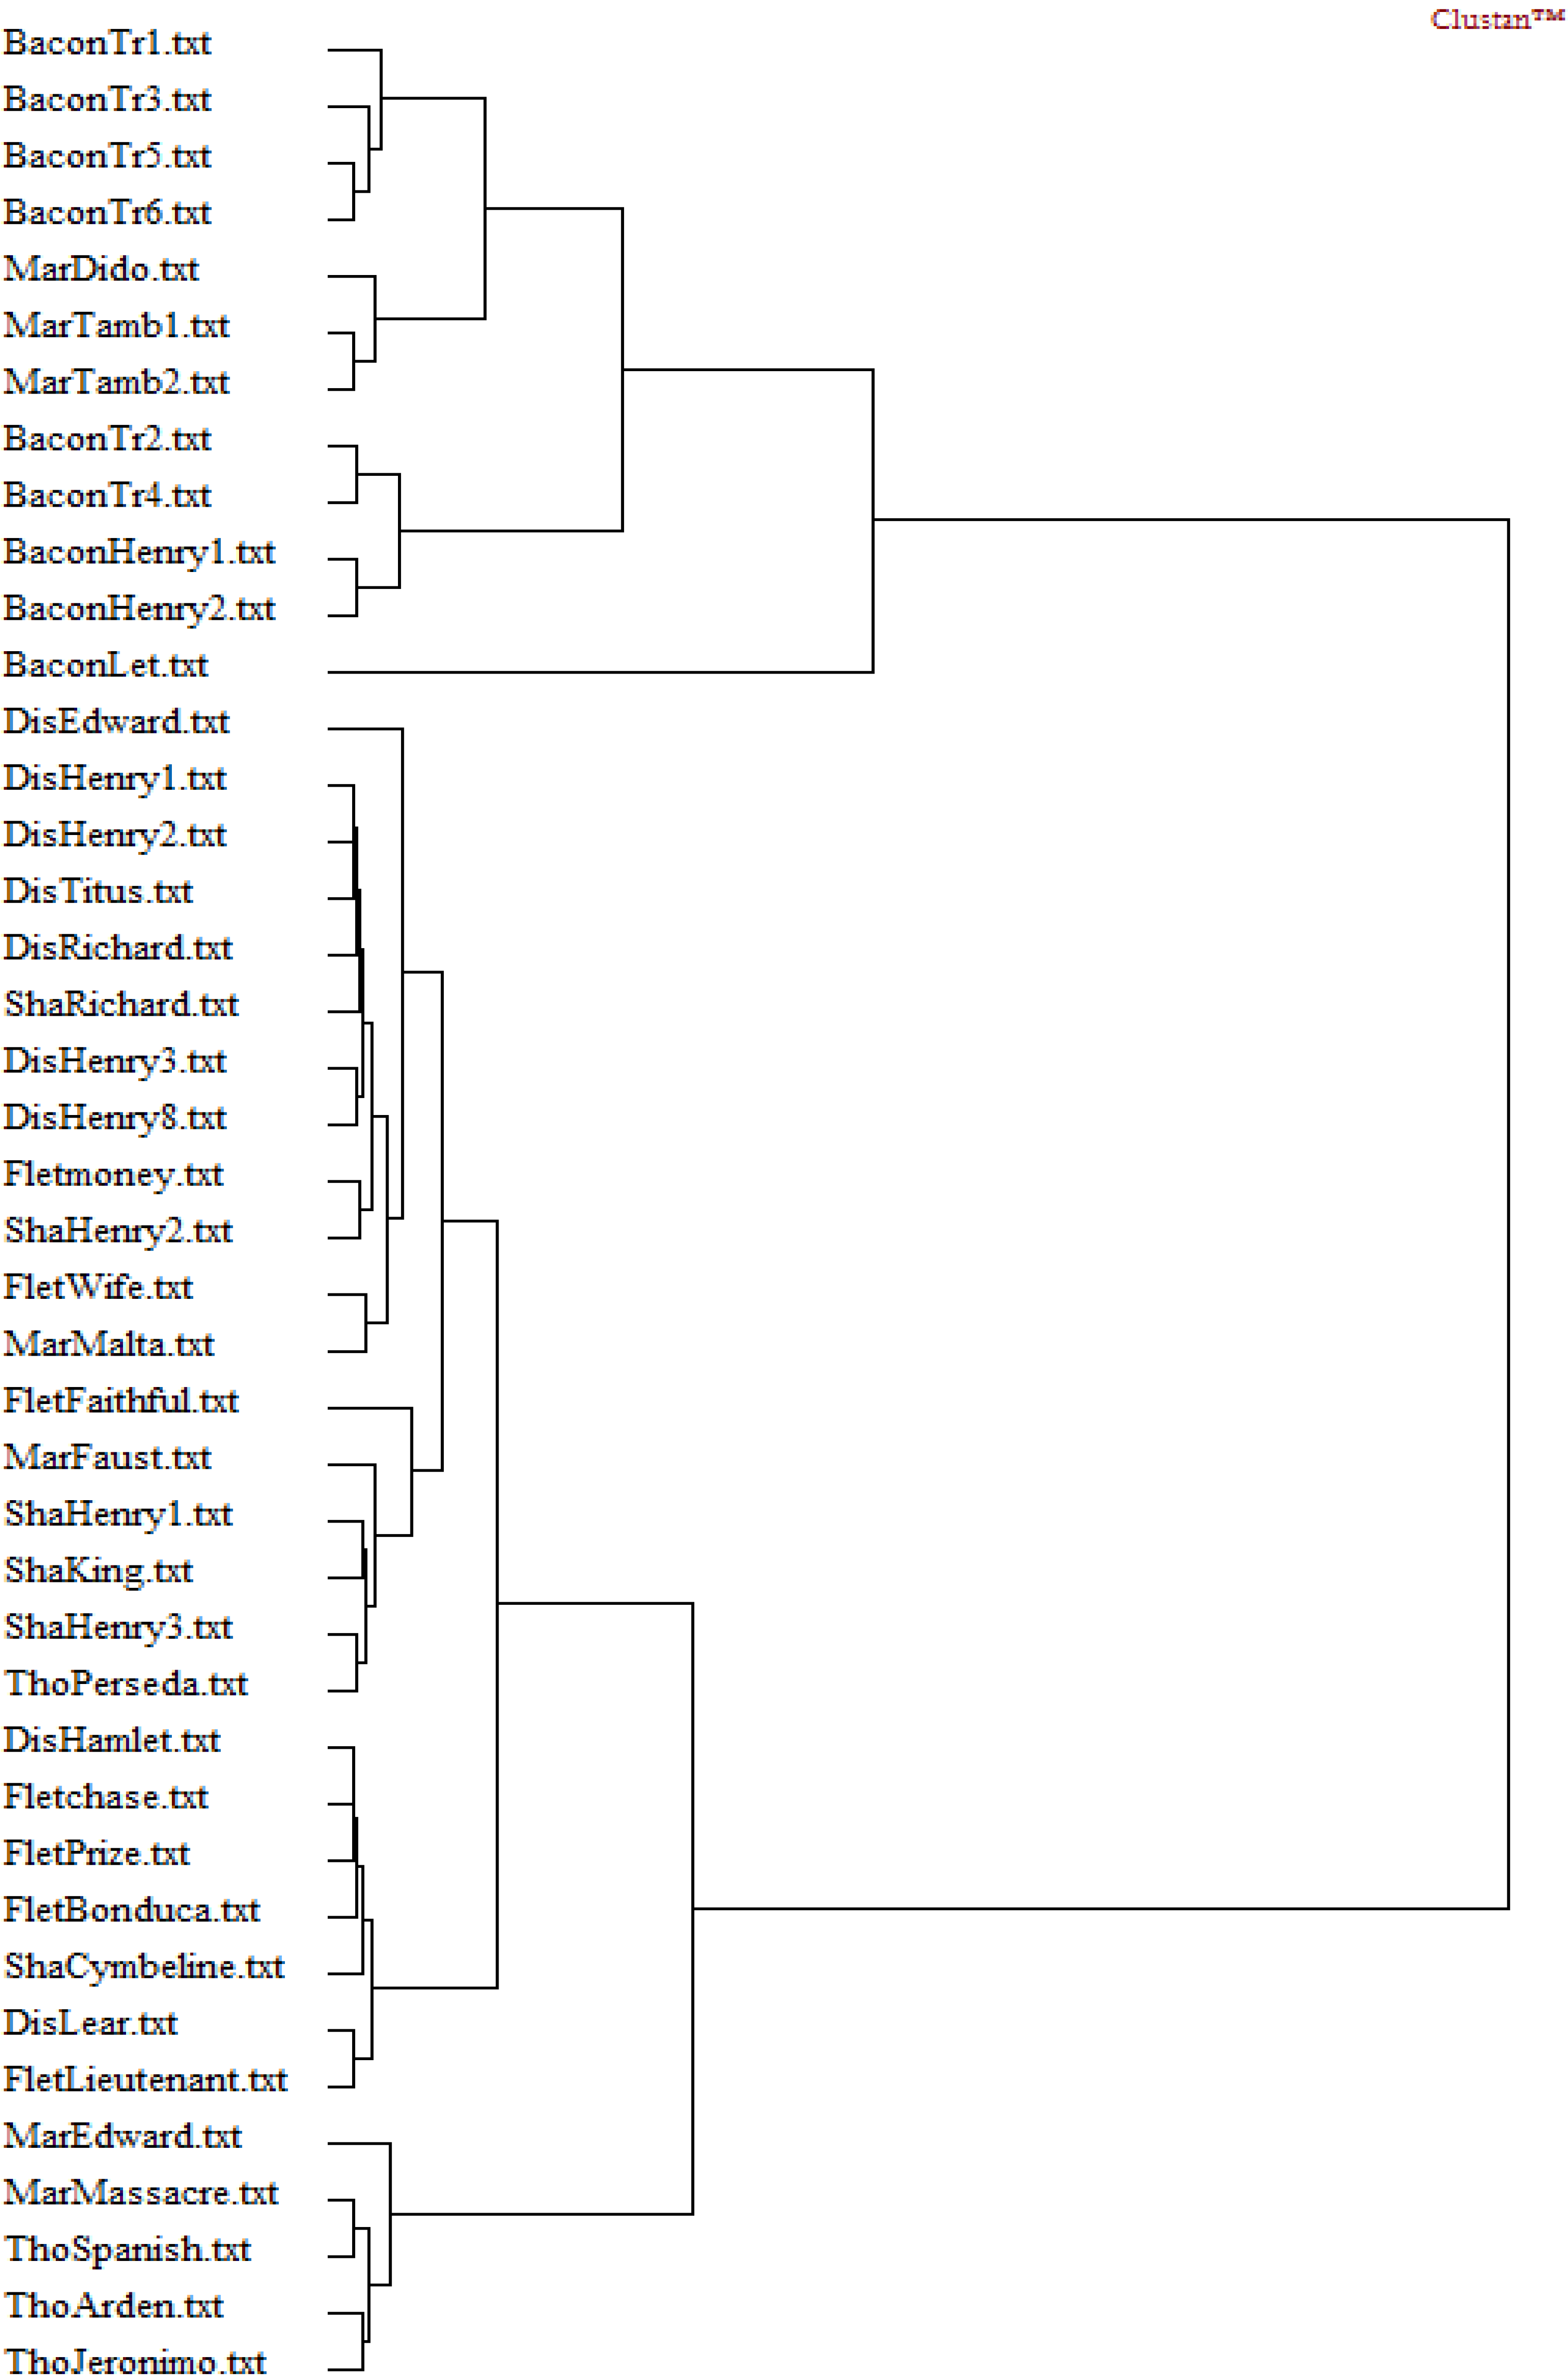
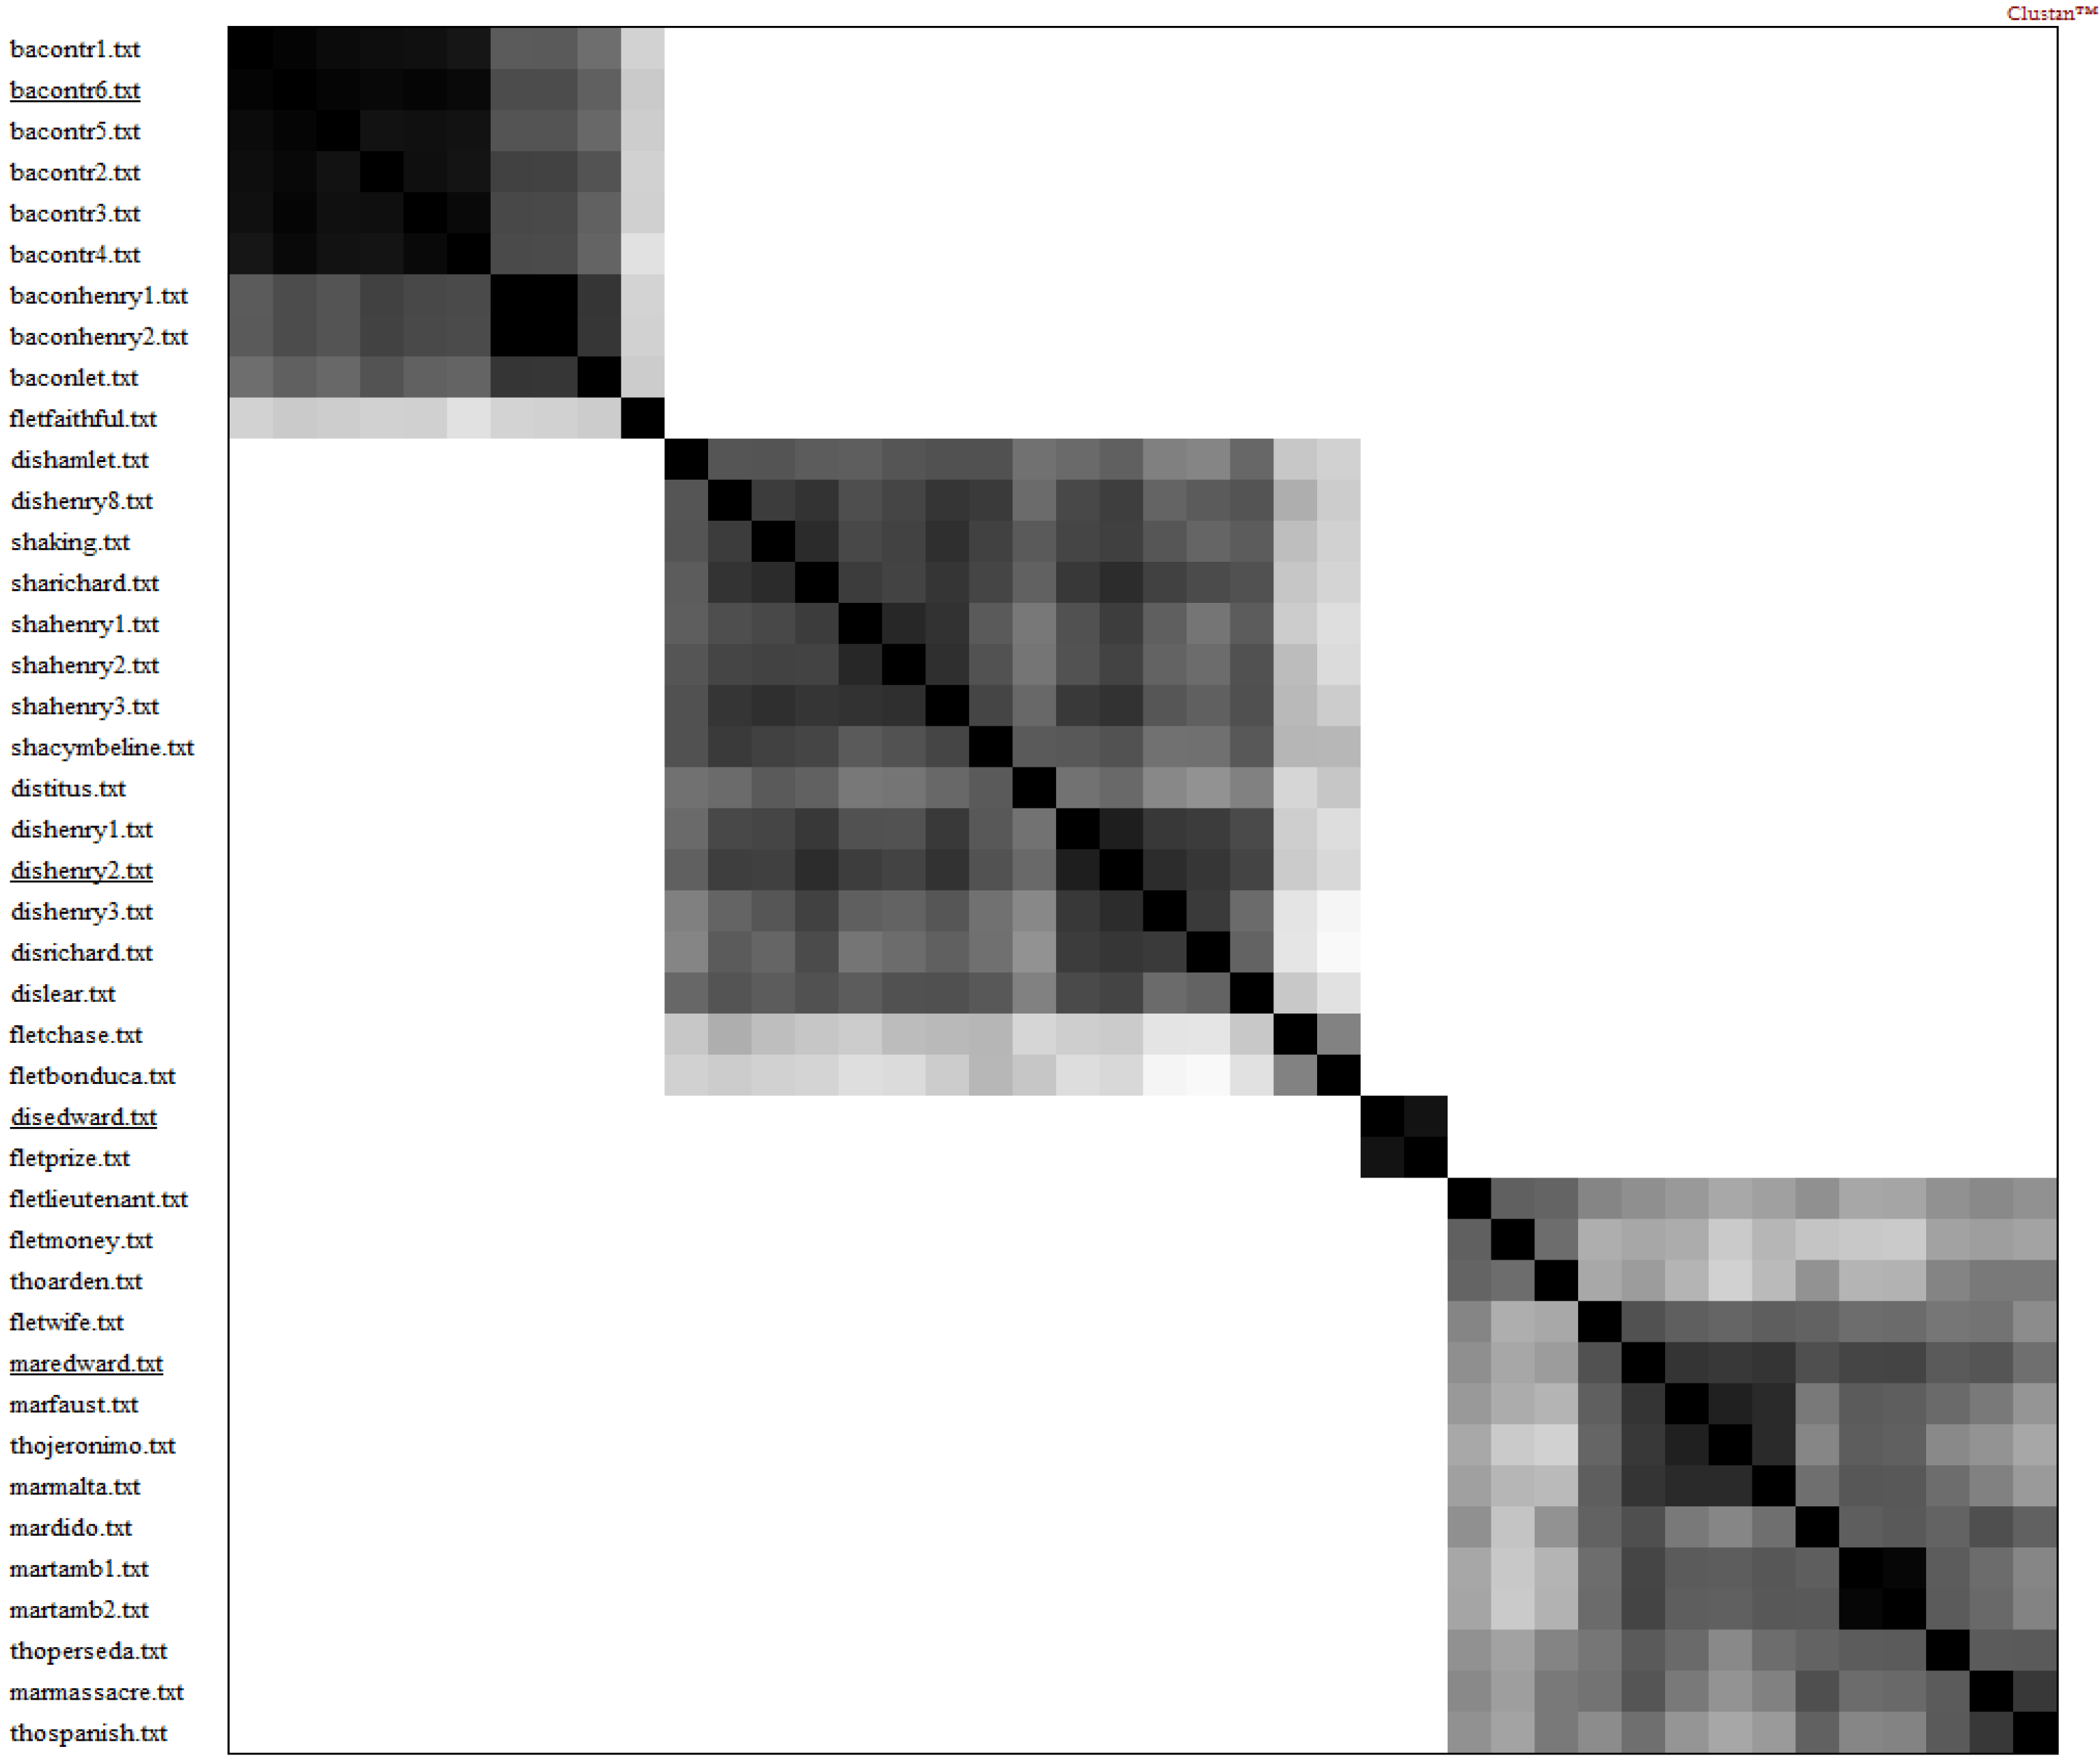
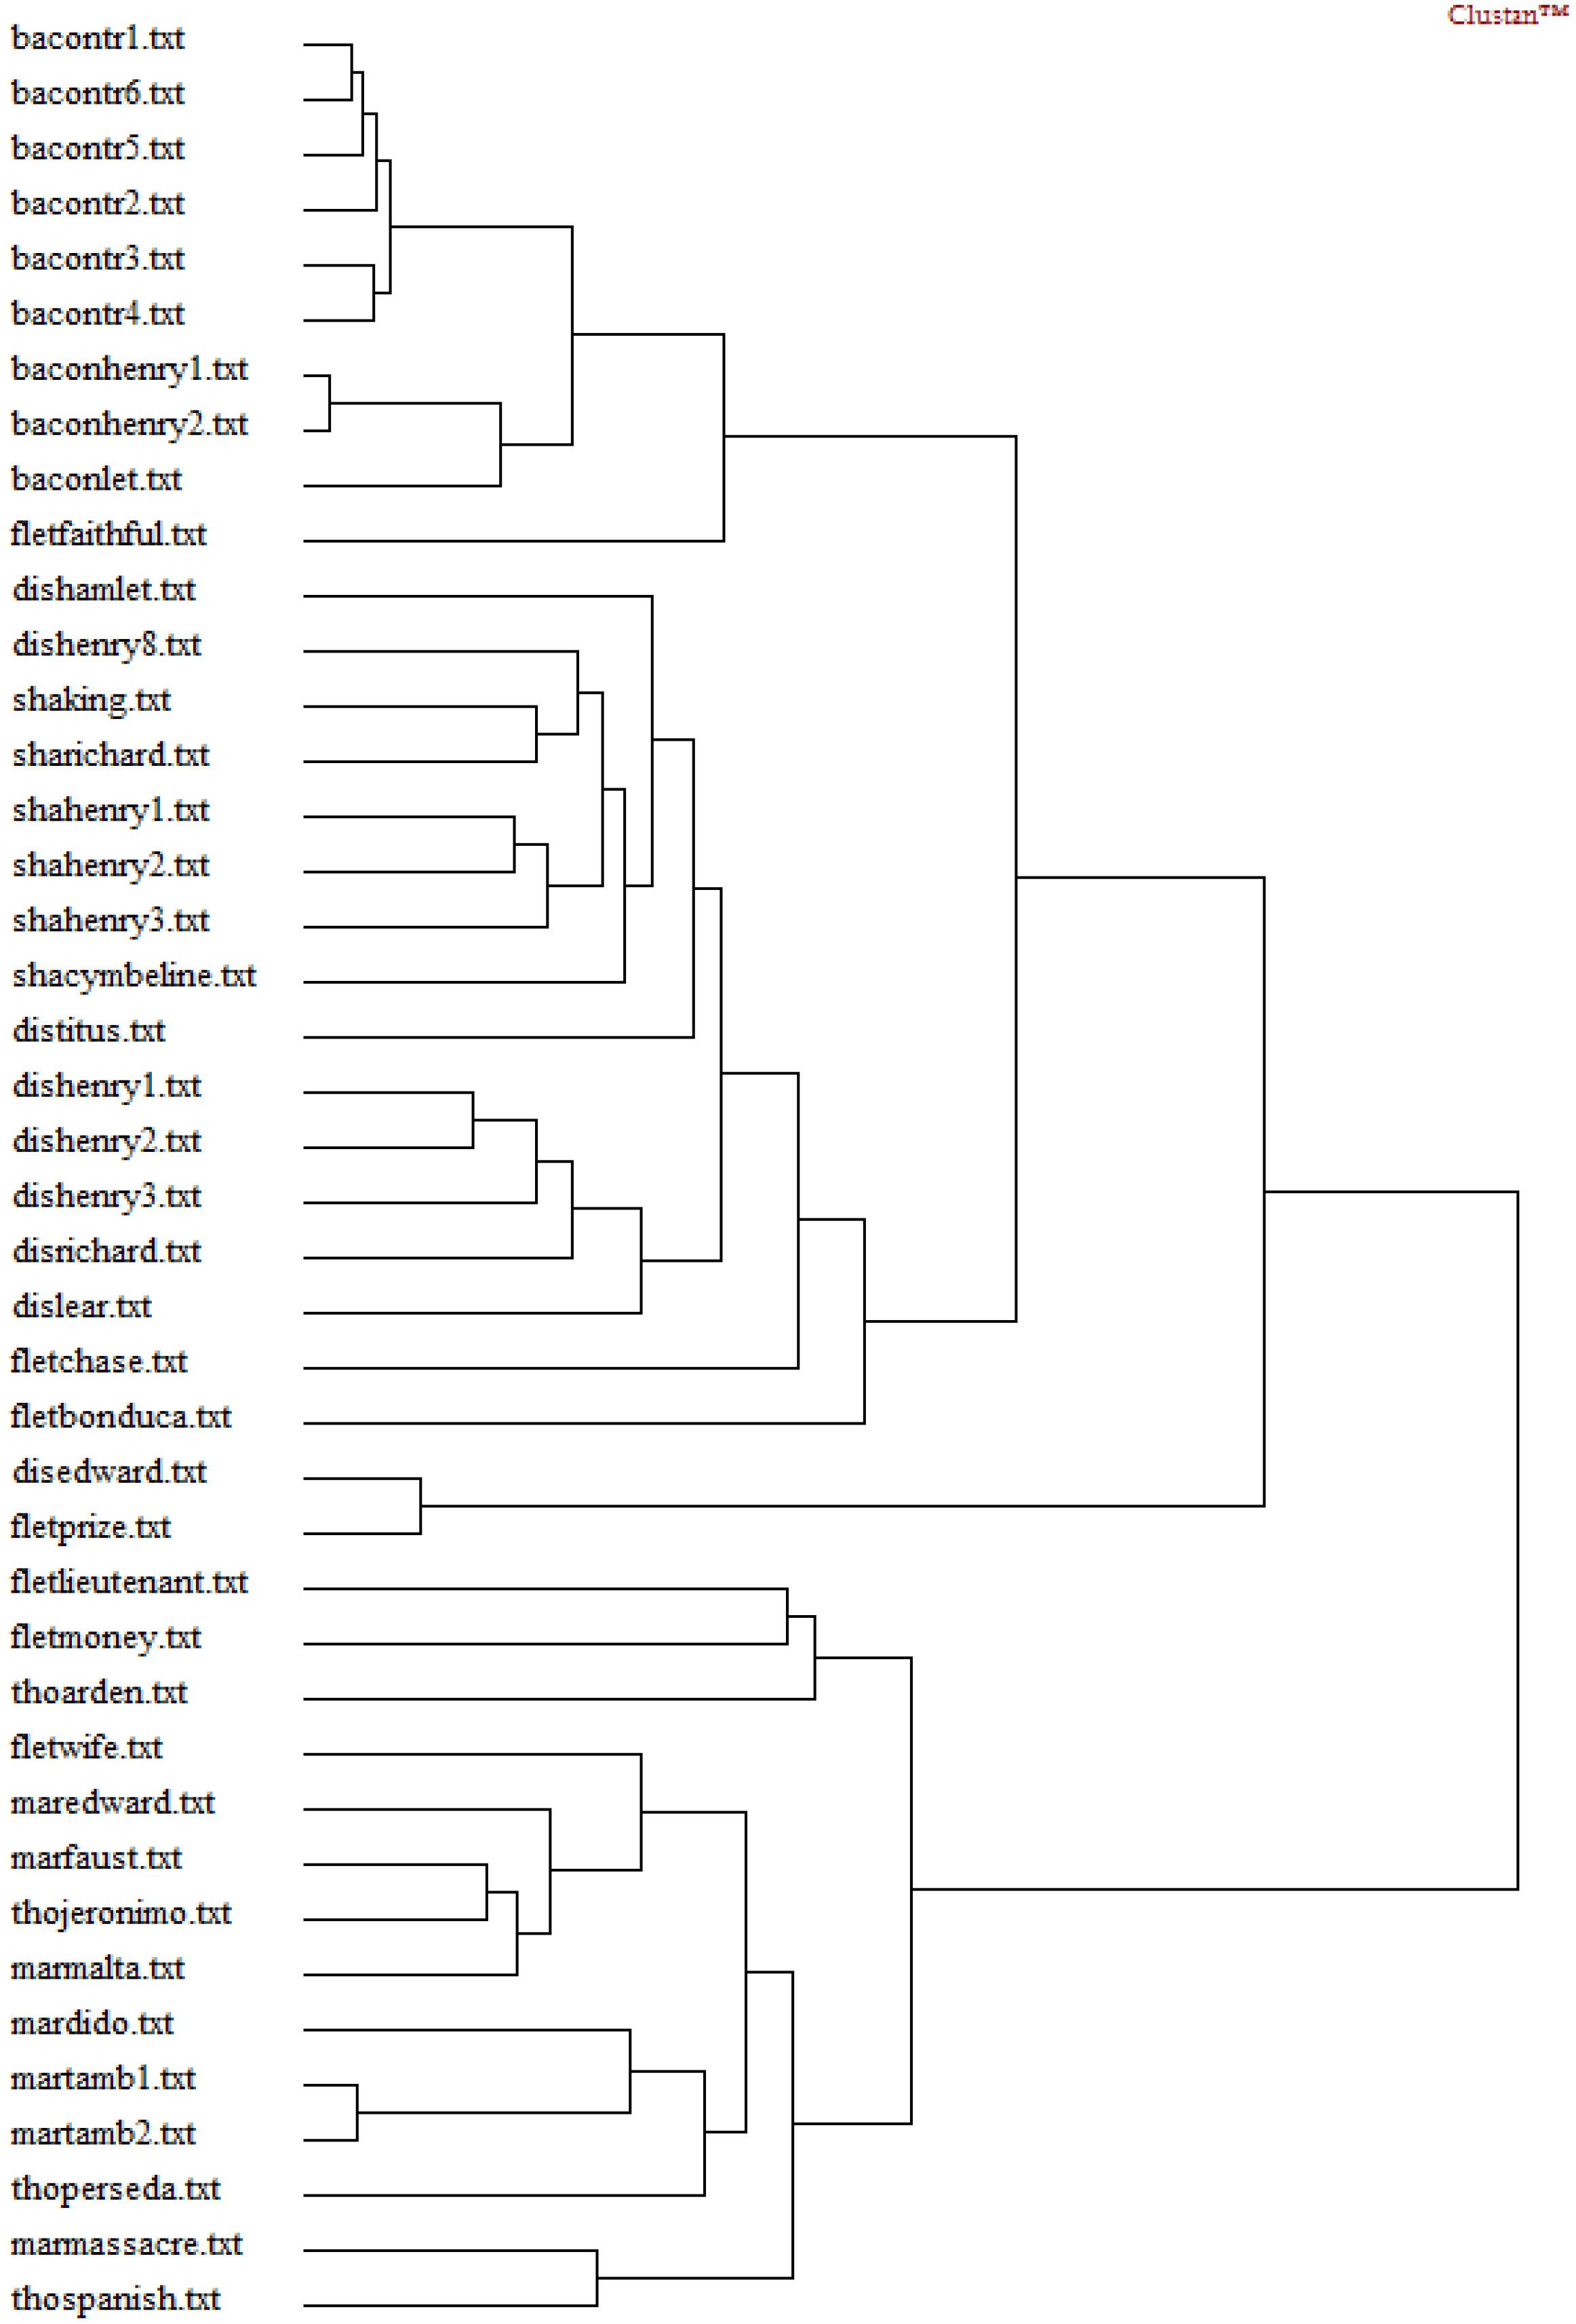
Hierarchical Cluster Analysis

Hierarchical cluster analysis constructs clusters in terms of measures of spatial distance among data vectors in the space as the basis for clustering. It provides more information than non-hierarchical ones in that it not only identifies the main clusters, but also identifies their constituency relations relative to one another as well as their internal structures. The hierarchical analysis was in a three-stage procedure. The first step was the construction of a one-dimensional symmetric matrix of proximity. The generic term “proximity” is used to cover both similarity and dissimilarity between and within pairs of vectors. Proximity between vectors can be measured in terms of their correlation, of angle between them, or distance in Euclidean space [33,34]. These are closely related, and if all the variables are measured on the same scale or have been standardized, there is no particular reason to prefer one over another. The Correlation coefficient (Product-moment correlation) is conveniently applied to cluster analysis by any one of a variety of methods of hierarchical cluster analysis to measure the proximity between all pairs of vector profiles in Euclidean space, with the profiles formed across the variables [55,56], and so is used here. The proximity between two vector profiles was calculated as the correlation between the two profiles taken on by the two vectors. Two vectors are perfectly similar when they have the same profiles regardless of overall magnitude. This is expressed by the function:
S i , j =   K   1 N ( C k , i   C ¯ i ) ( C k , j   C ¯ j ) / K -1 N ( C k , i   C ¯ i ) 2 K -1 N ( C k , j   C ¯ j ) 2
The second was the examination of the proximity matrix. This was an “assessment of clustering tendency” test [57,58] to determine whether or not a non-random structure actually exists in DFW, Dbigram, and Dtrigram.
The third step was the generation of clusters based on the proximity matrix. Since there is no “best” single method or a group of hierarchical methods (i.e., each one of the methods that been used was found to be optimal for some application) [34,54], we selected the clustering method that gave the most intuitively clearest results about the constituency structure of the forty two text matrix row vectors. In the current case, this was Mean Proximity: the averages of the within-cluster correlations/distances were maximized for all cluster comparisons.

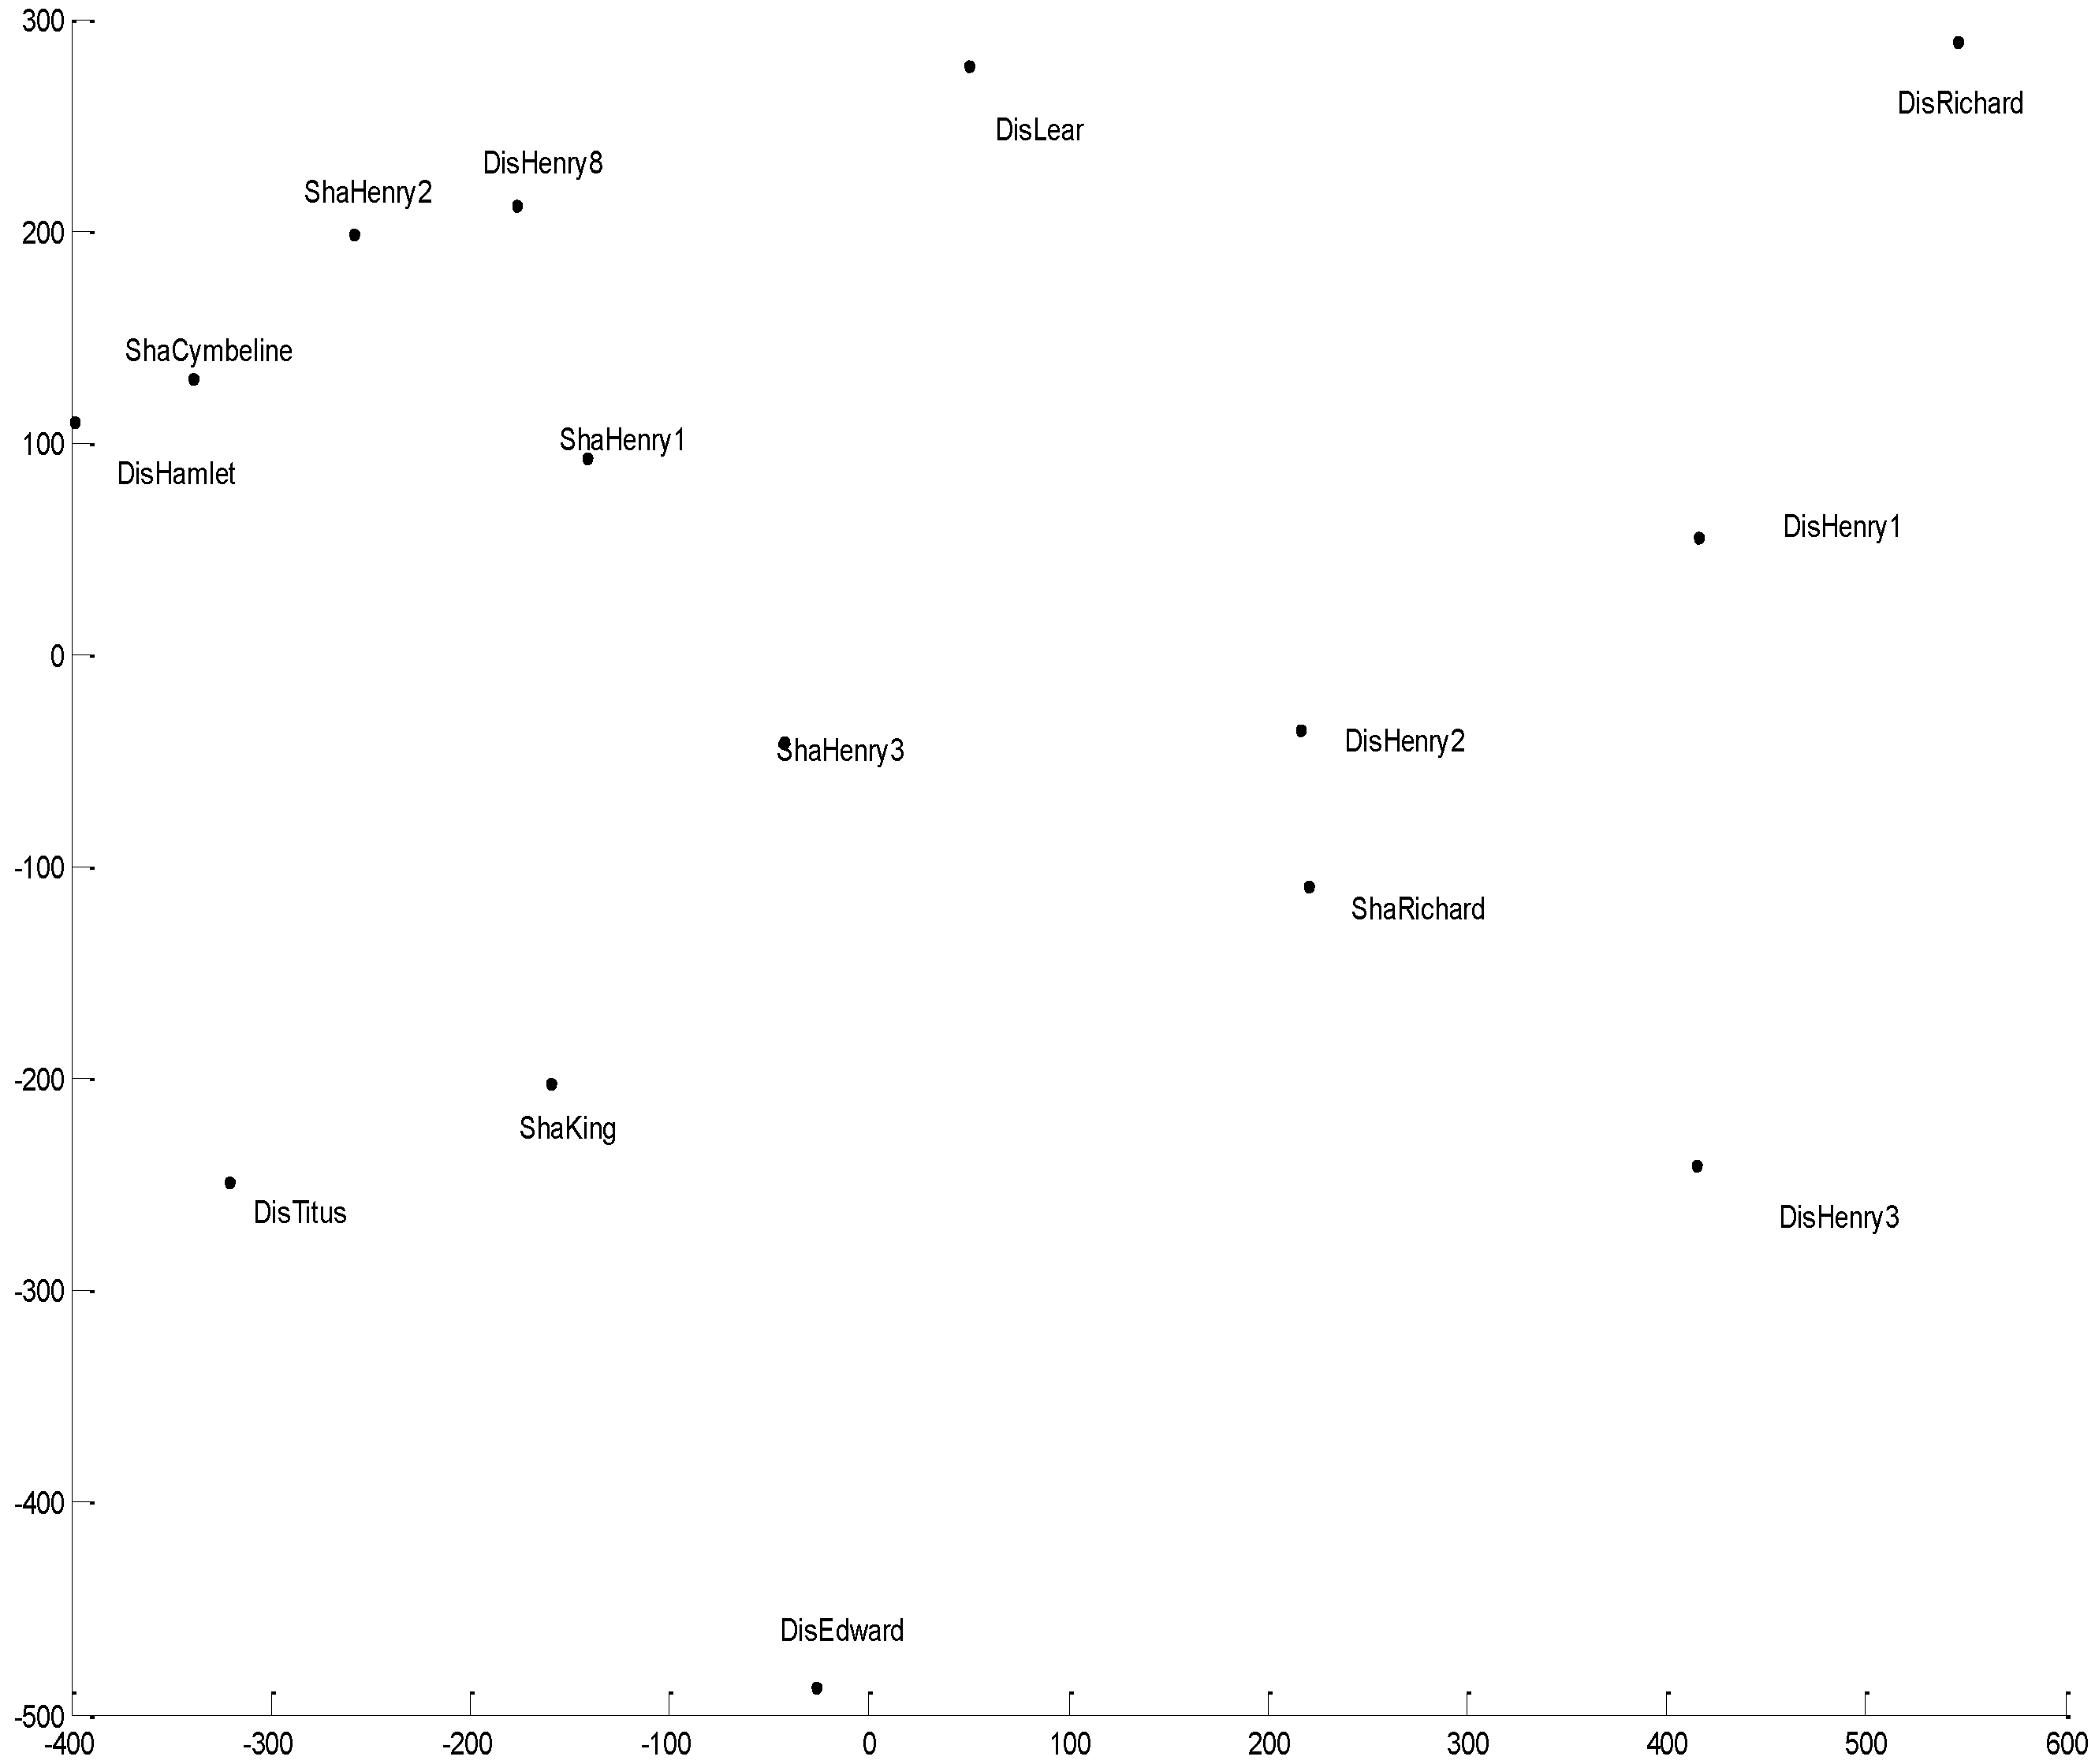
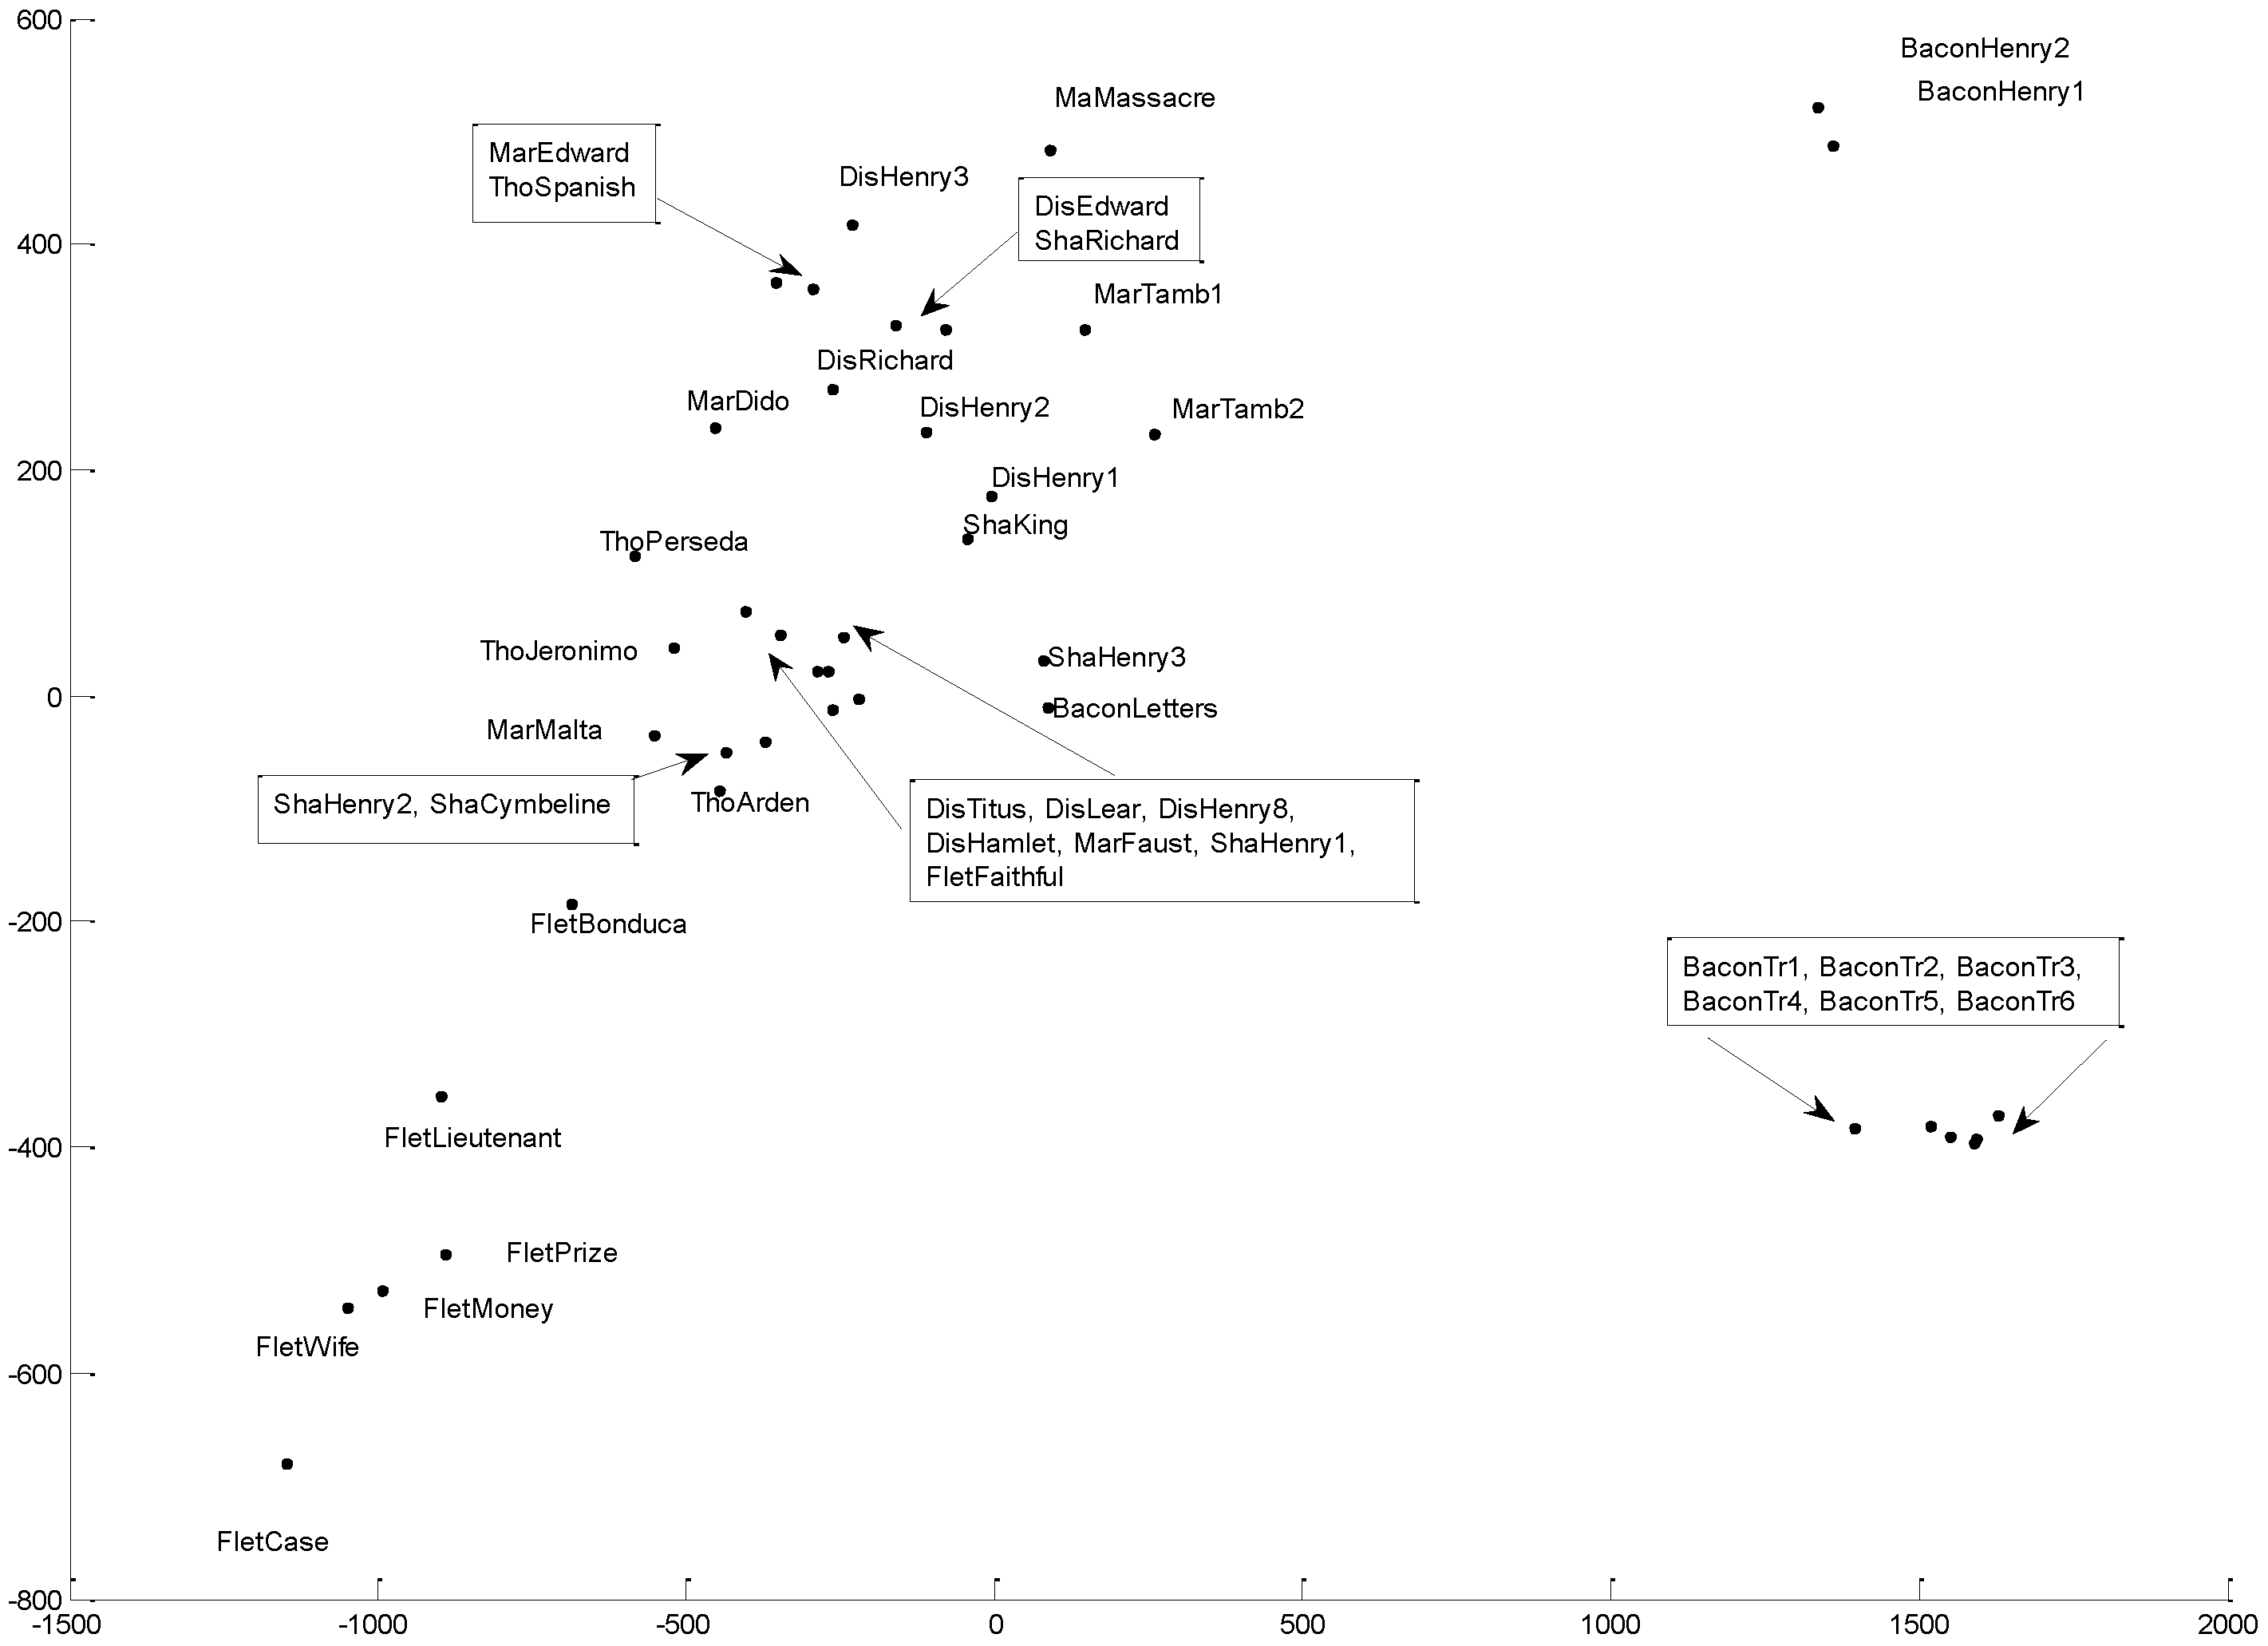
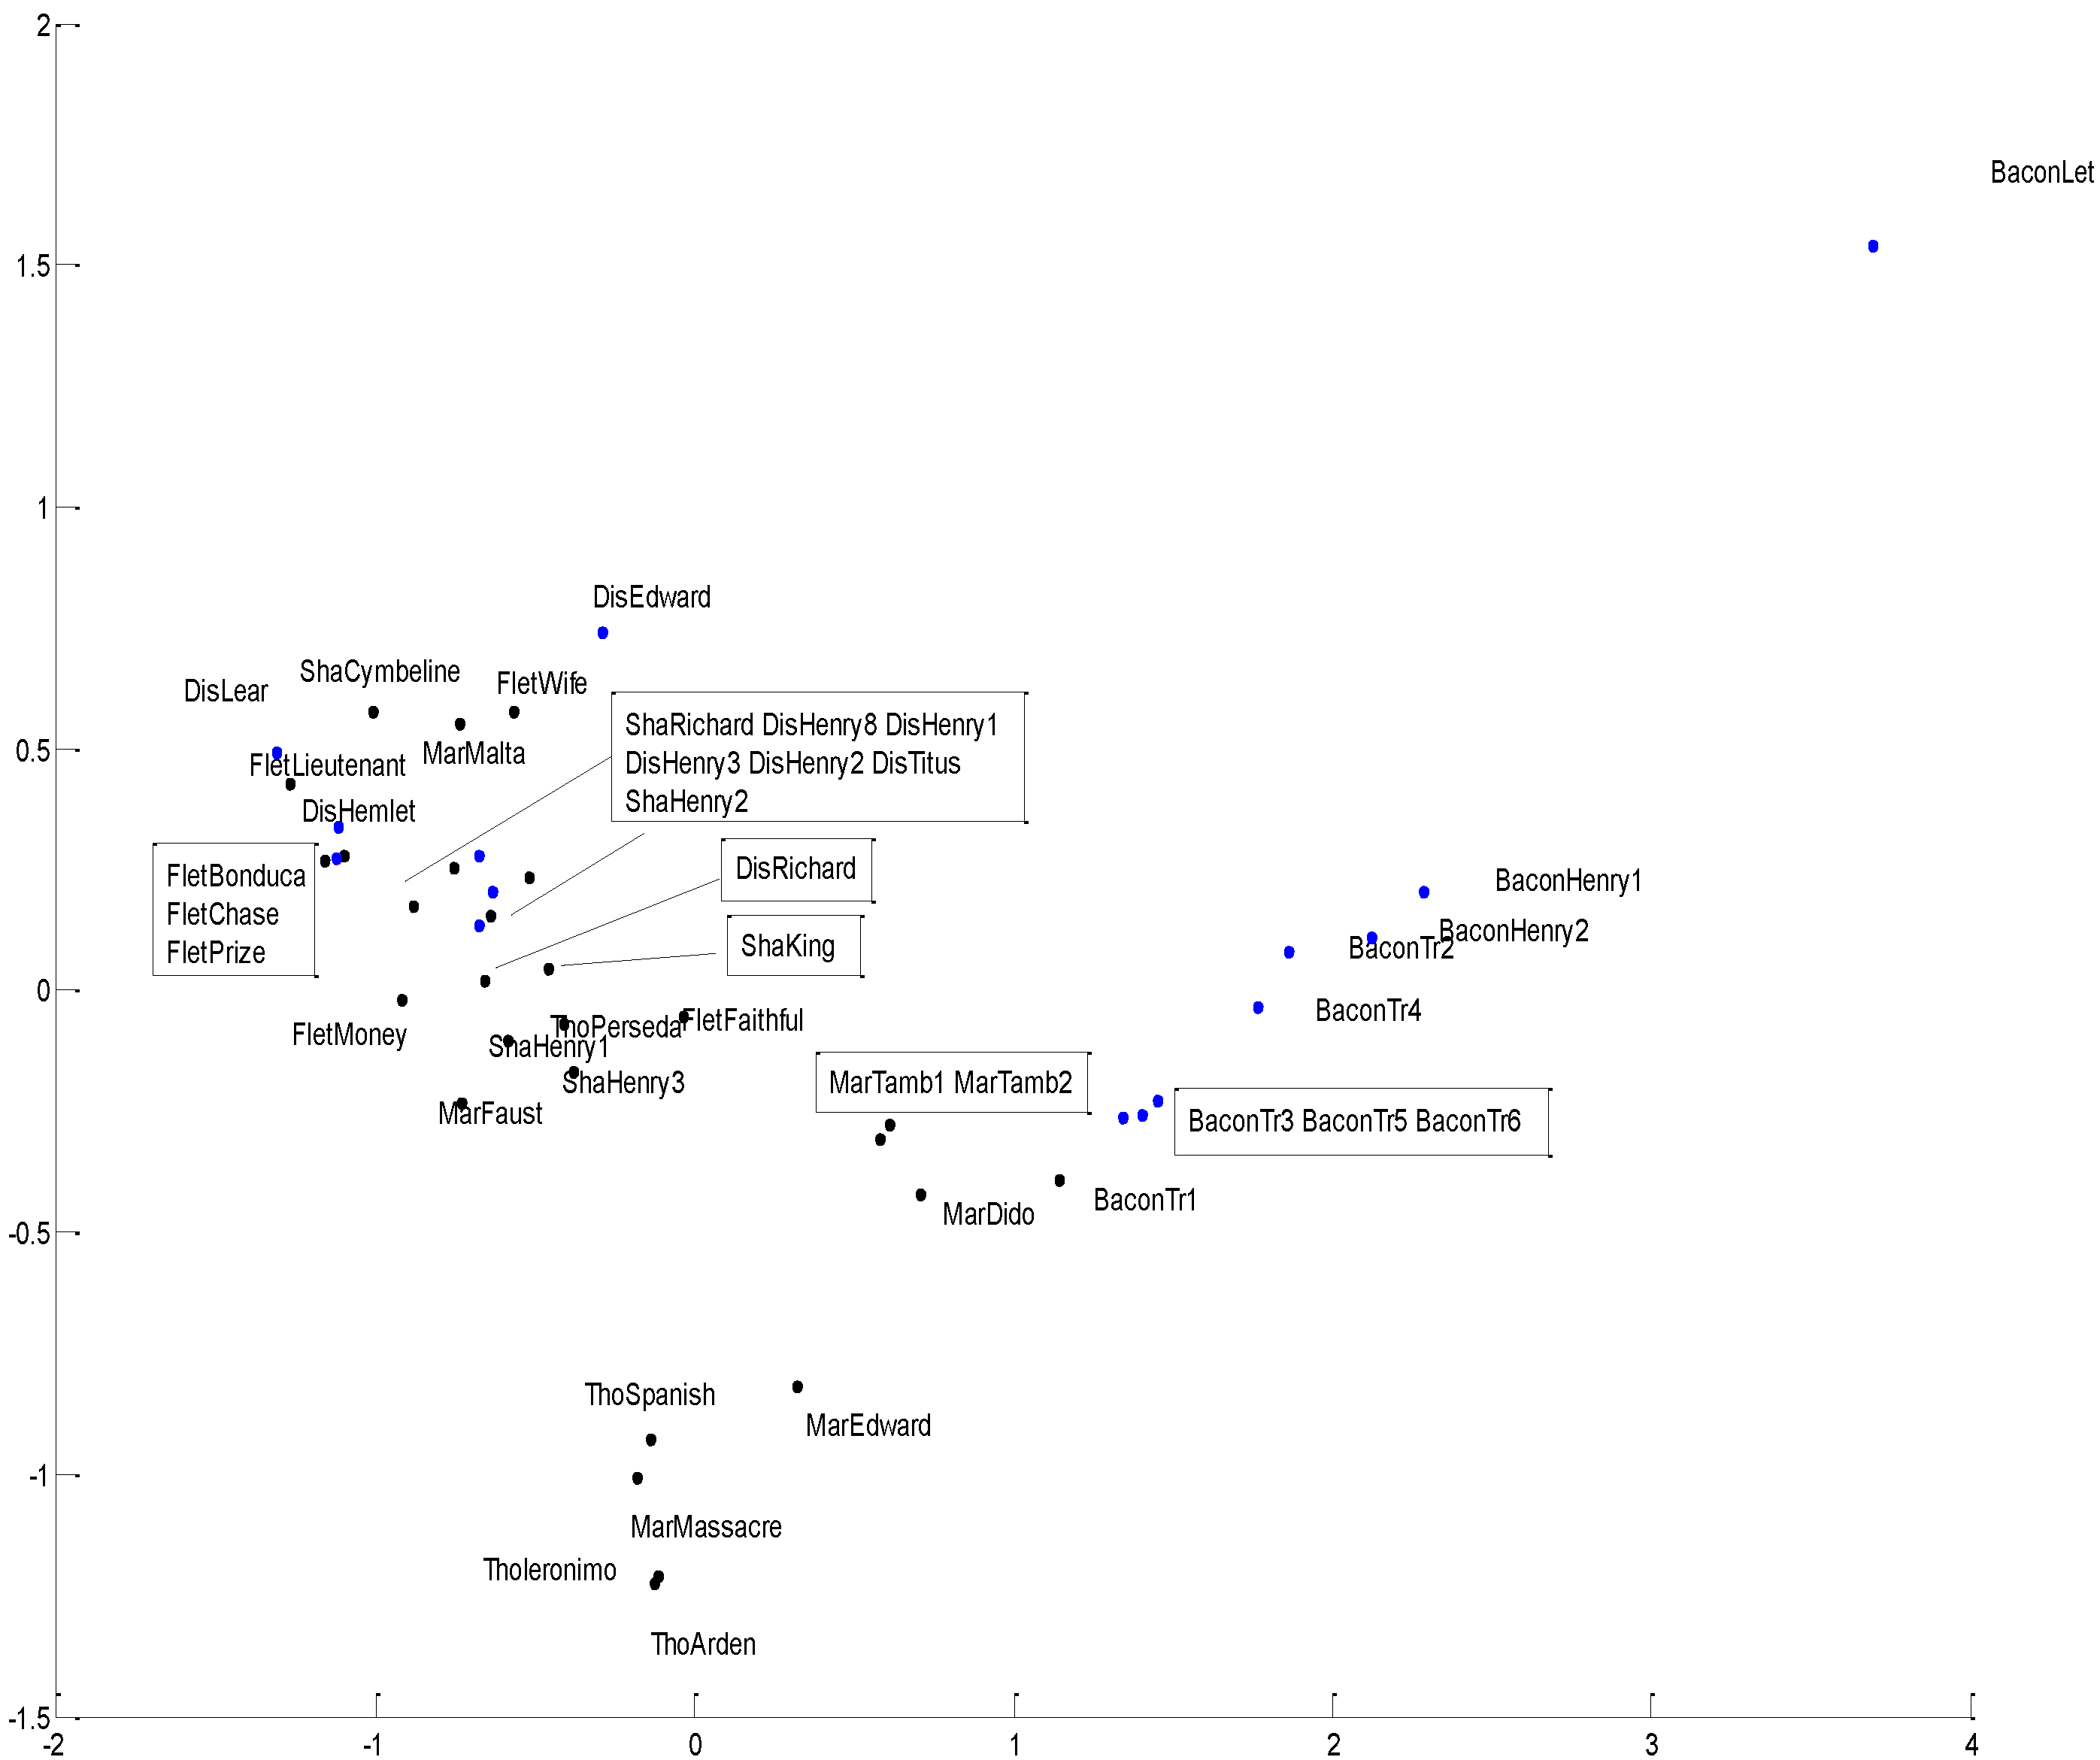
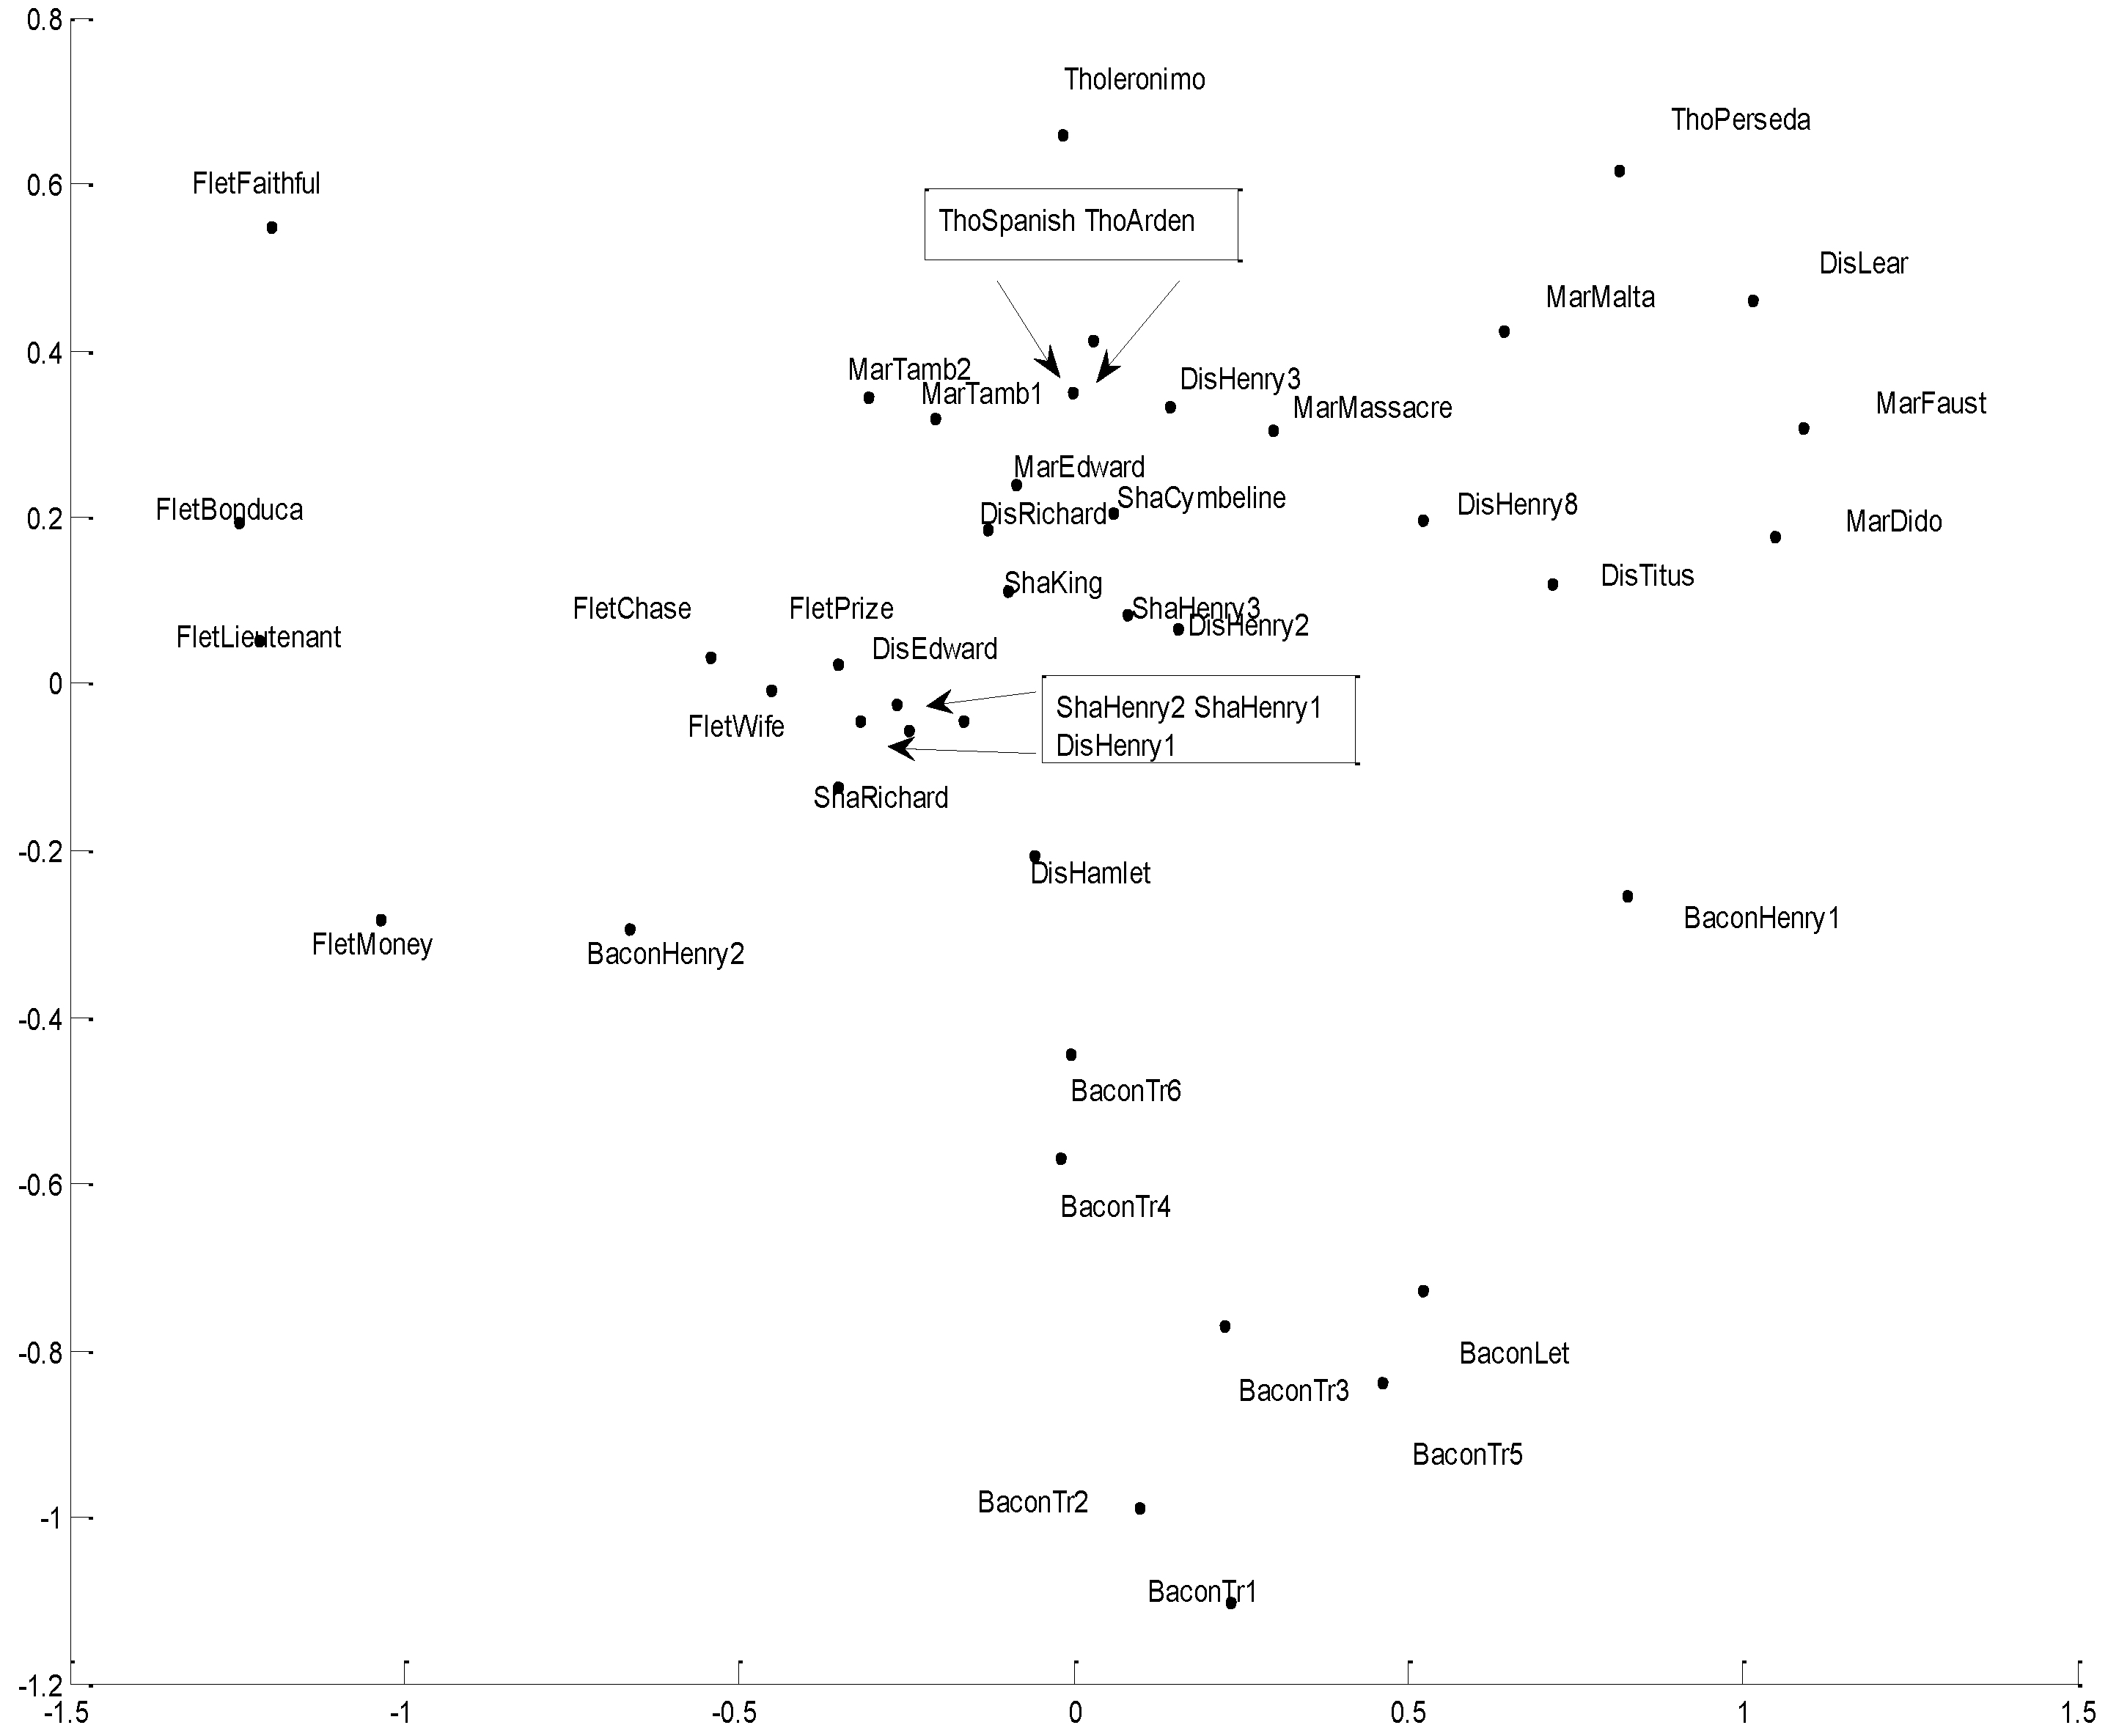
Principal Component Analysis (PCA)

PCA is a non-hierarchical linear method based on preservation of data variance. Specifically, given DFW, Dbigram, and Dtrigram of 42 texts, where DFW described by 60 variables, Dbigram by 30, and Dtrigram by 40 variables, principal component analysis re-described the 42 texts in terms of a number of variables, such that most of the variability in the original variables was retained. This allowed us to plot the 42 texts in two-dimensional space and to directly perceive the resulting clusters. The principal components analysis was in a four-stage procedure. The first step was the construction of a symmetric proximity matrix for distances among vectors. The second was the construction of an orthogonal basis for the covariance matrix in such a way that each axis was the least-squares best fit to one of the n directions of maximum of variation in DFW, Dbigram, and Dtrigram. The third was the selection of dimensions in which we removed the axes that had relatively little variation and kept an m-dimensional basis for DFW, Dbigram, and Dtrigram where m < n. The fourth step was the projection into m-dimensional space, which yielded data set DFW’, Dbigram’, and Dtrigram’ that is dimensionality-reduced but still had the property of maximum variation in D, that is the total combined variance of all vectors.

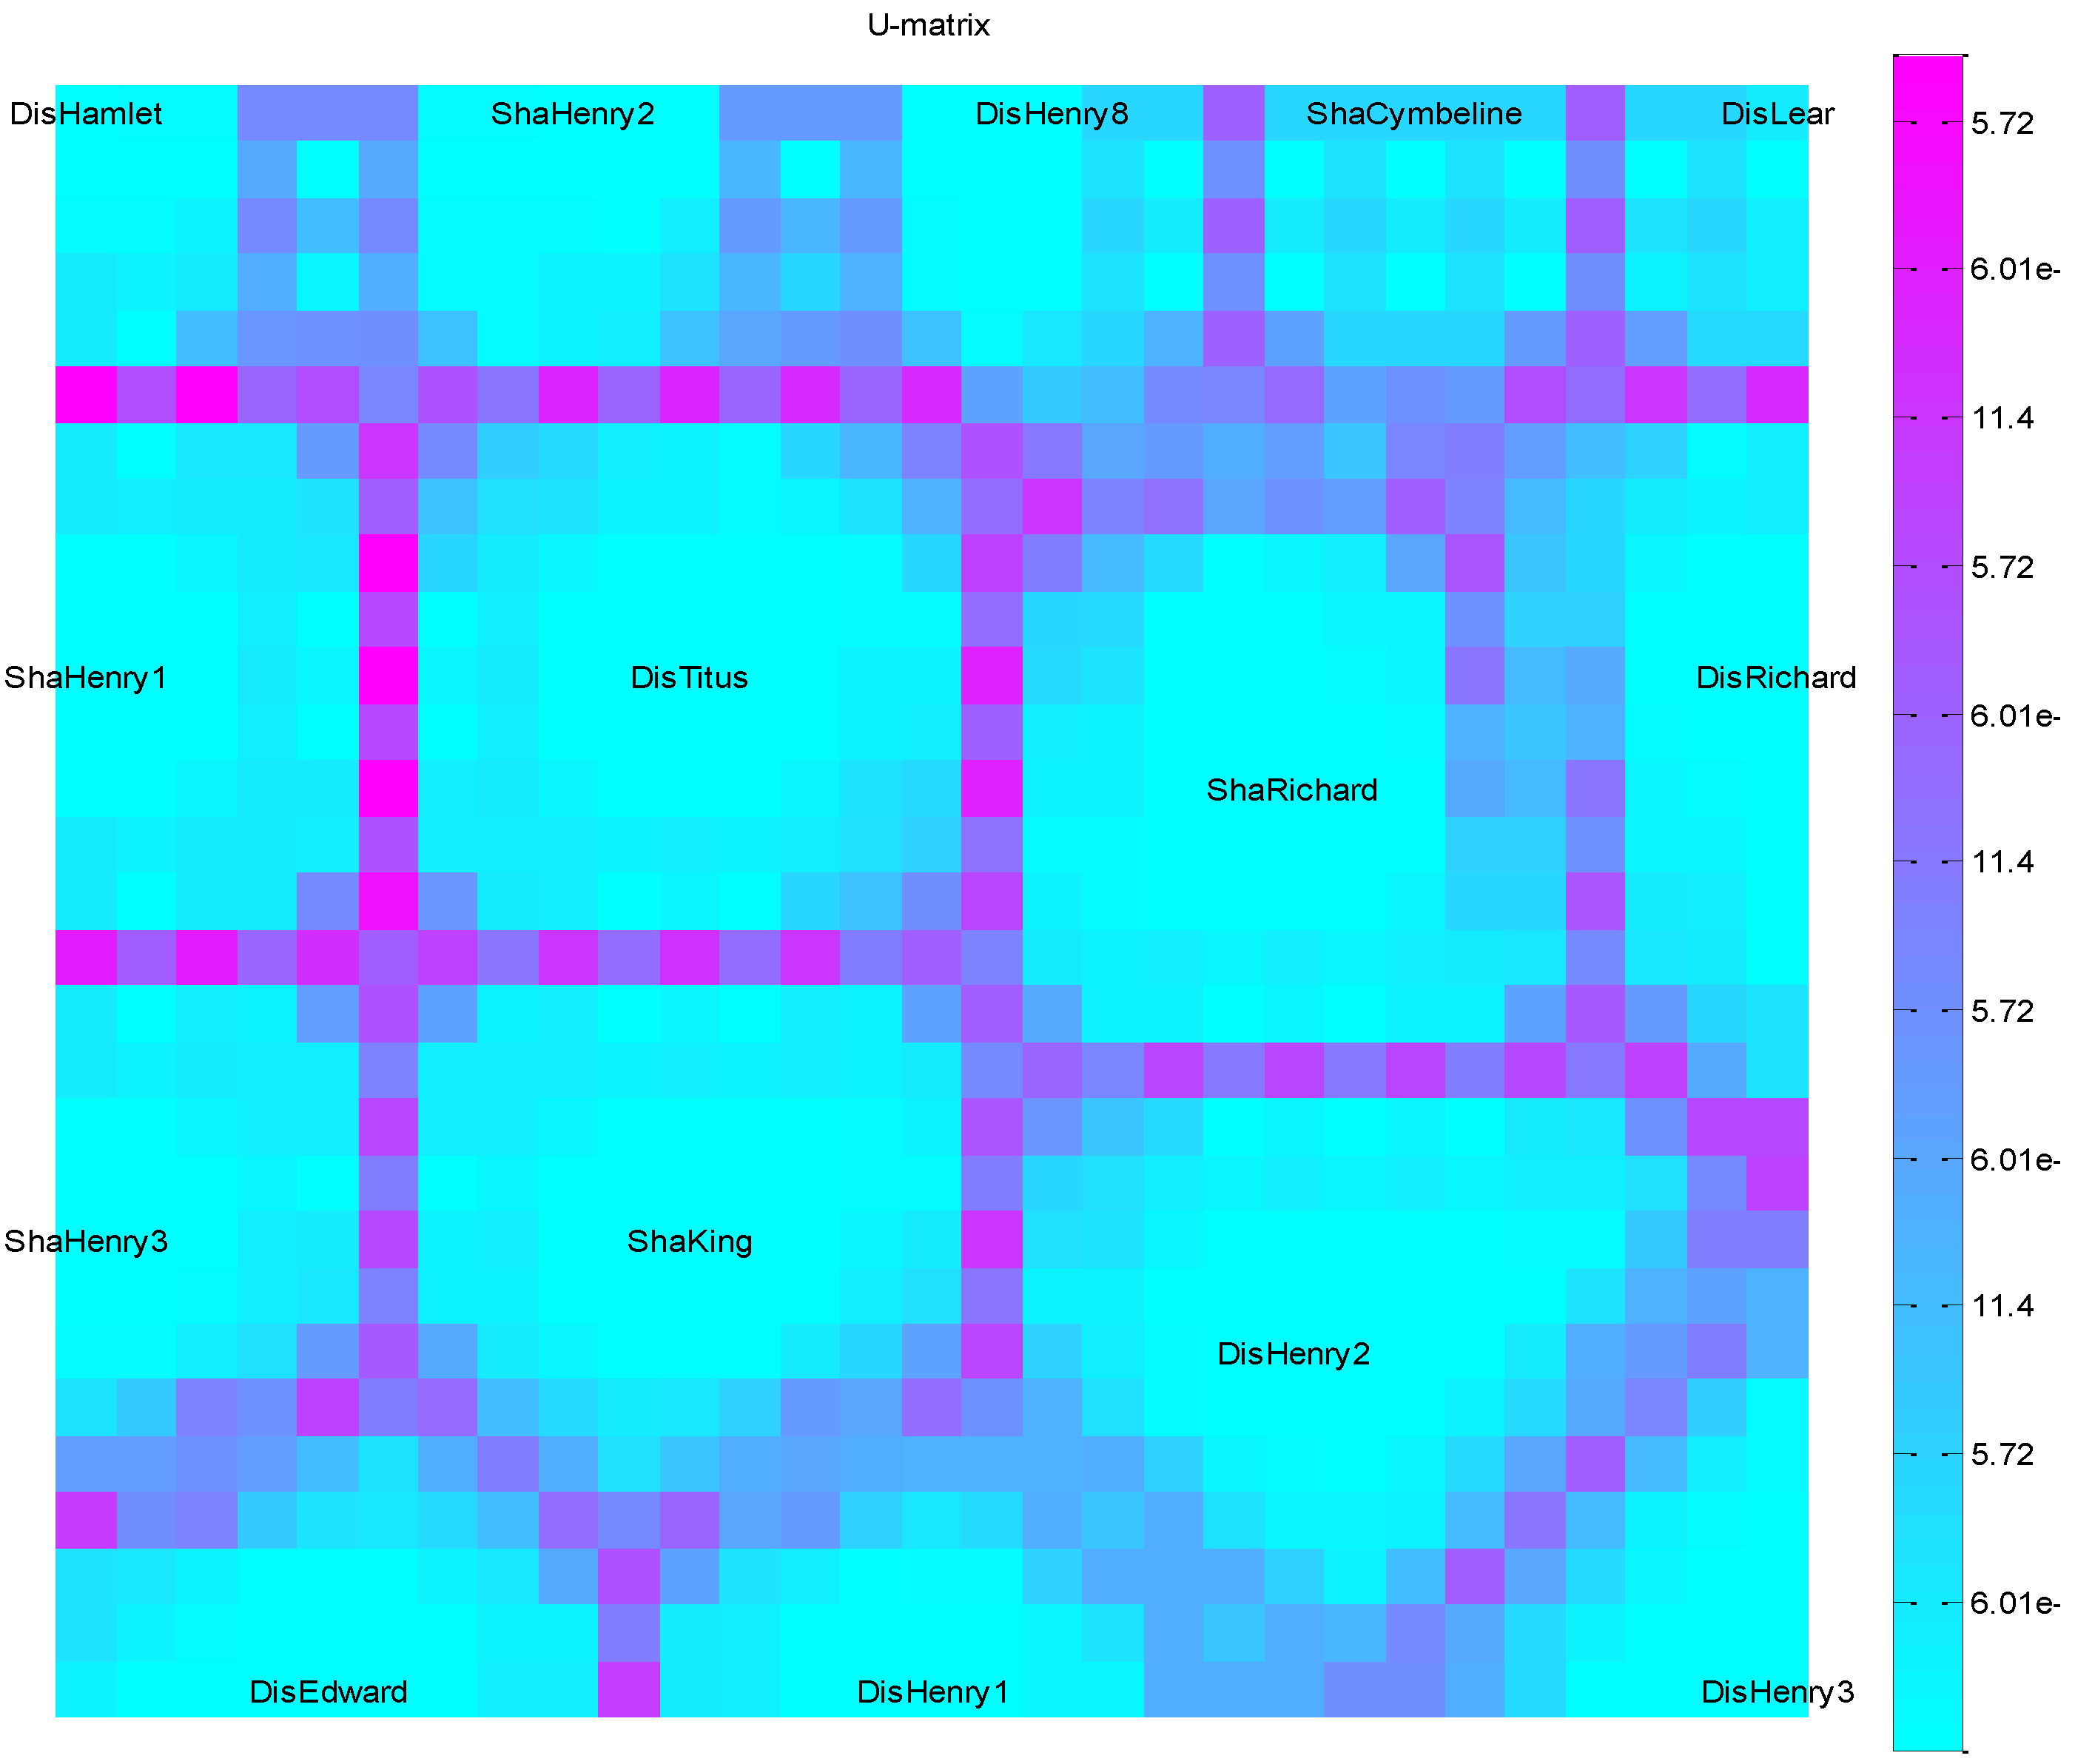
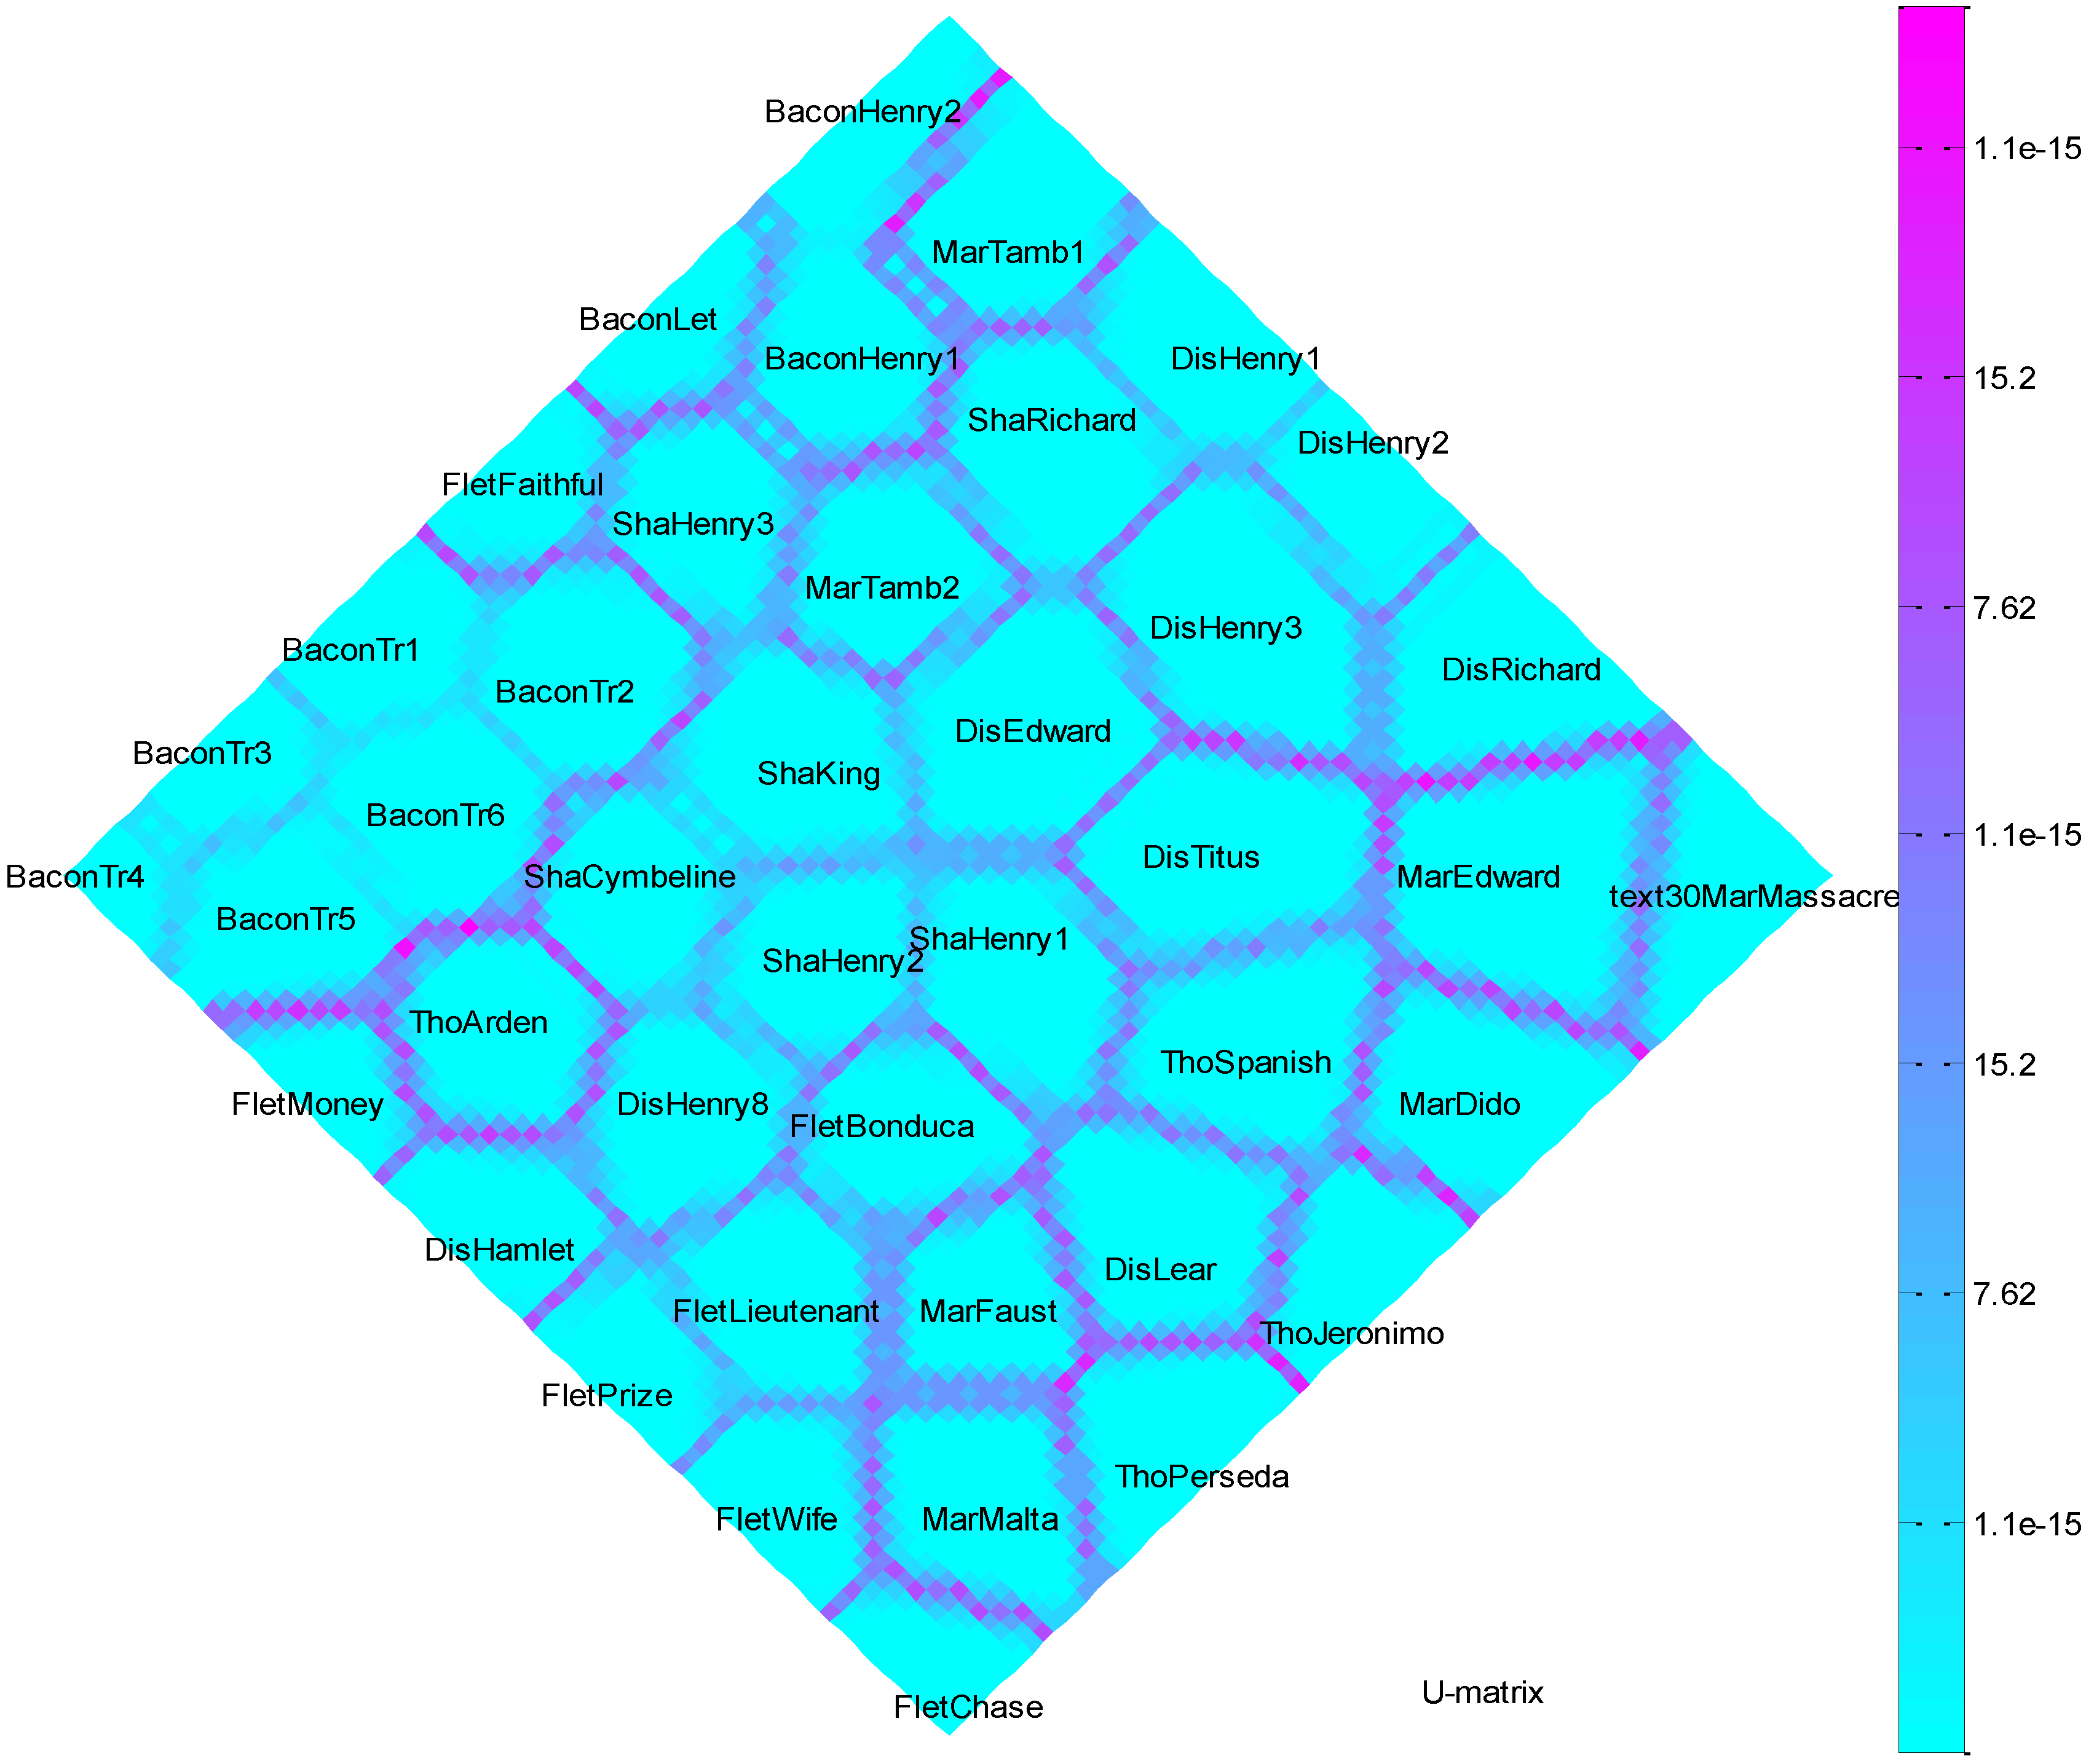
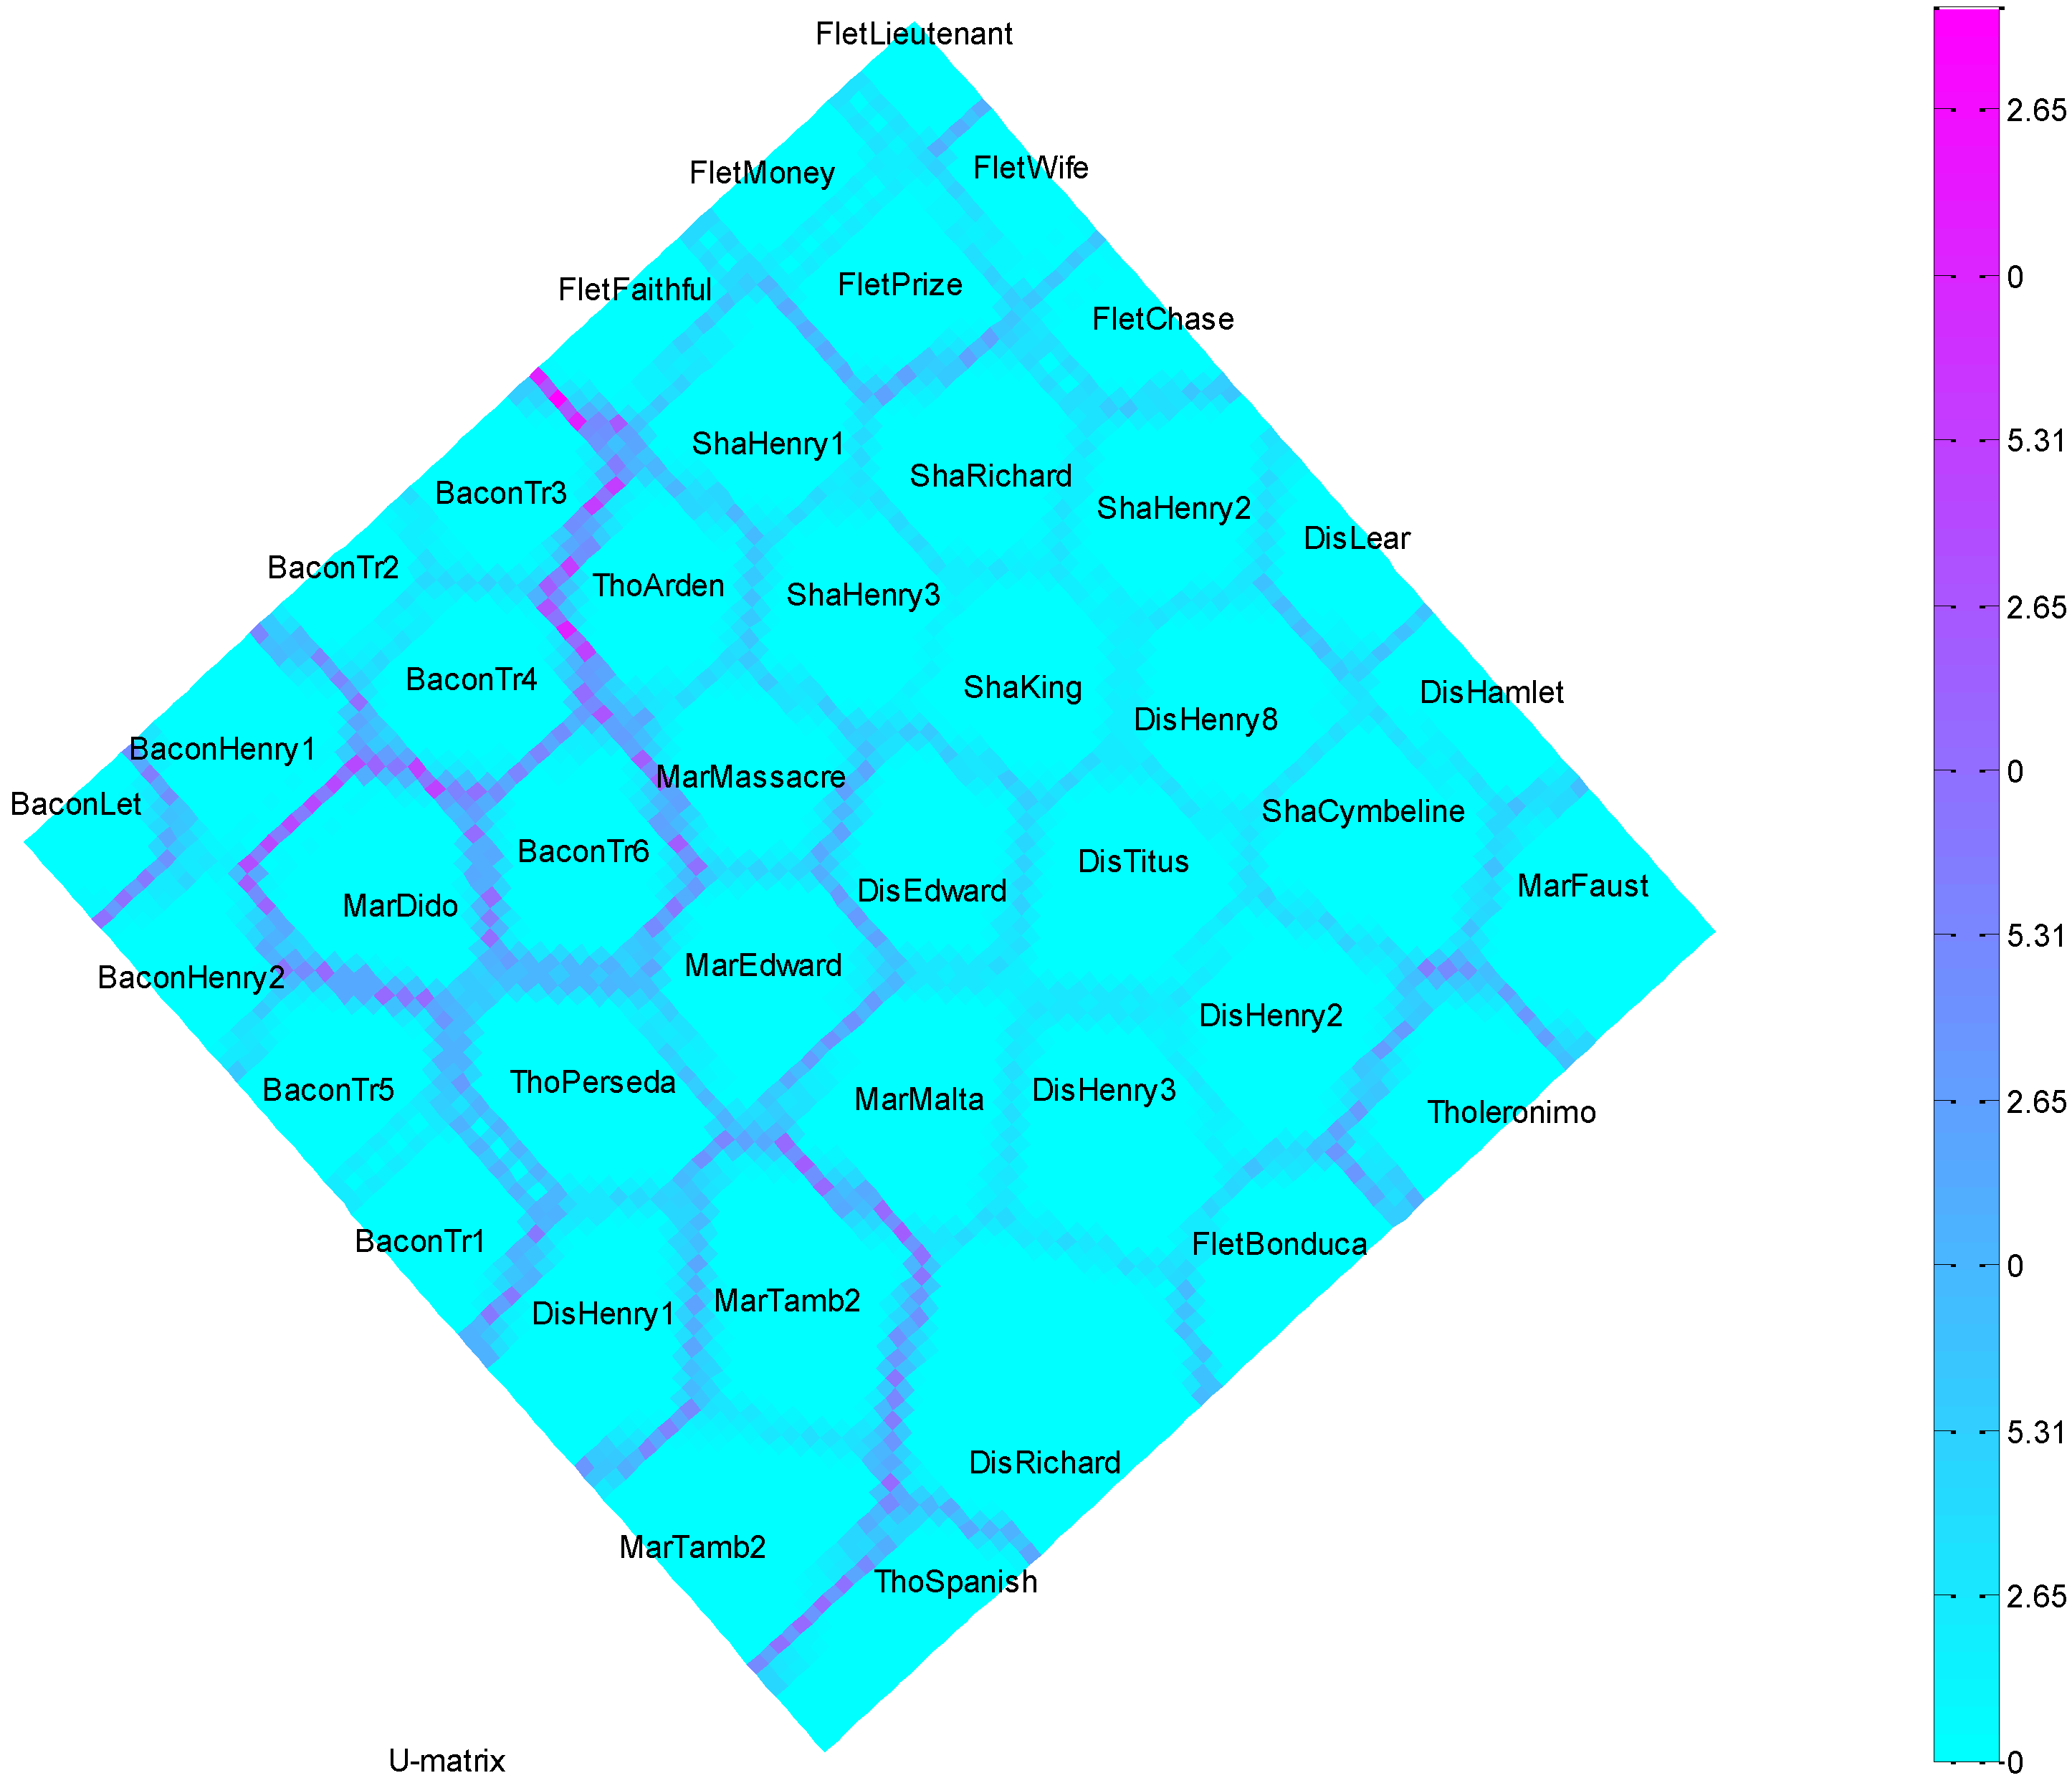
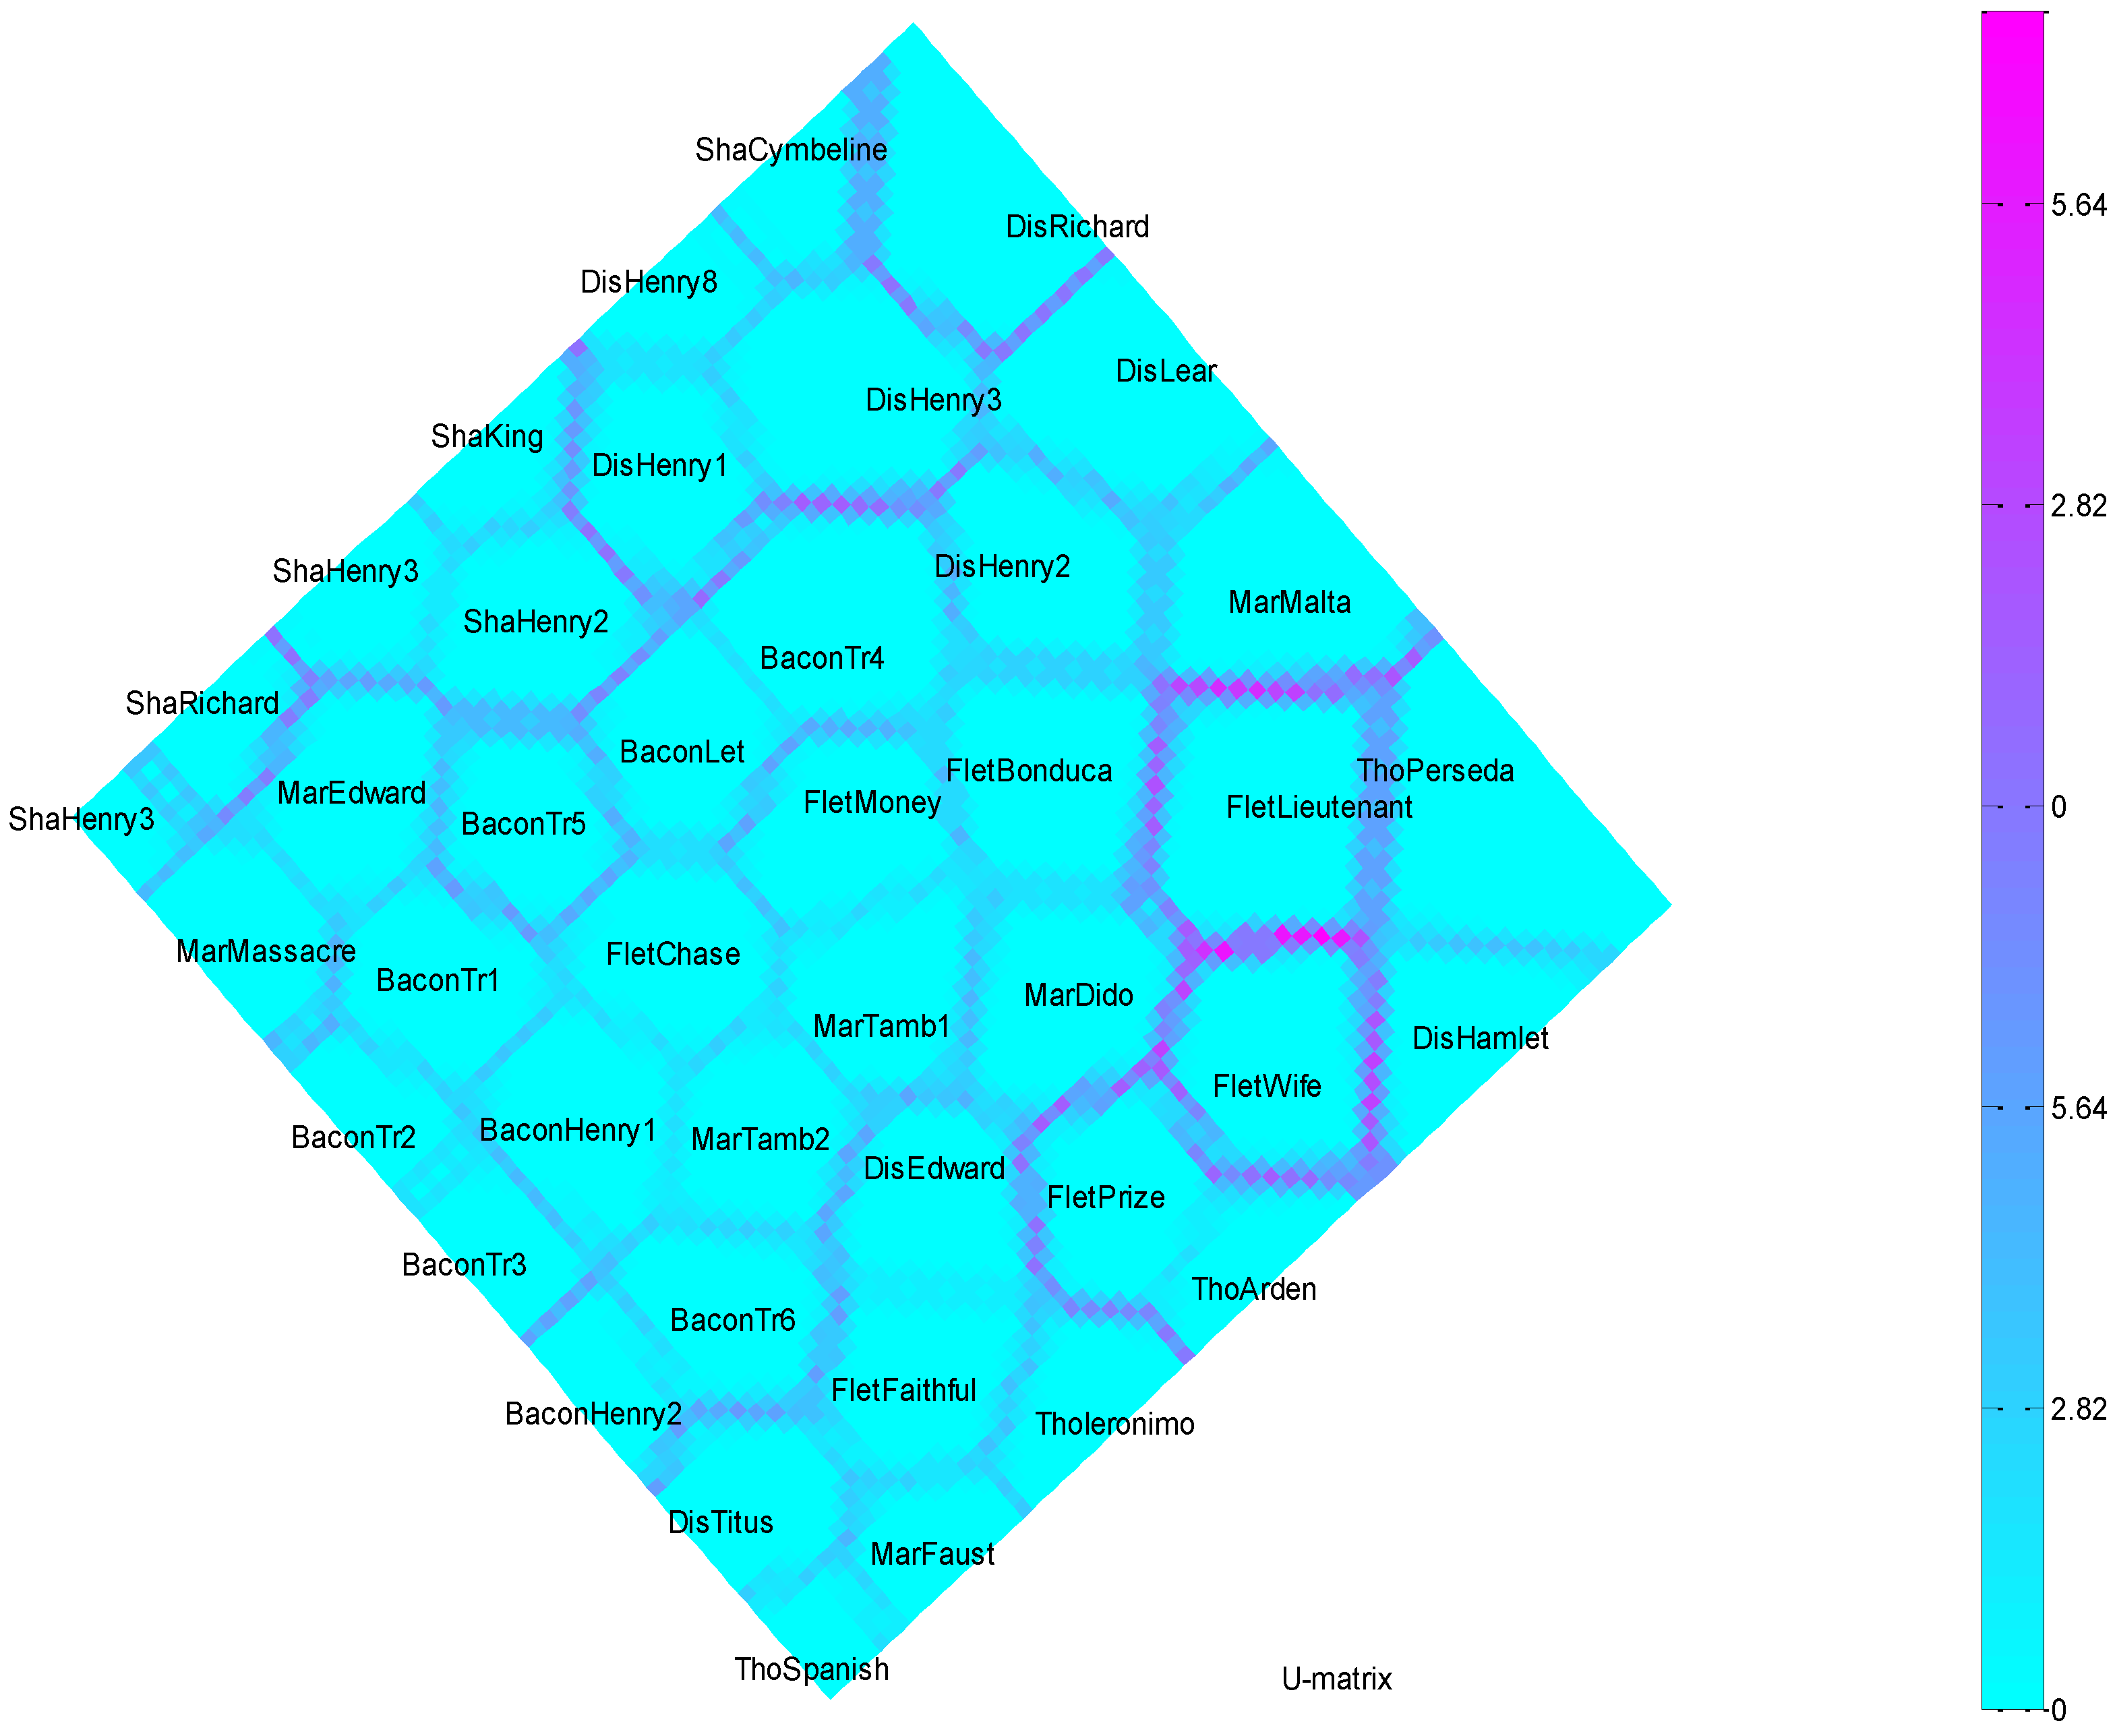
Self-Organizing Map (SOM) U-Matrix
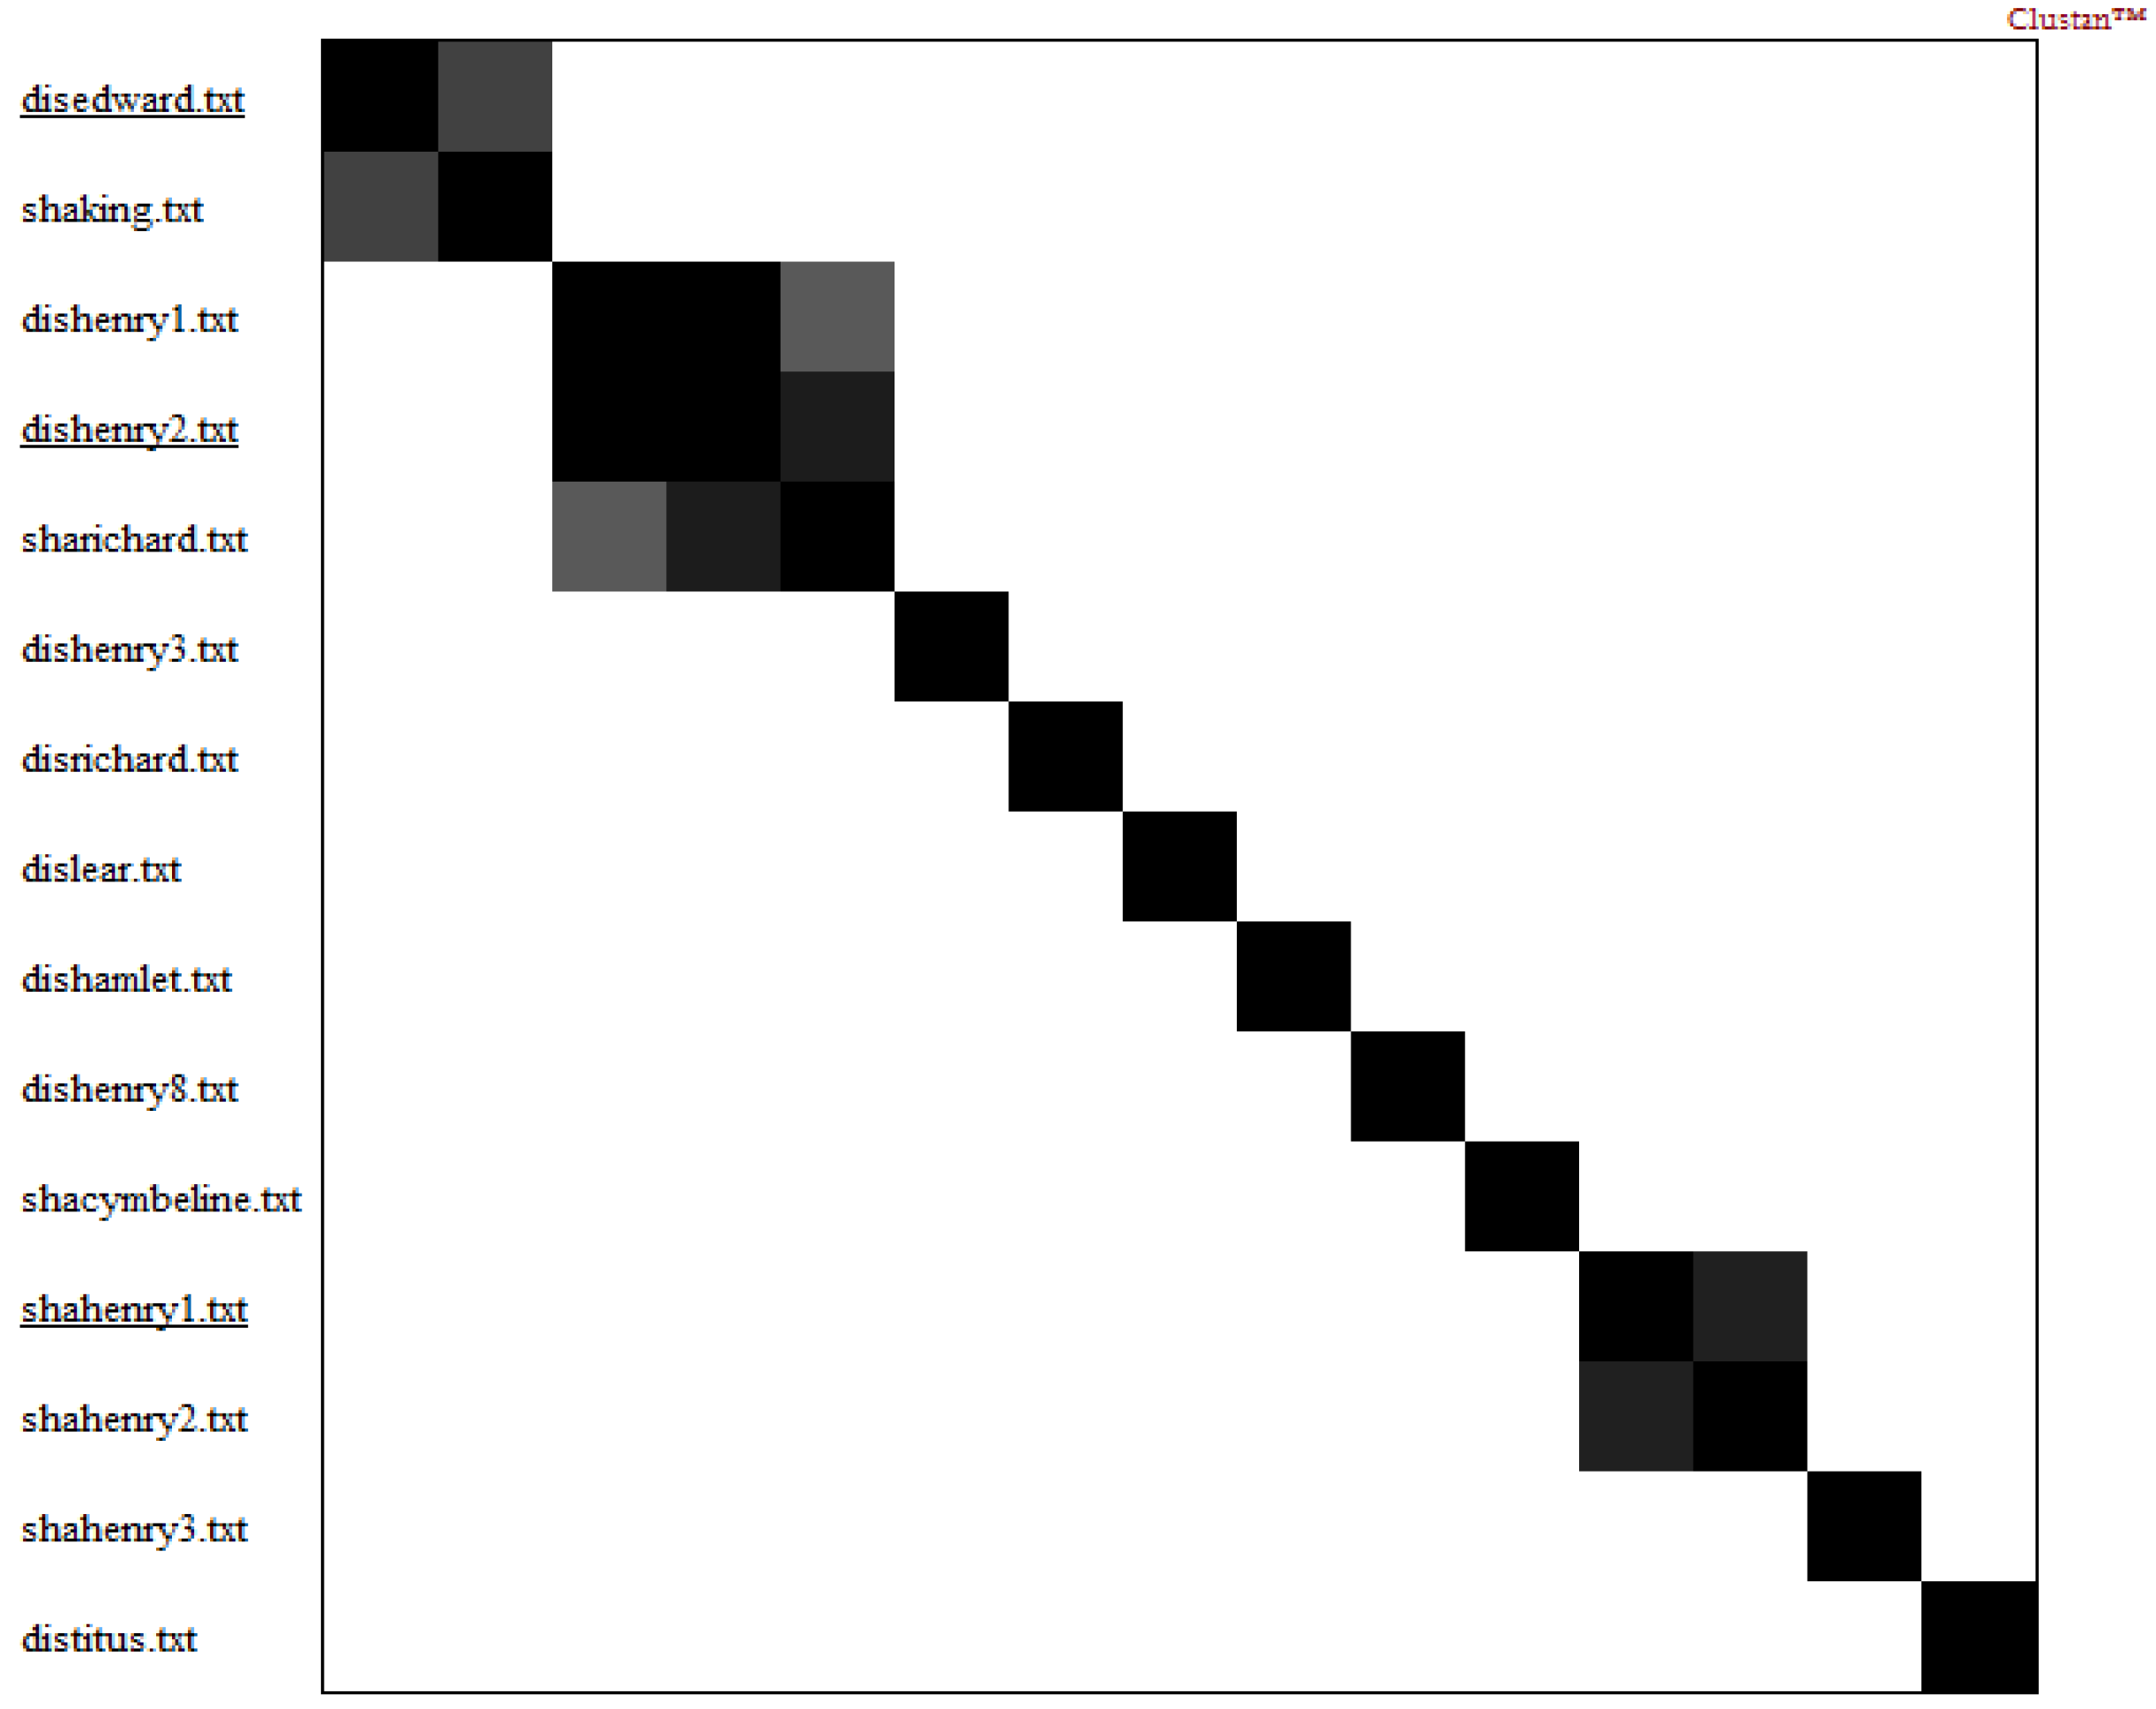
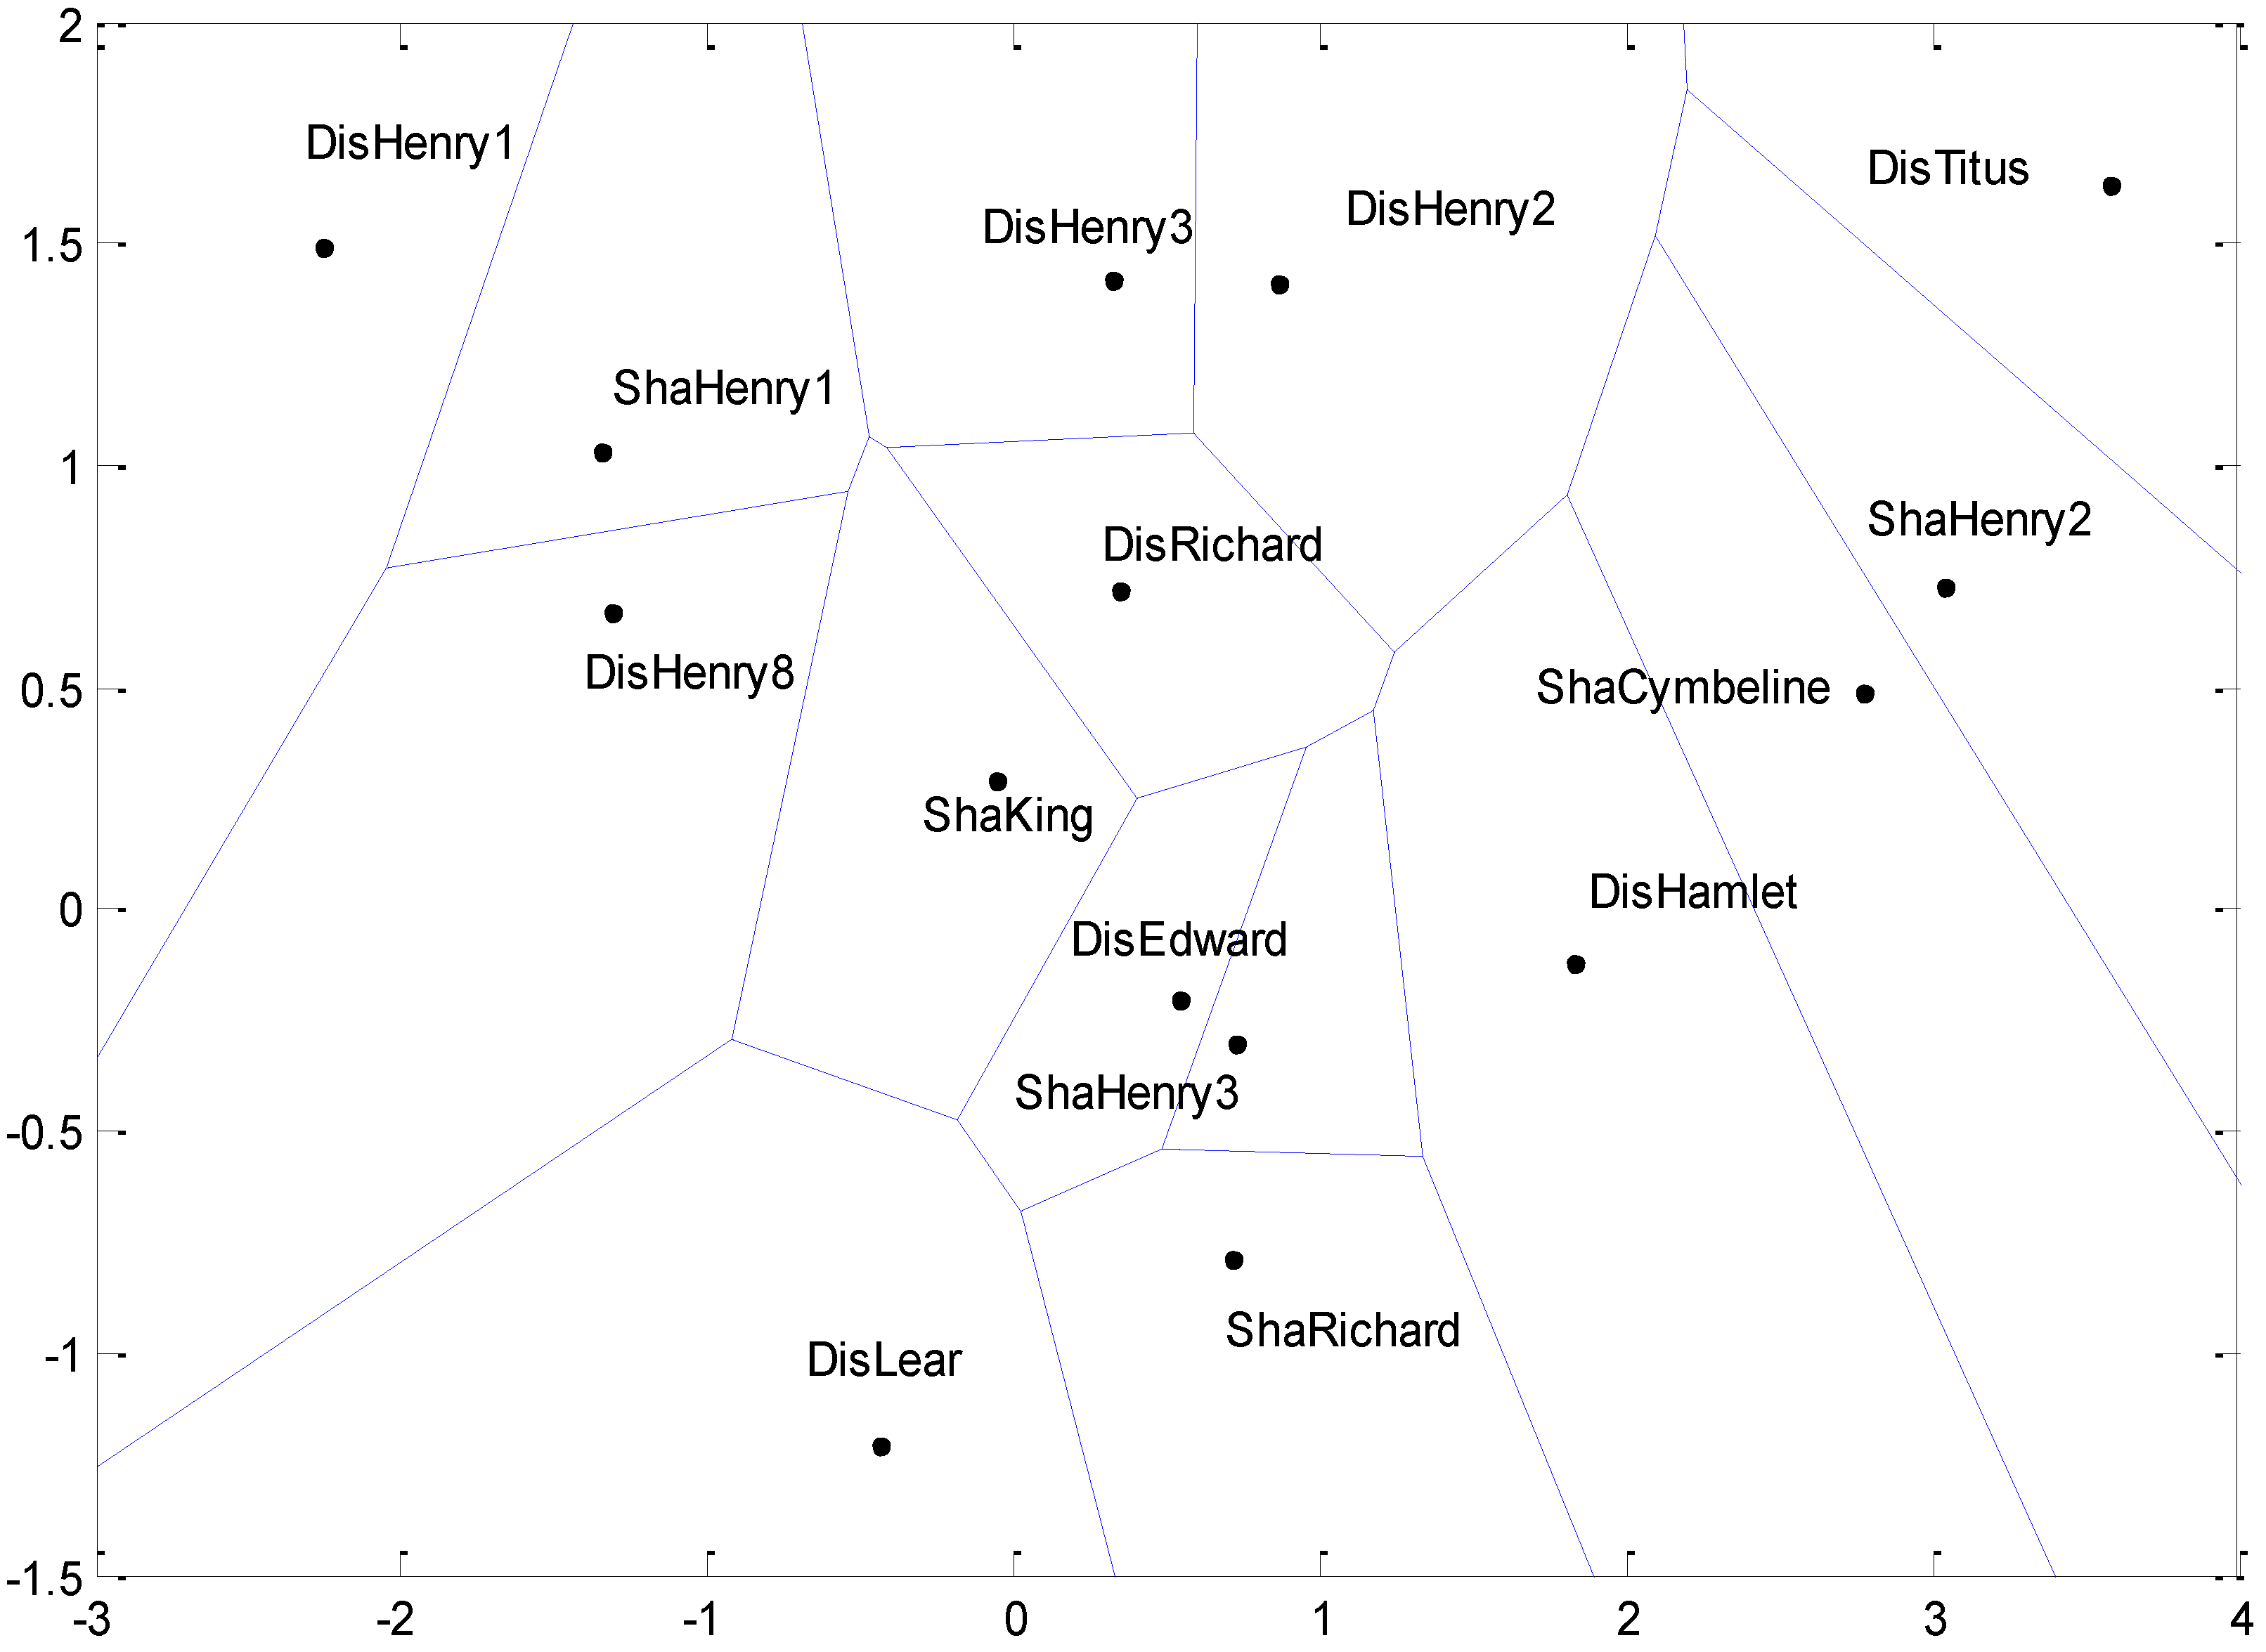
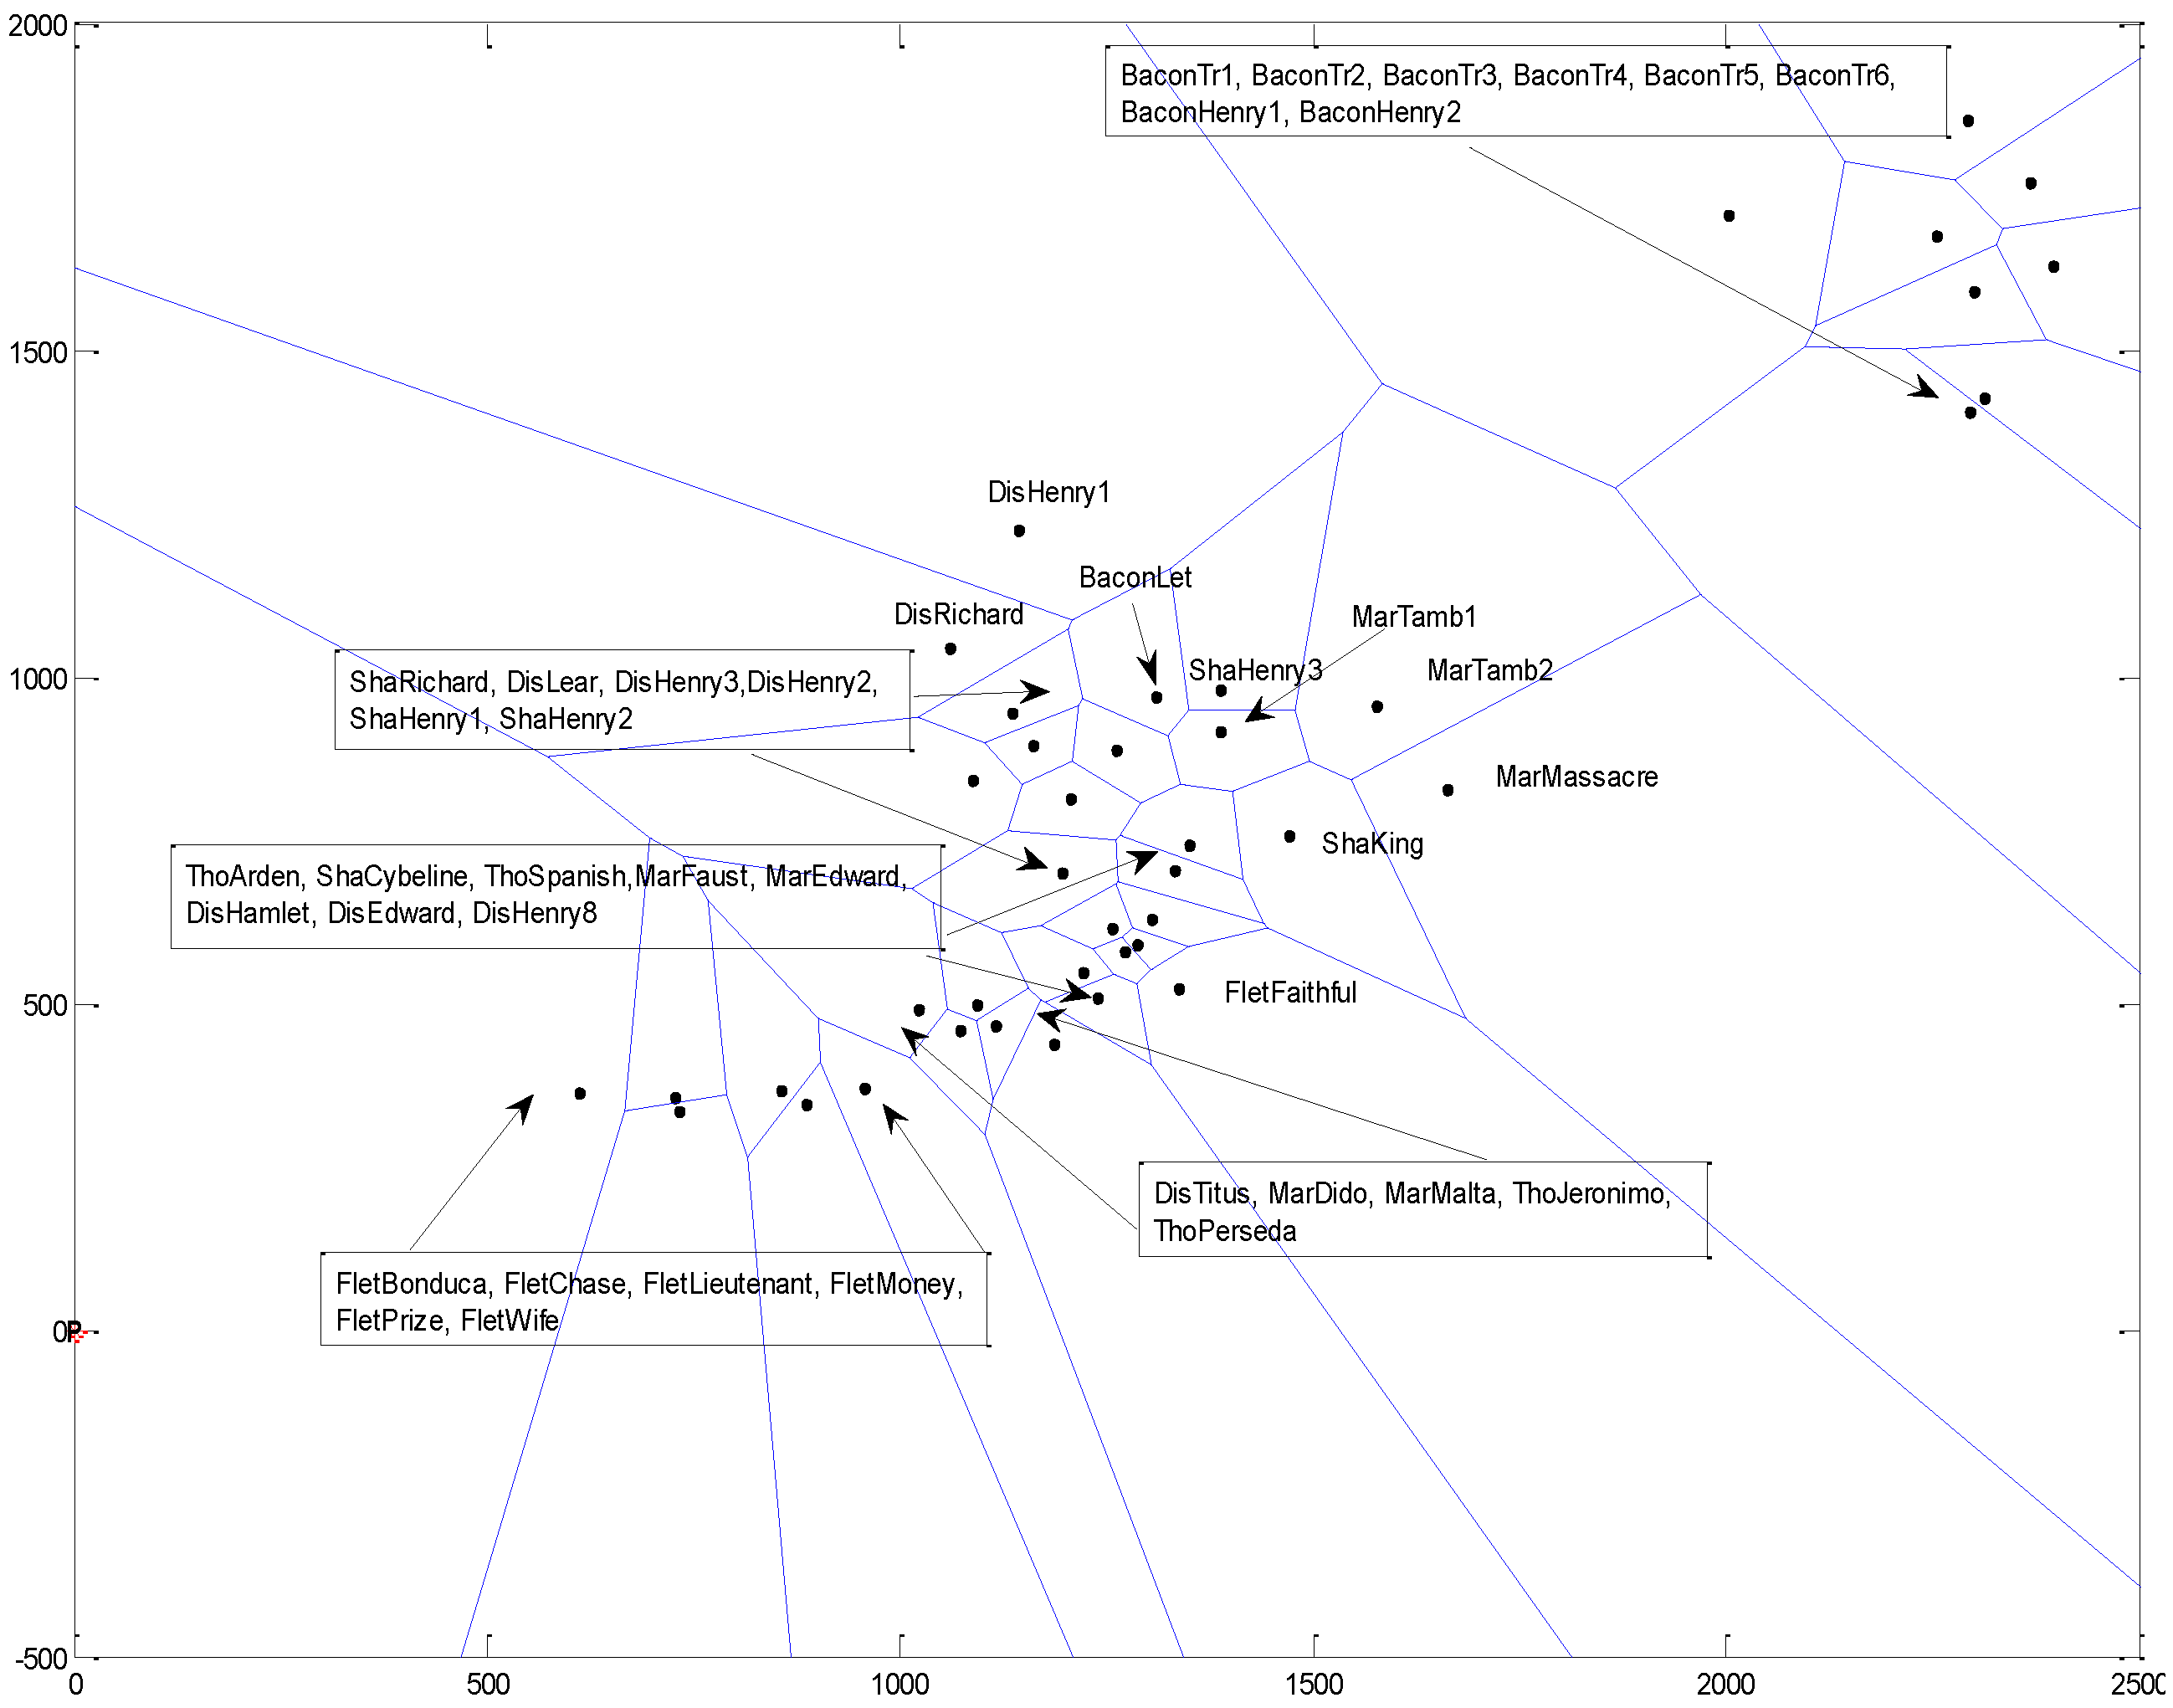
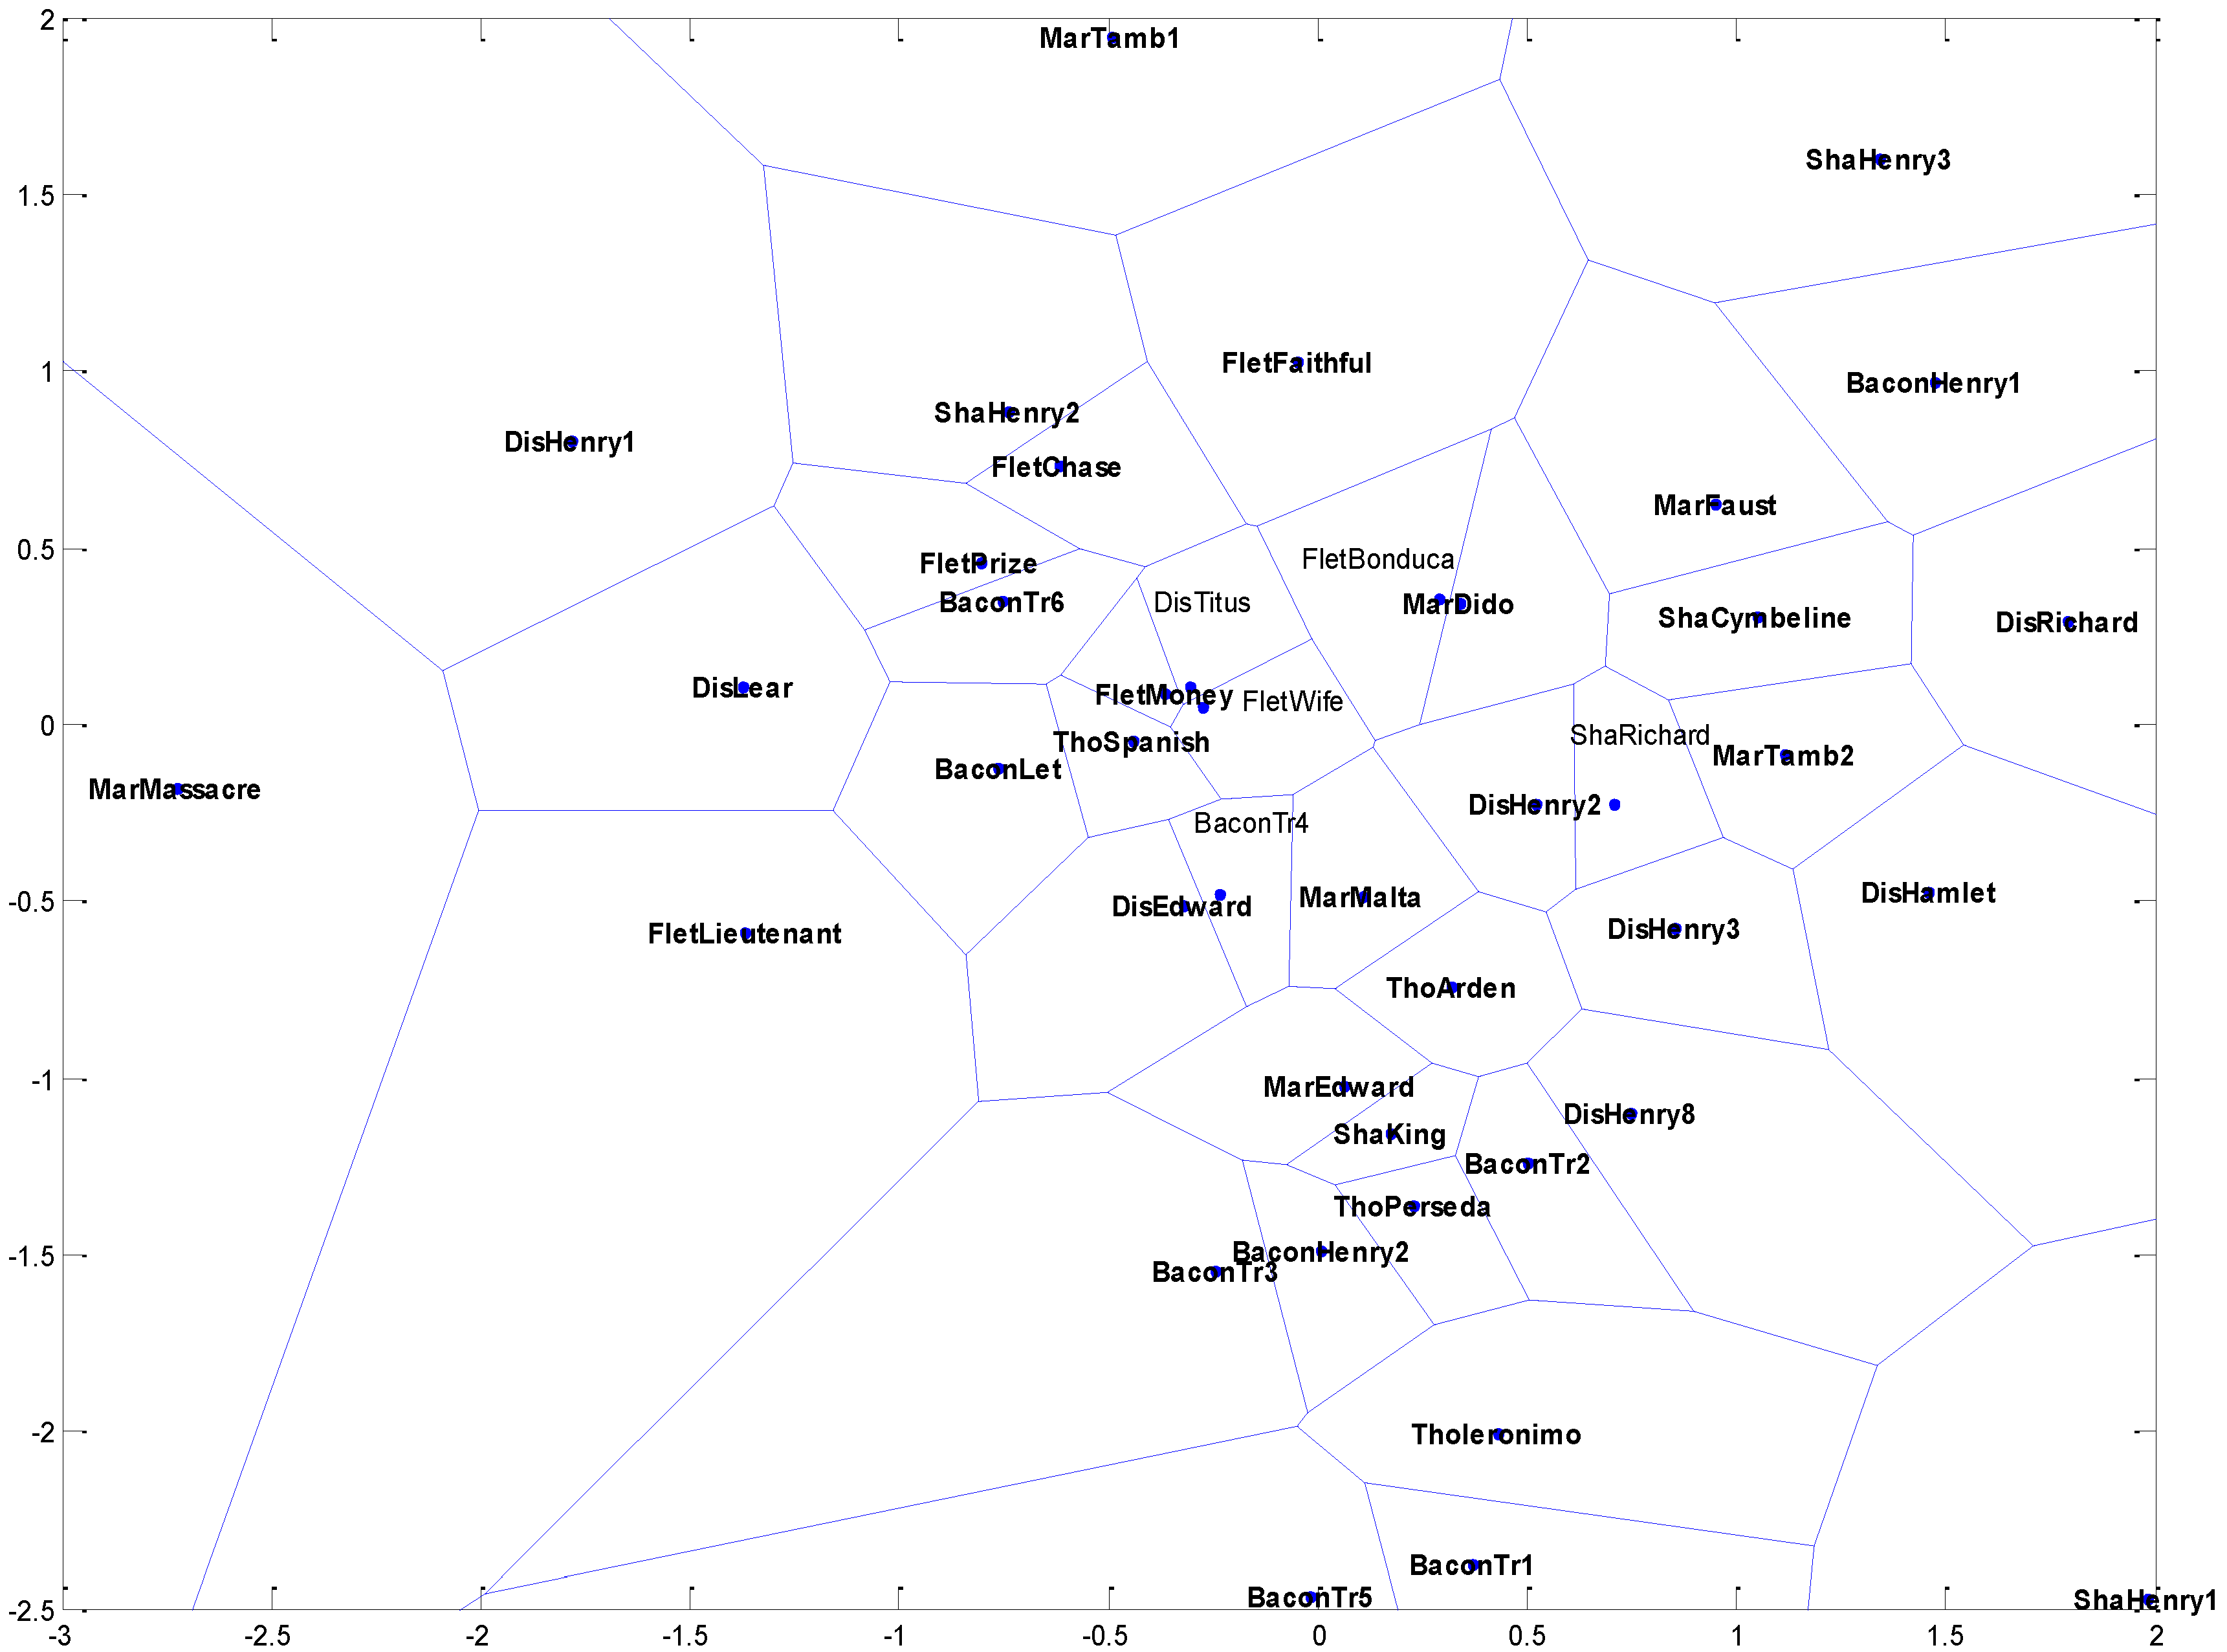
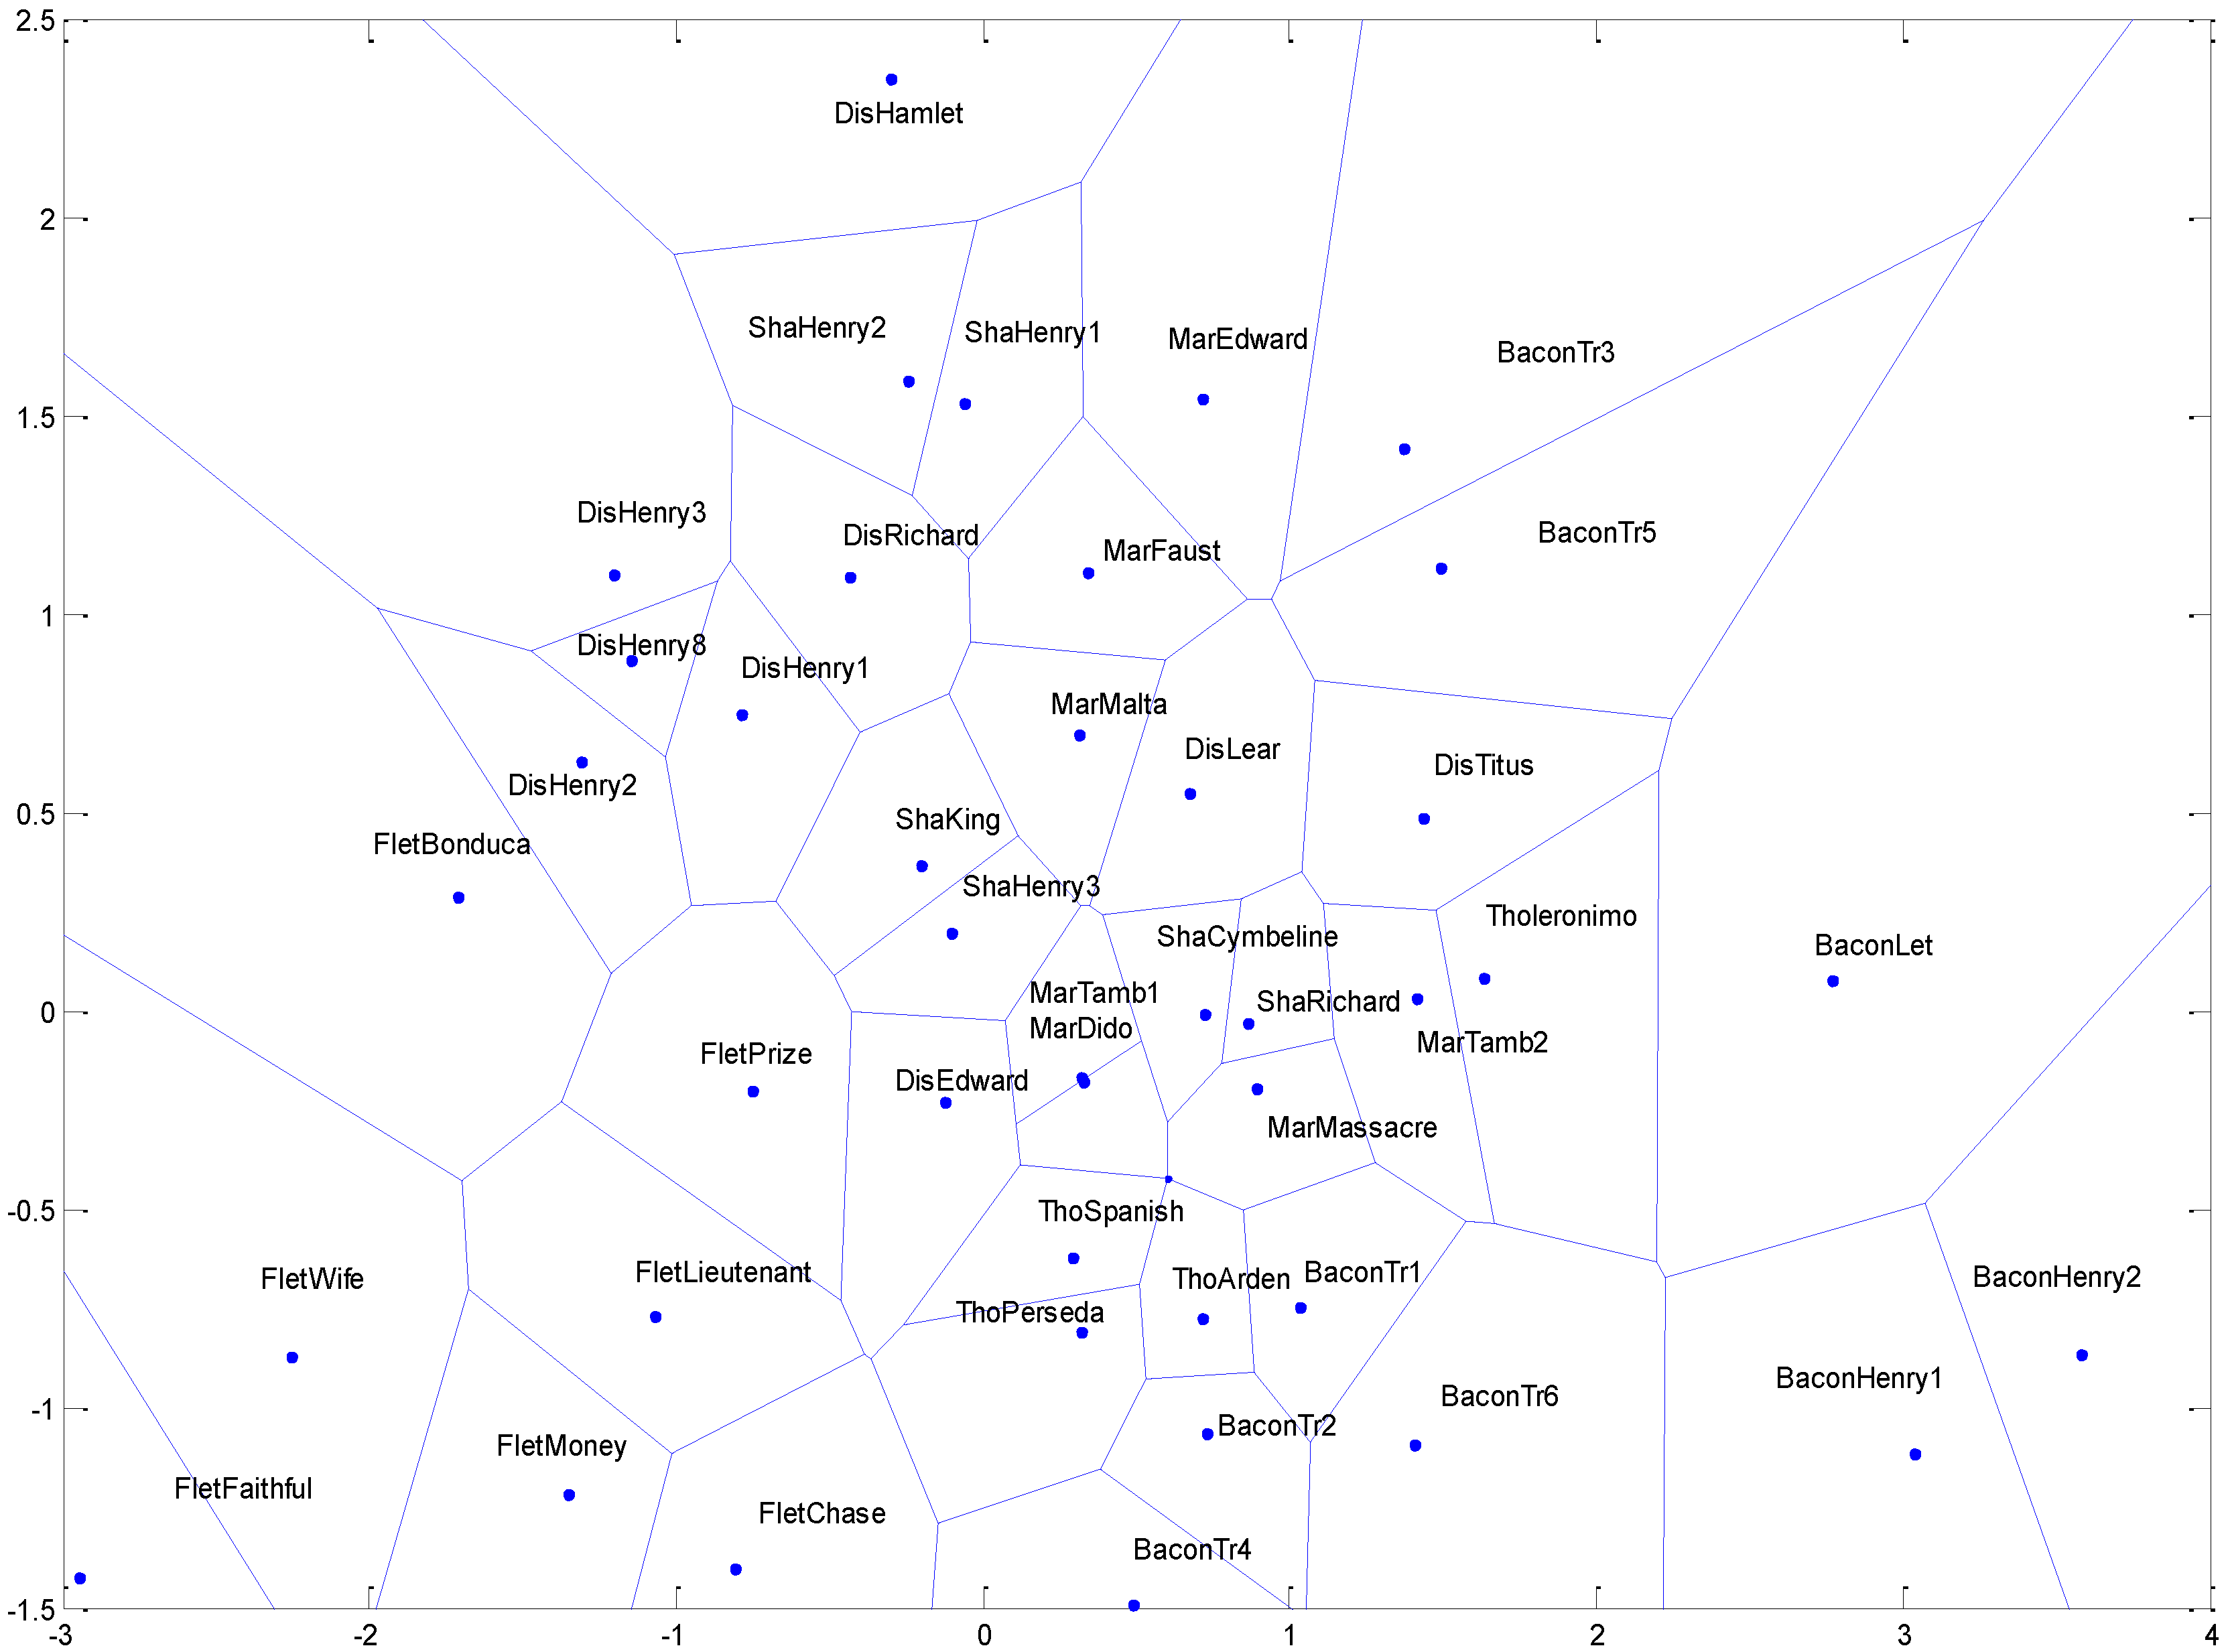
The unified distance matrix or U-matrix is a representation of SOM that calculates the nonlinear distances between data vectors and is presented with different colorings. It is based on preservation of data topology. SOM U-matrix generates graphical representations in two-dimensional space such that, given a suitable measure of proximity, vectors which are spatially or topologically relatively close to one another in high-dimensional space are spatially or topologically close to one another in their two dimensional representation, and vectors which are relatively far from one another in high-dimensional space are clearly separated, either by relative spatial distance or by some other graphical means, resulting—in the case of nonrandom data—in a configuration of well-defined clusters [59]. The analysis was a two-stage process. The first was the training of SOM by loading all the vectors comprising DFW, Dbigram, and Dtrigram into the input space. The second was the generation of the two-dimensional representation of the DFW, Dbigram, and Dtrigram on the map. For each vector, the values in the input space were propagated through all the connections to the units in the lattice. Because of the variation in connection strength, a given vector activated one unit more strongly than any of the others, thereby associating each vector with a specific unit in the lattice. When all the vectors had been projected in this way, the result was a pattern of activation across the lattice. The U-matrix representation of SOM output used the relative distance between connection vectors to find cluster boundaries. Specifically, given 42 × 60 output map DFW, 42 × 30 output map Dbigram, and 42 × 40 output map Dtrigram, the Euclidean distances between the connection vector associated with each map unit and the connection vectors of the immediately adjacent units were calculated and summed, and the result for each was stored in a new matrix UDFW, UDbigram, and UDtrigram, having the same dimensions as DFW, Dbigram, and Dtrigram. U was plotted using a color coding scheme to represent the relative magnitudes of the values in UDFW, UDbigram, and U Dtrigram in which a dark coloring between the vectors corresponds to a large distance and, thus, represents a gap between the values in the input space. A light coloring is the boundaries between clusters or the vectors, indicating that the vectors are close to each other in the input space. Light areas represent clusters and dark areas cluster separators. Any significant cluster boundaries will be visible.

Voronoi Map

Given a set of vectors, a Voronoi map partitions a manifold surface, say a plane, into regions based on the distances between a set of vectors in a specified subset of the manifold surface. These regions are called cells, which surround each vector. The partition of a manifold surface into areas surrounding vectors is a tessellation. Each cell contains all vectors that are closer to its defining vector than to any other vector in the set. Subsequently, the boundaries between the cells are equidistant between the defining vectors of adjacent cells. That is, the neighborhood of a given vector in a Voronoi tessellation is defined as the set of vectors closer to its defining vector than to any other vector in the set. The set of neighborhoods defined by the Voronoi tessellation is known as the manifold’s topology [59]. The analysis was in a three-stage process. The first step was the construction of a 2-dimensional Voronoi plot for a set of vectors in DFW, Dbigram, and Dtrigram. The second was the construction of Delaunay Triangulation (Voronoi map) on the same 2-dimensional plot. The third step was the computation of the Voronoi map to obtain a 2-dimensional topology of the Voronoi map for the set of vectors in DFW, Dbigram, and Dtrigram.

4. The Attributional Analyses

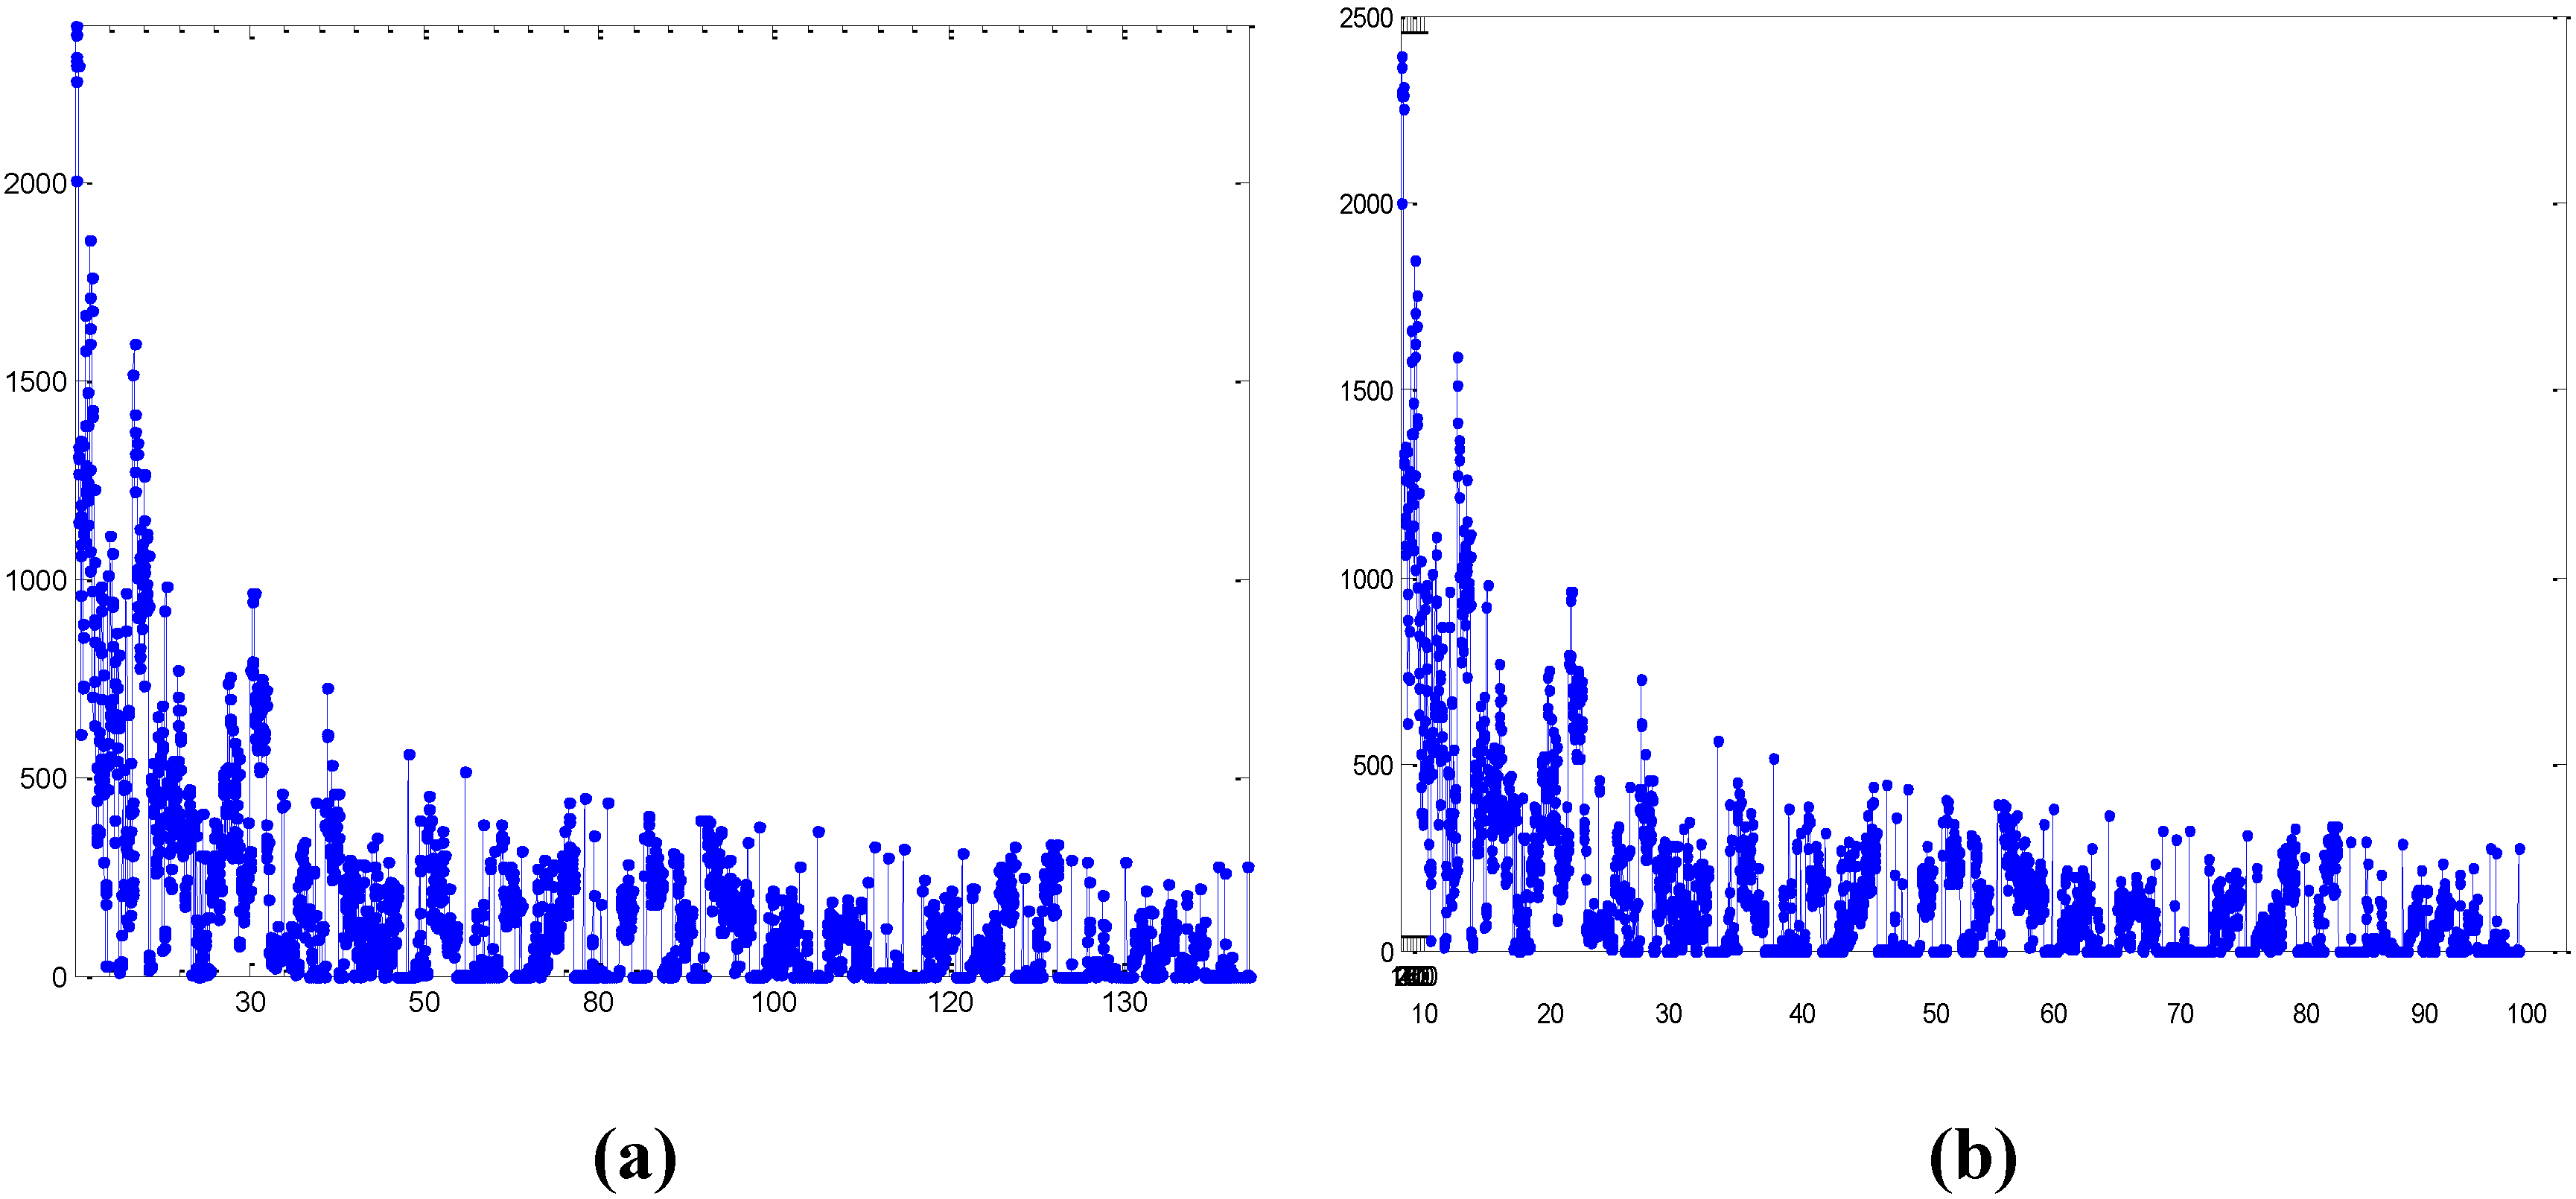
4.1. Analysis of the Frequencies of Usage of Shakespeare’s Function Words, Word Bi-Grams, and Character Triple-Grams

The result of the assessment of clustering tendency test indicates the presence of eleven well-separated clusters in DFW, as shown in Figure 4 below:
Figure 4. An assessment of clustering tendency test for Shakespeare DFW.
Socsci 04 00758 g004
And the result of the hierarchical analysis shows that the fifteen texts are grouped into eleven clusters according to the similarities of frequency vector profiles, as shown in Figure 5 below:
Figure 5. The hierarchical cluster analysis of Shakespeare DFW using Product-Moment correlation and Mean Proximity.
Socsci 04 00758 g005
Reading it from the top, DisEdward and ShaKing constitutes the first cluster. DisHenry1 and DisHenry2 constitute the second cluster. This cluster is combined the remaining four clusters comprising, respectively, ShaRichard, DisHenry3, DisRichard, and DisLear. DisHamlet constitutes the seventh cluster, and is combined the remaining clusters comprising, respectively, DisHenry8 and ShaCymbeline, ShaHenry1 and ShaHenry2, ShaHenry3, and DisTitus.
Based on this clustering, it is clear that the disputed plays (DisHamlet, DisLear, and DisTitus) are well separated from the other Shakespeare’s works and that DisHenry1, DisHenry2, and DisHenry3 are not clustered with Shakespeare’s works in and only one (sub)cluster. Before applying the other methods on the Shakespeare DFW, in order to analyze it and validate this result as well. One step was necessary at this stage of the analysis. Because issues of genre and genre impact on attribution are crucial in the field of authorship attribution (e.g., genre-dominated clustering), we added two plays of a similar genre and the same time period into the corpus. The first was The False One; a history play by Francis Beaumont and Philip Massinger, though formerly placed in the Beaumont and Fletcher canon. The other was The White Devil; a tragedy by John Webster. These share or use the same conventions and themes in Shakespeare’s plays including gain and loss of power, divine right, betrayal, love, revenge, lust, etc. Then we re-cluster analyzed the whole to see where they fit among the disputed and Shakespearean dramas.
A close examination of the result from this analysis shows that the clusterings displayed in Figure 5 are indistinguishable from those in Figure 6, except that Beaumont and Massinger’s drama and Webster’s drama can both be distinguished as somewhat separate from the other three clusters—of course, because they are written by different authors. The same result is also obtained from the hierarchical analyses of Dbigram and Dtrigram and from the other methods, but we displayed here only the hierarchical analysis for the clarity of displaying the resulting clusters, and only for the hierarchical DFW because we did not want to confuse the readers with too many analyses. The indication therefore is that the clustering seems to be correlated with authorship style.
Proceeding with the attributional analysis, the next step is the application of PCA, SOM (U-matrix), and Voronoi map to Shakespeare’s DFW:
The light pink-vintage areas shown in the SOM map are the regions where the texts are topologically close, that is where they cluster, and the dark pink-vintage are where they topologically far apart.
All the clustering methods in Figure 5, Figure 7, Figure 8 and Figure 9 applied to the fifteen texts (6 plays by Shakespeare and 9 nine disputed plays) in DFW, Dbigram, and Dtrigram give similar results. Shakespeare’s plays are not close to six of the disputed texts, particularly DisHenry3, DisHenry1, DisHenry2, DisRichard, DisLear, and DisTitus. The remaining three disputed texts (DisEdward, DisHenry8, and DisHamlet) are clustered with the Shakespeare plays (history and tragedy plays) within the same clusters. They were either close to each other in the same sub-cluster or close by in an immediately joining sub-cluster. The general indication therefore suggests that Shakespeare is not the author of all the works traditionally attributed to him. This experimental result is suggestively significant, but not enough to draw firm conclusions for the problem in question. Additional suspect authors is required.
Figure 6. The hierarchical cluster analysis of Shakespeare DFW using Product-Moment correlation and Mean Proximity.
Socsci 04 00758 g006
Figure 7. PCA of Shakespeare DFW.
Socsci 04 00758 g007
Figure 8. SOM U-matrix of Shakespeare DFW.
Socsci 04 00758 g008
Figure 9. Voronoi map of Shakespeare DFW.
Socsci 04 00758 g009

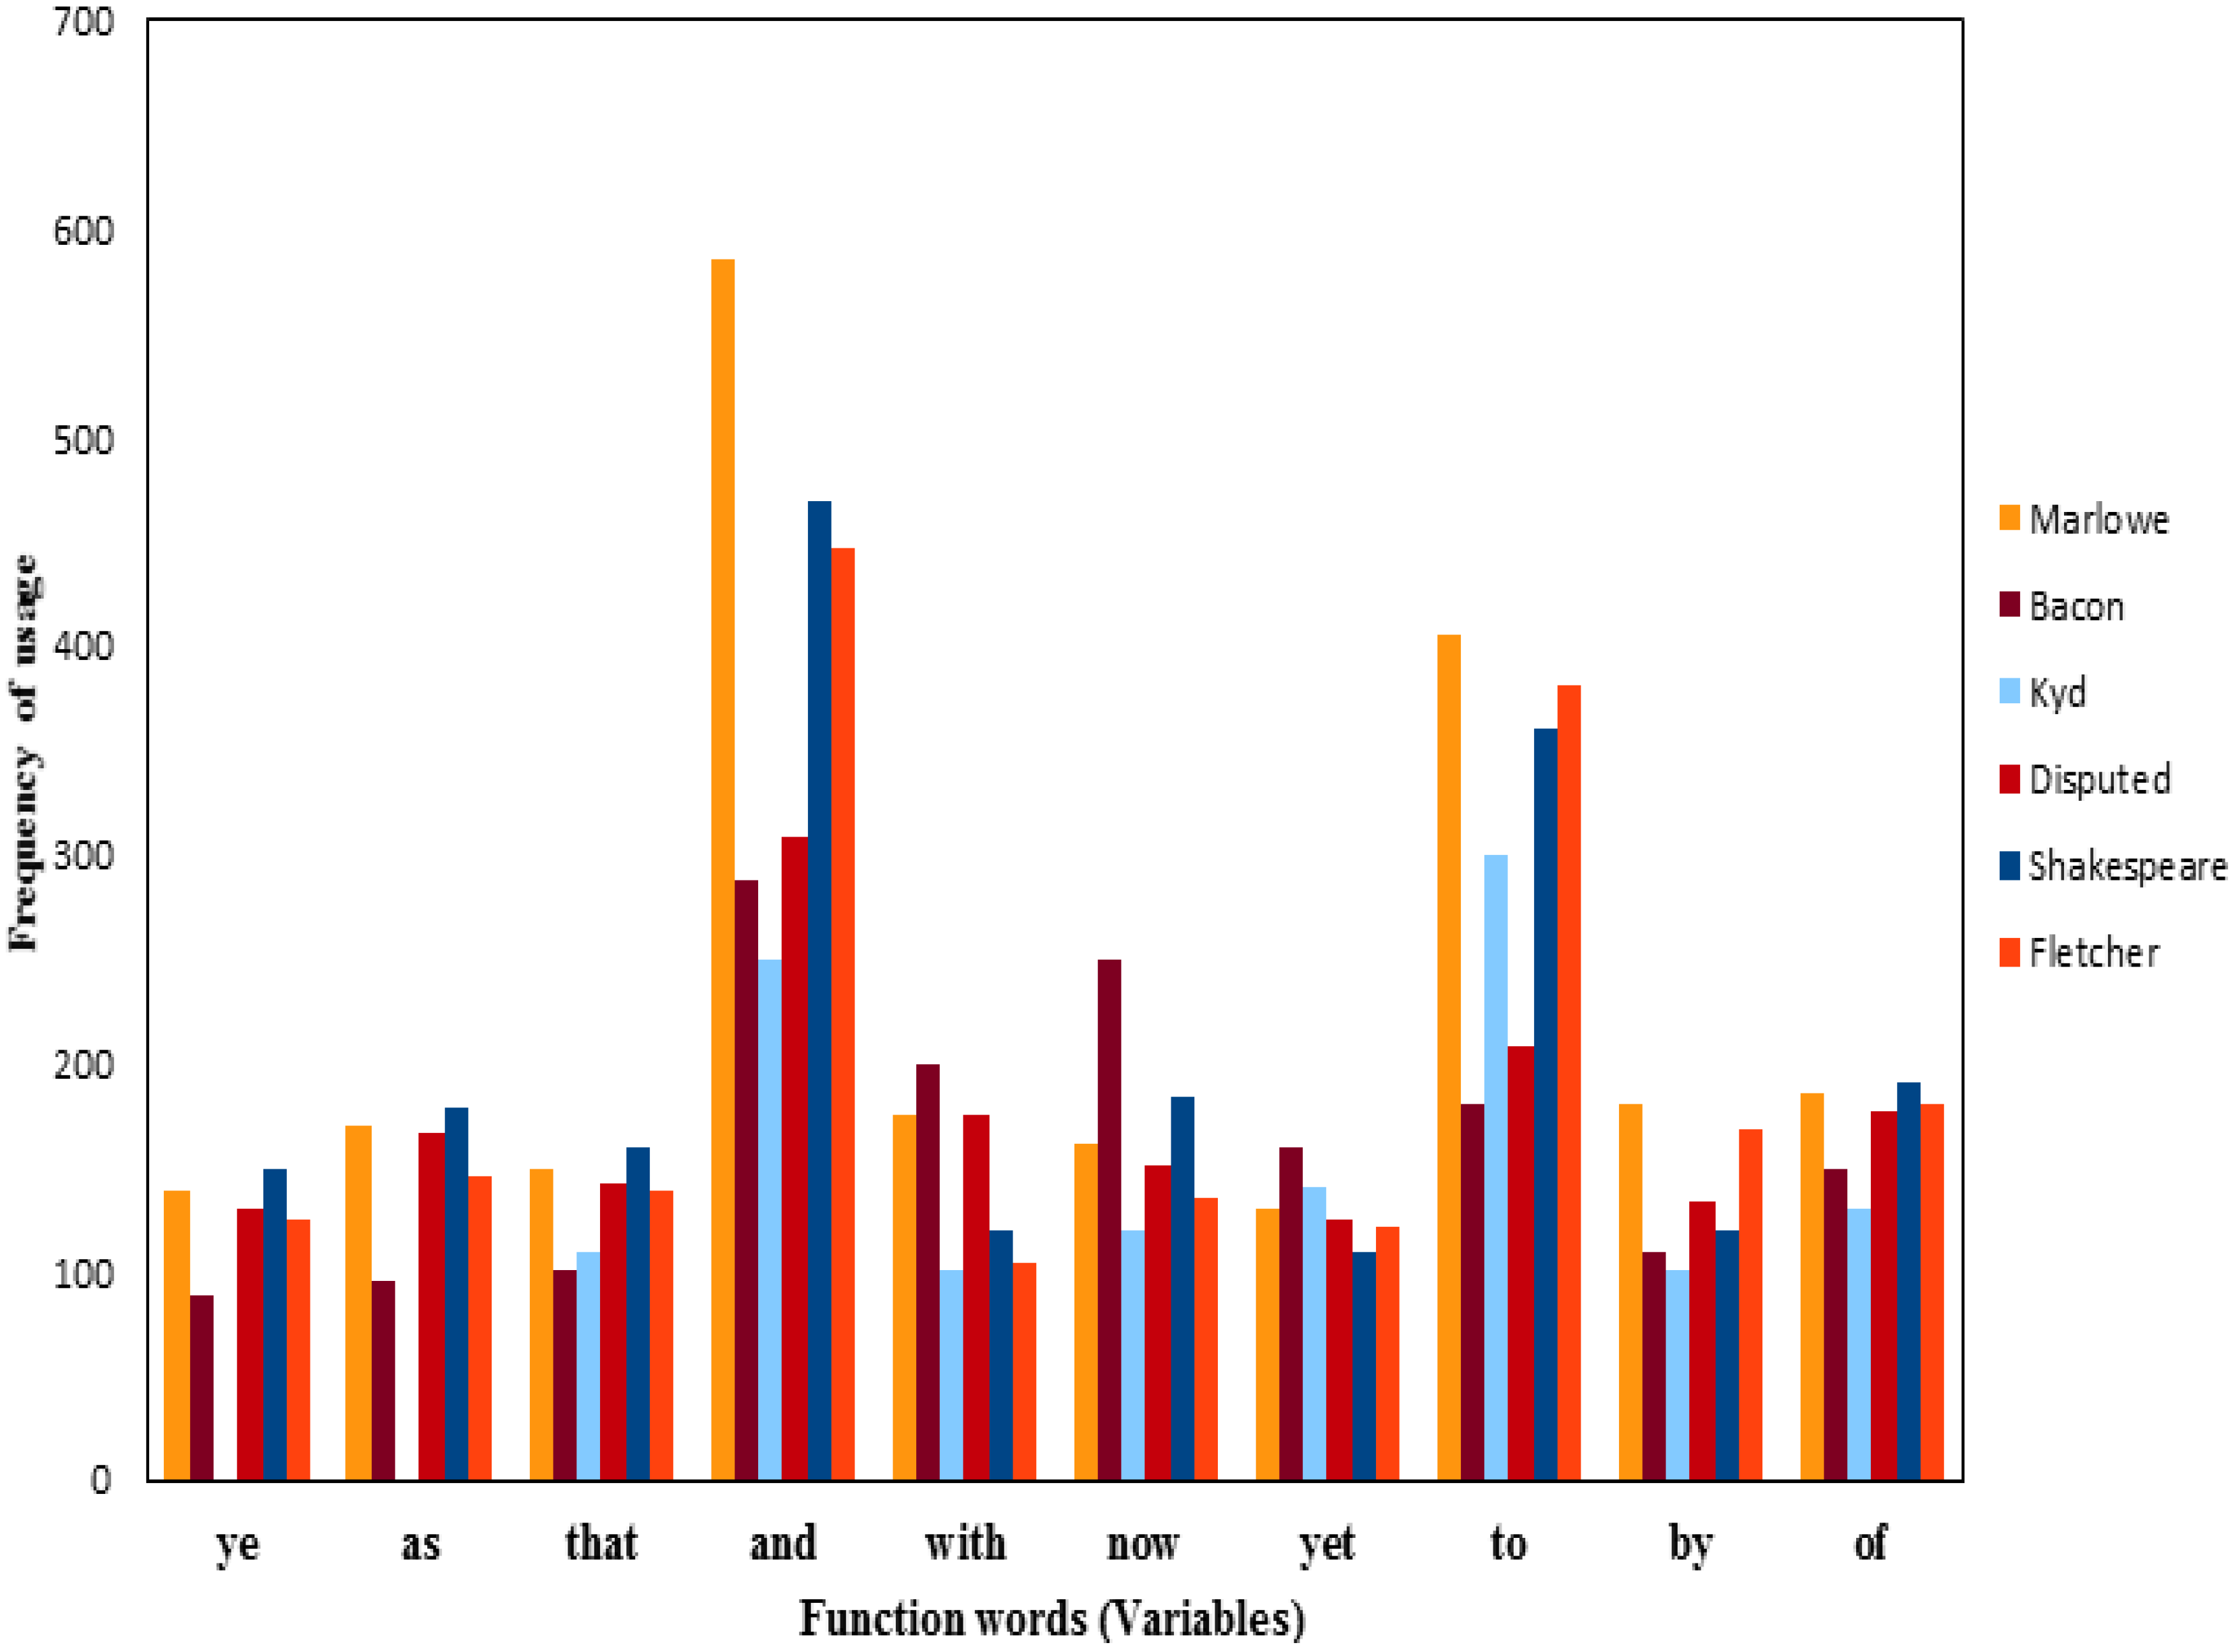
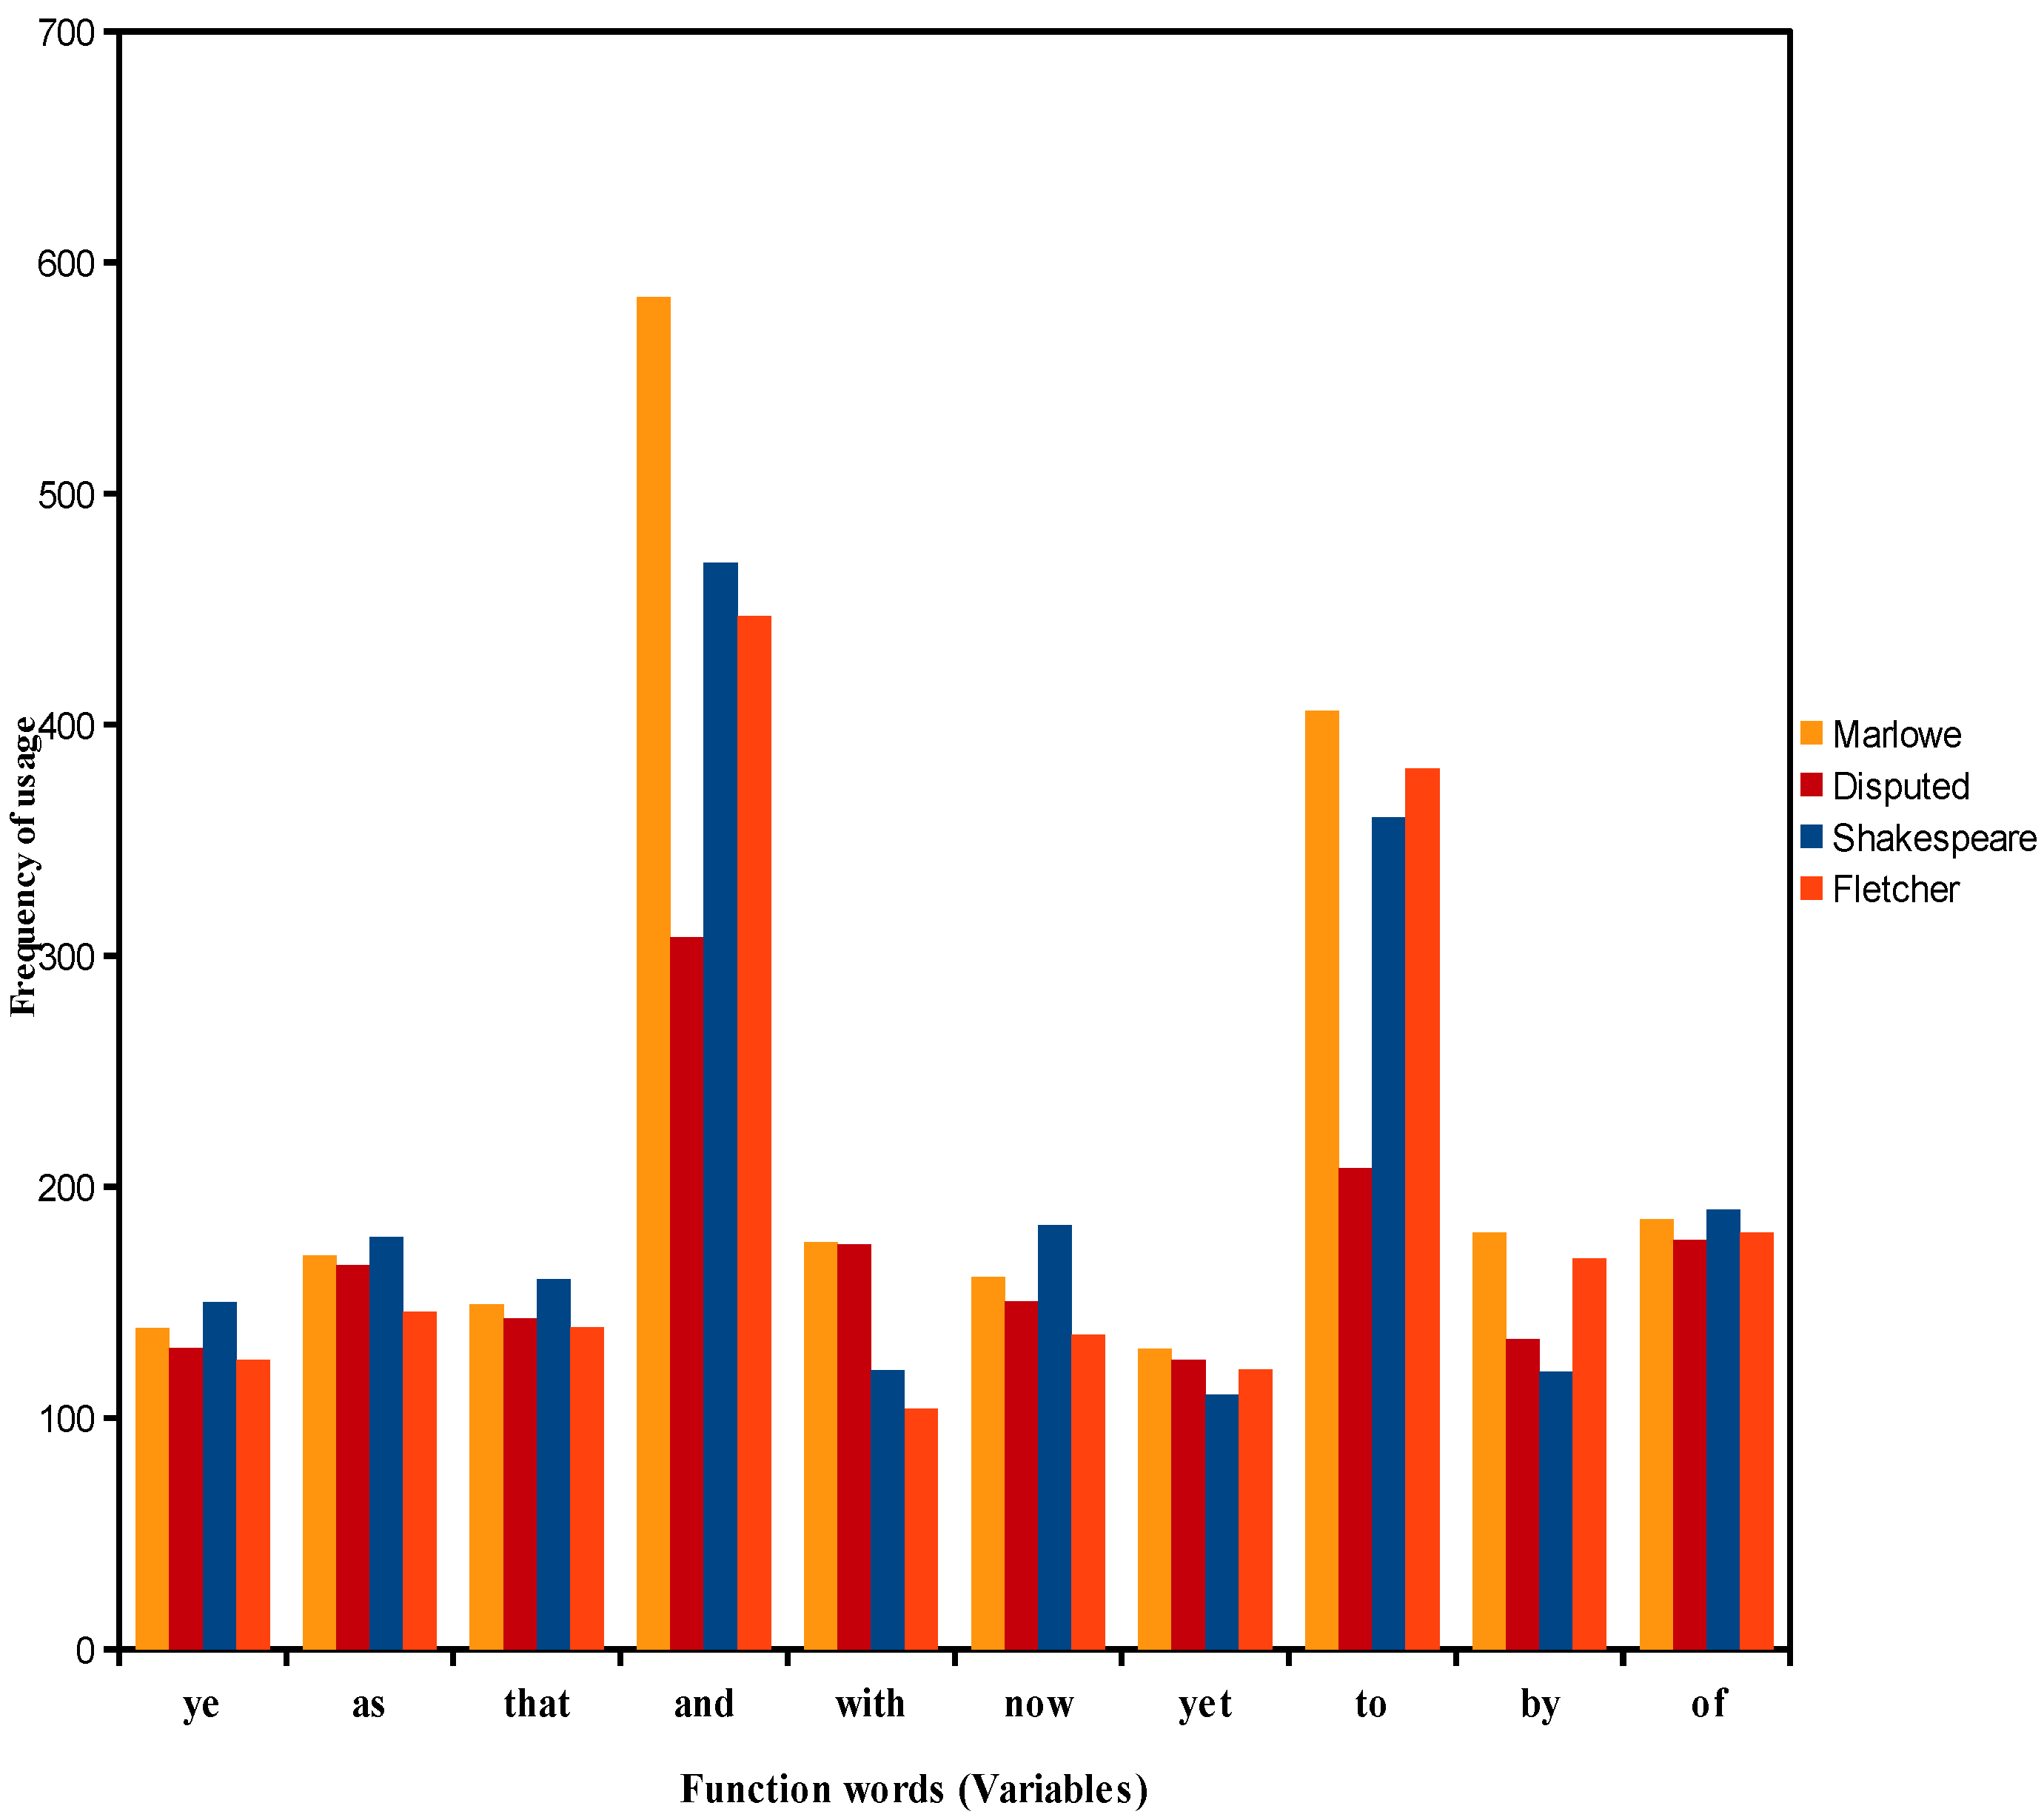
4.2. Analysis of the Frequencies of Usage of Shakespeare and Other Authors’ Function Words

The result of the assessment of clustering tendency test indicates the presence of five well separated clusters in DFW, as shown in Figure 10 below.
Figure 10. An assessment of clustering tendency test for DFW.
Socsci 04 00758 g010
The clustering result that the various analytical methods assign to DFW text matrix rows is significant. Examination of all the diagrams in Figure 11, Figure 12, Figure 13 and Figure 14 reveals a strong consistency in the way the forty two texts enlisted in Table 1 are grouped in terms of their relative proximity from one another. For example, all the texts attributed to Bacon, as expected, were clustered together in one or two main sub-clusters. Also, six of John Fletcher’s tragic-comedies (Wit without Money, The Woman’s Prize, The Humorous Lieutenant, The Wild Goose Chase, and Rule a Wife) were clustered together in one cluster. ThoSpanish, MarMassacre, MarEdward, and ThoIeronimo are clustered close to each other. More specifically, the good agreement found between the methods for DFW analyses shows a very close similarity between Shakespeare’s works and four of the disputed works: DisEdward and ShaKing; DisHenry8, DisLear, and ShaCymbeline; DisHenry1, DisHenry2, and ShaRichard. It also show a very close similarity, on the one hand, between Marlowe’s works and two of the disputed works, DisHenry3 and MarTamb1; MarTamb2, MarEdward, and MarMassacre; and between Fletcher’s FletFaithful and DisTitus on the other. The agreement further shows that DisHamlet and DisRichard are not placed nearer to any of Shakespeare’s works. Examination also reveals few inconsistencies in the way that the forty two texts are clustered by the hierarchical and non-hierarchical linear and non-linear analyses due to the type of data structure each method captures. For example, in PCA DisEdward and ShaKing are not grouped close together in the space and DisHenry8 and ShaCymbeline are placed close to each other but relatively not close to DisLear as with the other methods. Also, MarEdward and ThoSpanish are close to each other in the space but not close to ThoIeronimo and MarMassacre as with the other methods. In SOM, DisTitus and FletFaithful are not placed close together in the space. In Vornoi map, MarEdward, ThoSpanish, and ThoIeronimo are close to each other in the space but not close to MarMassacre. In the hierarchical analysis and Voronoi, DisHenry3 is closer to MarTamb1 and MarTamb2, in PCA to MarMassacre and MarEdward, and in SOM to MarTamb2 and MarEdward. In the hierarchical analysis DisRichard is sub-clustered on its own, but is close to MarTamb1 while in PCA DisRichard is placed close to MarDido, in SOM to MarEdward and MarMassacre, and in Voronoi DisRichard is placed on its own.
Figure 11. The hierarchical cluster analysis of DFW using Product-Moment correlation and Mean Proximity.
Socsci 04 00758 g011
Figure 12. PCA of DFW.
Socsci 04 00758 g012
Figure 13. SOM U-matrix of DFW.
Socsci 04 00758 g013
Figure 14. Voronoi map of DFW.
Socsci 04 00758 g014
The overall indication for DFW analyses is that Shakespeare’s plays are not clustered with the nine disputed ones, in particular DisHenry3 and DisTitus, but with another author or a collaborator (in particular Marlowe and Fletcher).

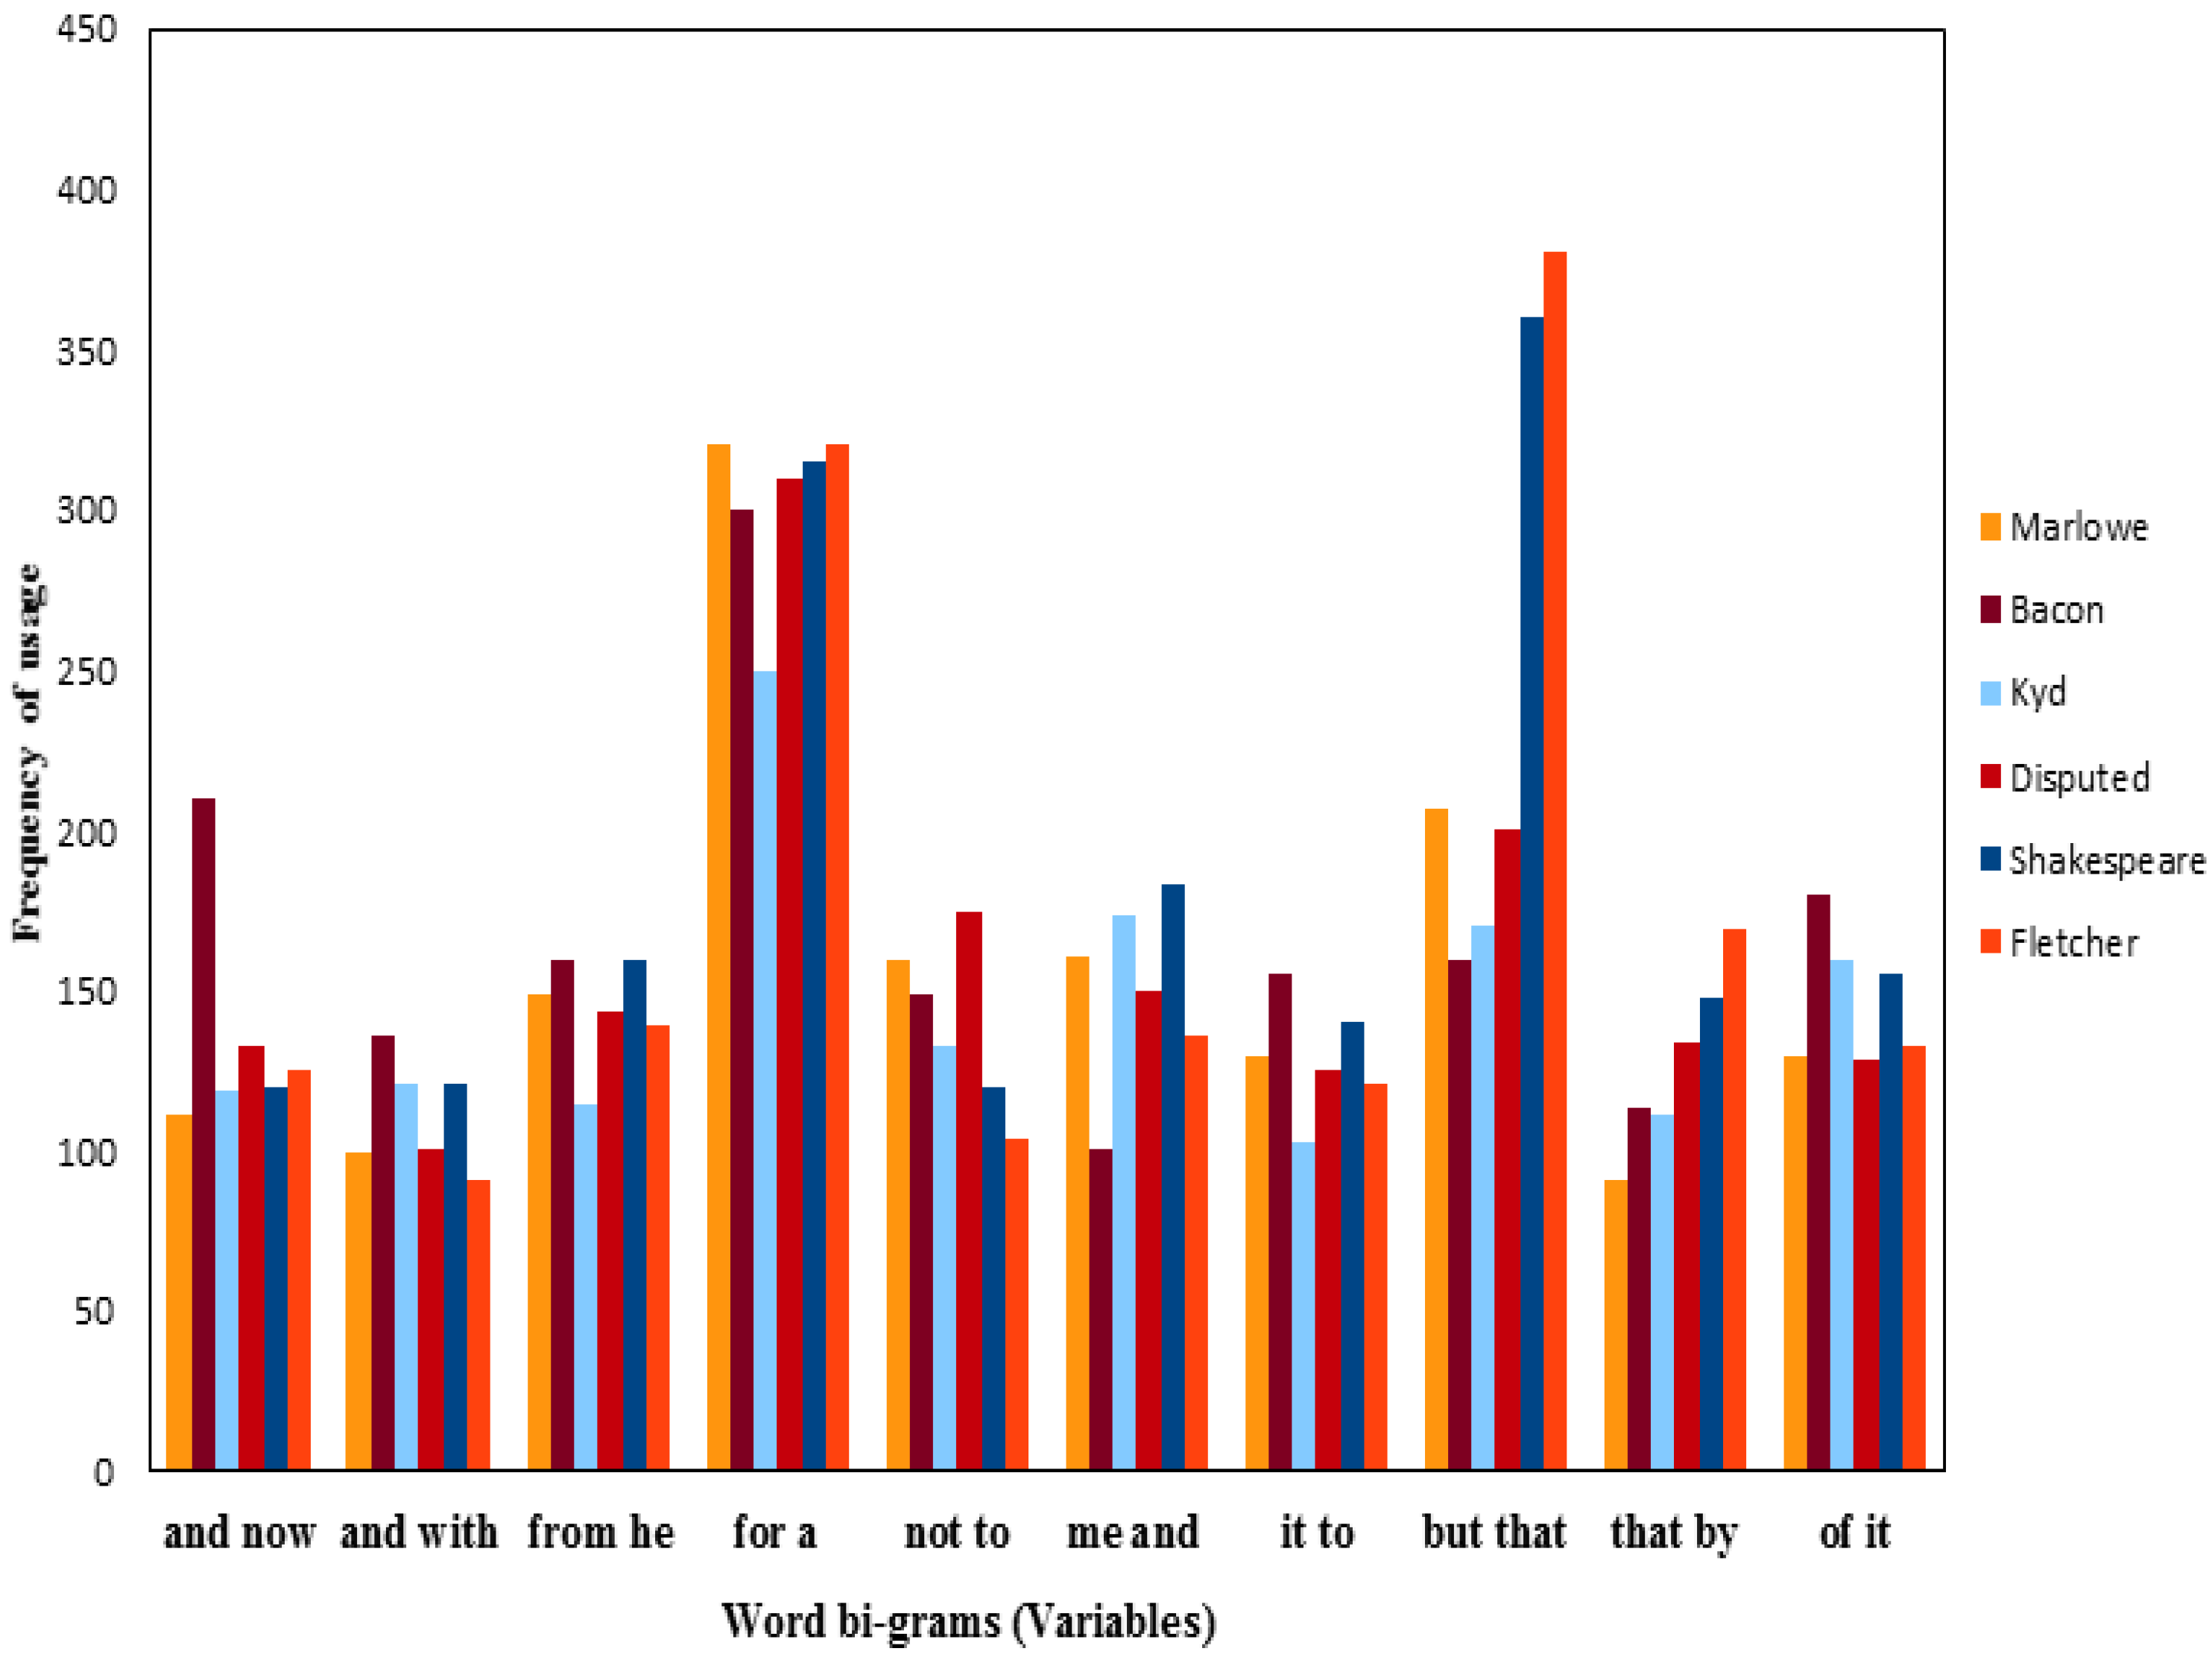
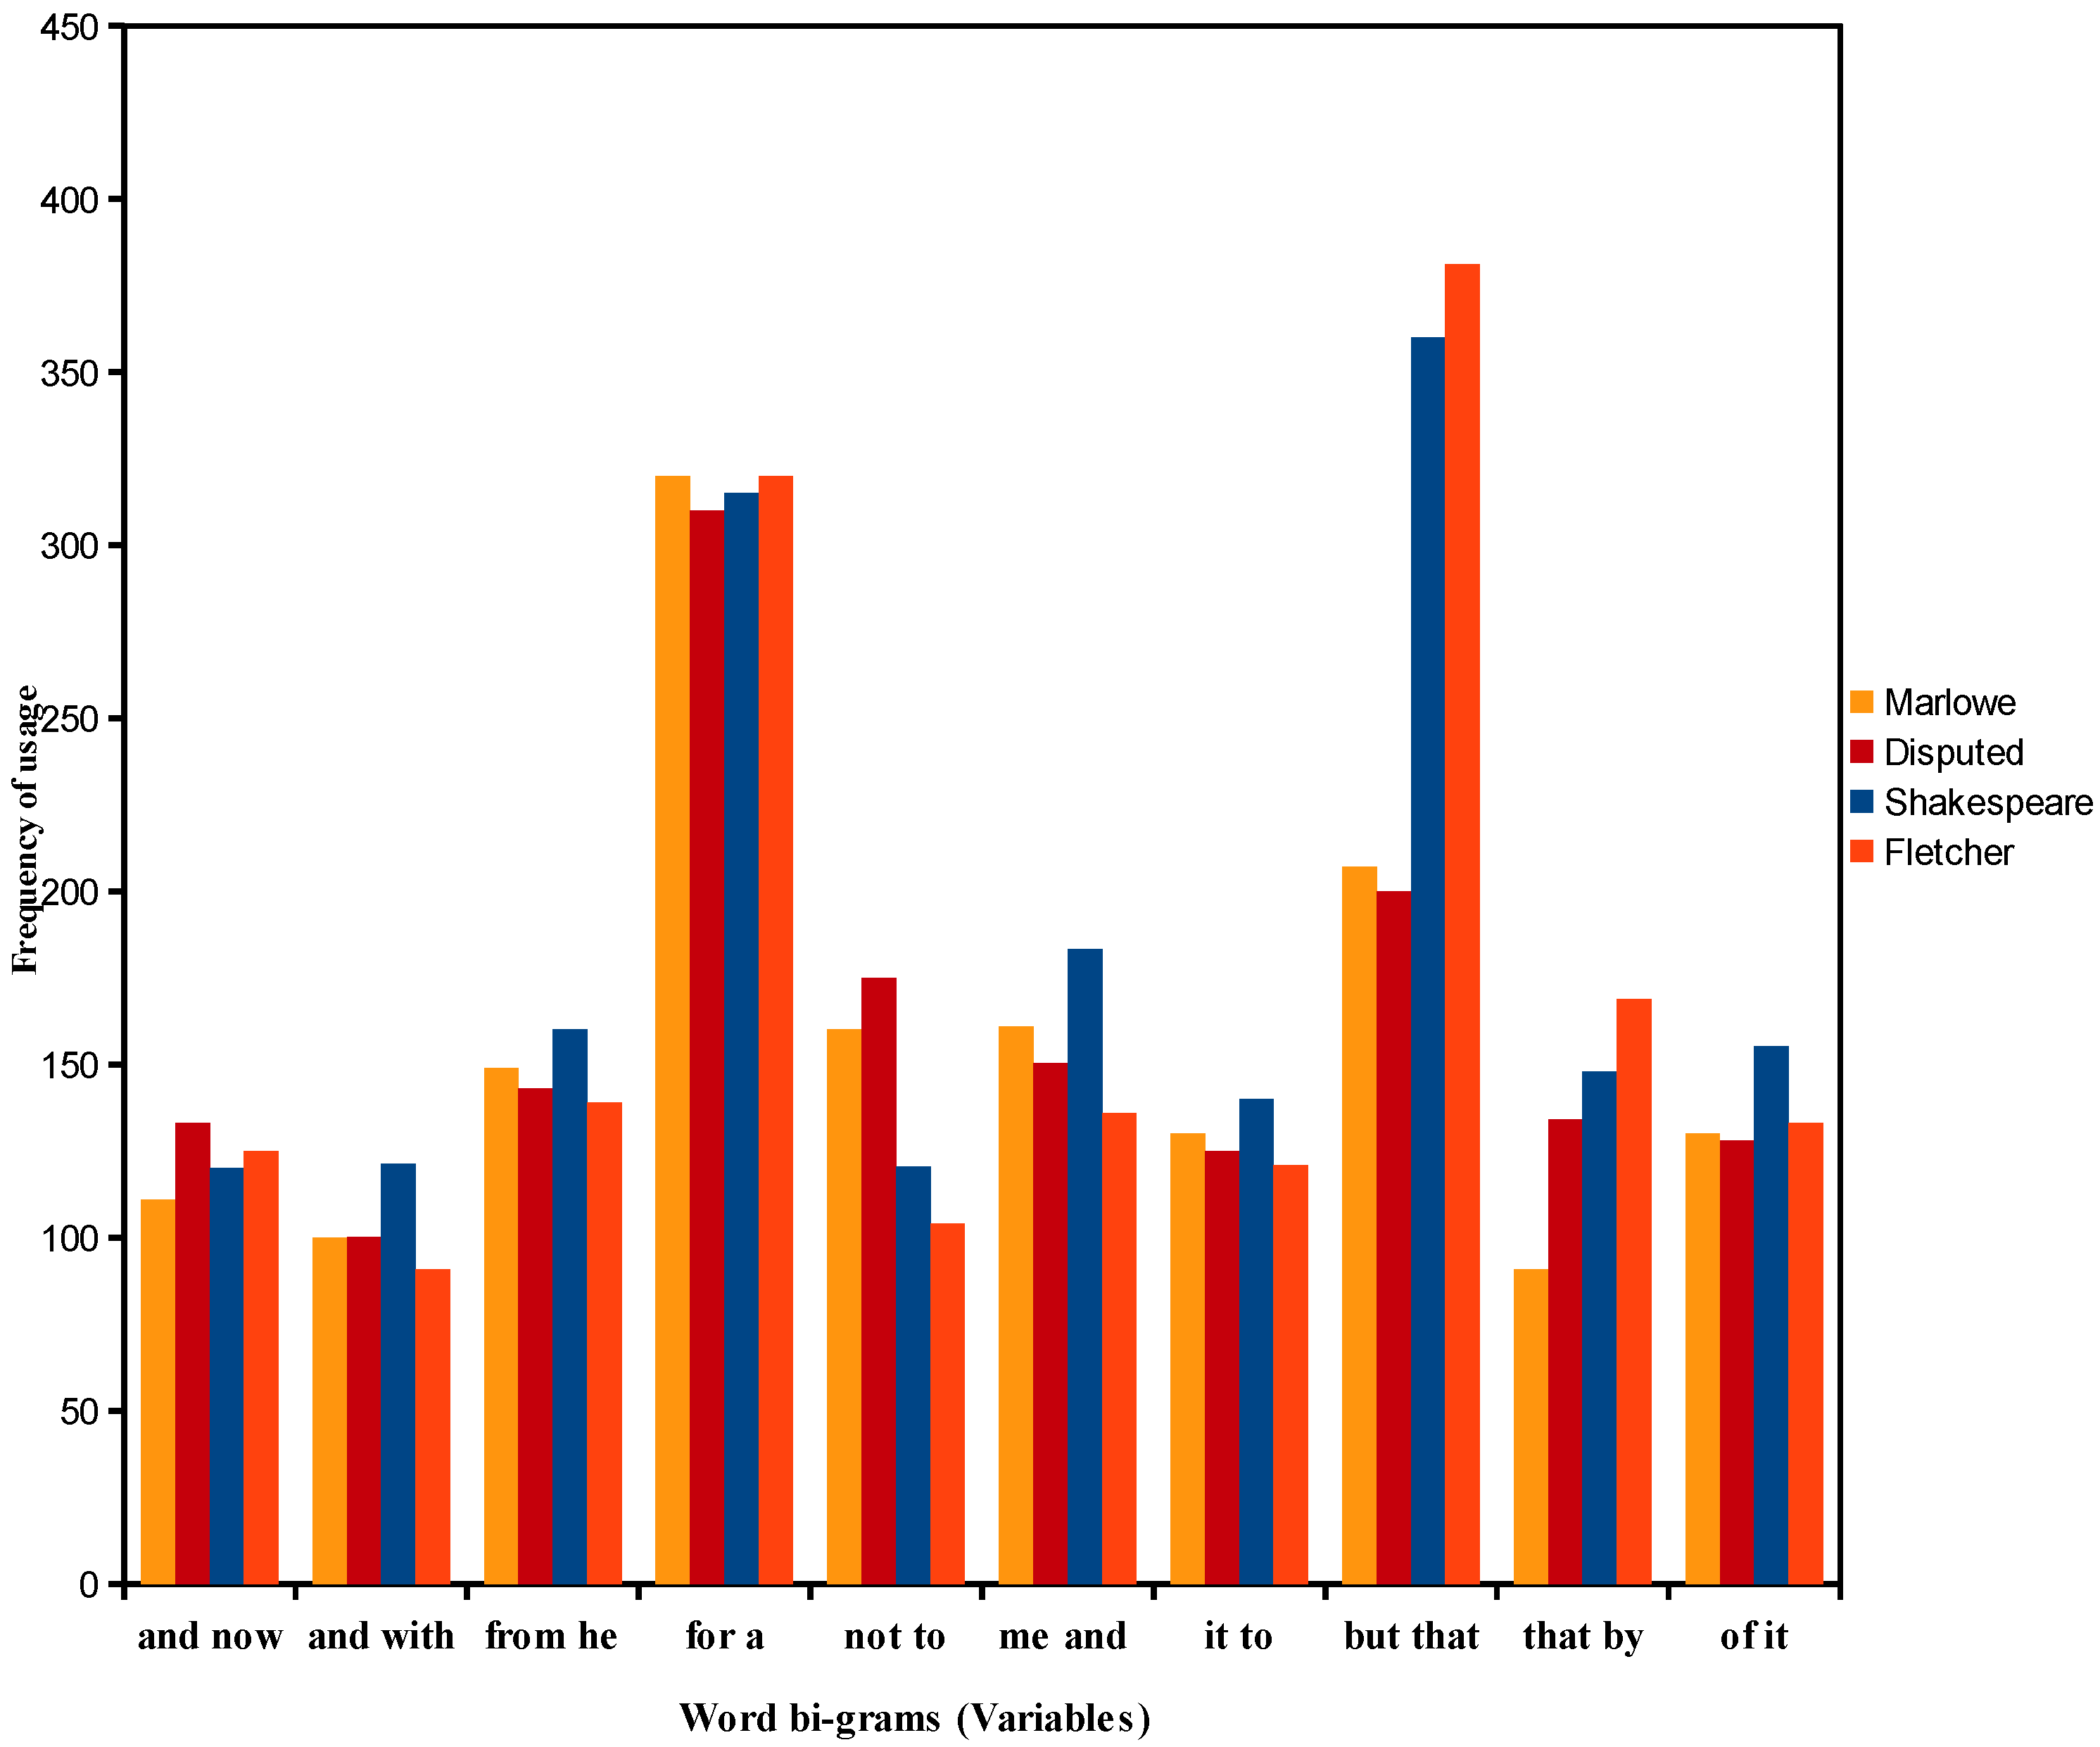
4.3. Analysis of the Frequencies of Usage of Shakespeare and Other Authors’ Word Bi-Grams

The result of the assessment of clustering tendency test indicates the presence of eight well separated clusters in Dbigram, as shown in Figure 15.
Figure 15. An assessment of clustering tendency test for Dbigram.
Socsci 04 00758 g015
For Dbigram analysis, the hierarchical and non-hierarchical linear and nonlinear analyses shown in Figure 16, Figure 17, Figure 18 and Figure 19 are in partial agreement and do not give identical results regarding the clustering of the forty two texts in the foregoing diagrams.
Figure 16. The hierarchical cluster analysis of Dbigram using Product-Moment correlation and Mean Proximity.
Socsci 04 00758 g016
Figure 17. PCA of Dbigram.
Socsci 04 00758 g017
Figure 18. SOM U-matrix of Dbigram.
Socsci 04 00758 g018
Figure 19. Voronoi map of Dbigram.
Socsci 04 00758 g019
For example, the Bacon texts are clustered either together in one cluster or in two adjoining regions in the space. In the hierarchical analysis and PCA, MarEdward, MarMassacre, ThoSpanish, ThoArden, and ThoIeronimo, and FletWife, MarMalta, FletMoney, and ShaHenry2 are placed close together in the space. More specifically, the agreement found between the hierarchical analysis, SOM, and Voronoi shows that DisEdward is closer to MarMalta and MarEdward, and sometimes to MarMalta, MarEdward, and MarMassacre than to Shakespeare’s works. The agreement between the hierarchical analysis and PCA shows that DisHenry1, DisHenry2, DisTitus, and DisRichard are close to ShaRichard, and DisHamlet is close to FletChase and FletPrize. The agreement between the hierarchical analysis and Voronoi map shows that DisHenry3 and DisHenry8 are not close to any of Shakespeare works. The agreement between the hierarchical analysis, PCA, and Voronoi shows that DisLear and FletLieutenant are close to each other in the space. The hierarchical and non-hierarchical linear and non-linear analyses also disagree in clustering the forty two texts in Dbigram. For example, in SOM MarMassacre, MarEdward, and ThoArden are clustered together, but not with ThoIeronimo and ThoSpanish, and in Voronoi only MarEdward and ThoArden are placed close to each other in the space. Also, in SOM and Voronoi, FletWife and MarMalta and FletMoney and ShaHenry2 are not placed close together in the space. In PCA, DisEdward is closer to FletWife and MarMalta than to ShaCymbeline, in SOM to MarMalta, MarEdward, and MarMassacre, and in the Voronoi map, DisEdward is closer to MarMalta and MarEdward. In SOM, DisHenry2 and DisTitus are close to each other but not to DisHenry1 and DisRichard as with the other methods, and DisLear and FletLieutenant and DisHamlet, FletChase, and FletPrize are not in the same adjacent neighborhood of texts. Finally, in the PCA DisHenry3 and DisHenry8 are close to ShaRichard and ShaHenry2, and in SOM, DisHenry3 is close to MarMalta and DisHenry8 is close to ShaKing.
For Dbigram analyses, the different methods were unable to show a good degree of correspondence in clustering the disputed works and the works by Shakespeare and the other authors’ works, apart from the clustering of DisLear with Fletcher’s works. Given the lack of congruence, the only possible result to suggest is, therefore, that DisLear is not excluded from the possibility of having another author’s or a collaborator’s style.

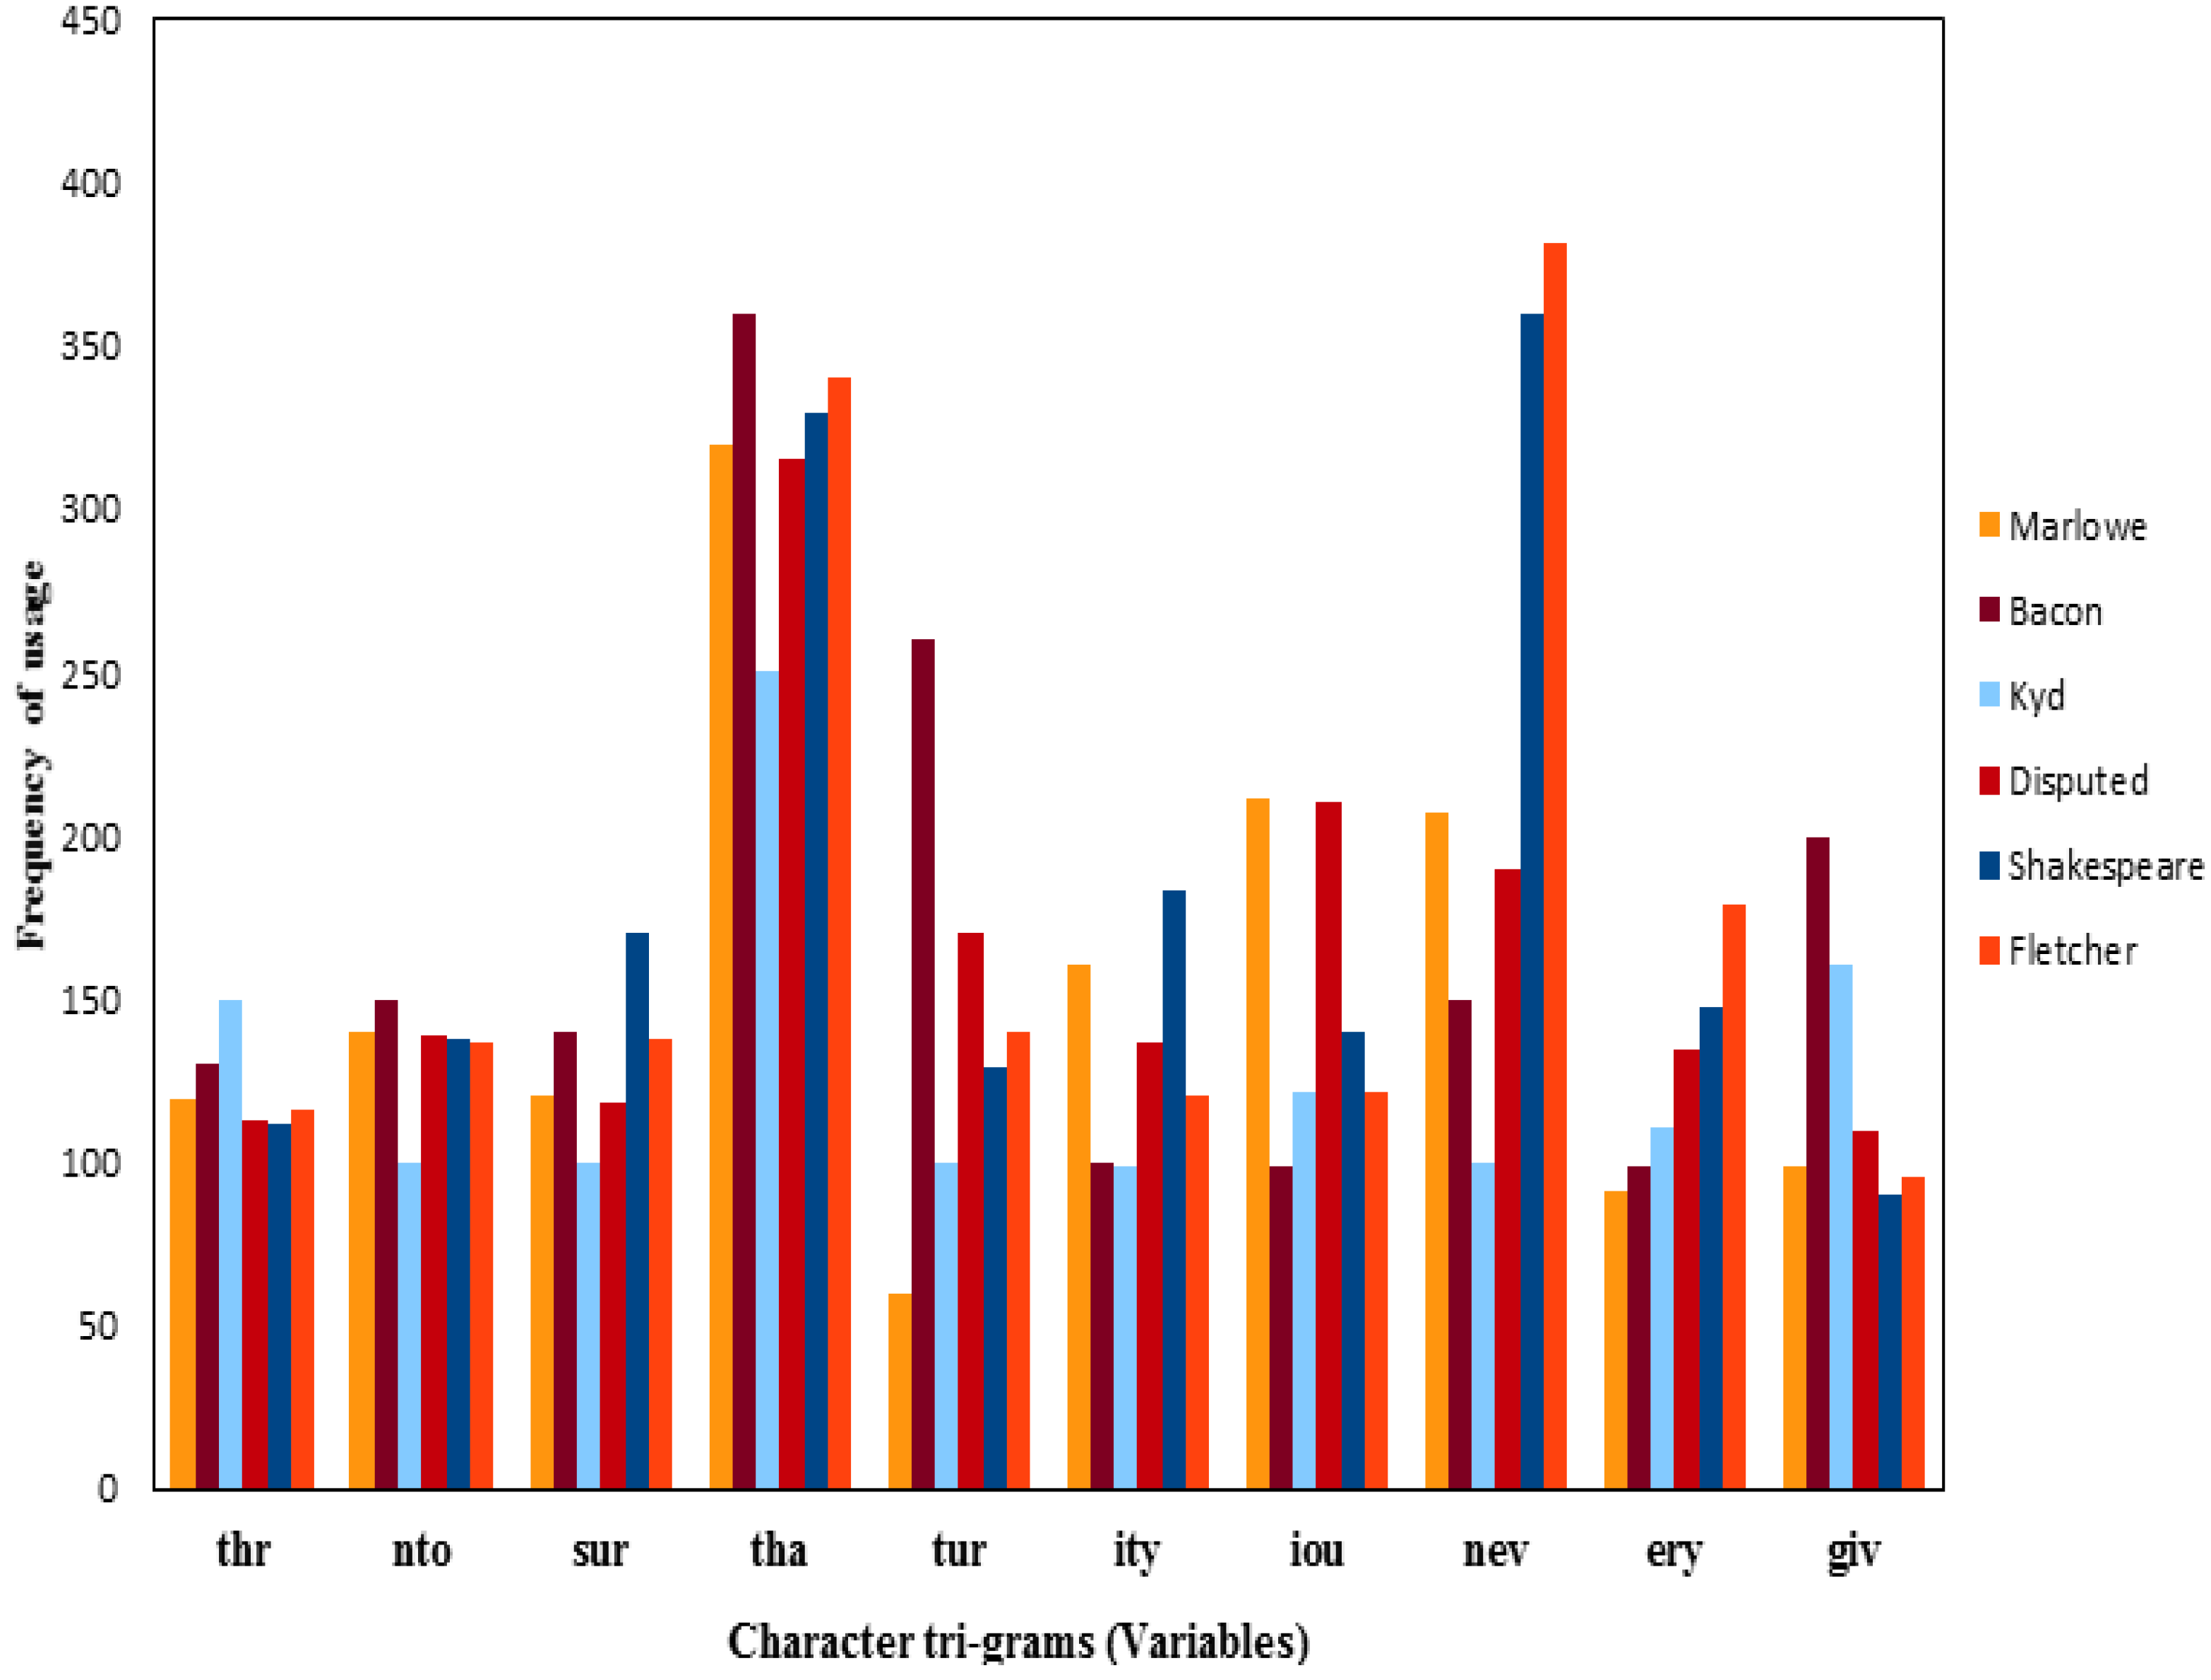
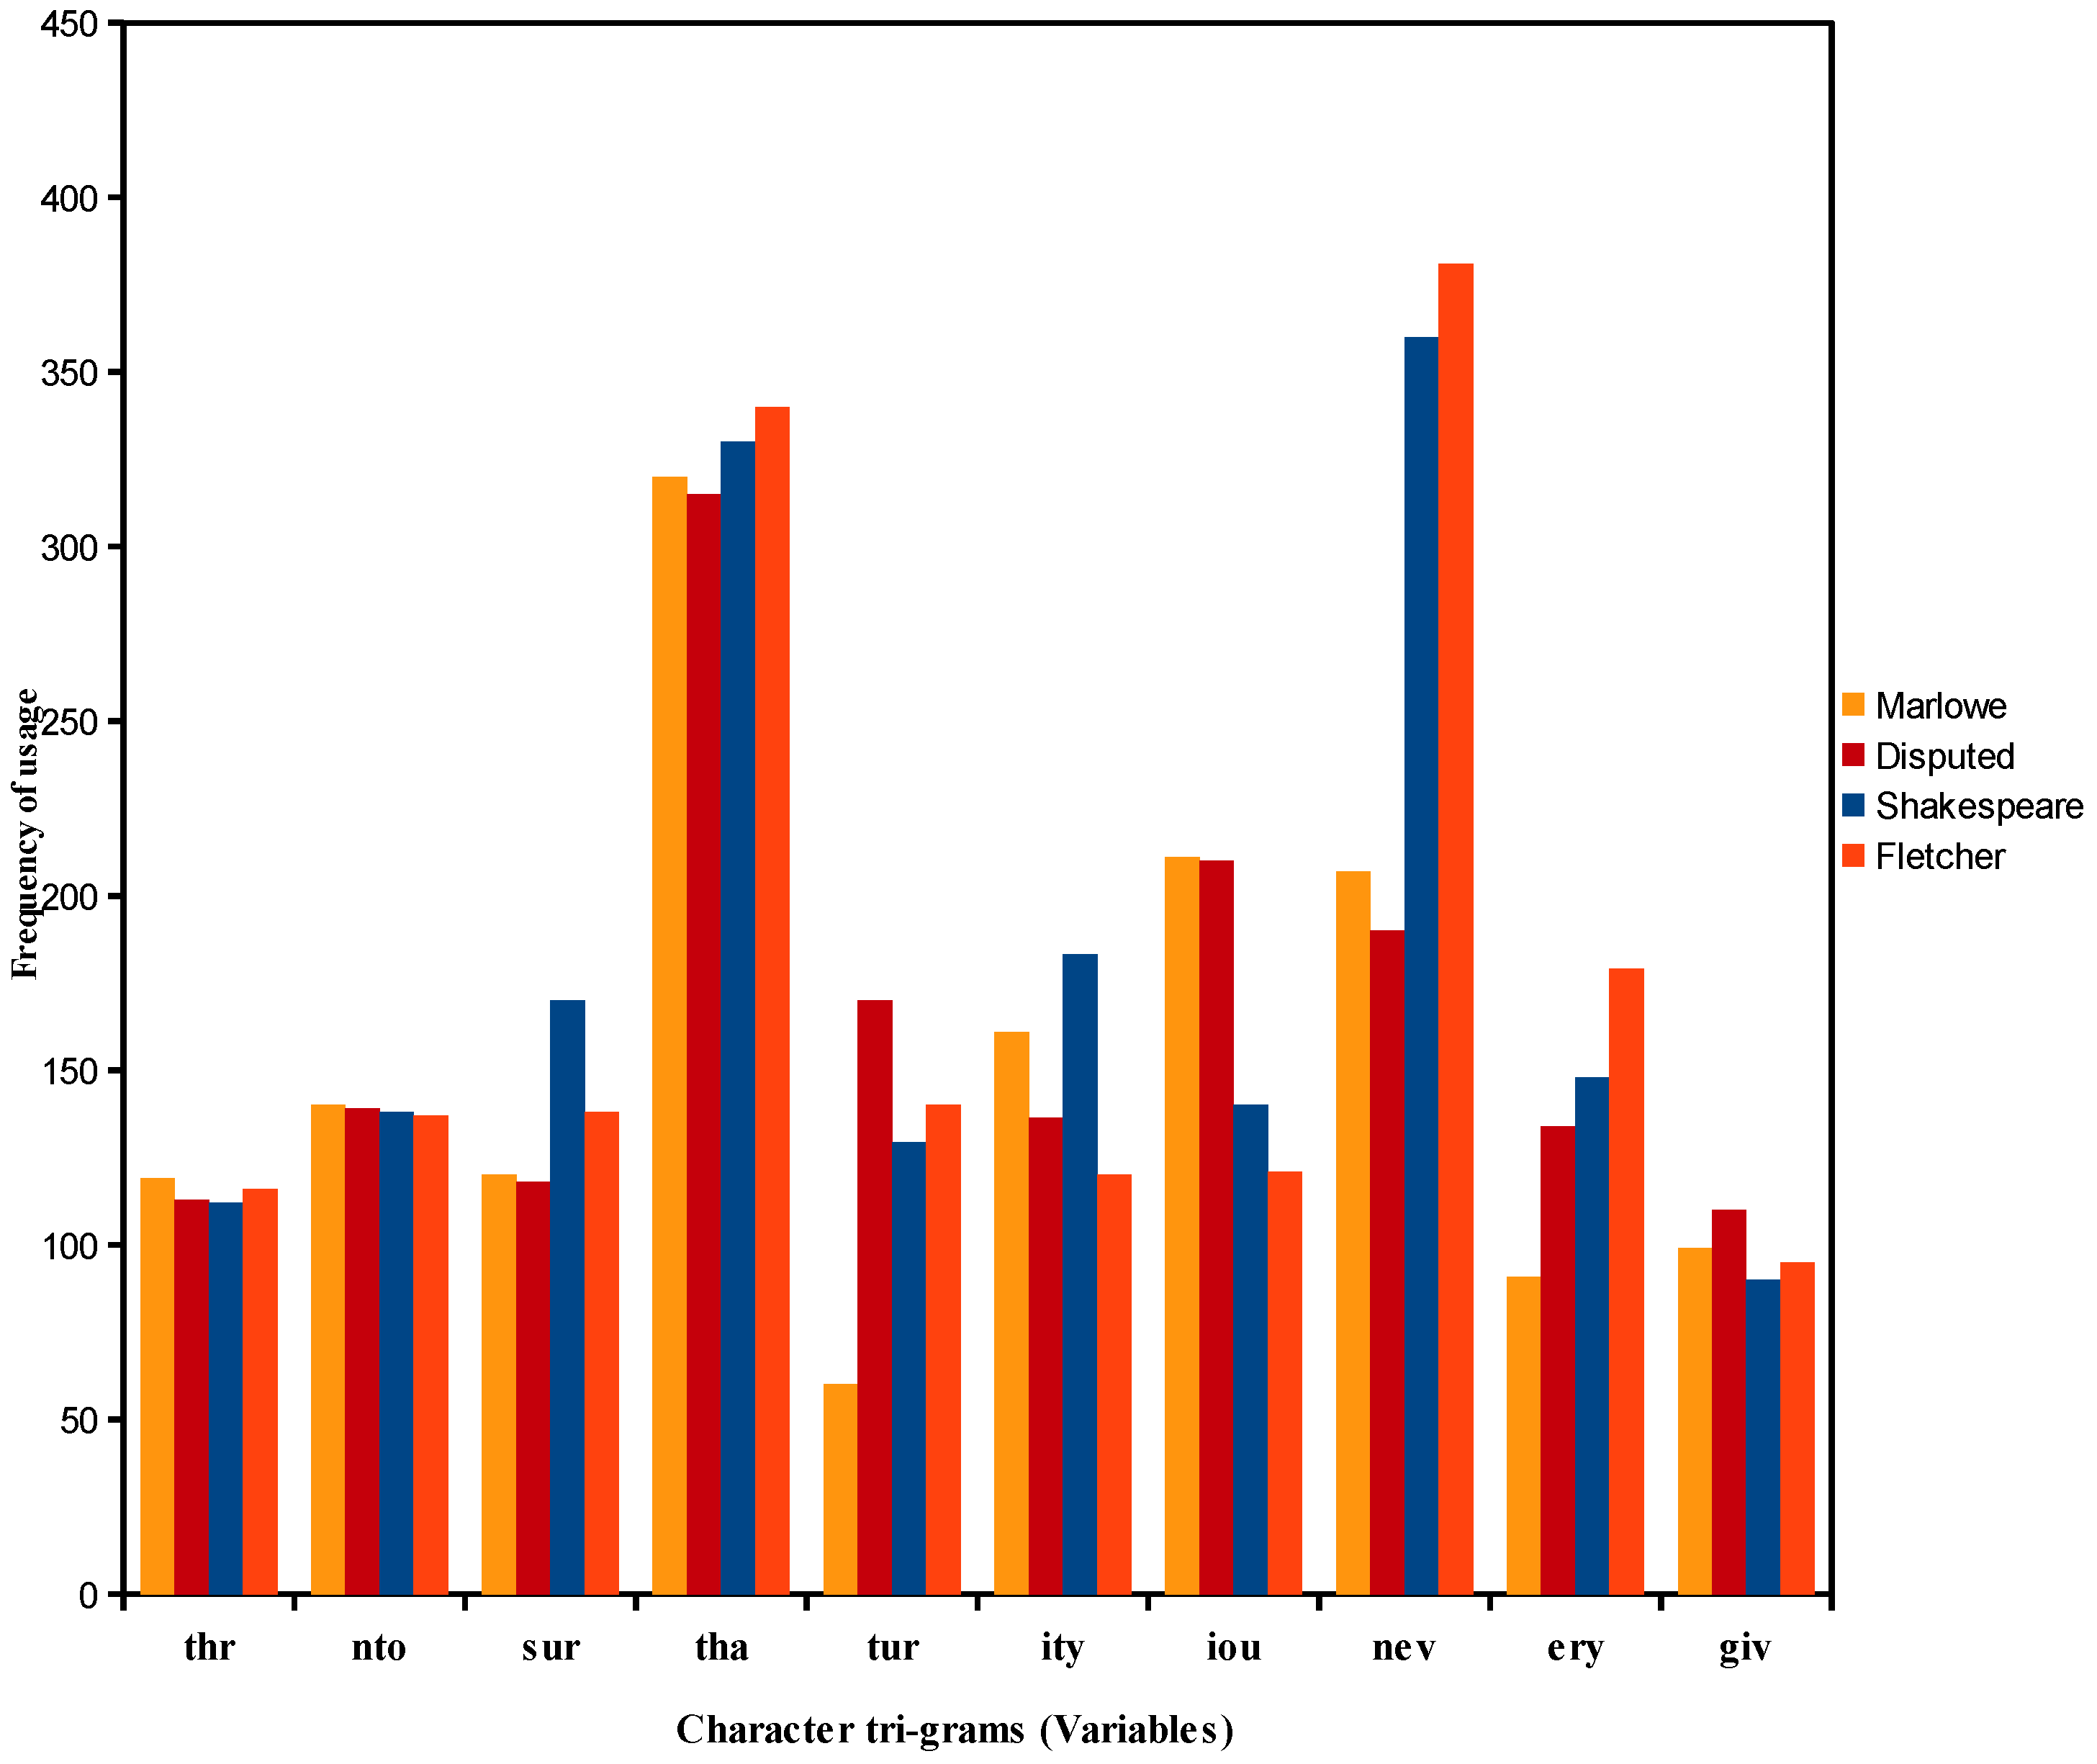
4.4. Analysis of the Frequencies of Usage of Shakespeare and Other Authors’ Character Triple-Grams

The result of the assessment of clustering tendency test indicates the presence of four well separated clusters in Dtrigram, as shown in Figure 20 below.
Figure 20. An assessment of clustering tendency test for Dtrigram.
Socsci 04 00758 g020
The different analyses presented in Figure 21, Figure 22, Figure 23 and Figure 24 below are nearly identical and the clustering of the disputed texts with the works by Shakespeare and the other authors are nearly always identical. For example; all four methods agree on the clustering of the majority of Bacon’s texts into two separate sub-clusters or one single region of adjacent texts. All four methods also agree on the clustering of DisEdward and FletPrize in one cluster or placing them close to each other in the space; while clustering DisHamlet in a separate cluster. In the hierarchical analysis; PCA; and SOM; the clustering of FletChase appears in a single cluster; and so does the clustering of FletBonduca; but both are in an adjacent neighborhood. In the hierarchical analysis; PCA; and Voronoi DisHenry8 and DisTitus are not close enough to Shakespeare’s works. In the hierarchical analysis; SOM; and the Voronoi DisHenry3, DisRichard, and DisLear are not close enough to Shakespeare works and DisHenry1 and DisHenry2 are grouped in one sub-cluster close to DisHenry3 and DisLear. Minor differences are also noticed in the different analyses presented in Figure 21, Figure 22, Figure 23 and Figure 24; for example: in SOM DisHenry8 is close to DisHenry1, DisHenry2, ShaCymbeline, and DisHenry3; and DisTitus appears in an adjacent neighborhood with ThoSpanish, MarFaust, and FletFaithful. In PCA DisHenry3 is close to Marlowe’s works (particularly MarMassacre, MarTamb1, and MarTamb2); DisRichard is close to MarEdward; and DisLear is close to MarFaust. In Voronoi DisRichard is close to MarFaust, ShaHenry1, and ShaHenry2. In the hierarchical analysis and SOM, the clustering of FletWife, MarEdward, MarFaust, ThoIeronimo, and MarMalta appears in two sub-clusters. In the hierarchical analysis and Voronoi the clustering of MarMassacre and ThoSpanish appears in one sub-cluster or close to each other in the space.
In general, the clustering analyses for Dtrigram gives similar results to those just presented in the analysis of DFW above: some of the disputed texts are not close enough to Shakespeare’s works, but are close to the works by the other authors, in particular Marlowe and Fletcher.
Figure 21. The hierarchical cluster analysis of Dtrigram using Product-Moment correlation and Mean Proximity.
Socsci 04 00758 g021
Figure 22. PCA of Dtrigram.
Socsci 04 00758 g022
Figure 23. SOM U-matrix of Dtrigram.
Socsci 04 00758 g023
Figure 24. Voronoi map of Dtrigram.
Socsci 04 00758 g024

4.5. Interpretation

The results generated from the various analyses show that DisEdward, DisHenry1, and DisHenry8 are close to Shakespeare’s works while DisHenry3, DisHenry2, and DisRichard are not. These are close to Marlowe’s and Fletcher’s works; there’s some variation in degree of closeness to these two, but the overall picture is clear. DisLear, DisTitus, and DisHamlet stand even further apart from all the rest of the Shakespeare works. These are also close to Marlowe and Fletcher. More dramatic works won’t help: Marlowe and Fletcher will always be closer than Shakespeare to DisHenry3 and DisHenry2, and DisRichard, DisHamlet, DisLear, and DisTitus will always be relatively further apart from Shakespeare’s works no matter how many other plays are added to the corpus. This can be explained in terms of cluster analysis which places texts into clusters not defined, a priori, such that texts in a given cluster tend to be similar to each other and texts in different clusters tend to be dissimilar on the basis of the relative distance between them. The texts in each cluster (in the boundary region of the cluster or nearby in an immediately adjacent cluster) have something in common that makes them similar. This seems to be due to the individual preferences in the use of function words, sequence of two words, and sequence of triple characters. When examining the works of several authors of the same period, there will be stylistic features common to all authors, as well as distinctive features (such as preferred individual words, syntactic constructions, number of commas, question marks, contractions, word or sentence lengths, etc.) used particularly by one author but not the others. A given stylistic feature can differentiate between the writing styles of authors when it is used more frequently by one author in comparison to other or when it is most distinctive in the writings of a given author [30,32]. The present study assumes that even so many aspects of the individual style of an author are conscious and deliberate when writing in different literary genres, there always exists the possibility that some of them are subconscious and are associated with the individual style of that author.
Given that the texts were clustered on the basis of the function word frequency vectors, bi-gram frequency vectors, and character tri-gram frequency vectors, this implies that each cluster or cluster neighborhood has a characteristic frequency profile which distinguishes it from the others. By comparing the frequency profiles of the resulting clusters for DFW, Dbigram, and Dtrigram, it must be possible to determine the function words, word bi-grams, and character tri-grams in which they differ most, and, on the basis of the frequencies of usage of these features, to infer stylistic characteristics of the respective clusters or clusters membership. The frequencies of usage of function words, word bi-grams, and character tri-grams for all the authors tested were taken from the most distinctive columns of the relevant data matrix. These were compared to the frequencies of usage in the disputed texts. The method for doing so was centroid-based analysis: for a given data matrix, calculate each one of the columns by taking the centroid of variable values for the row vectors in each data matrix, and bar plot the results. The centroids for all authors tested in DFW, Dbigram, and Dtrigram were first calculated and the results are shown in Figure 25, Figure 26 and Figure 27 respectively.
Figure 25. Function words centroid-based bar plot for all the authors tested.
Socsci 04 00758 g025
Figure 26. Words bi-gram centroid-based bar plot for all the authors tested.
Socsci 04 00758 g026
Figure 27. Characters tri-gram centroid-based bar plot for all the authors tested.
Socsci 04 00758 g027
The centroids for the cluster texts of interest in DFW, Dbigram, and Dtrigram were calculated and the results are shown in Figure 28, Figure 29 and Figure 30 respectively.
Figure 28. Function words centroid-based bar plot for Shakespeare, Marlowe, Fletcher, and the disputed texts.
Socsci 04 00758 g028
Figure 29. Words bi-gram centroid-based bar plot for Shakespeare, Marlowe, Fletcher, and the disputed texts.
Socsci 04 00758 g029
Figure 30. Characters tri-gram centroid-based bar plot for Shakespeare, Marlowe, Fletcher, and the disputed texts.
Socsci 04 00758 g030
Based on the amount of variation in each variable-centroid, the indication is:
(1)
Function words “and” and “to” are most important in determining the dis/similarity relations in the foregoing cluster analyses of DFW.
(2)
Word bi-grams “but that” and “that by” are most important in determining the dis/similarity relations in the foregoing cluster analyses of Dbi-gram.
(3)
Character tri-grams “tur” and “nev” are most important in determining the dis/similarity relations in the foregoing cluster analyses of Dti-gram.
From Figure 25, Figure 26 and Figure 27, anyone can observe and make a comparison between the usages of these features in the disputed texts and works by Shakespeare and the other authors. The disputed text profiles fit the profiles of Marlowe and Fletcher, but not those of Shakespeare, Bacon, and Kyd. The centroid analysis reveals a very different pattern in function words, words bi-gram, and characters tri-gram usage from that of the profiles by the other authors. For example, the overall usage of “as” is lower in Bacon and Kyd and greater in Shakespeare, the overall usage of “from he” is greater in Shakespeare and Bacon and lower in Kyd, the overall usage of “giv” is greater in Bacon and Kyd and lower in Shakespeare, and by looking at the usage of “as”, “from he”, and “giv” in the other authors, it can be seen that this is due to the assumption that the frequent usages rate of some stylistic features tends to be stable within an author’s own work and between works by the same author but tends to vary greatly within works written by different authors and within different genres. For example, for DFW centroid analysis, Marlowe shows a higher usage of function words “and” and “to” than in Shakespeare, Fletcher, or the disputed text profiles. Shakespeare shows a higher usage of function word “of” than in Marlowe, Fletcher, or in the disputed texts.
From Figure 28, Figure 29 and Figure 30, it can be seen very clearly that the usage of function words, word bi-grams, and character tri-grams in the disputed text profiles differ from Shakespeare’s profiles and agree with Marlowe’s and Fletcher’s profiles. For example, the usage of “with” is markedly identical in Marlowe’s and the disputed text profiles. The usage of “of” is nearly similar or close in Fletcher’s and the disputed text profiles. For Dbi-gram centroid analysis, the usage of “and with” is markedly identical in Marlowe’s and the disputed text profiles and is markedly high in Shakespeare and low in Fletcher’s profiles. The usage of “of it” is relatively identical in Marlowe’s and the disputed texts. The usage of “for a” in the disputed text profiles is relatively closer to Shakespeare’s profiles than to the profiles by the other authors. Shakespeare shows a higher usage of “me and”, Fletcher shows a higher usage of “but that’, and the disputed text profiles show a higher usage of “not to”. For Dtri-gram centroid analysis, the usage of “sur” and “iou” is very close in the disputed text profiles and Marlowe’s profiles and “tha” in the disputed text profiles is relatively closer to Marlowe’s profiles than to the other authors. The usage of “thr” and “nto” is marked with relatively consistent or frequent usages among all the authors and therefore do not distinguish between them. Marlowe shows a lower usage of the triple character “tur” and Fletcher shows a higher usage of “nev”. The usage of “ery” in the disputed text profiles is relatively closer to Shakespeare’s works than to the other authors.
These patterns of similarities and differences with respect to the most important function words, word bi-grams, and character tri-grams among the profiles of Shakespeare, Marlowe, Fletcher, Bacon, the disputed texts, and Kyd are empirically discriminative stylistic criteria. They clearly identified which function word, sequence of two words, and sequence of triple characters were common for Shakespeare and which were rare for all the others.

5. Conclusions and Further Research

The research question formulated at the outset of this paper was to see whether Shakespeare wrote some of the disputed works traditionally attributed to him. The question was approached by using different cluster analysis methods based on the frequencies of usage of function words, word bi-grams, and character tri-grams. According to the empirical evidence generated from a validated and fully objective and replicable mathematically-based methodology, the answer to this question was “No”. This means that the hypothesis that Shakespeare is the author of the disputed plays traditionally attributed to him is falsified in favor of alternative author(s), and this is by no means what nearly all Shakespearean scholars would expect or share.
The researcher makes no claims in identifying who wrote the disputed plays or collaborated with Shakespeare to write them. Unfortunately, these questions cannot be easily answered for at least five main reasons:
(1)
The current attributional attempt is by nature exploratory. Cluster analysis is an exploratory tool used to detect and represent graphically non-random structures in the distribution of vectors in an n-dimensional space. The obtained clustering can serve as a basis for hypothesis generation without any attempt to determine whether or not such hypotheses are valid. The hypothesis that can be drawn from this study is thus rather suggestive.
(2)
In researching Elizabethan-period literature, the researcher found that Shakespeare is not the only Elizabethan author whose authorship of specific works is controversial. Most Elizabethan plays were published without the playwrights’ names. And this may bring doubt upon the usefulness of the stylistic criteria used here. The implication is that the ongoing dispute over the individual authorship of most Elizabethan plays provides what Craig and Kinney [45] consider “particular difficulties with these plays arise…” and “it may well be more difficult to detect the distinctiveness of individual styles in history plays of this period than elsewhere because the genre itself was just getting established the early 1590s, writers were learning rapidly from each other, and strong influences like Kyd’s, Marlowe’s, and Shakespeare, were felt everywhere”.
(3)
Marlowe and Fletcher may have collaborated or helped Shakespeare to write all or some of the disputed plays, but one knows to draw the boundaries between Shakespeare’s style and the styles of his contemporaries or near contemporaries that would greatly influence his dramatic writings during different stages of his career.
(4)
Apart from Shakespeare, the study included only four of the authors who have been proposed as alternative authors of the entire Shakespeare canon (Bacon, Marlowe, Fletcher, and Kyd). Yet, the alternative candidate, Edward de Vere, who currently has the most support by Oxfordian scholars, is not among those tested.
(5)
The result from this attribution attempt is a plausible result, but it is by far not the only interpretation. It is important not to over interpret this result since it is only based on three textual features, i.e., function words, word-bigrams, and character tri-grams; other stylistic features might give a different result.
On the whole, the final conclusion is that the disputed plays traditionally attributed to Shakespeare are not mathematically similar to any other of his works and, thus, that Shakespeare did not write them: cluster analysis shows that. Function words “and” and “to”, word bi-grams “but that” and “that by”, and character tri-grams “tur” and “nev” most important authorship style discriminators that distinguish between Shakespeare and the others and determine the dis/similarity relations among the texts examined in the foregoing cluster analyses.
The researcher proposes that the result presented here provides additional stylometric suggestive clues that the disputed plays are written by someone other than William Shakespeare of Stratford-upon-Avon. The agreement between the four different clustering methods applied to the corpus of forty two texts enhances the confidence that the results are valid and are not artefacts of the clustering methods. The clustering results of this mathematically-based methodology are replicable and objective. The researcher is generally cooperative in providing needed information for later researchers and stylometricists planning replication using the same methodology to re-examine the current results independently and see if they originally achieved due to some error or perhaps just chance.
Many details remain to be understood and more research into “Shakespeare authorship question” is necessary in order to arrive at firm conclusions. The researcher strongly believes that if the debate on this question is to be moved forward, a better understanding of the following two questions needs to developed. The first is that although mainstream Shakespeare studies accept that collaboration was the norm and not the exception in the early modern English theatre, further research needs to be conducted to examine the precise shares of Marlowe and Fletcher in Shakespeare’s plays using their preferred syntactic constructions, when syntactically annotated electronic corpora or more advanced NLP (Natural Language Processing Tools) become available while also applying also the current methodology. This can be served as evidence to support or refute the claim that Marlowe and/or Fletcher helped or collaborated with Shakespeare on his own plays (i.e., plays that are not from Shakespeare’s acknowledged canon and accepted by scholars as collaborations). The second is related to what Oxfordian scholars consider the more likely hypothesis of Edward de Vere’s authorship of the plays attributed to Shakespeare. The possibility of the Oxfordian theory of the authorship of Shakespeare’s works must not be ruled out. There are nearly 80 letters and some 16 poems available in the public domain that are widely agreed to be written by him. These can be examined in conjunction with various poems and sonnets claimed to have been written by Shakespeare using function words, word n-grams, and character n-grams or syntactic constructions when syntactically annotated corpora become available using the current methods. This can be served as evidence to question or confirm the Oxfordian hypothesis of de Vere authorship of Shakespeare works.

Acknowledgments

The author wishes to thank all those who dedicated their time answering my queries and providing me with valuable comments during the preparation of this study.

Conflicts of Interest

The author declares no conflict of interest.

References

  1. Harold Bloom. Shakespeare: The Invention of the Human. London: Riverhead Books, 1998. [Google Scholar]
  2. Margirie Garber. Shakespeare’s Ghost Writers: Literature as Uncanny Causality. New York and London: Methuen, 1987. [Google Scholar]
  3. Lukas Erne. “Shakespeare’s Edward III: An early play restored to the canon.” Archiv fur das Studium der Neueren Sprachen und Literaturen 236 (1999): 425–27. [Google Scholar]
  4. Richard Proudfoot. The Reign of King Edward the Third (1596) and Shakespeare. Charlottesville: University of Virginia Press, 1986. [Google Scholar]
  5. Karl Wentersdorf. “The Date of Edward III.” Shakespeare Quarterly 16 (1965): 227–31. [Google Scholar] [CrossRef]
  6. Scott McCrea. The Case for Shakespeare: The End of the Authorship Question. Santa Barbara: Praeger, 2005. [Google Scholar]
  7. David Kathman. “The Question of Authorship.” In Shakespeare: An Oxford Guide. Edited by Stanley Wells and Lena Cowen Orlin. Oxford: Oxford University Press, 2003, pp. 620–32. [Google Scholar]
  8. Jonathan Bate. The Genius of Shakespeare. Oxford: Oxford University Press, 1998. [Google Scholar]
  9. Gary Taylor. Reinventing Shakespeare: A Cultural History, from the Restoration to the Present. New York: Weidenfeld & Nicholson, 1989. [Google Scholar]
  10. Warren Hope, and Holston Kim. The Shakespeare Controversy: An Analysis of Authorship Theories, 2nd ed. Jefferson: McFarland & Co., Inc., 2009. [Google Scholar]
  11. Alan Nelson. “Stratford Si! Essex No! ” Tennessee Law Review (Tennessee Law Review Association) 72 (2004): 149–69. [Google Scholar]
  12. Diana Price. Shakespeare’s Unorthodox Biography: New Evidence of an Authorship Problem. Santa Barbara: Greenwood Press, 2001. [Google Scholar]
  13. Tom Bethell. “The Case for Oxford (and Reply).” Atlantic Monthly 268 (1991): 74–78. [Google Scholar]
  14. George L. McMichael, and Edgar M. Glenn. Shakespeare and His Rivals: A Casebook on the Authorship Controversy. Lewis Center: Odyssey Press, 1962. [Google Scholar]
  15. Gilbert Standen. Shakespeare Authorship: A Summary of Evidence, 1st ed. London: Cecil Palmer, 1930. [Google Scholar]
  16. James Shapiro. Contested Will. Who Wrote Shakespeare? New York: Simon and Schuster, 2010. [Google Scholar]
  17. Paul Edmondson, and Stanley Wells. Shakespeare beyond Doubt, 1st ed. Cambridge: Cambridge University Press, 2013. [Google Scholar]
  18. Harold Love. Authorship Attribution: An Introduction. Cambridge: Cambridge University Press, 2002. [Google Scholar]
  19. Marie Hamilton Law. The English Familiar Essay in the Early Nineteenth Century. New York: Russell & Russell, 1965. [Google Scholar]
  20. Albert Yang, Chung-Kang Peng, and Ary L. Goldberger. “The Marlowe-Shakespeare Authorship Debate: Approaching an Old Problem with New Methods.” Available online: http://www.psynetresearch.org/uploads/7/5/8/1/7581337/hoffman_essay.pdf (accessed on 22 June 2015).
  21. Stanley Wells. “Authorship Debate.” The Shakespeare Authorship Coalition. 2015. Available online: https://doubtaboutwill.org/letters_to_sbt_and_rsc/3 (accessed on 10 June 2015).
  22. Moshe Koppel, Jonathan Schler, and Shlomo Argamon. “Computational methods in authorship attribution.” Journal of American Society for Information and Technology 60 (2009): 9–26. [Google Scholar] [CrossRef]
  23. Efstathios Stamatatos. “Author identification: Using text sampling to handle the class imbalance problem.” Information Processing and Management 44 (2008): 790–99. [Google Scholar] [CrossRef]
  24. Patrick Juola. “Authorship attribution.” Foundations and Trends in Information Retrieval 1 (2006): 233–334. [Google Scholar] [CrossRef]
  25. Brandeis Library & Technology Services. “Digital Humanities: From 1851? ” Available online: https://blogs.brandeis.edu/lts/2013/05/17/digital-humanities-from-1851/ (accessed on 10 June 2015).
  26. Wincenty Lutosławski. Principes de stylométrie. Paris: Ernets Leroux, 1890. [Google Scholar]
  27. David Holmes. “Authorship attribution.” Computers and the Humanities 28 (1994): 87–106. [Google Scholar] [CrossRef]
  28. Jack Grieve. “Quantitative authorship attribution: A history and an evaluation of techniques.” Master’ Thesis, Simon Fraser University, Burnaby, Canada, 2005. [Google Scholar]
  29. Jack Grieve. “Quantitative authorship attribution: An evaluation of techniques.” Literary and linguistic Computing 22 (2007): 251–70. [Google Scholar] [CrossRef]
  30. Tony McEnery, and Michael Oakes. “Authorship identification and computational Stylometry.” In Handbook of Natural Language Processing. Edited by Robert Dale, Harold Somers and Hermann Moisl. New York: Marcel Dekker, Inc., 2000. [Google Scholar]
  31. David Holmes. “The Evolution of Stylometry in humanities scholarship.” Literary and Linguistic Computing 13 (1998): 111–17. [Google Scholar] [CrossRef]
  32. David Holmes. “A stylometric analysis of Mormon scripture and related texts.” Journal of the Royal Statistical Society Series A (Statistics in Society) 155 (1992): 91–120. [Google Scholar] [CrossRef]
  33. Hermann Moisl. Cluster Analysis for Corpus Linguistics. Berlin: De Gruyter Mouton, 2015. [Google Scholar]
  34. Brain Everitt, Sabine Landau, and Morven Leese. Cluster Analysis, 4th ed. London: Taylor & Francis, 2001. [Google Scholar]
  35. David Holmes. “Vocabulary richness and the prophetic voice.” Literary and Linguistic Computing 6 (1991): 259–68. [Google Scholar] [CrossRef]
  36. John Burrows. “Computers and the Study of Literature.” In Computers and Written Text. Edited by Christopher Butler. Oxford: Blackwell, 1992, pp. 167–204. [Google Scholar]
  37. David Holmes, and Robert Forsyth. “The Federalist Revisited: New directions in Authorship Attribution.” Literary and Linguistic Computing 10 (1995): 111–27. [Google Scholar] [CrossRef]
  38. Harald Baayen, Hans Van Halteren, and Fiona Tweedie. “Outside the cave of shadows: Using syntactic annotation to enhance authorship attribution.” Literary and Linguistic Computing 11 (1996): 121–32. [Google Scholar] [CrossRef]
  39. Thomas Merriam. “Marlowe’s hand in Edward III.” Literary and Linguistic Computing 8 (1996): 59–72. [Google Scholar] [CrossRef]
  40. Thomas Corwin Mendenhall. “The characteristic curves of composition.” Science 11 (1887): 237–49. [Google Scholar] [CrossRef] [PubMed]
  41. Thomas Corwin Mendenhall. “A mechanical solution to a literary problem.” Popular Science 9 (1901): 97–110. [Google Scholar]
  42. Eilot Slater. The Problem of the Reign of King Edward III: A Statistical Approach. Cambridge: Cambridge University Press, 1988. [Google Scholar]
  43. Neal Fox. “Statistical Stylometrics and the Marlowe-Shakespeare Authorship Debate.” 2012. Available online: http://cs.brown.edu/research/pubs/theses/masters/2012/ehmoda.pdf (accessed on 12 June 2015).
  44. Robert Matthews, and Thomas Merriam. “Neural computation in stylometry: An application to the works of Shakespeare and Fletcher.” Literary and Linguistic Computing 8 (1993): 203–9. [Google Scholar] [CrossRef]
  45. Hugh Craig, and Arthur Kinney. Shakespeare, Computers, and the Mystery of Authorship. Cambridge: Cambridge University Press, 2009. [Google Scholar]
  46. “The Shakespeare Authorship Page.” Available online: http://shakespeareauthorship.com/whyn-ot.html (accessed on 10 June 2015).
  47. Louise McConnell. Dictionary of Shakespeare. Teddington: Peter Collin Publishing Ltd., 2000. [Google Scholar]
  48. John Jowett, William MontGomery, Gary Taylor, and Stanley Wells. The Oxford Shakespeare: The Complete Works, 2nd ed. Edited by Stanley Wells and Gary Taylor. Oxford: Oxford University Press, 2005. [Google Scholar]
  49. Frank Romany, and Robert Lindsey. Christopher Marlowe: The Complete Plays. Belfast: Penguin Books Ltd., 2003. [Google Scholar]
  50. David Bevington, and Eric Rasmussen. Doctor Faustus and Other Plays Tamburlaine, Parts I and II; Doctor Faustus, A- and B-Texts; The Jew of Malta; Edward II. Christopher Marlowe. Oxford: Oxford World Classics, 2008. [Google Scholar]
  51. Arthur Henry Bullen. The Works of Francis Beaumont and John Fletcher, Vols. II & III. Edited by George Bell and Arthur Henry Bullen. Charleston: Forgotten Books, 1908. [Google Scholar]
  52. Frederick Boas. The Works of Thomas Kyd. Oxford: Clarendon Press, 1901. [Google Scholar]
  53. Maciej Eder. “Style-Markers in Authorship Attribution A Cross-Language Study of the Authorial Fingerprint.” Studies in Polish Linguistics 6 (2011): 99–114. [Google Scholar]
  54. Michael Anderberg. Cluster Analysis for Applications. London: Academic Press, 1973. [Google Scholar]
  55. Ragharendra Gadagkar. “Division of Labor and Organization of Work in the Primitively Eusocial Wasp Ropalidia Marginata.” Proceedings of the Indian National Science Academy-Part B: Biological Sciences 67 (2001): 397–42. [Google Scholar]
  56. Vaughan J. DeGhett. “Hierarchical cluster analysis.” In Quantitative Ethology. New York: John Wiley and Sons, 1978, pp. 115–44. [Google Scholar]
  57. Oscar Miguel Rivera-Borroto, Mónica Rabassa-Gutiérrez, Ricardo del Corazón Grau-Ábalo, Yovani Marrero-Ponce, and José Manuel García-de la Vega. “Dunn’s index for cluster tendency assessment of pharmacological data sets.” Canadian Journal Physiology Pharmacology 90 (2012): 425–33. [Google Scholar] [CrossRef] [PubMed]
  58. Anil K. Jain, and Richard C. Dubes. Algorithms for Clustering Data. Englewood Cliffs: Prentice-Hall, 1988. [Google Scholar]
  59. Teuvo Kohonen. Self-Organizing Maps, 3rd ed. Berlin: Springer, 2001. [Google Scholar]

