

Flextime/Flexspace for All in the Organization? A Study of the Availability, Use, and Consequences of Flexible Work Arrangements for Low and High SES Employees in Nine European Countries
Abstract
:1. Introduction
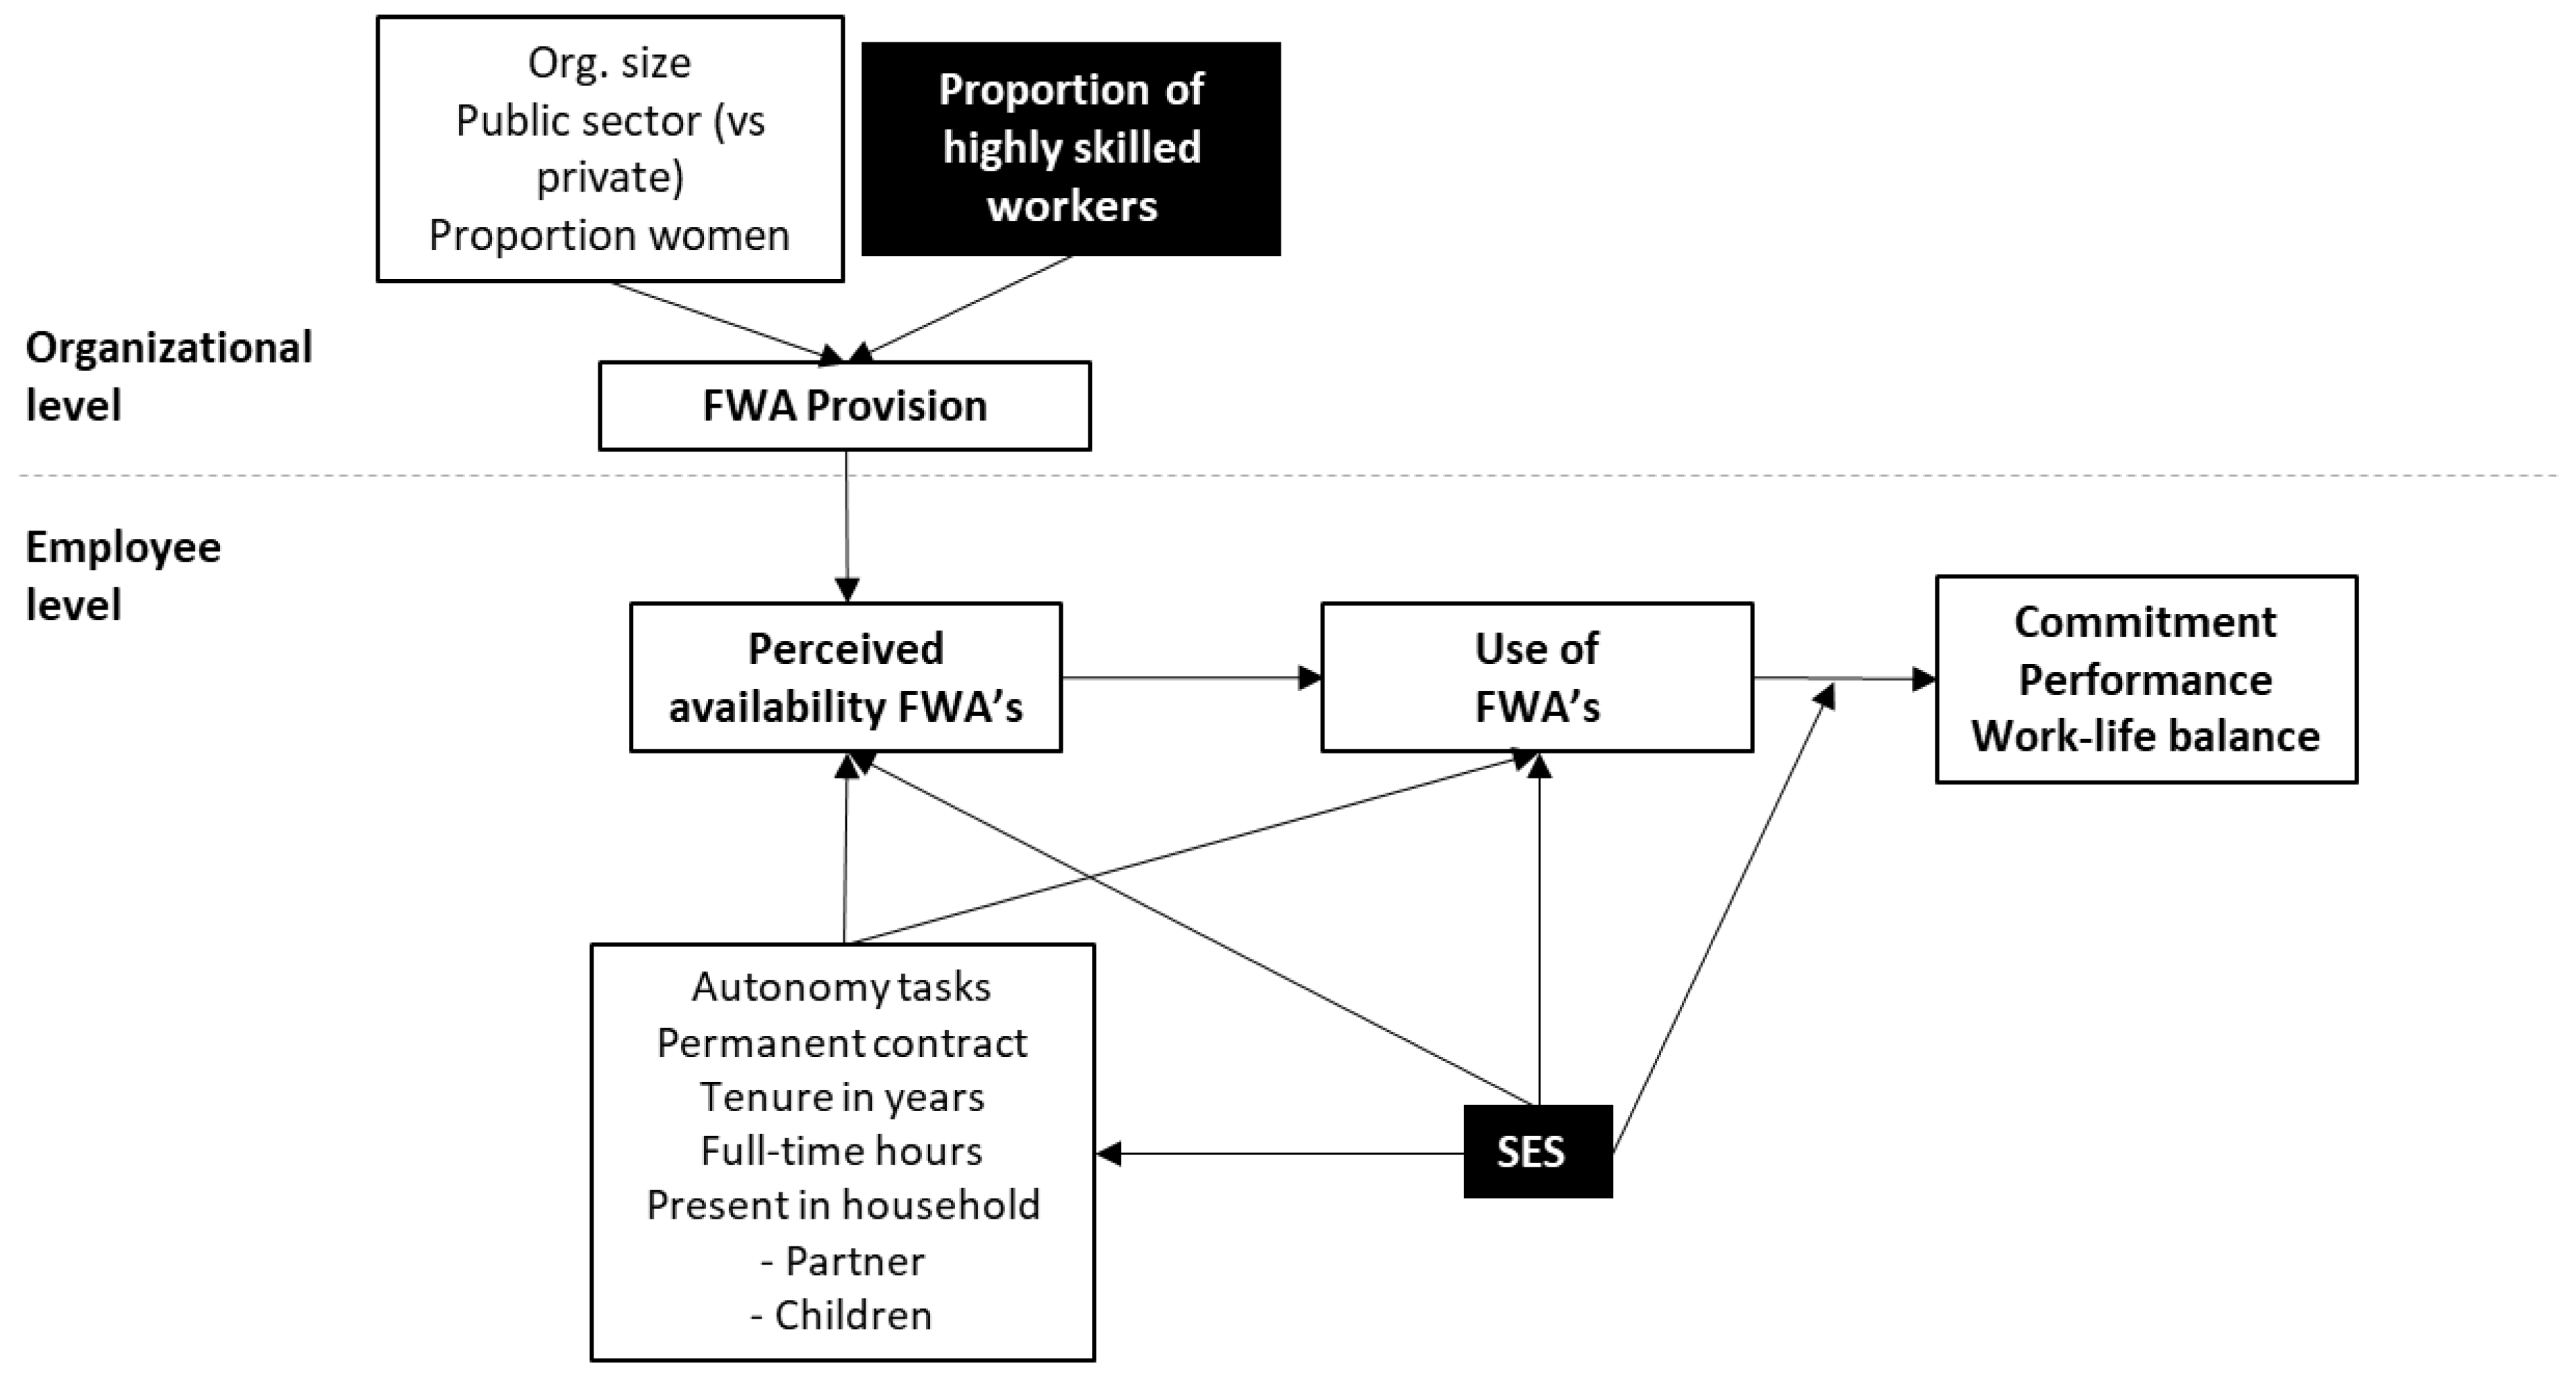
2. Theory
2.1. The Importance of SES for the Availability, Use, and Consequences of Flexible Work Arrangements
2.2. Availability of Flexible Work Arrangements
2.3. Use of Flexible Work Arrangements
2.4. Consequences of Using FWA for Performance, Commitment, and Work–Life Conflict
3. Material and Methods
3.1. Sample
3.2. Missing Values
3.3. Measures
3.4. Control Variables
3.5. Analytical Strategy
4. Results
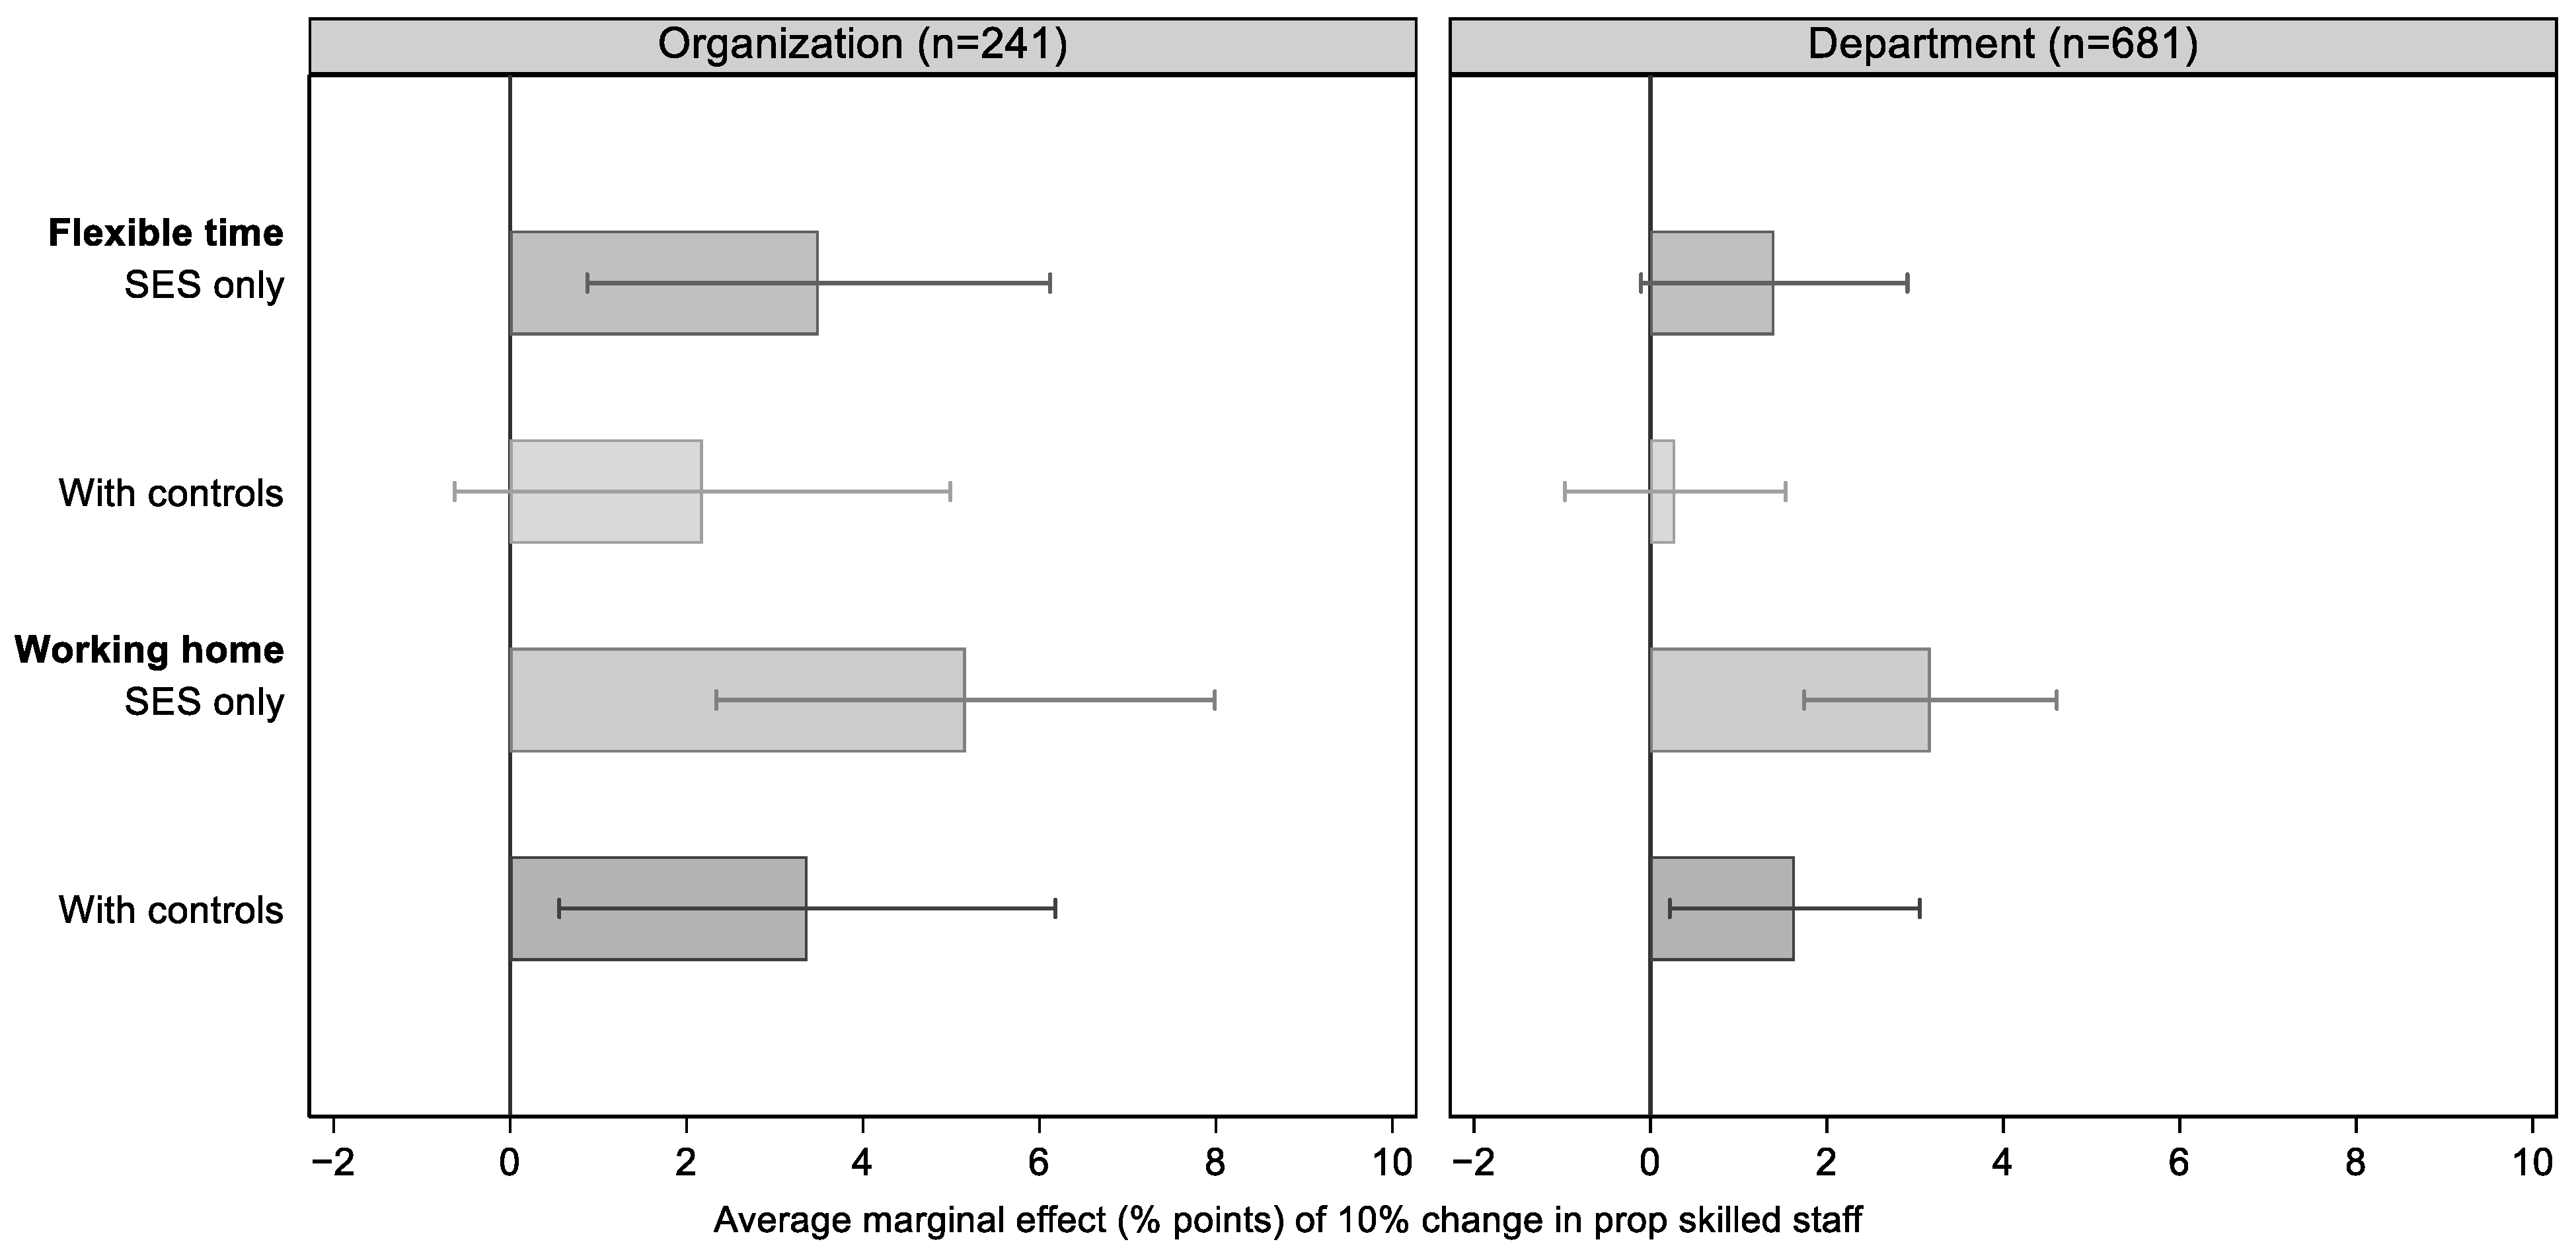
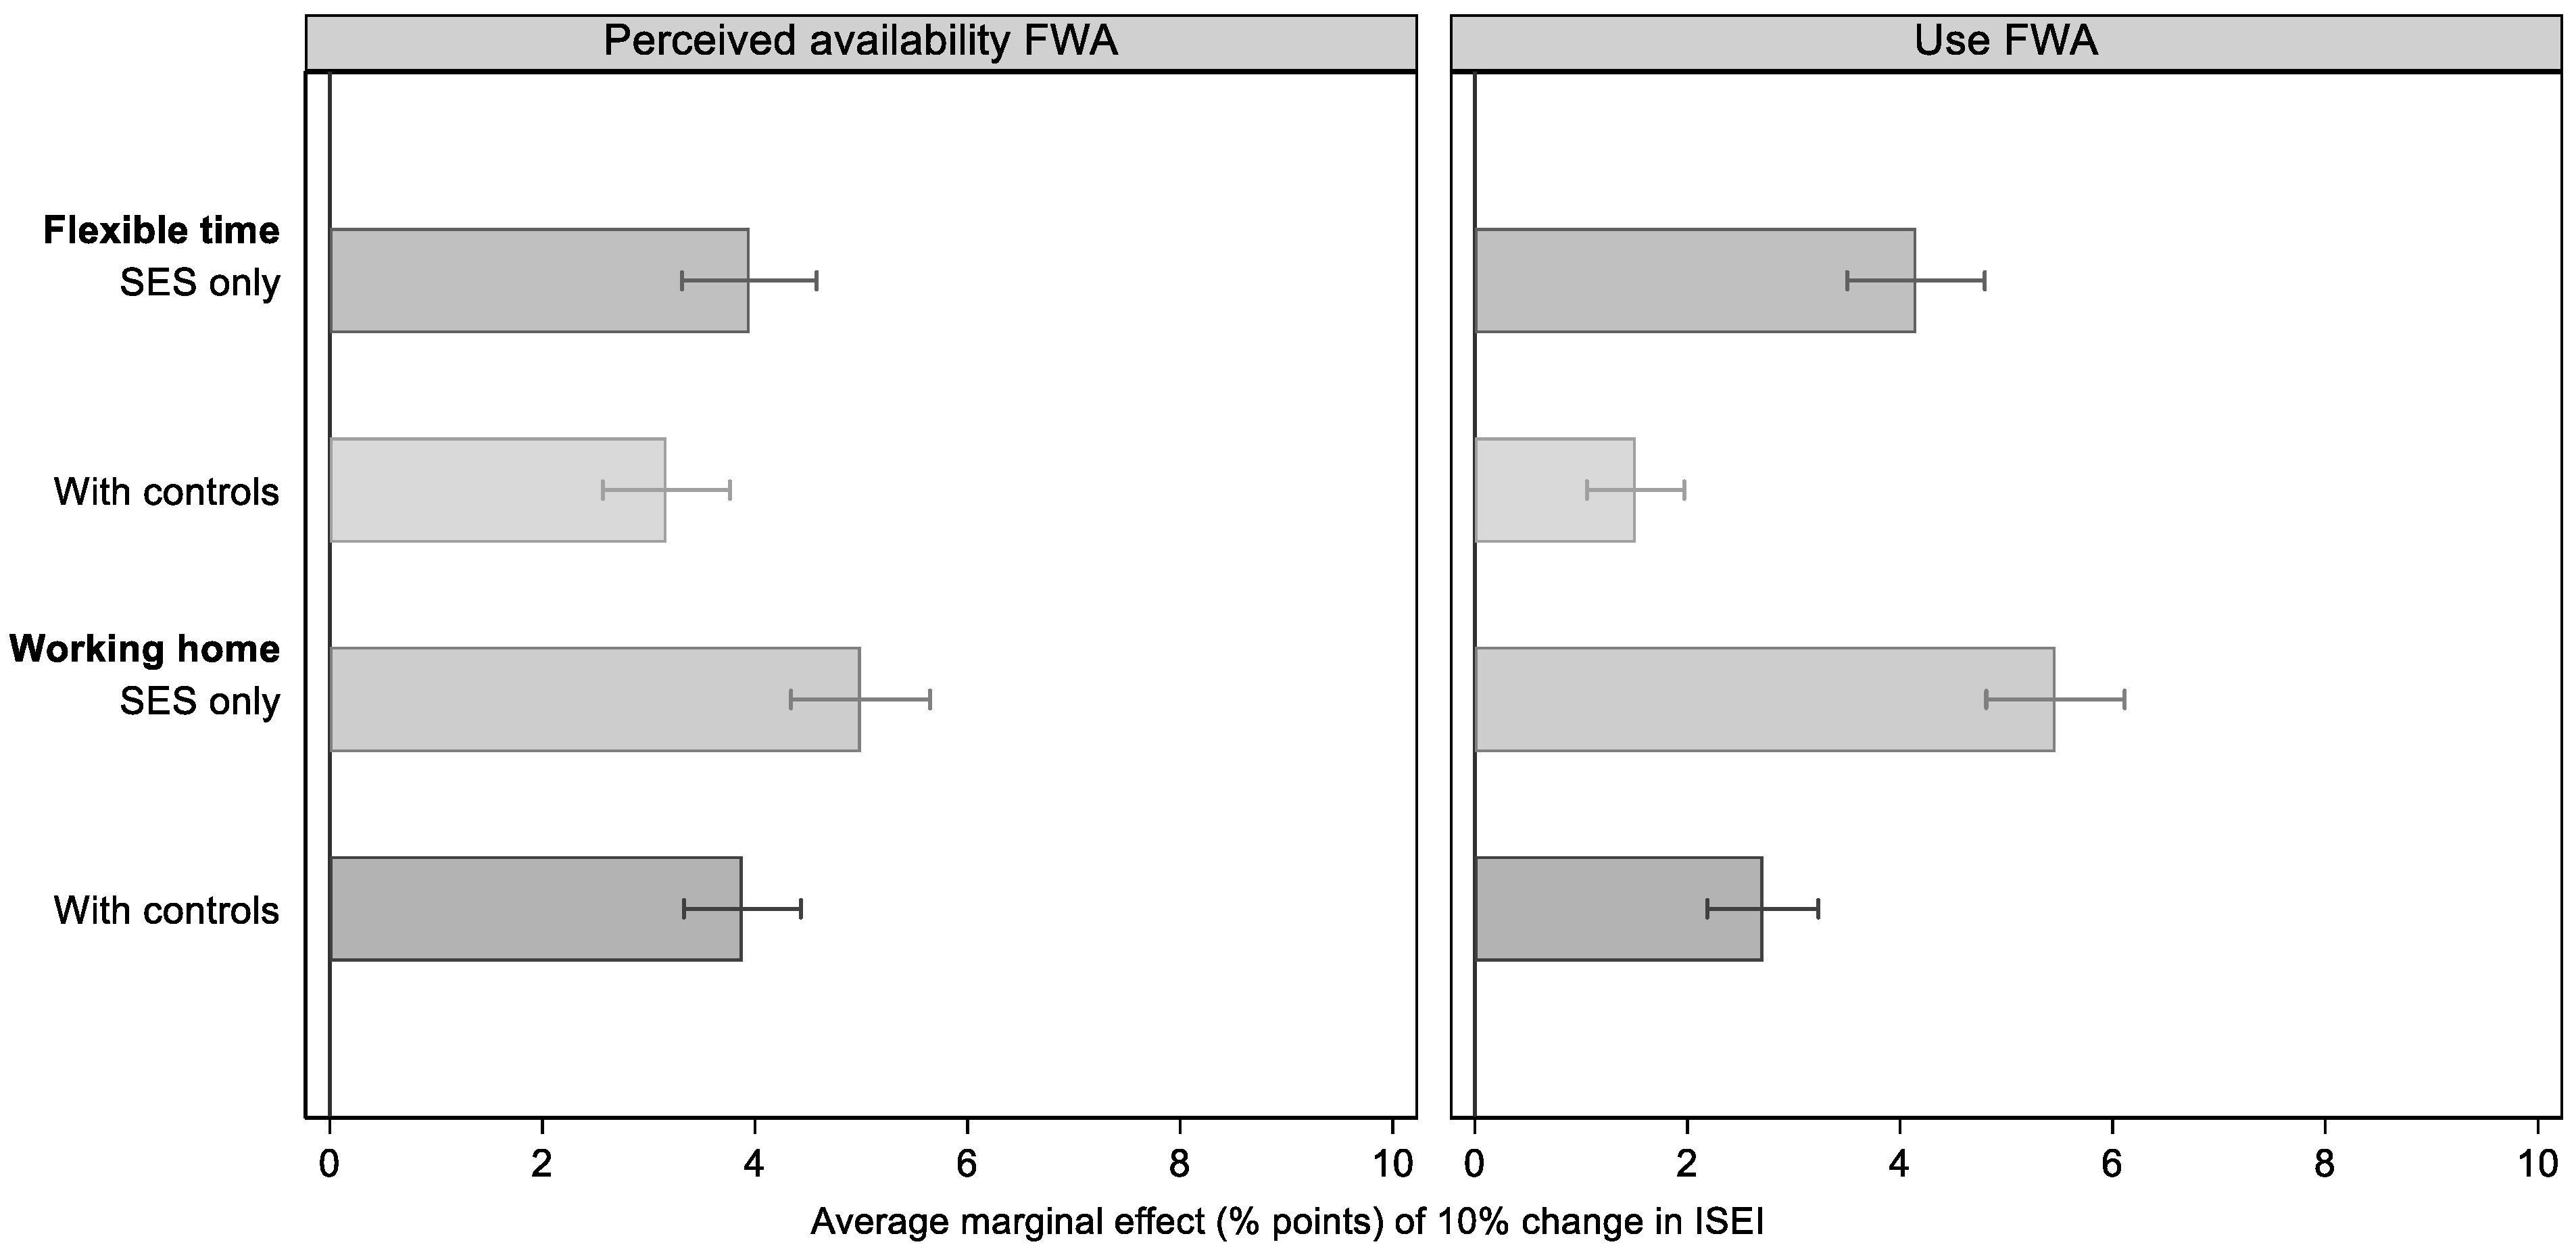
4.1. Hypothesis Testing
4.2. Robustness Checks
5. Conclusions and Discussion
Supplementary Materials
Author Contributions
Funding
Institutional Review Board Statement
Informed Consent Statement
Data Availability Statement
Conflicts of Interest
References
- Aczel, Balazs, Marton Kovacs, Tanja van der Lippe, and Barnabas Szaszi. 2021. Researchers working from home: Benefits and challenges. PLoS ONE 16: e0249127. [Google Scholar] [CrossRef] [PubMed]
- Agars, Mark D., and Kimberly A. French. 2016. Considering underrepresented populations in work-family research. In The Oxford Handbook of Work and Family. Edited by Tammy D. Allen and Lillian T. Eby. Oxford: Oxford University Press, pp. 362–75. [Google Scholar]
- Allen, Tammy D., Ryan C. Johnson, Kaitlin M. Kiburz, and Kristen M. Shockley. 2013. Work–family conflict and flexible work arrangements: Deconstructing flexibility. Personnel Psychology 66: 345–76. [Google Scholar] [CrossRef]
- Angle, Harold L., and James L. Perry. 1981. An Empirical Assessment of Organizational Commitment and Organizational Effectiveness. Administrative Science Quarterly 26: 1–14. [Google Scholar] [CrossRef]
- Beauregard, T. Alexandra, and Lesley C. Henry. 2009. Making the link between work-life balance practices and organizational performance. Human Resource Management Review 19: 9–22. [Google Scholar] [CrossRef]
- Bick, Alexander, Adam Blandin, and Karel Mertens. 2020. Work from Home After the COVID-19 Outbreak. Working Papers. Dallas: Federal Reserve Bank of Dallas. [Google Scholar]
- Blair-Loy, Mary, and Amy S. Wharton. 2002. Employees’ use of work-family policies and the workplace social context. Social Forces 80: 813–45. [Google Scholar] [CrossRef]
- Butts, Marcus M., Wendy J. Casper, and Tae S. Yang. 2013. How important are work–family support policies? A meta-analytic investigation of their effects on employee outcomes. Journal of Applied Psychology 98: 1–25. [Google Scholar] [CrossRef]
- Chung, Heejung. 2019. ‘Women’s work penalty’ in access to flexible working arrangements across Europe. European Journal of Industrial Relations 25: 23–40. [Google Scholar] [CrossRef]
- Chung, Heejung, and Cara Booker. 2022. Flexible Working and the Division of Housework and Childcare: Examining Divisions across Arrangement and Occupational Lines. Work, Employment and Society 37: 236–56. [Google Scholar] [CrossRef]
- Chung, Heejung, and Tanja van der Lippe. 2020. Flexible working, work–life balance, and gender equality: Introduction. Social Indicators Research 151: 365–81. [Google Scholar] [CrossRef]
- Clark, Andrew E., Ed Diener, Yannis Georgellis, and Richard E. Lucas. 2008. Lags and leads in life satisfaction: A test of the baseline hypothesis. The Economic Journal 118: F222–F243. [Google Scholar] [CrossRef]
- Cook, Rose, Margaret O’Brien, Sara Connolly, Matthew Aldrich, and Svetlana Speight. 2021. Fathers’ Perceptions of the Availability of Flexible Working Arrangements: Evidence from the UK. Work, Employment and Society 35: 1014–33. [Google Scholar] [CrossRef]
- Cooke, Lynn P. 2011. Gender-Class Equality in Political Economies. London: Routledge. [Google Scholar]
- De Haas, Mathijs, Roel Faber, and Marije Hamersma. 2020. How COVID-19 and the Dutch ‘intelligent lockdown’ change activities, work and travel behaviour: Evidence from longitudinal data in the Netherlands. Transportation Research Interdisciplinary Perspectives 6: 100150. [Google Scholar] [CrossRef] [PubMed]
- Den Dulk, Laura, Mara A. Yerkes, and Bram Peper. 2018. Work-family policies within the workplace. In Handbook of Family Policy. Edited by Guðný B. Eydal and Tine Rostgaard. Cheltenham: Edward Elgar Publishing, pp. 139–51. [Google Scholar]
- Den Dulk, Laura, Sandra Groeneveld, Ariane Ollier-Malaterre, and Monique Valcour. 2013. National context in work-life research: A multi-level cross-national analysis of the adoption of workplace work-life arrangements in Europe. European Management Journal 31: 478–94. [Google Scholar] [CrossRef]
- Dermott, Esther, and Caroline Gatrell, eds. 2018. Fathers, Families and Relationships: Researching Everyday Lives. Bristol: Policy Press. [Google Scholar]
- Doeringer, Peter B., and Michael J. Piore. 1985. Internal Labor Markets and Manpower Analysis. Armonk: ME Sharpe. [Google Scholar]
- Esping-Andersen, Gosta. 2009. Incomplete Revolution: Adapting Welfare States to Women’s New Roles. Cambridge: Polity. [Google Scholar]
- Eurofound. 2023. Living and Working in Europe 2022. Luxembourg: Publications Office of the European Union. [Google Scholar]
- Eurofound and International Labour Office. 2017. Working Anytime, Anywhere: The Effects on the World of Work. Luzembourg: Publications Office of the European Union. Geneva: The International Labour Office. [Google Scholar]
- Ewers, Michael, and Joseph Kangmennaang. 2023. New spaces of inequality with the rise of remote work: Autonomy, technostress, and life disruption. Applied Geography 152: 102888. [Google Scholar] [CrossRef]
- Fuller, Sylvia, and C. Elizabeth Hirsh. 2019. ‘Family-friendly’ jobs and motherhood pay penalties: The impact of flexible work arrangements across the educational spectrum. Work and Occupations 46: 3–44. [Google Scholar] [CrossRef]
- Gajendran, Ravi S., and David A. Harrison. 2007. The good, the bad, and the unknown about telecommuting: Meta-analysis of psychological mediators an individual consequence. Journal of Applied Psychology 92: 1524–41. [Google Scholar] [CrossRef]
- Ganzeboom, Harry B. G. 2010. A New International Socio-Economic Index (ISEI) of Occupational Status for the International Standard Classification of Occupation 2008 (ISCO 08). Constructed with Data from the ISSP 2002–2007. Paper presented at Annual Conference of International Social. Available online: https://www.researchgate.net/publication/337181193 (accessed on 15 September 2017).
- Ganzeboom, Harry B. G., Paul M. De Graaf, and Donald J. Treiman. 1992. A standard international socio-economic index of occupational status. Social Science Research 21: 1–56. [Google Scholar] [CrossRef]
- Geurts, Sabine, Toon W. Taris, Michiel A. J. Kompier, Josje S. E. Dikkers, Madelon L. M. van Hooff, and Ulla M. Kinnunen. 2005. Work-home interaction from a work psychological perspective: Development and validation of a new questionnaire, the SWING. Work & Stress 19: 319–39. [Google Scholar]
- Golden, Lonnie. 2009. Flexible work schedules. Which workers get them? Journal of Family and Economic Issues 29: 86–109. [Google Scholar] [CrossRef]
- Gouldner, Alvin W. 1960. The norm of reciprocity: A preliminary statement. American Sociological Review 25: 161–78. [Google Scholar] [CrossRef]
- Guerci, Marco, Sven Hauff, Nazareno Panichella, and Giovanni Radaelli. 2023. Sustainable HRM and class-based inequality. Personnel Review 52: 1597–613. [Google Scholar] [CrossRef]
- Hammer, Leslie B., Sarah E. Van Dyck, and Allison M. Ellis. 2013. Organizational policies supportive of work–life integration. In Handbook of Work-Life Integration among Professionals: Challenges and Opportunities. Edited by Debra A. Major and Ronald J. Burke. Cheltenham: Edward Elgar Publishing, pp. 288–309. [Google Scholar]
- Hobson, Barbara. 2014. Introduction: Capabilities and agency for worklife balance: A multi-dimensional framework. In Worklife Balance: The Agency and Capabilities Gap. Edited by Barbara Hobson. Oxford: Oxford University Press. [Google Scholar]
- Jackson, Susan E., Randall S. Schuler, and Kaifeng Jiang. 2014. An aspirational framework for strategic human resource management. The Academy of Management Annals 8: 1–56. [Google Scholar] [CrossRef]
- Kalleberg, Arne L. 2009. Precarious work, insecure workers: Employment relations in transition. American Sociological Review 74: 1–22. [Google Scholar] [CrossRef]
- Kelliher, Clare, and Deirdre Anderson. 2010. Doing more with less? Flexible working practices and the intensification of work. Human Relations 63: 83–106. [Google Scholar] [CrossRef]
- Kelliher, Clare, and Lilian M. de Menezes. 2019. Flexible Working in Organisations: A Research Overview. London: Routledge. [Google Scholar]
- Kelly, Erin L., Ellen E. Kossek, Leslie B. Hammer, Mary Durham, Jeremy Bray, Kelly Chermack, Lauren A. Murphy, and Dan Kaskubar. 2008. Getting There from Here: Research on the Effects of Work–Family Initiatives on Work–Family Conflict and Business Outcomes. Academy of Management Annals 2: 305–49. [Google Scholar] [CrossRef]
- Kirby, Erika, and Kathleen Krone. 2002. ‘The policy exists but you can’t really use it’: Communication and the structuration of work-family policies. Journal of Applied Communication Research 30: 50–77. [Google Scholar] [CrossRef]
- Koopmans, Linda, Claire M. Bernaards, Vincent H. Hildebrandt, Henrica C. W. de Vet, and Allard J. van der Beek. 2014. Construct validity of the individual work performance questionnaire. Journal of Occupational and Environmental Medicine 56: 331–37. [Google Scholar] [CrossRef]
- Korpi, Walter, Tommy Ferrarini, and Stefan Englund. 2013. Women’s opportunities under different family policy constellations: Gender, class, and inequality tradeoffs in western countries re-examined. Social Politics: International Studies in Gender, State & Society 20: 1–40. [Google Scholar]
- Kossek, Ellen E., Susan Lewis, and Lesley B. Hammer. 2010. Work-life initiatives and organizational change: Overcoming mixed messages to move from the margin to the mainstream. Human Relations 63: 3–19. [Google Scholar] [CrossRef]
- Lambert, Susan J. 2009. Lessons from the policy world: How the economy, work supports, and education matter for low-income workers. Work and Occupations 36: 56–65. [Google Scholar] [CrossRef]
- Lewis, Suzan. 1997. ‘Family friendly’ employment policies: A route to changing organizational culture or playing about at the margins? Gender, Work & Organization 4: 13–23. [Google Scholar]
- Lind, E. Allan, and Tom R. Tyler. 1988. The Social Psychology of Procedural Justice. Berlin: Springer Science & Business Media. [Google Scholar]
- Mandel, Hadas, and Moshe Semyonov. 2006. A welfare state paradox: State interventions and women’s employment opportunities in 22 countries. American Journal of Sociology 111: 1910–49. [Google Scholar] [CrossRef]
- OECD. 2017. Understanding the Socio-Economic Divide in Europe: Background Report [Background Paper]. Workshop: Understanding the Socio-Economic Divide in Europe. Paris: OECD Headquarters. Available online: https://www.oecd.org/els/soc/cope-divide-europe-2017-background-report.pdf (accessed on 1 January 2019).
- Ollier-Malaterre, Ariane, and Cláudia Andrade. 2016. Not for everyone: Intra-organisational divides and the stratification of access to work–life policies. Community, Work & Family 19: 519–37. [Google Scholar]
- Osterman, Paul. 1994. How common is workplace transformation and who adopts it? ILR Review 47: 173–88. [Google Scholar] [CrossRef]
- Payne, Holly J. 2007. The role of organization-based self-esteem in employee dissent expression. Communication Research Reports 24: 235–40. [Google Scholar] [CrossRef]
- Pfeffer, Jeffrey. 1997. New Directions for Organization Theory: Problems and Prospects. Oxford: Oxford University Press on Demand. [Google Scholar]
- Riva, Egidio, Mario Lucchini, Laura den Dulk, and Ariane Ollier-Malaterre. 2018. The skill profile of employees and the provision of flexible working hours in the workplace: A multilevel analysis across European countries. Industrial relations Journal 49: 128–152. [Google Scholar] [CrossRef]
- Robeyns, Ingrid. 2017. Wellbeing, Freedom and Social Justice: The Capability Approach Re-Examined. Cambridge: Open Book Publishers. [Google Scholar]
- Savić, Dobrica. 2020. COVID-19 and work from home: Digital transformation of the workforce. Grey Journal (TGJ) 16: 101–4. [Google Scholar]
- Schmidt, Joseph A., Dionne Pohler, and Chelsea R. Willness. 2018. Strategic HR system differentiation between jobs: The effects on firm performance and employee outcomes. Human Resource Management 57: 65–81. [Google Scholar] [CrossRef]
- Spence, Michael. 1973. Job market signaling. Quarterly Journal of Economics 87: 355–74. [Google Scholar] [CrossRef]
- Swanberg, Jennifer E., Marcie Pitt-Catsouphes, and Krista Drescher-Burke. 2005. A question of justice: Disparities in employees’ access to flexible schedule arrangements. Journal of Family Issues 26: 866–95. [Google Scholar] [CrossRef]
- Sweet, Stephen, Elyssa Besen, Marcie Pitt-Catsouphes, and Tay K. McNamara. 2014. Do options for job flexibility diminish in times of economic uncertainty? Work, Employment & Society 28: 882–903. [Google Scholar]
- Ter Hoeven, Claartje L., and Ward Van Zoonen. 2023. Helping others and feeling engaged in the context of workplace flexibility: The importance of communication control. International Journal of Business Communication 60: 62–83. [Google Scholar] [CrossRef]
- Thébaud, Sarah, and David S. Pedulla. 2022. When Do Work-Family Policies Work? Unpacking the Effects of Stigma and Financial Costs for Men and Women. Work and Occupations 49: 229–63. [Google Scholar] [CrossRef]
- Van der Lippe, Tanja, and Zoltán Lippényi. 2018. Beyond formal access: Organizational context, working from home, and work–family conflict of men and women in European workplaces. Social Indicators Research 151: 383–402. [Google Scholar] [CrossRef] [PubMed]
- Van der Lippe, Tanja, and Zoltán Lippényi, eds. 2019. Investments in a Sustainable Workforce in Europe. London: Routledge. [Google Scholar]
- Van der Lippe, Tanja, Zoltán Lippényi, Jelle Lössbroek, Leonie Van Breeschoten, Nikki van Gerwen, and Thomas Martens. 2016. European Sustainable Workforce Survey [ESWS]. Utrecht: Utrecht University. [Google Scholar]
- Van Jaarsveld, Danielle D., Hyunji Kwon, and Ann C. Frost. 2009. The effects of institutional and organizational characteristics on work force flexibility: Evidence from call centers in three liberal market economies. ILR Review 62: 573–601. [Google Scholar] [CrossRef]
- Yang, Duanyi, Erin L. Kelly, Laura D. Kubzansky, and Lisa Berkman. 2023. Working from home and worker well-being: New evidence from Germany. ILR Review 76: 504. [Google Scholar] [CrossRef]


| Mean | SD | Min | Max | Cases (%) Imputed a | ||
|---|---|---|---|---|---|---|
| FWA employee level | Flexible work times available | 0.46 | 0 | 1 | Na | |
| Working from home available | 0.29 | 0 | 1 | Na | ||
| Flexible work times used | 0.42 | 0 | 1 | Na | ||
| Working from home used | 0.28 | 0 | 1 | Na | ||
| FWA organizational level | Flexible times org level available | 0.73 | 0 | 1 | Na | |
| Flexible times team level available | 0.63 | 0 | 1 | Na | ||
| Working home org level available | 0.51 | 0 | 1 | Na | ||
| Working home team level available | 0.37 | 0 | 1 | Na | ||
| Consequences FWA employee level | Task performance | 3.77 | 0.78 | 1 | 5 | Na |
| Organizational commitment | 3.80 | 0.76 | 1 | 5 | Na | |
| Work–life conflict | 2.35 | 0.96 | 1 | 5 | Na | |
| Individual level control variables | Socio-economic status (ISEI) | 56.03 | 19.03 | 1 | 89 | 568 (5.6) |
| Female | 0.56 | 0 | 1 | 0 | ||
| Age at interview | 42.12 | 10.89 | 18 | 65 | 0 | |
| Child(ren) < 18 in household | 0.50 | 0 | 1 | 194 (1.9) | ||
| Age youngest child | 10.35 | 5.10 | 0 | 26 | 252 (2.5) | |
| Married or cohabiting | 0.74 | 0 | 1 | 75 (0.7) | ||
| Autonomy | 3.76 | 0.83 | 1 | 5 | 29 (0.3) | |
| Work hours | 39.47 | 9.58 | 0 | 70 | 363 (3.6) | |
| Tenure | 10.76 | 9.89 | 0 | 55 | 54 (0.5) | |
| Permanent contract | 0.88 | 0 | 1 | 40 (0.4) | ||
| Organizational level control variables | Proportion of (highly)skilled workers in organization | 5.16 | 2.03 | 1 | 9 | Na |
| Proportion of (highly)skilled workers in team | 5.44 | 2.62 | 1 | 9 | Na | |
| Organizational size (log) | 5.56 | 1.42 | 2 | 9 | Na | |
| Public sector: yes | 0.36 | 0 | 1 | Na | ||
| Share women in organization | 5.02 | 1.46 | 1 | 9 | Na | |
| Manufacturing | 0.23 | 0 | 1 | 0 | ||
| Health Care | 0.25 | 0 | 1 | 0 | ||
| Higher Education | 0.17 | 0 | 1 | 0 | ||
| Transportation | 0.13 | 0 | 1 | 0 | ||
| Financial Services | 0.12 | 0 | 1 | 0 | ||
| Telecommunication | 0.09 | 0 | 1 | 0 | ||
| Bulgaria | 0.07 | 0 | 1 | 0 | ||
| Finland | 0.09 | 0 | 1 | 0 | ||
| Germany | 0.07 | 0 | 1 | 0 | ||
| Hungary | 0.10 | 0 | 1 | 0 | ||
| Netherlands | 0.22 | 0 | 1 | 0 | ||
| Portugal | 0.11 | 0 | 1 | 0 | ||
| Spain | 0.08 | 0 | 1 | 0 | ||
| Sweden | 0.12 | 0 | 1 | 0 | ||
| UK | 0.13 | 0 | 1 | 0 |
| Organizational Level | Department Level a | |||||||
|---|---|---|---|---|---|---|---|---|
| Flexible Times | Working Home | Flexible Times | Working Home | |||||
| Proportion highly skilled | 1.15 | 1.21 | * | 1.02 | 1.09 | * | ||
| workers | (1.50) | (2.26) | (0.44) | (2.27) | ||||
| Org. size (log) | 0.98 | 1.04 | 1.13 | 1.07 | ||||
| (−0.16) | (0.30) | (1.44) | (0.66) | |||||
| Public sector org. | 1.30 | 0.93 | 0.80 | 0.88 | ||||
| (0.52) | (−0.17) | (−0.68) | (−0.40) | |||||
| % Women in organization | 0.97 | 1.27 | 0.92 | 1.11 | ||||
| (−0.21) | (1.58) | (−0.75) | (1.11) | |||||
| Sector: Manufacturing (ref) | ||||||||
| Health care | 0.34 | + | 0.43 | 0.61 | 0.41 | + | ||
| (−1.72) | (−1.32) | (−1.01) | (−1.79) | |||||
| Higher education | 1.96 | 2.23 | 7.10 | ** | 2.74 | * | ||
| (0.95) | (1.30) | (4.32) | (2.52) | |||||
| Transportation | 1.29 | 2.19 | 1.66 | 0.88 | ||||
| (0.48) | (1.63) | (1.54) | (−0.35) | |||||
| Financial services | 1.18 | 1.09 | 1.77 | 1.12 | ||||
| (0.29) | (0.16) | (1.57) | (0.33) | |||||
| Telecommunication | 3.12 | + | 10.93 | ** | 4.00 | ** | 6.27 | ** |
| (1.68) | (3.71) | (3.05) | (4.36) | |||||
| Country: Netherlands (ref) | ||||||||
| United Kingdom | 0.28 | + | 2.70 | 0.22 | ** | 0.60 | ||
| (−1.73) | (1.26) | (−3.07) | (−1.35) | |||||
| Germany | 0.63 | 0.60 | 0.86 | 0.54 | ||||
| (−0.62) | (−0.89) | (−0.40) | (−1.63) | |||||
| Finland | 8.44 | 4.48 | + | 1.24 | 1.77 | |||
| (1.37) | (1.91) | (0.38) | (1.40) | |||||
| Sweden | 0.77 | 0.43 | 1.21 | 0.64 | ||||
| (−0.36) | (−1.59) | (0.39) | (−1.08) | |||||
| Portugal | 0.32 | + | 0.46 | 0.22 | ** | 0.21 | ** | |
| (−1.66) | (−1.28) | (−3.21) | (−3.54) | |||||
| Spain | 0.24 | * | 0.16 | ** | 0.21 | ** | 0.27 | * |
| (−2.12) | (−2.96) | (−3.70) | (−2.52) | |||||
| Hungary | 0.27 | + | 0.38 | 0.31 | ** | 0.48 | + | |
| (−1.94) | (−1.61) | (−2.78) | (−1.82) | |||||
| Bulgaria | 0.12 | ** | 0.08 | ** | 0.12 | ** | 0.15 | ** |
| (−3.39) | (−4.07) | (−5.38) | (−4.58) | |||||
| N | 241 | 241 | 681 | 681 | ||||
| Perceived Availability of | Reported Use of | |||||||||||
|---|---|---|---|---|---|---|---|---|---|---|---|---|
| Flexible Times | Working Home | Flexible Times | Working Home | |||||||||
| ISEI (/10) | 1.26 | ** | (10.37) | 1.44 | ** | (13.87) | 1.27 | ** | (10.10) | 1.17 | ** | (6.40) |
| Female respondent | 0.94 | (−0.86) | 0.96 | (−0.48) | 0.91 | (−1.39) | 0.85 | * | (−2.02) | |||
| Age at interview | 1.00 | (−0.43) | 1.01 | (1.39) | 0.99 | (−1.50) | 1.00 | (−0.58) | ||||
| Children <18 in household | 1.10 | (1.44) | 1.37 | ** | (4.30) | 1.53 | ** | (6.18) | 1.16 | * | (2.02) | |
| Age of youngest child in household | 0.99 | * | (−2.08) | 0.98 | ** | (−3.17) | 0.99 | (−1.34) | 0.99 | (−1.47) | ||
| Partner in household | 1.06 | (0.77) | 1.13 | (1.49) | 1.28 | ** | (3.11) | 0.88 | (−1.51) | |||
| Autonomy in work tasks | 1.96 | ** | (16.31) | 1.88 | ** | (12.46) | 1.20 | ** | (4.15) | 1.51 | ** | (8.59) |
| Work hours (week) | 1.01 | ** | (3.49) | 1.03 | ** | (5.91) | 1.02 | ** | (5.82) | 1.02 | ** | (5.52) |
| Tenure (in years) | 1.00 | (1.03) | 1.01 | * | (2.17) | 0.99 | + | (−1.65) | 0.99 | + | (−1.78) | |
| Permanent contract | 1.05 | (0.45) | 1.05 | (0.40) | 0.80 | + | (−1.85) | 1.17 | (1.24) | |||
| Log. of org. size | 1.03 | (0.49) | 1.04 | (0.61) | 0.95 | (−1.09) | 1.01 | (0.14) | ||||
| Public sector | 1.47 | + | (1.74) | 0.89 | (−0.52) | 0.89 | (−0.68) | 1.24 | (1.39) | |||
| % Women in organization | 1.05 | (0.71) | 0.98 | (−0.26) | 1.00 | (−0.03) | 1.04 | (0.76) | ||||
| Sector: Manufacturing | ref | ref | ref | ref | ||||||||
| Health Care | 0.22 | ** | (−5.32) | 0.21 | ** | (−4.93) | 1.11 | (0.47) | 0.47 | ** | (−3.75) | |
| Higher Education | 1.37 | (1.11) | 2.35 | ** | (2.86) | 2.30 | ** | (3.82) | 1.13 | (0.61) | ||
| Transportation | 0.85 | (−0.63) | 0.79 | (−0.84) | 1.32 | (1.41) | 0.83 | (−1.10) | ||||
| Financial Services | 1.04 | (0.16) | 1.14 | (0.46) | 1.10 | (0.47) | 1.06 | (0.33) | ||||
| Telecommunication | 2.48 | ** | (3.15) | 3.67 | ** | (4.42) | 1.36 | (1.42) | 1.58 | * | (2.29) | |
| Country: Netherlands | ref | ref | ref | ref | ||||||||
| UK | 0.44 | * | (−2.48) | 0.28 | ** | (−3.59) | 0.73 | (−1.23) | 0.68 | + | (−1.72) | |
| Germany | 1.78 | + | (1.90) | 0.37 | ** | (−3.19) | 0.62 | * | (−2.10) | 1.54 | * | (2.08) |
| Finland | 2.42 | ** | (2.68) | 1.47 | (1.14) | 1.19 | (0.72) | 3.62 | ** | (5.39) | ||
| Sweden | 1.50 | (1.41) | 0.66 | (−1.42) | 0.90 | (−0.51) | 1.85 | ** | (3.06) | |||
| Portugal | 0.37 | ** | (−3.23) | 0.20 | ** | (−4.83) | 0.73 | (−1.33) | 0.54 | ** | (−2.87) | |
| Spain | 0.65 | (−1.34) | 0.07 | ** | (−7.16) | 0.62 | + | (−1.95) | 0.41 | ** | (−4.18) | |
| Hungary | 0.54 | * | (−2.11) | 0.20 | ** | (−5.13) | 0.72 | (−1.44) | 0.43 | ** | (−4.26) | |
| Bulgaria | 0.12 | ** | (−7.44) | 0.12 | ** | (−6.96) | 0.63 | * | (−2.14) | 0.45 | ** | (−3.96) |
| Prop. skilled org | 1.04 | (0.76) | 1.15 | ** | (2.84) | 1.02 | (0.47) | 1.04 | (1.16) | |||
| Prop. skilled team | 1.03 | (1.30) | 1.02 | (0.72) | 1.02 | (0.81) | 1.02 | (1.19) | ||||
| Flex times available team | 2.93 | ** | (6.66) | 1.10 | (0.53) | 1.02 | (0.15) | 1.92 | ** | (5.20) | ||
| Work home available team | 1.50 | * | (2.56) | 3.95 | ** | (7.99) | 1.47 | ** | (3.24) | 1.00 | (0.03) | |
| Flex times available org | 1.85 | ** | (2.87) | 0.87 | (−0.60) | 0.87 | (−0.86) | 1.27 | (1.58) | |||
| Work home available org | 0.73 | (−1.62) | 1.15 | (0.68) | 0.92 | (−0.55) | 0.97 | (−0.24) | ||||
| Org level missing | 1.76 | (1.64) | 1.34 | (0.78) | 0.69 | (−1.37) | 1.09 | (0.35) | ||||
| Team level missing | 2.10 | * | (2.30) | 2.12 | * | (2.14) | 1.79 | * | (2.32) | 1.77 | * | (2.35) |
| Work home not available | na | na | 0.08 | ** | (−32.38) | |||||||
| Flex times not available | na | na | 0.03 | ** | (−44.17) | |||||||
| N | 10,098 | 10,098 | 10,098 | 10,098 | ||||||||
| Contextual Performance | Commitment | Work–Life Conflict | ||||||||||
|---|---|---|---|---|---|---|---|---|---|---|---|---|
| Flexible Times | Working Home | Flexible Times | Working Home | Flexible Times | Working Home | |||||||
| SES (/10) | 0.04 | ** | 0.04 | ** | −0.00 | 0.00 | 0.02 | ** | 0.01 | + | ||
| (0.01) | (0.01) | (0.01) | (0.01) | (0.01) | (0.01) | |||||||
| Use FWA | 0.10 | ** | 0.17 | ** | 0.03 | + | 0.02 | −0.00 | 0.16 | ** | ||
| (0.02) | (0.02) | (0.02) | (0.02) | (0.02) | (0.02) | |||||||
| SES * Use FWA | −0.01 | −0.02 | * | 0.00 | −0.02 | + | 0.00 | 0.01 | ||||
| (0.01) | (0.01) | (0.01) | (0.01) | (0.01) | (0.01) | |||||||
| Female respondent | 0.02 | 0.02 | −0.00 | −0.01 | 0.10 | ** | 0.10 | ** | ||||
| (0.02) | (0.02) | (0.02) | (0.02) | (0.02) | (0.02) | |||||||
| Age at interview | −0.01 | ** | −0.01 | ** | 0.00 | ** | 0.00 | ** | −0.00 | −0.00 | ||
| (0.00) | (0.00) | (0.00) | (0.00) | (0.00) | (0.00) | |||||||
| Children <18 in household | 0.02 | 0.02 | 0.04 | * | 0.04 | * | 0.07 | ** | 0.06 | ** | ||
| (0.02) | (0.02) | (0.01) | (0.01) | (0.02) | (0.02) | |||||||
| Age of youngest child in household | 0.00 | ** | 0.01 | ** | 0.00 | * | 0.00 | * | −0.00 | + | −0.00 | |
| (0.00) | (0.00) | (0.00) | (0.00) | (0.00) | (0.00) | |||||||
| Partner in household | 0.06 | ** | 0.05 | * | −0.00 | −0.00 | 0.07 | ** | 0.07 | ** | ||
| (0.02) | (0.02) | (0.02) | (0.02) | (0.02) | (0.02) | |||||||
| Autonomy in work tasks | 0.35 | ** | 0.35 | ** | 0.24 | ** | 0.24 | ** | −0.17 | ** | −0.18 | ** |
| (0.01) | (0.01) | (0.01) | (0.01) | (0.01) | (0.01) | |||||||
| Work hours (week) | 0.01 | ** | 0.01 | ** | 0.00 | + | 0.00 | + | 0.02 | ** | 0.02 | ** |
| (0.00) | (0.00) | (0.00) | (0.00) | (0.00) | (0.00) | |||||||
| Tenure (in years) | −0.00 | −0.00 | −0.00 | ** | −0.00 | ** | 0.00 | 0.00 | ||||
| (0.00) | (0.00) | (0.00) | (0.00) | (0.00) | (0.00) | |||||||
| Temporary contract | 0.02 | 0.02 | 0.07 | ** | 0.07 | ** | −0.07 | * | −0.07 | * | ||
| (0.03) | (0.03) | (0.03) | (0.03) | (0.03) | (0.03) | |||||||
| Org. size (log) | 0.02 | + | 0.02 | + | 0.02 | 0.02 | 0.00 | 0.00 | ||||
| (0.01) | (0.01) | (0.01) | (0.01) | (0.01) | (0.01) | |||||||
| Public sector org. | −0.02 | −0.01 | −0.07 | −0.07 | −0.09 | + | −0.08 | + | ||||
| (0.04) | (0.04) | (0.05) | (0.05) | (0.05) | (0.05) | |||||||
| % Women in organization | −0.01 | −0.01 | 0.00 | 0.00 | −0.00 | −0.00 | ||||||
| (0.01) | (0.01) | (0.01) | (0.01) | (0.02) | (0.02) | |||||||
| Sector: Manufacturing (ref) | ||||||||||||
| Health care | 0.06 | 0.05 | −0.09 | −0.10 | 0.12 | + | 0.13 | * | ||||
| (0.05) | (0.05) | (0.06) | (0.06) | (0.06) | (0.06) | |||||||
| Higher education | 0.06 | 0.04 | −0.06 | −0.05 | 0.13 | * | 0.10 | |||||
| (0.05) | (0.05) | (0.07) | (0.07) | (0.07) | (0.06) | |||||||
| Transportation | −0.10 | * | −0.11 | * | −0.04 | −0.04 | −0.01 | −0.02 | ||||
| (0.04) | (0.04) | (0.06) | (0.06) | (0.06) | (0.06) | |||||||
| Financial services | 0.12 | * | 0.11 | * | 0.03 | 0.03 | −0.05 | −0.06 | ||||
| (0.05) | (0.05) | (0.06) | (0.06) | (0.06) | (0.06) | |||||||
| Telecommunication | 0.02 | 0.01 | −0.03 | −0.02 | −0.06 | −0.08 | ||||||
| (0.05) | (0.05) | (0.07) | (0.07) | (0.06) | (0.06) | |||||||
| Country: Netherlands (ref) | ||||||||||||
| United Kingdom | 0.14 | * | 0.15 | * | 0.15 | + | 0.14 | + | −0.03 | −0.01 | ||
| (0.06) | (0.06) | (0.08) | (0.08) | (0.08) | (0.08) | |||||||
| Germany | −0.09 | + | −0.06 | 0.09 | 0.09 | 0.27 | ** | 0.30 | ** | |||
| (0.05) | (0.05) | (0.07) | (0.07) | (0.07) | (0.07) | |||||||
| Finland | −0.08 | −0.07 | 0.03 | 0.03 | −0.20 | ** | −0.21 | ** | ||||
| (0.06) | (0.06) | (0.07) | (0.07) | (0.07) | (0.07) | |||||||
| Sweden | 0.06 | 0.08 | −0.00 | 0.00 | −0.09 | −0.09 | ||||||
| (0.05) | (0.05) | (0.06) | (0.06) | (0.06) | (0.06) | |||||||
| Portugal | 0.11 | * | 0.12 | * | 0.22 | ** | 0.21 | ** | 0.01 | 0.03 | ||
| (0.06) | (0.06) | (0.07) | (0.07) | (0.07) | (0.07) | |||||||
| Spain | 0.05 | 0.07 | 0.11 | 0.10 | 0.06 | 0.10 | ||||||
| (0.06) | (0.06) | (0.07) | (0.07) | (0.07) | (0.07) | |||||||
| Hungary | −0.22 | ** | −0.21 | ** | −0.01 | −0.02 | 0.11 | + | 0.13 | * | ||
| (0.05) | (0.05) | (0.07) | (0.07) | (0.07) | (0.07) | |||||||
| Bulgaria | −0.38 | ** | −0.38 | ** | 0.14 | * | 0.13 | + | 0.32 | ** | 0.35 | ** |
| (0.05) | (0.05) | (0.07) | (0.07) | (0.06) | (0.06) | |||||||
| Prop. skilled org | 0.01 | 0.01 | −0.00 | −0.00 | −0.00 | −0.00 | ||||||
| (0.01) | (0.01) | (0.01) | (0.01) | (0.01) | (0.01) | |||||||
| Prop. skilled team | 0.00 | 0.00 | 0.00 | 0.00 | −0.01 | + | −0.01 | * | ||||
| (0.00) | (0.00) | (0.00) | (0.00) | (0.01) | (0.01) | |||||||
| Flex times available team | 0.00 | 0.02 | 0.02 | 0.03 | −0.04 | −0.03 | ||||||
| (0.03) | (0.03) | (0.03) | (0.03) | (0.03) | (0.03) | |||||||
| Work home available team | 0.01 | −0.01 | −0.00 | −0.00 | 0.04 | 0.01 | ||||||
| (0.03) | (0.03) | (0.03) | (0.03) | (0.03) | (0.03) | |||||||
| Flex times available org | −0.05 | −0.04 | −0.01 | −0.01 | 0.02 | 0.03 | ||||||
| (0.04) | (0.04) | (0.05) | (0.05) | (0.05) | (0.05) | |||||||
| Work home available org | 0.06 | 0.05 | −0.00 | −0.00 | 0.01 | 0.01 | ||||||
| (0.03) | (0.03) | (0.04) | (0.04) | (0.04) | (0.04) | |||||||
| Constant | 1.54 | ** | 1.53 | ** | 2.59 | ** | 2.60 | ** | 1.92 | ** | 1.91 | ** |
| (0.13) | (0.12) | (0.14) | (0.14) | (0.15) | (0.15) | |||||||
| N | 10,098 | 10,098 | 10,098 | 10,098 | 10,098 | 10,098 | ||||||
Disclaimer/Publisher’s Note: The statements, opinions and data contained in all publications are solely those of the individual author(s) and contributor(s) and not of MDPI and/or the editor(s). MDPI and/or the editor(s) disclaim responsibility for any injury to people or property resulting from any ideas, methods, instructions or products referred to in the content. |
© 2024 by the authors. Licensee MDPI, Basel, Switzerland. This article is an open access article distributed under the terms and conditions of the Creative Commons Attribution (CC BY) license (https://creativecommons.org/licenses/by/4.0/).
Share and Cite
van der Lippe, T.; den Dulk, L.; Begall, K. Flextime/Flexspace for All in the Organization? A Study of the Availability, Use, and Consequences of Flexible Work Arrangements for Low and High SES Employees in Nine European Countries. Soc. Sci. 2024, 13, 200. https://doi.org/10.3390/socsci13040200
van der Lippe T, den Dulk L, Begall K. Flextime/Flexspace for All in the Organization? A Study of the Availability, Use, and Consequences of Flexible Work Arrangements for Low and High SES Employees in Nine European Countries. Social Sciences. 2024; 13(4):200. https://doi.org/10.3390/socsci13040200
Chicago/Turabian Stylevan der Lippe, Tanja, Laura den Dulk, and Katia Begall. 2024. "Flextime/Flexspace for All in the Organization? A Study of the Availability, Use, and Consequences of Flexible Work Arrangements for Low and High SES Employees in Nine European Countries" Social Sciences 13, no. 4: 200. https://doi.org/10.3390/socsci13040200