1. Introduction
In the last few decades, the foreign resident population in Italy has grown considerably, showing a clear tendency towards stable settlement (
ISTAT 2022b). The analysis by gender and citizenship of the regular foreign presence in Italy contributes decisively to the study of the migratory phenomenon in the country. Since the beginning of the phenomenon, scholars have described immigration in Italy as an “archipelago” (
Mottura 1992). For the foreign population, in fact, the demographic and social characteristics (for example, the gender structure and composition of households) and employment, the settlement models in the territory are often closely connected with the citizenship of origin (
Conti and Strozza 2006;
Blangiardo et al. 2017). Therefore, the numerous foreign communities residing in Italy show very different characteristics, and it is impossible to ignore the analysis by citizenship when reconstructing the complete picture of the phenomenon (
Blangiardo et al. 2017). In addition, migratory networks, which, through the transmission and dissemination of accurate and up-to-date information, act as a factor of attraction for the entry of new migrants into Italy, play a rather significant role in the consolidation of several immigrant communities already settled in specific areas of the country (
Cesareo and Blangiardo 2009;
Cvajner and Sciortino 2010). The spatial distribution of this population is another important key to better understand the general integration process (
Lichter et al. 2020). It is important to consider that the settlement patterns are the consequence of not only migrations from abroad but also of the internal mobility of foreign immigrants (
Casacchia et al. 2022). Social integration and spatial integration are deeply linked (
Liebig and Spielvogel 2021). Every place—region, city, suburb, etc.—represents a unique context of integration that affects how immigrants could be incorporated into neighbourhoods, schools, local labour markets, and, ultimately, society. According to some scholars, “the uneven spatial distribution of immigrant and minority populations provides a useful summary indicator of social and economic integration and inclusion in modern societies” (
Lichter et al. 2020). Indeed, the settlement model expresses: (i) the community links and the role played by migration networks in determining the arrival and insertion of migrants in the host society, and (ii) the connection between territory and the occupational specialisation (or segregation) of the different foreign communities residing in the country (
Benassi and Ferrara 2013;
Tintori et al. 2018).
Considering these key elements, the aim of this research is to explore the diachronic evolution of the settlement models of the foreign population and the main ethnic groups usually classified as residents in Italy in the period 2003–2021. To achieve this goal, we used global statistical indices referring to three dimensions (evenness, concentration, and clustering) and ad hoc indices that regard territorial issues. These are some of the principal dimensions for the study of the spatial distribution of population groups and, specifically, of migrants’ populations (
Massey and Denton 1988). The principal novelties of the contribution lie in the attempt to compute these indexes not only in reference to the major population group (i.e., the Italians) but also between different foreign communities; in addition, the paper considers the gender structure.
These two fundamental aspects enrich the analysis and achieved results. Indeed, there is strong evidence that the higher differences in terms of settlement models are between “minority” groups, and it could be interesting to test if gender has an effect on shaping the residential geography of the foreign population. Finally, the paper proposes a diachronic approach of analysis, focusing on the last 20 years, following a specific multivariate analysis strategy (i.e., principal component analysis and clusters analysis).
The paper is organised as follows: in the next section, the settlement patterns of the foreign population in Italy are described; in
Section 3, we discuss the approach and measures for detecting the settlement models of the foreign population;
Section 4 is dedicated to the data;
Section 5 presents the results obtained through a specific multivariate analysis strategy by integrating principal component analysis and cluster analysis. A discussion of the results and future developments conclude the article.
2. An Overview of the Settlement Patterns of the Foreign Population in Italy
Before analysing the settlement of immigrants in Italy in depth, it is appropriate to briefly discuss the most recent evolution of the phenomenon. A peak in immigrant flows was recorded in the period between 2000 and 2010. The consistent flows were a consequence of both several regularisation processes and the fact that the Republics of Bulgaria and Romania joined the European Union. The economic crisis of 2008 interrupted this growth process and opened a new phase for international migration flows towards Italy (
Colombo and Dalla Zuanna 2019). In addition, during the last few years, a reduction in immigration was registered as a consequence of the measures to limit the spread of COVID-19 (
Bonifazi et al. 2021).
The economic crisis that started in 2008 also led to evident changes in the type of migratory flows arriving in Italy. Although the crisis made Italy less attractive, in some areas of origin, the importance of the push factors grew. The escalation of various crises, wars, and clashes on the international scene and the opening of new migratory routes have meant that in recent years, the profile of migrations and migrants in Italy has changed radically.
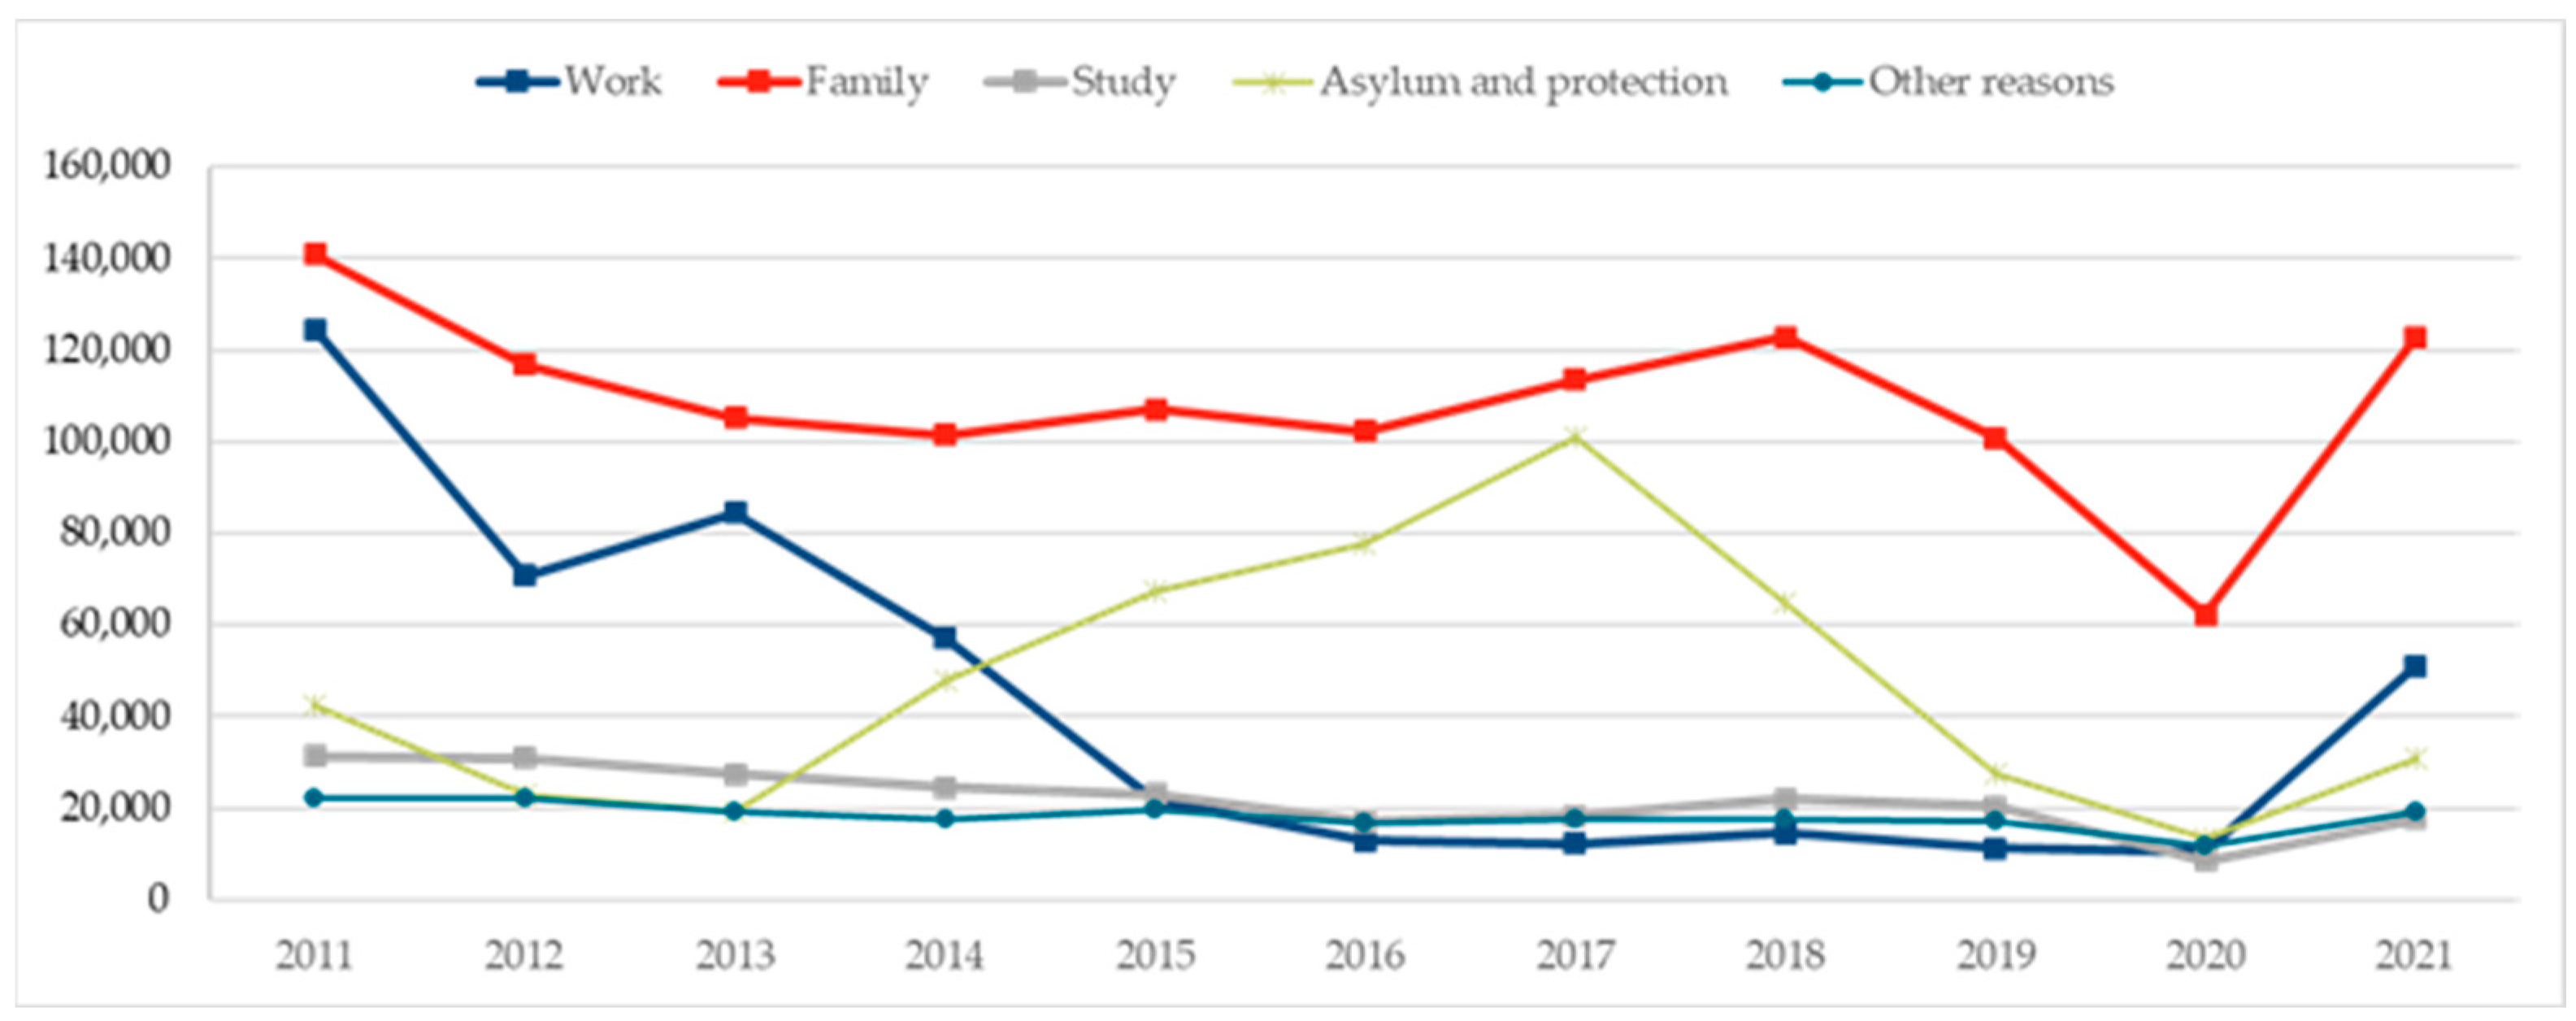
Focusing attention on non-EU citizens, it seems clear that if “work” was the prevalent reason for the new residence permits issued up to 2010, since 2011, the most widespread reason for entry into Italy has been “family reunification” (
Figure 1)
1.
The rapid growth in permits for asylum and humanitarian reasons, which, in 2015, exceeded 28% of the total number of new documents issued during the year (
ISTAT 2022a), should be noted. The data referring to immigrants in 2015 marked an epochal transition in which new flows for work represented only the fourth reason for new arrivals; this was also surpassed by permits granted for study reasons. Between 2015 and 2018, as a consequence of the so-called “Mediterranean refugee crisis” (
Piguet 2021), Italy registered a peak in arrivals of asylum seekers. Asylum seekers have a very peculiar profile in terms of demographic characteristics and countries of origin. The crisis in the Mediterranean Sea opened a new period of emergency around migrations for Italy; during this period, in fact, the country had to manage significant landings by the sea.
During the same years, Italy became a country of advanced integration. Many immigrants have been living in Italy for 20 years or more. Many of them have acquired Italian citizenship. A growing second—and even third—generation presents new social needs. The stock of immigrants has changed in size and characteristics. As of 1 January 2021, the foreign population in Italy amounted to 5,171,894 residents. In 2019, there were 4,996,158; and, therefore, in three years, it increased by fewer than 200,000 people. The growth of the foreign population slowed both owing to a decrease in new entry flows and as a result of citizenship acquisition. Between 2011 and 2020, over 1,250,000 people acquired Italian citizenship; and it can be estimated that as of 1 January 2021, there were approximately 1,600,000 naturalised citizens residing in Italy.
Despite the more recent flows and—above all—the landings involving the South of Italy and the islands, the foreign presence is concentrated in the North and Centre of Italy. Some scholars (
Casacchia et al. 1999) distinguish three prevailing settlement models:
- (1)
a metropolitan model: it regards the communities with a strong imbalance in the gender structure, mostly employed in services to families or in commercial activities;
- (2)
a widespread model, typical of those groups that are more dispersed as a result of a greater range of employment opportunities;
- (3)
a border model, typical of the communities that come from countries bordering Italy and which tend to settle mainly in the areas geographically closest to their areas of origin.
The gender structure of the foreign population is, in general, balanced—the gender ratio is 95 women for every 100 men—but evident imbalances are registered regarding different citizenships. This is the case of the Eastern European communities for which the women represent the majority of the nationality: for Ukrainians and Russians, the female component exceeds 75 percent of the total. The gender ratio for Romanians is more balanced, where women represent almost 57% of the residents (as of 31 December 2021). Other citizenships, such as those from Bangladesh, Egypt, and Pakistan, are, instead, unbalanced towards men; and the percentage of women represents between 28 and 34% of those nationalities. In some cases—like the one of Moroccans—balance has been achieved over time starting from a situation of an initial imbalance (in favour of men); for other communities, like Chinese, migrations have always been based on a familiar migratory model with the co-presence of men and women; consequently, the gender structure has always been balanced. In the case of citizenships characterised by a greater female presence, job placement in family services is widespread, both in domestic and personal services. It would be interesting to focus the analysis on different communities to discover if men and women belonging to the same citizenship have different settlement models.
3. Approach and Measures for Detecting the Settlement Models of the Foreign Population
A peculiar trait of the foreign population is its settlement models and the way it is spatially distributed. This is a very old and classic theme that originated from the Ecological School of Chicago (
Duncan and Duncan 1955;
Massey and Denton 1988;
Bailey 2012;
Yao et al. 2019). Although they focused on the urban scale of analysis and the segregation process as the degree of spatial separation between two (or more) population groups, this theory states that over time, foreign communities settle across the territory and tend to expand. The settlement models of the foreign population (and its subgroups) remain an important field of study. Indeed, the settlement model of a given foreign group expresses: (a) the community links and the role played by migration networks in determining the arrival and insertion into the host society; (b) the connection between the territory and occupational specialisation (or segregation) of different foreign communities residing in the country (
Benassi and Ferrara 2013).
But, of course, studying settlement models of a foreign population (and its subgroups) implies facing a great level of heterogeneity. Indeed, each foreign group has its own settlement model that varies from a dispersed one, like the Romanian population, to a concentrated one, like the Egyptian group, with many intermediate models, like that of the Chinese people, often defined as clustered–dispersed. Moreover, to appreciate the evolution of the settlement model and to detect its real features, we should follow a diachronic approach. Of course, it will be impossible to face such complexity using local indexes. The idea, therefore, is to measure the settlement model by a global (i.e., by means of global indices) and diachronic approach.
In the light of the above, in this paper, we used a mix of classic indices related to the three main dimensions of residential segregation, based on the pioneering work of
Massey and Denton (
1988) about the dimensions of residential segregation, and “ad hoc” indices that regard territorial dimensions. We show, here, some proprieties about the elementary indices computed in this research (
Table 1).
First, a basic distinction of the indices is the following (
Massey and Denton 1988): “one-group” indices that measure a group’s distribution compared to that of the entire population; “two-group” indices that compare a group’s distribution with that of another group.
The dimensions that are used are
2: (1) evenness, (2) concentration, and (3) clustering. The dimensions that each index refers to are the ones that normally synthetise the spatial distribution of the population.
Table 1 summarises all the indices used in this research.
The meaning of each index is as follows:
The value of ID represents the share of a group that would have to move to create a uniform population distribution. If ID is closer to 1, the further the territorial distribution of a certain foreign group is from a condition of equal distribution compared to the Italian one (higher values mean higher dissimilarity between the foreign group and the Italian population).
The RCO indicates the relative amount of physical space that is occupied. The closer that RCO is to +1, the more concentrated the territorial distribution of a certain foreign group is as compared to the distribution of Italians (a higher positive value means a higher level of relative concentration).
The RCL index refers to the “relative amount of physical space occupied by a minority group in the urban environment” (
Massey and Denton 1988). If RCL
3 is greater (a positive value) then the level of clustering of the analysed foreign community with respect to Italians is greater (a higher positive value means a higher level of relative clustering). To better clarify the concept with respect to concentration, we can define clustering as a measure in which the municipalities inhabited by members of a minority group are contiguous or spatially concentrated in comparison to each other in the territory. Thus, a high degree of clustering implies a settlement structure where the municipalities of the minority group are contiguous, creating a kind of “enclave”.
DEL refers to the physical space occupied by each foreign community and gives the proportion of a group’s population that would have to move between municipalities to achieve a uniform density. The higher the level of the index, the higher the absolute concentration level of the group, and the lower the physical space occupied (higher values mean higher levels of absolute concentration).
CDI
4 refers to the quota of each foreign population group that resides in coastal municipalities (higher values mean higher levels of coastal diffusion).
UDI refers to the quota of each foreign population group that resides in urban municipalities, which are municipalities with urbanisation degrees equal to one (higher values mean higher levels of urban diffusion).
ORI refers to the quota of municipalities in which each foreign group is over-represented, where the values of the location quotient (LQ) are higher than two (higher values mean more situations with higher over-representations). We recall that the location quotient is useful for identifying territorial units in an area where a population group is under-represented (LQ < 1) or, conversely, over-represented (LQ > 1) (
Isard 1960). In this study, we set the over-representation value to two.
In the first step, we computed these seven global elementary indices for each of the first 10 foreign communities in 2021, for gender and three years (2003, 2011, and 2021)
5. We adopted a very fine geographical scale of analysis by considering about 7904 municipalities. The geographical boundaries of 2003 and 2011 were brought back to those of 2021 to standardise the number of municipalities (the same municipalities each year). This procedure allows us to obtain an M(c,v) matrix in which there are 60 cases (c) (10 foreign communities, three years, and two genders); the variables (v) are the seven elementary indices reported in
Table 1. In the second step, M(c,v) is synthetised by the principal component analysis (PCA) method. Following this, a probabilistic clustering method called Expectation Maximisation (EM) (
Dempster et al. 1977;
Witten and Frank 2011) is applied to the factorial scores of each statistical unit.
In the next section, we will focus on the data that were used in detail, while the results of the complete analysis will be discussed in
Section 5.
4. Data
Official administrative data provide precious resources for monitoring the largest part of the phenomenon of immigration in Italy. The strength of these kinds of statistics is, most of all, the availability and the reliability of data at the deepest territorial level of disaggregation. These data have some limits for offering widespread information on the phenomenon. For this reason, the Italian National Institute of Statistics (ISTAT) carries out several data collections to cover more dimensions of immigration. Integrating the information obtained from other sources is a crucial task to obtain a more complete and reasonable picture of immigration in Italy.
The available data are taken from administrative sources (municipality registers) and show municipal details but not sub-municipal-level details. For this reason, they are very useful for spatial analyses, but they are not suitable for conducting sociological analyses focused on social segregation and marginalisation (
Wacquant 2008;
Liebig and Spielvogel 2021;
Sleutjes et al. 2019). At the same time, administrative data, naturally, do not take into account the social networks and relationships of immigrants (
Sleutjes et al. 2019). Compared with survey data, administrative data have the advantage of covering the entire national territory and allow for a comparison over time. This work intends to provide a useful quantitative framework at the macro level for more detailed territorial investigations that are conducted, including a qualitative approach.
According to the Registry Law (Law 1228/1954), the whole population having usual residence in Italy must be registered in the registry office (right/duty). Only foreigners who have a valid residence permit can be registered. The demographic balance of the yearly foreign resident population, disseminated by ISTAT, provides the results of the processing of data for the flows of demographic dynamics acquired through the notifications sent by the municipalities to the National Registry of the Resident Population (ANPR system). The object of the survey consists of all the registration and cancellation data relating to foreign individuals registered in the municipal registry records (live births, deaths, immigration, and emigration), distributed by gender and country of citizenship (numbers of the EU and non-EU citizens). The criterion for selecting the population is that of citizenship. The data refer to regular foreigners residing (registered in the municipality lists) in Italy; the place of birth is not considered. It should be noted that in Italy, children born to foreign parents are considered as foreigners by law, at least until they turn eighteen.
Starting from 2019, the demographic balance of the foreign resident population considers the results of the Permanent Population Census. The consolidation process ends about 11 months later, with the validation of the annual resident balance data and with the alignment of the foreign population as of 31 December with the results of the Permanent Population Census (
ISTAT 2023).
The availability of the foreign resident population data by gender and country of citizenship from 2003 to 2021 allows the investigation of the main characteristics and evolution patterns of the settlement models of the main foreign communities in Italy in the period between 2003 and 2021 (
Table 2).
Of the almost 200 communities represented in Italy, only fourteen have more than 100,000, and fifty exceed the threshold of 10,000. In this paper, the ten largest foreign resident communities in Italy on 31 December 2021 are considered. In 2021, the ten largest communities amounted to 3.2 million individuals (63.7% of the total foreign residents); the top five, to 48.7% (almost 2.5 million people). In the first place, we find the Romanian community with 1.1 million citizens (21.5% of the total) followed by the Moroccans (420,000, 8.4% of the total), the Albanians (almost 420,000, 8.3%), the Chinese (300,000, 6.0%), and the Ukrainians (225,000, 4.5%). In 20 years, the ranking of the top 10 communities shows significant changes. From 2003 to 2021, considering the first five largest communities, only the Romanians increased their incidence in the total population of foreigners (+12.6%). Albanians, Moroccans, and Filipinos, despite being characterised by a longer migration history, have decreased in population in relative terms over time (respectively −5.2%, −4.4%, and −0.5%). Instead, during the same period, most recent settlement communities have grown to a certain level and are the recoveries related to the Bangladeshi (+1.8%), the Chinese (+1.6%), the Ukrainian (+1.6%), and the Pakistani (+1.3%) populations, while the increases in the Egyptian and Indian populations are more contained.
Although the paper is focused just on a few communities, they are sufficient to individuate several relevant models. The process of generating the database was elaborated from resident population data (at 31.12 in the years 2003, 2011, and 2021) by gender and citizenship at the municipal level. First, based on the ten largest foreign resident communities in Italy on 31.12.2021, the same communities were selected for the years 2003 and 2011. The purpose of this operation is to obtain a homogeneous group, regardless of the dimension of the communities in the other chosen years.
Once the communities were selected, the data at the municipal level were standardised to eliminate differences in the number of municipalities that change over time. The process consisted of reclassifying the data of each municipality in the years 2003 and 2011 and bringing them back to the administrative territorial boundaries of 2021. In this way, the historical series reports the data according to the administrative territorial boundaries relating to the year 2021 (7904 municipalities).
The results should be considered as a first step that is useful to test the measures and the methods on the most representative communities; in future works, other communities will be considered to enrich the analysis.
5. Results
As mentioned in
Section 3, we computed the seven global elementary indices for each of the first 10 foreign communities in 2021, for gender and for three years (2003, 2011, and 2021). In the following subsections, we focus on the results of the two procedures
6: (1) principal component analysis and (2) cluster analysis.
5.1. Principal Component Analysis Results
We recall that principal component analysis (PCA) is a technique for reducing the dimensionality of a dataset, increasing its interpretability, but, at the same time, minimising the loss of information. It does this by creating new uncorrelated variables, called factors, which subsequently maximise the explained variance. For the extraction of the factors, we followed the well-known criterion with eigenvalues greater than one (
Kaiser 1960). The adequacy of the sampling is evaluated through the Kaiser–Meyer–Olkin (KMO) test (
Kaiser 1970), while the strength of the relationship among the variables is evaluated through Bartlett’s Test of Sphericity (
Bartlett 1954). Large loadings were highlighted for the ease of interpretation (
Table 3). The results of the conducted principal component analysis appear quite clear
7. The first component synthesises almost 51% of the total (initial) variance, while the second component synthesises almost 26.2%. Overall, the first two extracted components summarise almost 77.2% of the initial variance. The first component is positively correlated with ID, DEL, and UDI; instead, it is negatively correlated with ORI (as dissimilarity increases with respect to Italians; thus, the group tends to be under-represented). This component informs us about the dimensions of
dissimilarity,
absolute concentration, urban diffusion, and under-representation. The second component is positively correlated with RCO and CDI; instead, it is negatively correlated with RCL. This second component is related to the
relative concentration,
relative clustering (
low contiguity), and
coastal diffusion (
Table 3).
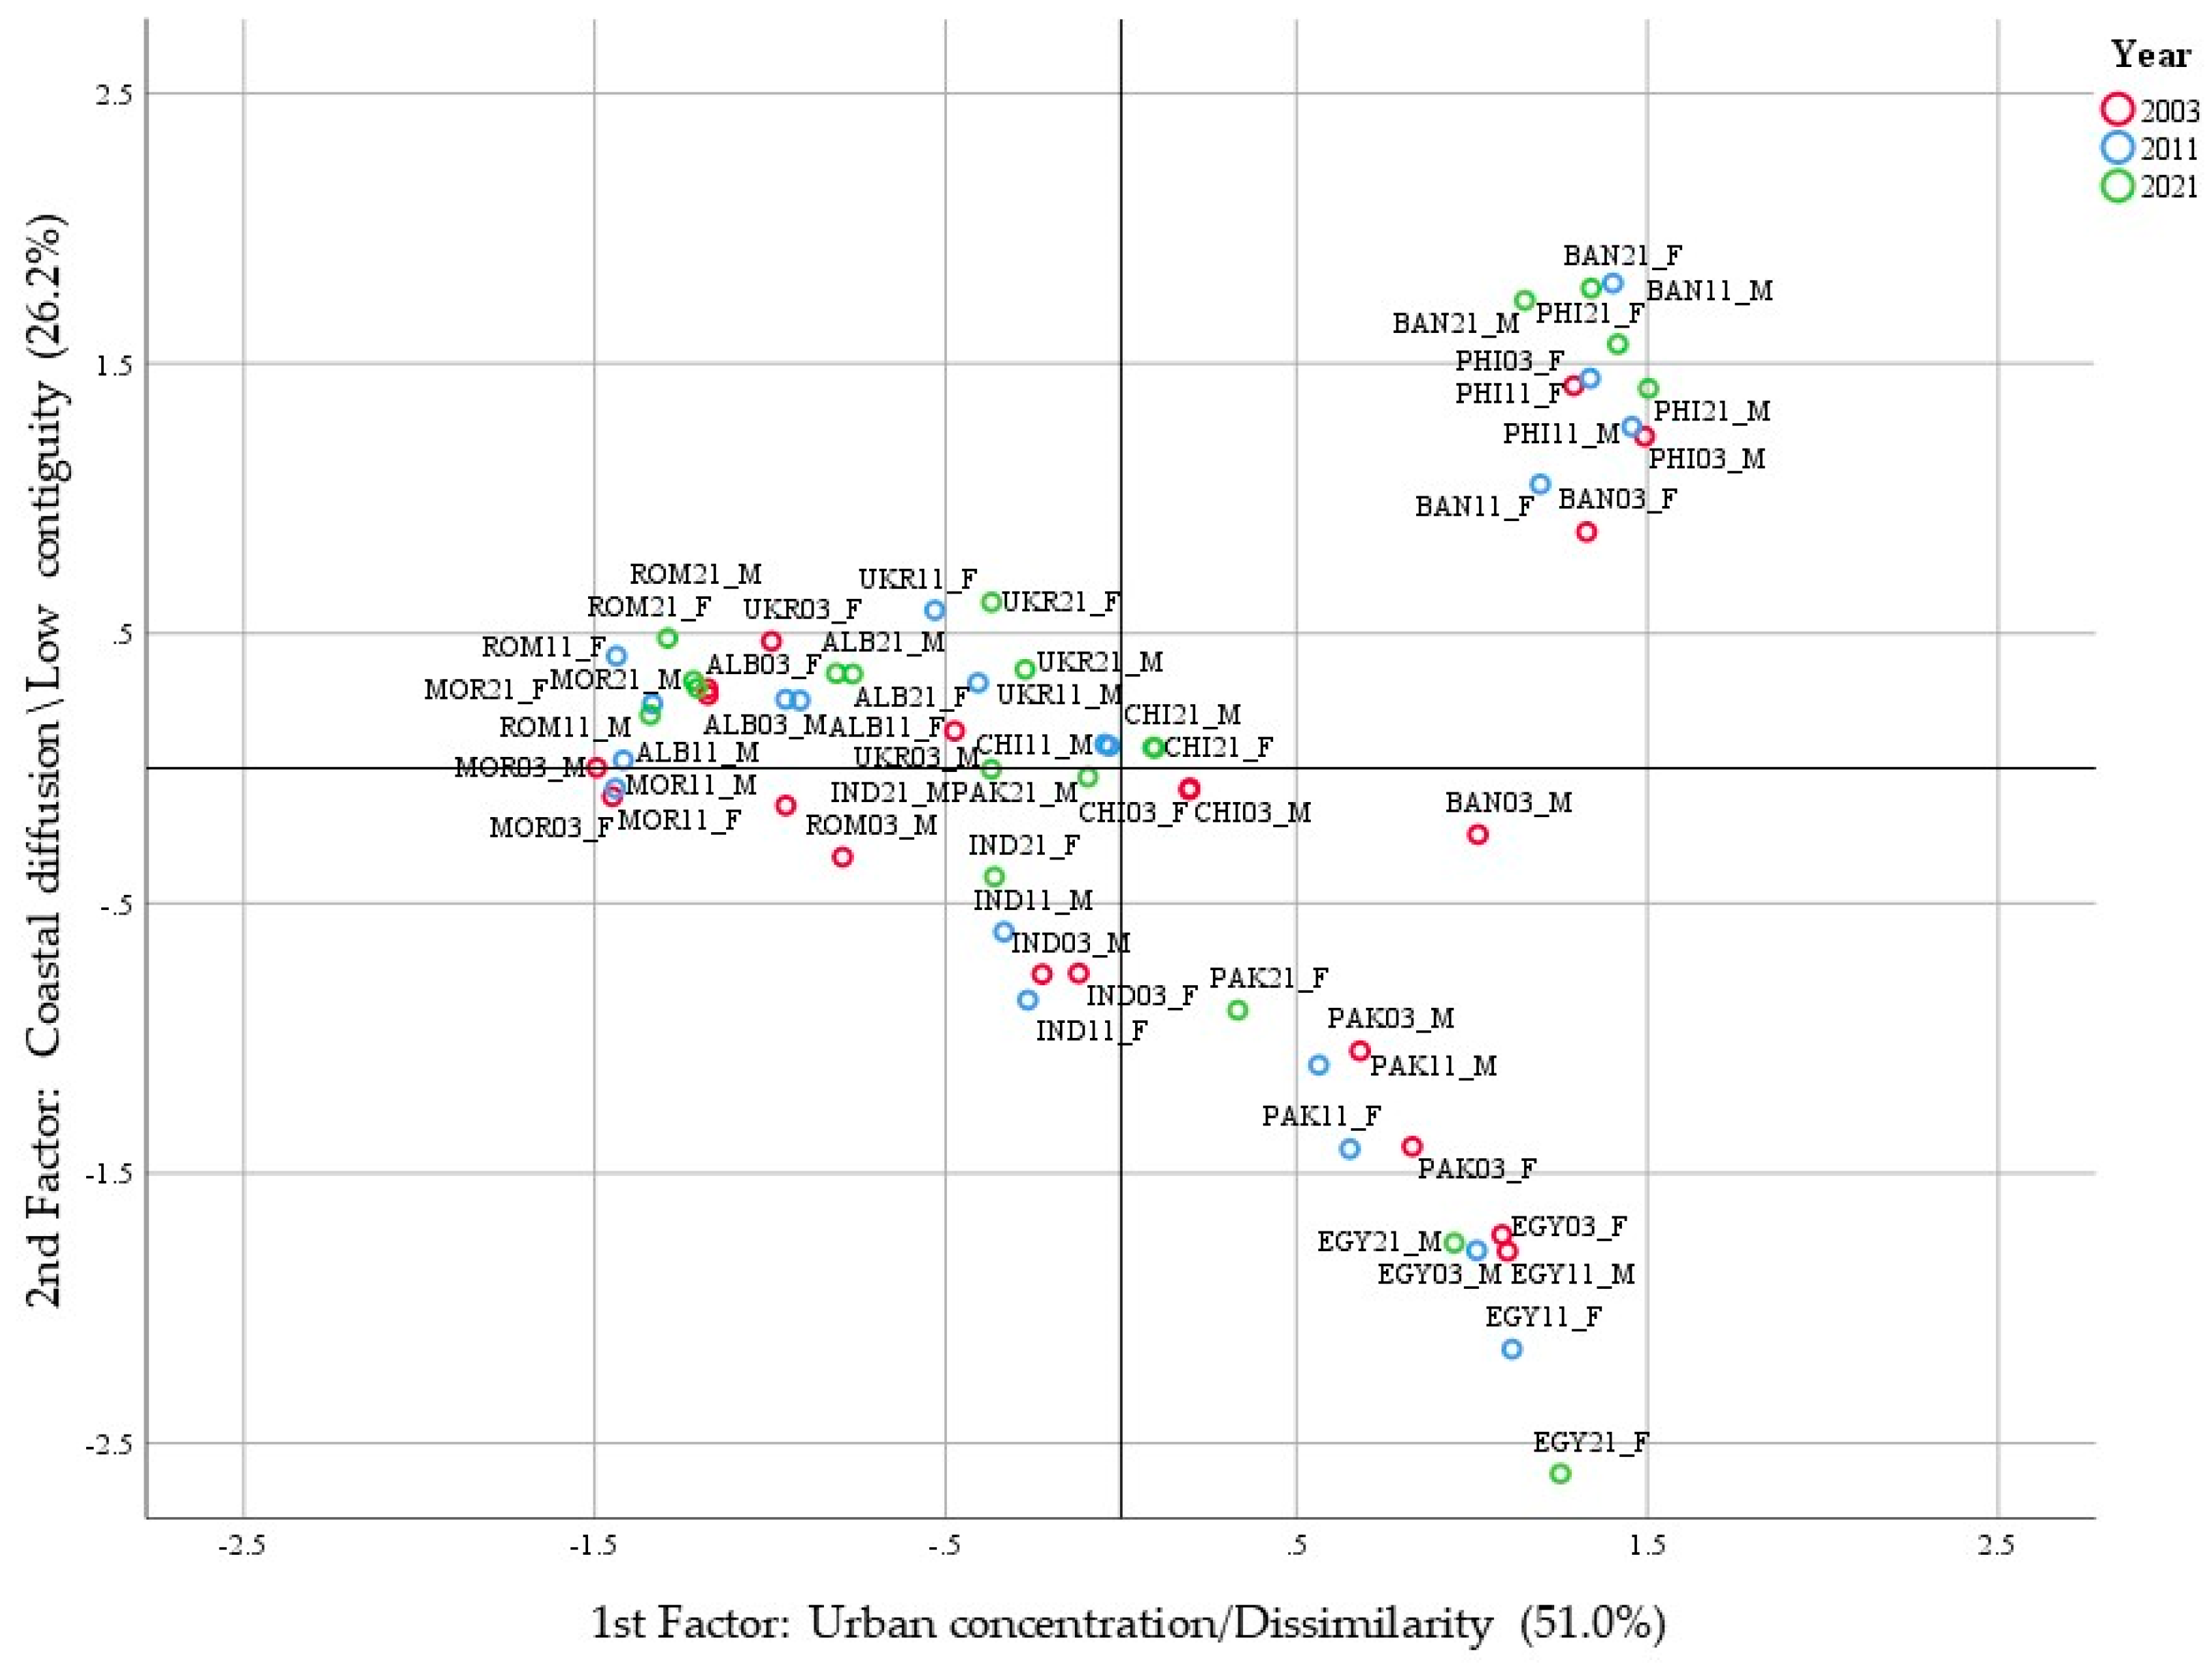
It is interesting to note the projection of the statistical units (foreign communities) on the factorial plane of the first two extracted components (
Figure 2).
Let us examine the units in detail. We can appreciate two opposite settlement models: the units that are in the second quadrant, mainly Romanians, Albanians, and Moroccans, and the units that are in the fourth quadrant, mainly Egyptians and Pakistanis. The first three communities have been present in Italy for a long time; the other two have arrived more recently and have continued to grow in recent years. There is another model, quite different from these two, which is the one with statistical units in the first quadrant: Filipinos and Bangladeshis in recent years. It must be remembered that these two groups are both characterised by a strong concentration in the Lazio region and in the metropolitan city of Rome. Indians are almost an isolated community, even if their settlement models are less clearly defined compared to the previous ones, while the Chinese and Ukrainian populations are very near the origin of the axis so that their settlement models do not seem to emerge using these indices. It could be useful to emphasise that some sociological studies express doubts about the validity of the indicator for the territorial concentration when applied to the Chinese community because it is concentrated in some residential areas for reasons related to the specificity of its production structure, which is characterised by the contiguity between the workplace and the home and by the diffusion of mono-ethnic businesses (
Tosi 1994;
Cellini and Fideli 2002). Moreover, genders of the same citizenship are almost always very clearly set apart from each other, and (with very few exceptions) statistical units remain in the same position over time. This means that their settlement models are time-invariant. It is interesting to note that in almost twenty years, the settlement models have changed little, even though over time, the integration paths of some communities have progressed far. The integration processes would, therefore, appear to take place within the initial territorial grid without modifying the pattern of the territorial distribution. Some changes can be highlighted among the more recently settled groups in the Italian territory, such as the Pakistani and Bangladeshi communities.
5.2. EM Clustering Results
Before showing the obtained results, we briefly recall the clustering method that was used. The EM algorithm is an iterative method relying on the assumption that data are generated by a mixture of underlying probability distributions, where each component represents a separate group or cluster. The method provides the optimal number of clusters in any empirical situation by a two-step iterative algorithm: the (E) or expectation step and the (M) or maximisation step. These two steps are repeated until a further increase in the number of clusters would result in a negligible improvement in the log-likelihood, namely, a convergence. Accordingly, the program checks how much the overall fit improves in passing from one to two clusters (formed in all the possible ways and then selects the best), then from two to three, etc. If the increase in the log-likelihood function calculated for the solution with K + 1 clusters is not marked (e.g., at least five percent better) more than the simpler solution with K clusters then the solution with K clusters is considered as ideal and, therefore, retained (for more details, see
Dempster et al. 1977;
Witten and Frank 2011). We set a minimum increase in the log-likelihood value over consecutive iterations equal to 0.1%. According to this setting, we obtained the best solution with five clusters (
Table 4). The Average Silhouette (AS) and Analysis of Variance (ANOVA) were used for analysing the cluster quality (
Libório et al. 2022).
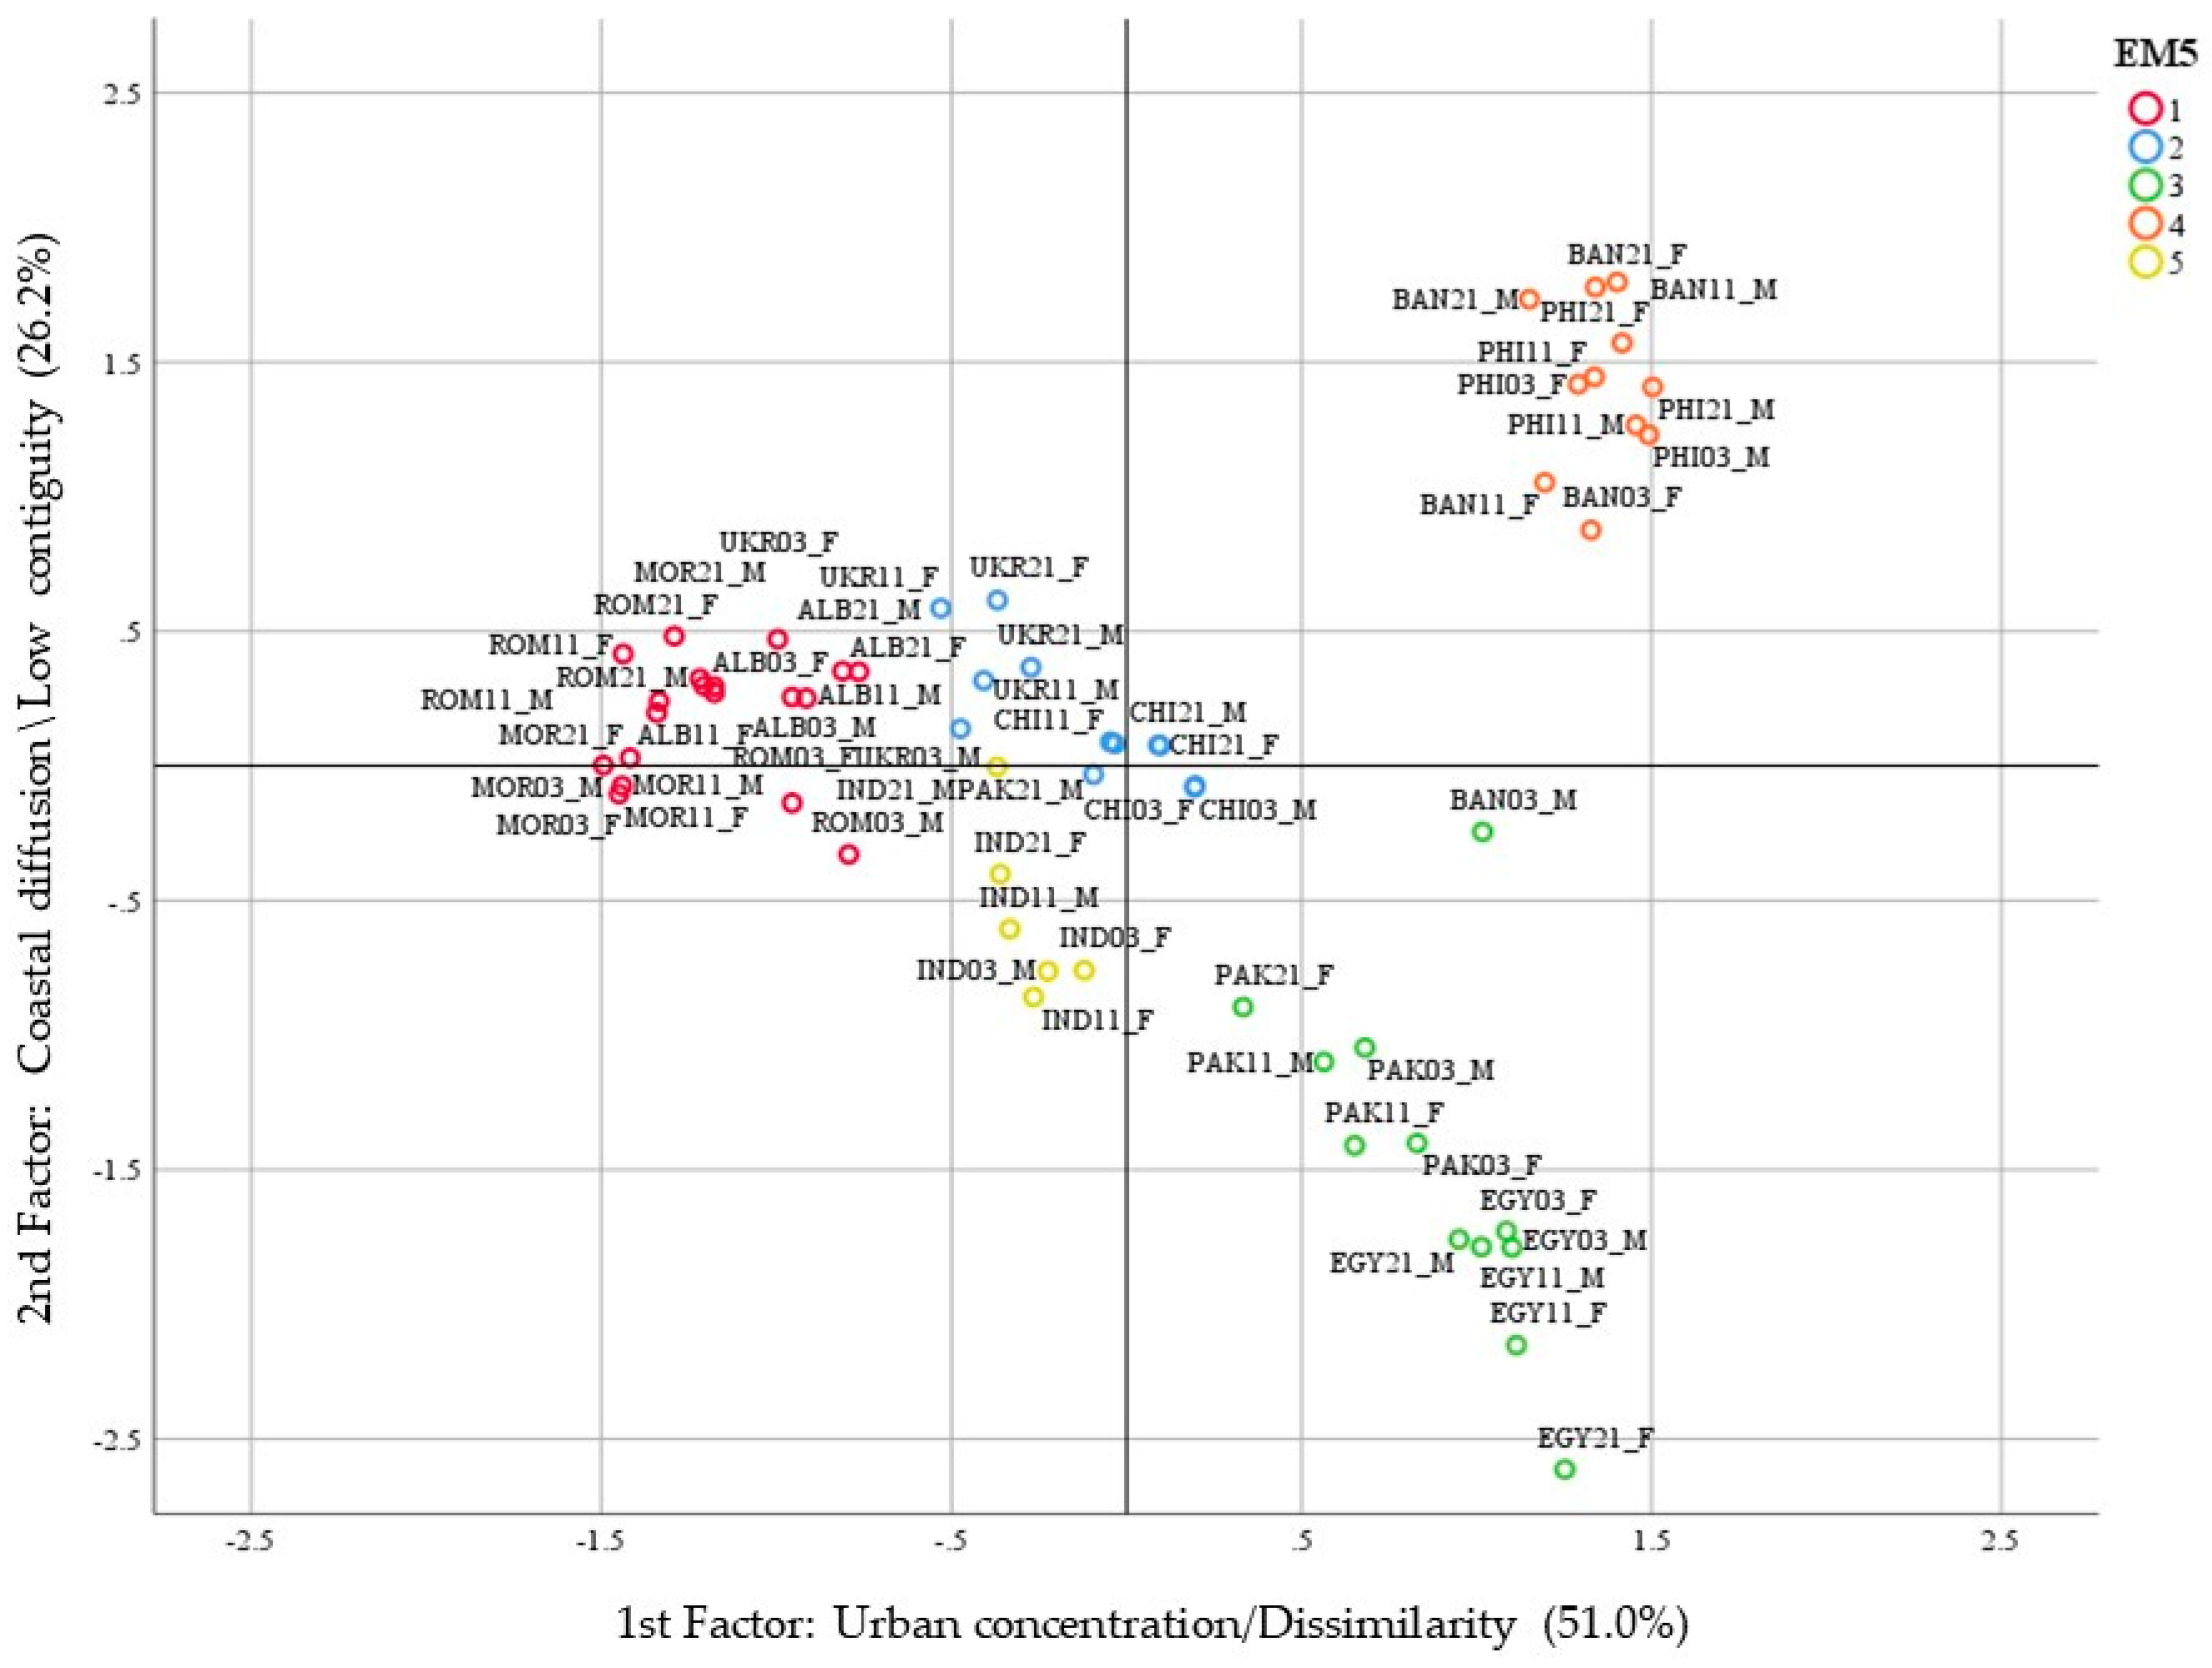
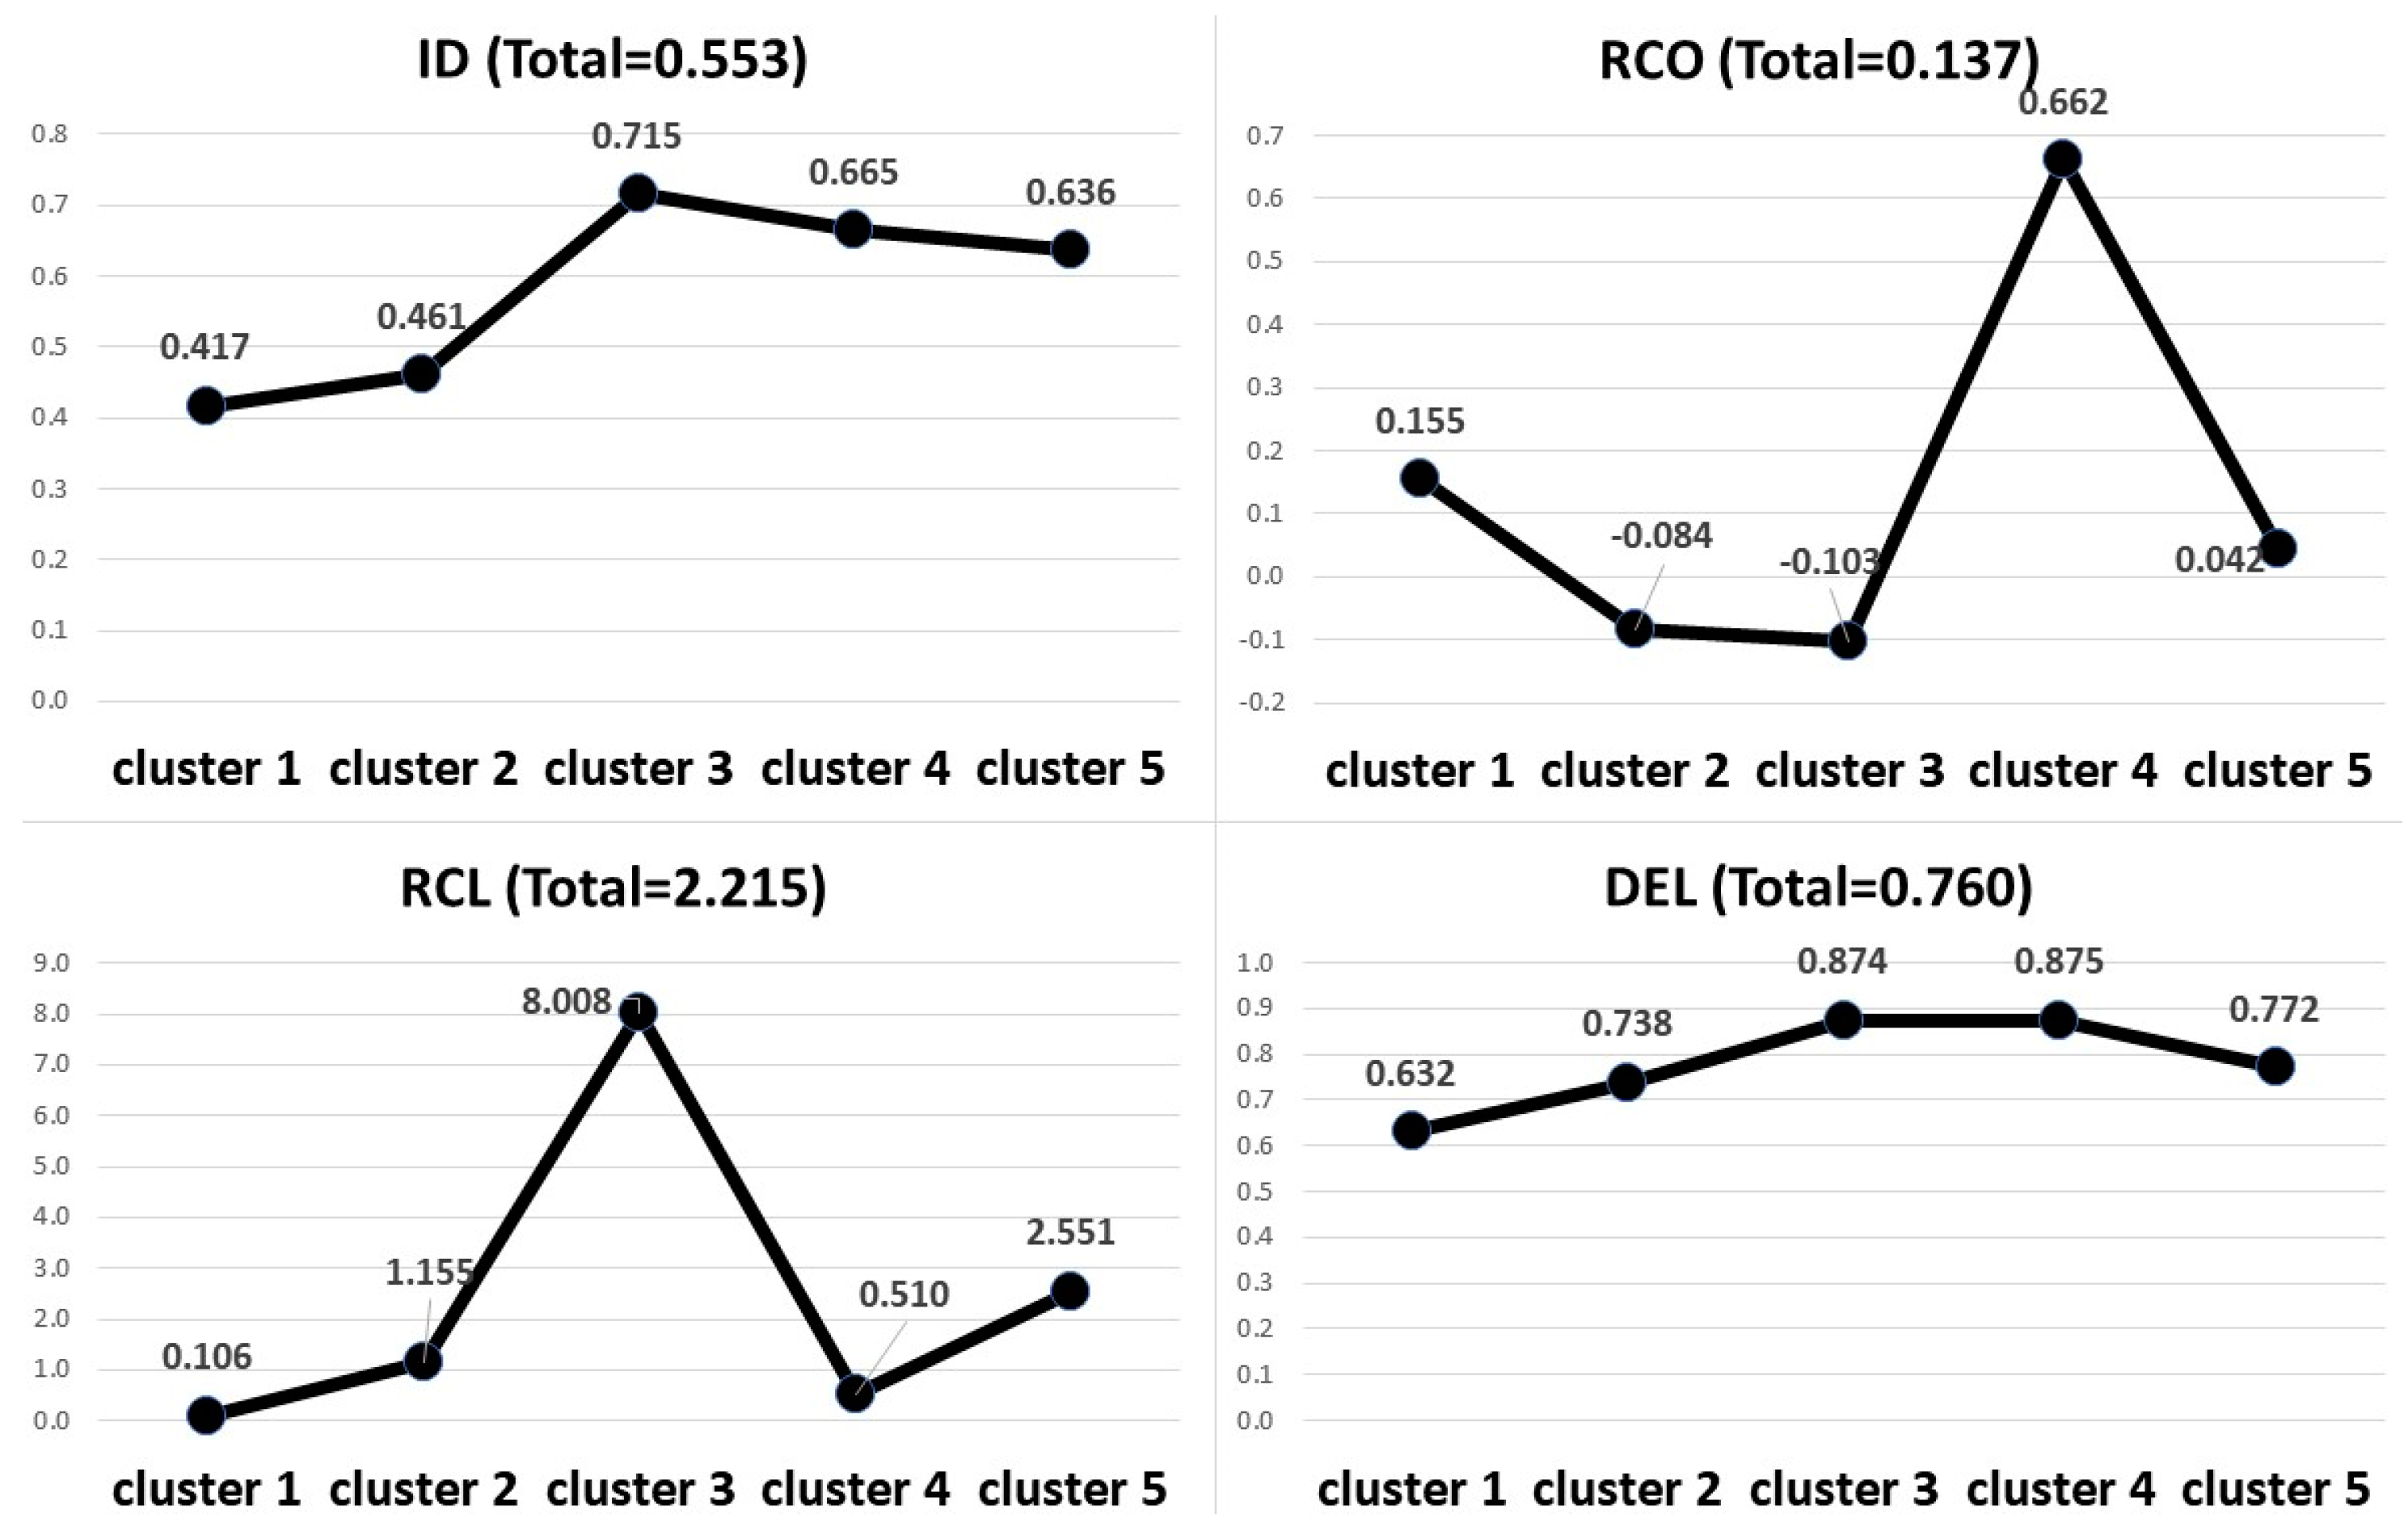
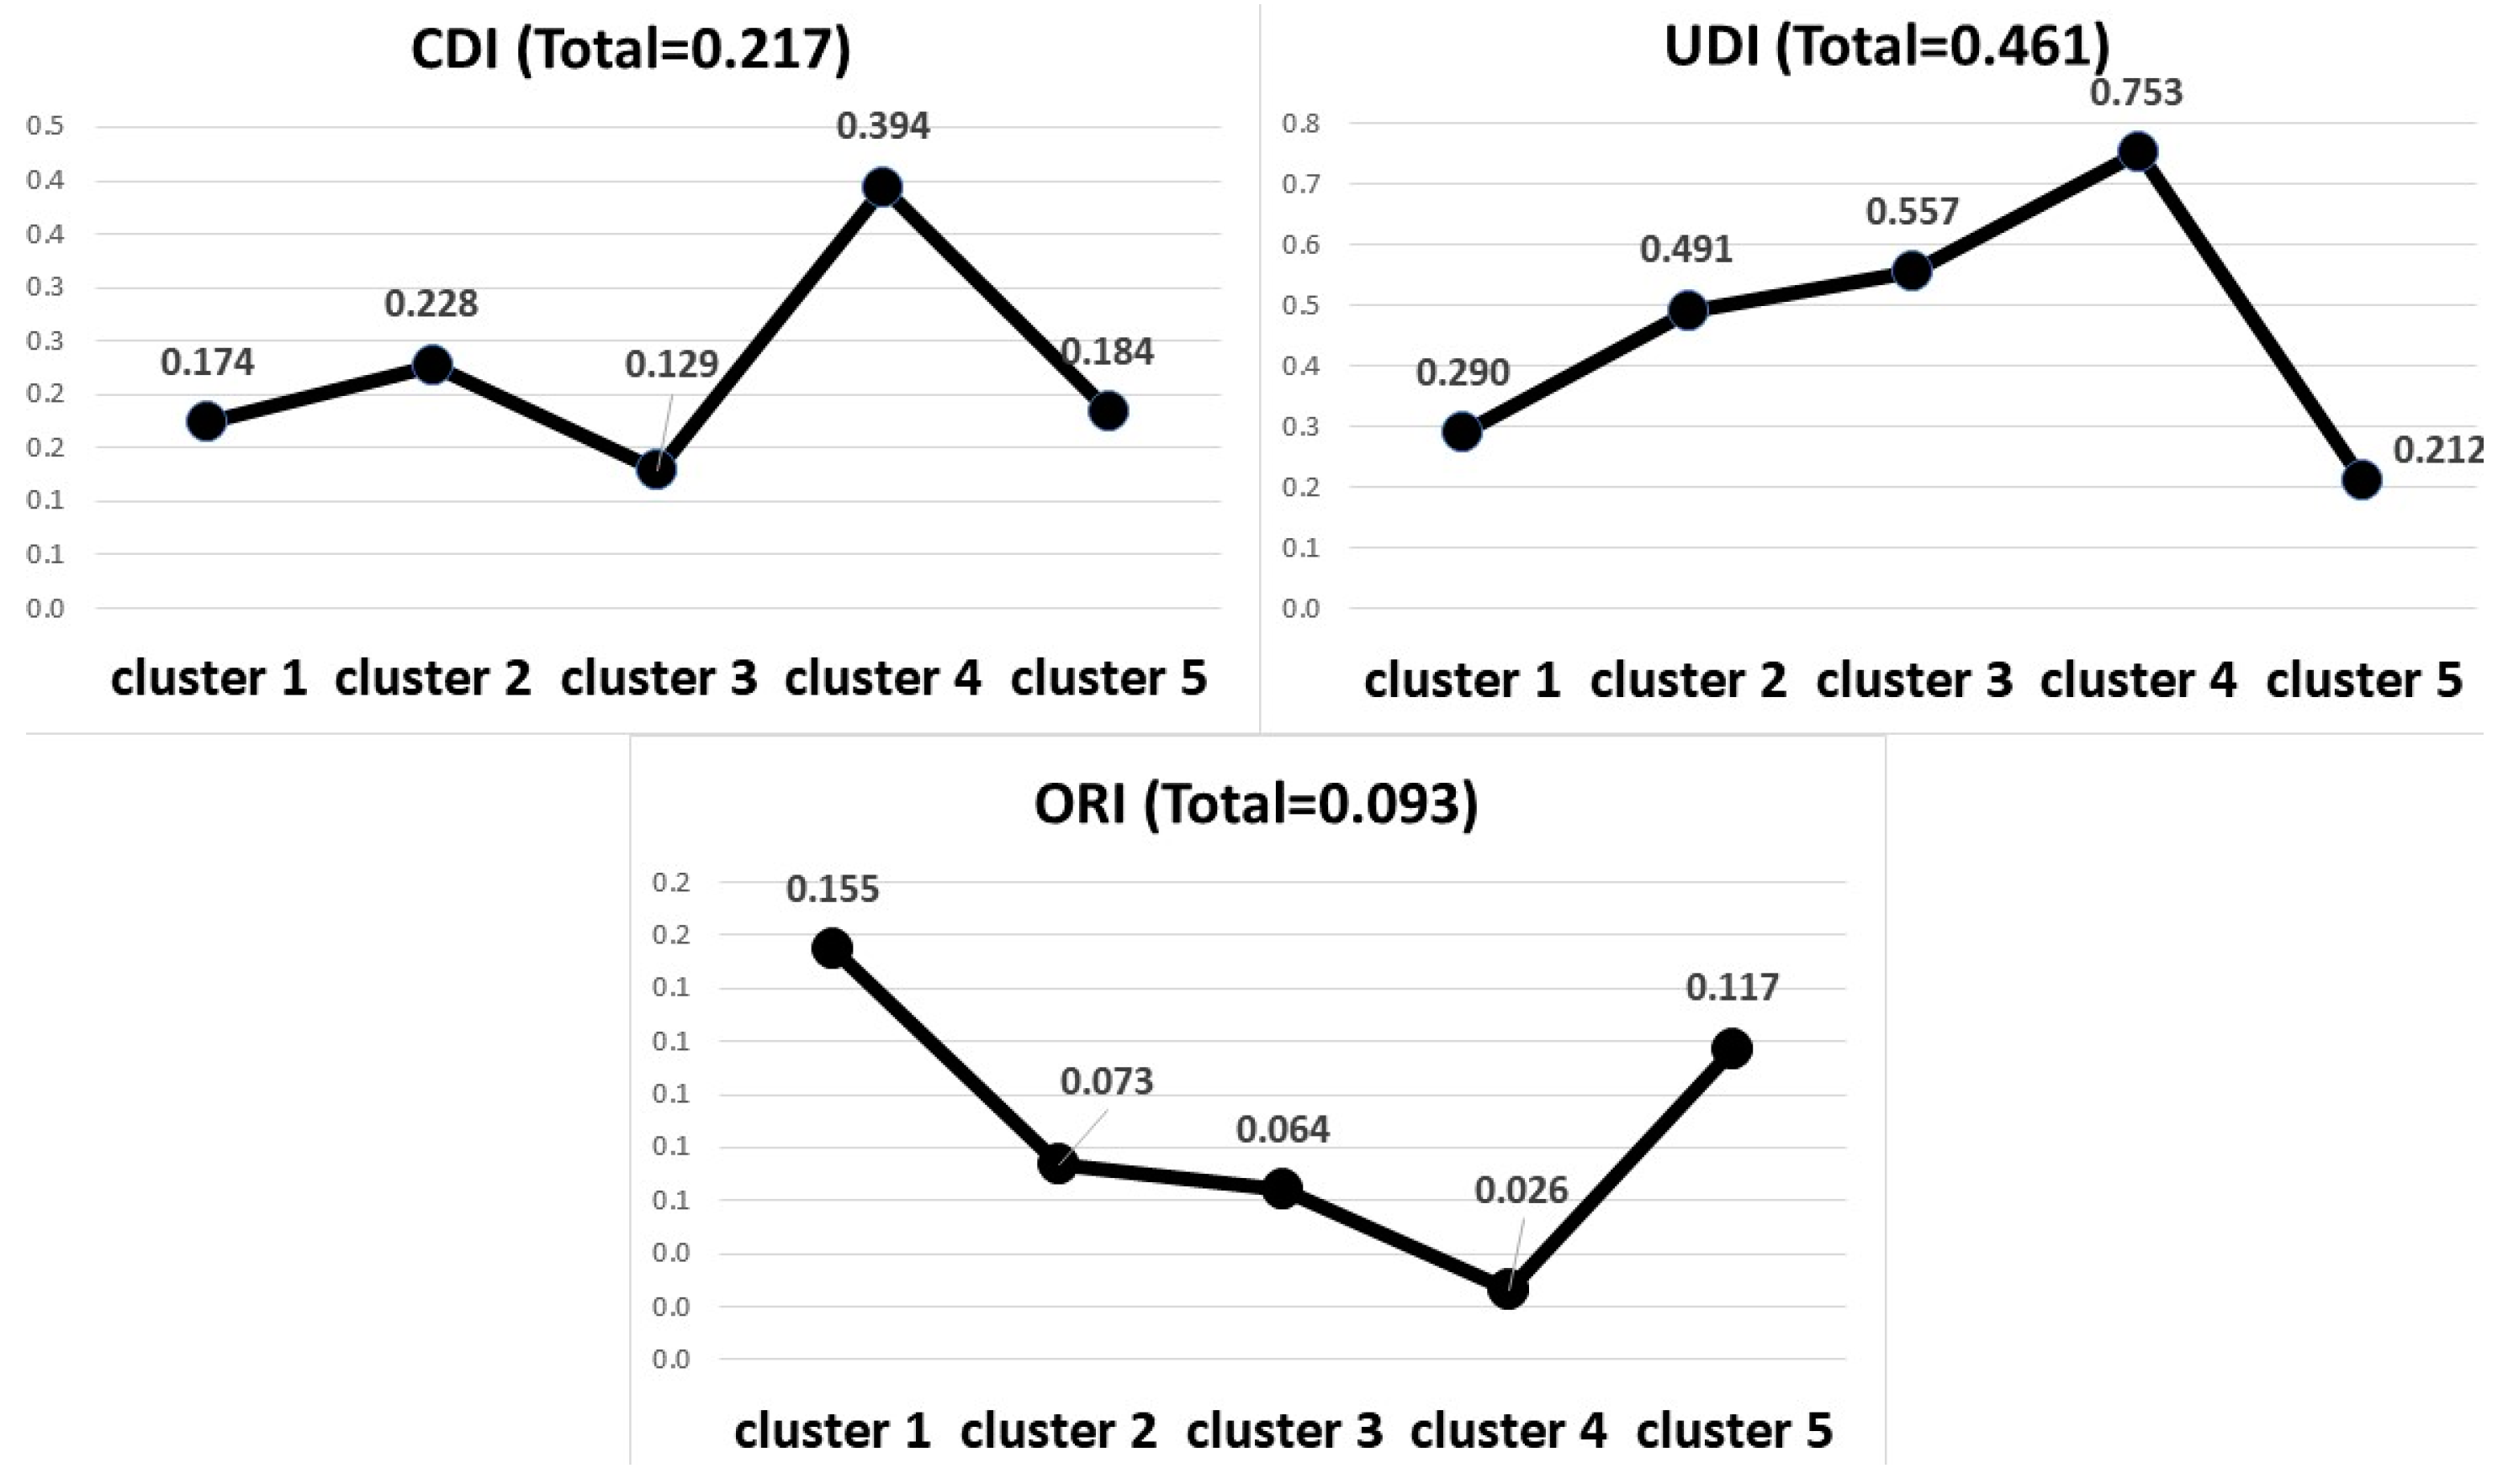
Jointly, with the cluster membership of the statistical units (
Figure 3) and the cluster means of the indices computed for each foreign community (
Figure 4 and
Figure 5), we provide some comments about the detailed EM clustering results.
The clustering results confirm what we have already said in the previous paragraph but with some more interesting details. Cluster 1 presents low levels of dissimilarity (ID) and absolute concentration (DEL) and a comparatively high level of urban diffusion (UDI). At the same time, it has comparatively high levels of relative concentration (RCO) and over-representation (ORI). This can be seen as a paradoxical result, but it is not. Indeed, Romanians are so diffused that they reside in territories where the number of Italians is comparatively low. This explains the higher levels of RCO and ORI. Cluster 3 (Egyptians and Pakistanis) and Cluster 4 (Filipinos and Bangladeshis) present high levels of dissimilarity (ID) but, only for Cluster 4, a high absolute concentration value (RCO) and, only for Cluster 3, a high level of relative clustering (RCL). Over-representation (ORI) is low in both clusters. Therefore, both groups differ mainly in RCO and RCL. The first is high in Cluster 3; the second is high in Cluster 4 because they are in very few municipalities with high levels of absolute concentration (DEL) and dissimilarity indexes (ID) but where there are also many Italians (which is typical of large cities and, in particular, Rome and Milan). As a consequence, over-representation (ORI) is comparatively low. Cluster 5 (Indians) has quite a peculiar profile with very high levels of ID and DEL and very low levels of CDI and UDI. Cluster 2, finally, is a sort of residual cluster because it is composed mostly of Chinese and Ukrainians. This means that these two groups are quite different from the others in terms of their settlement models (i.e., their settlement models are not grasped using the same indices that are able to measure the settlement models of the other foreign groups). Finally, clusters are almost always composed of both genders in the same groups and by the same nationalities each year.
6. Discussion and Final Remarks
The present study attempts to provide new insights into some key factors behind the settlement models of the main foreign communities residing in Italy (2003–2021).
We focus on the changes in the global patterns of residential foreign communities, using a specific analysis strategy. First, we provided a synthesis of the evolution of time across the global indices, distinguished by gender, of the principal foreign communities residing in Italy. Second, we attempted to outline a model of residential settlement through the combined use of principal component analysis and cluster analysis. From the obtained results, we can conclude that the settlement model of each foreign citizenship remained almost stable over time (with rare exceptions). Moreover, if we consider that all the citizenships have grown over the considered period, this shows that the geographical distribution has not been affected much in its fundamental features. Gender does not seem to play a fundamental role within individual citizenships (albeit with some exceptions). Its role is the most evident between different communities. The country of citizenship seems to remain a strong predictor in the settlement model, especially in relation to the dispersed dichotomy (Eastern European citizenships and the ones of older settlements) versus concentrated (Asians, also of old settlements, and communities of more recent settlements). The settlement patterns of Ukrainians and Chinese do not seem to manifest themselves clearly with respect to the indices that were used, which, on the other hand, characterise the other foreign communities quite well. This aspect indicates that these two communities represent an “exception” with respect to the other communities and their settlement patterns. In general, the analysis confirms the existence of different settlement models for different communities. Then, we must also emphasise the importance of the diachronic and global approaches and, moreover, the distinction between one- and two-group indices. Indeed, the geographical distribution of a “minority” group depends also on that of the majority. It is important to emphasise that in terms of social integration, the stability of the concentration of migrants is not always considered as a positive feature: “The effects of this concentration on integration are complex. On the one hand, arrival in an area with high concentration is often associated with better initial employment prospects for immigrants. On the other hand, in the longer run, immigrant concentration tends to hamper host-country language acquisition and, in many cases, educational advancement for children of immigrants” (
Liebig and Spielvogel 2021). From this point of view, some communities, such as Filipinos and Bangladeshis, seem particularly vulnerable. In this respect, new steps need to be taken to refine the analysis. In fact, we are planning to test other (spatial) concentration indicators (for example, the recent SGI index for measuring spatial concentrations, (for example the recent SGI index for measuring spatial concentration,
Mucciardi and Benassi 2023) to enrich the initial matrix and consider other dimensions. Another interesting aspect is to consider migratory cohorts by the year of the first arrival with the introduction of a longitudinal approach that is particularly effective in the study of integration. In this regard, it is important to remember how the differentiation between the different foreign communities can also be linked to the different phases of the migratory process (
Casacchia et al. 1999). From a statistically methodological point of view, considering the communal variance in bidimensional matrixes in a more appropriate way (i.e., using a multiway approach, for example, the Statis method (
Lavit et al. 1994)) could be important. New research into these topics is currently in progress. In this respect, it is also important to carry out analyses that include social indicators of integration to study the connection between the settlement models and social integration patterns. From this point of view, it would be important to have more detailed data at the territorial level, which would also allow for analysis at the sub-municipal level. The spatial patterns in the immigrant presence in urban places and their relations with socioeconomic integration have been the focus of many researchers since the pioneering work of the social scientists at the Chicago School in the first half of the 20th century (
Park et al. 1925;
Zorbaugh 1929;
Gordon 1964). However, most of these studies consider integration within metropolitan areas as vantage points to examine the relationships between spatial segregation, often at the neighbourhood scale, and paths towards integration or what they defined as “assimilation”. In this sense, the present work can be considered as a broad framework within which to develop studies on specific areas and populations. The data that were used have the advantage of offering a description of the entire national territory but do not allow us to delve deep into the sub-municipal level. With the data from the new permanent census that ISTAT is carrying out, analyses with greater territorial detail will be possible. The census data could also provide information on migrants, which would be useful for understanding various dynamics (for example, the peculiarities of the Chinese and Ukrainian communities), such as educational qualifications, employment status, and family status, and certainly useful for refining the analysis. Instead, the study of relational aspects or participation can only be left to ad hoc surveys, which, however, hardly have territorial detail and broad coverage at the same time. Qualitative studies on integration at a disaggregated territorial level could also be useful to better understand the dynamics between the various factors that come into play in the complex dynamics of integration at a different territorial scale (
Kreichauf 2015). The complexity of the phenomena of the integration and territorial distribution of migrants undoubtedly requires not only a multidisciplinary approach but also a multi-source and multi-technique one. The use of studies based on different techniques and approaches will allow for a better understanding of the dynamics that are taking place.


