Article

Analysis of Location and Spatial Distribution of Elderly Women Victims of Gender Violence

by
Carlos Ferrás
1,*,
María José Ginzo Villamayor
2 and
Yolanda García
3
1
Mujeres Vulnerables Lab, Institute of Studies and Development of Galicia (IDEGA), University of Santiago de Compostela, 15782 Santiago de Compostela, Spain
2
Department of Statistics and Operational Research, University of Santiago de Compostela, 15782 Santiago de Compostela, Spain
3
Faculty of Education and Social Work, University of Vigo, 32004 Ourense, Spain
*
Author to whom correspondence should be addressed.
Soc. Sci. 2023, 12(2), 72; https://doi.org/10.3390/socsci12020072
Submission received: 21 October 2022 / Revised: 28 December 2022 / Accepted: 16 January 2023 / Published: 30 January 2023
(This article belongs to the Special Issue Violence, Victimization and Prevention)

Abstract

:
Little is known about abuse and violence against elderly women, as well as prevention and intervention strategies. We present the results of an investigation that has as its objective the elaboration of the Location Map of elderly women victims of gender violence, analyzing their territorial distribution in the specific case of the Autonomous Community of Galicia, Spain, and its relationship with environmental, social, and territorial variables. The results of our research on the location and distribution of the rates of elderly women victims of gender violence show its direct relationship with low demographic density, aging, and dependency, which is associated with disabled people. The mapping resulting can facilitate the territorial planning of social and health services aimed at elderly women in rural areas. The interquartile classification makes it possible to delimit areas of intervention at a spatial level, differentiating those municipalities with the highest and lowest prevalence.

1. Introduction

Elder abuse is a social problem usually considered an essentially private matter (Risco et al. 2005), and in this context, women can be victims of violence throughout their lives. Gender inequalities throughout life often make women more vulnerable to violence, abuse, and poverty in old age than men (Choi et al. 2017). They are women who suffer an intersectional stigma, which is a discrediting attribute that places them in a situation of inferiority and generates shame and dissatisfaction; it is a stigma that, in elderly women, refers to the combination of prejudices towards age, gender, and sexuality (Crockett et al. 2018).
Elderly women can live without being aware of the abuse and violence they receive from their current or past partners (Carmona-Torres et al. 2018; World Health Organization 2013). While some elderly women may not be aware that their experiences are considered violence or abuse, many may be. Still, social norms, socioeconomic status, and other factors may prevent them from publicly acknowledging or escaping their situation. Little is known about abuse and violence against these elderly women, as well as prevention and intervention strategies based on previous research (Brownell 2015; Bows 2018; Bows and Westmarland 2017). The development of effective and culturally appropriate prevention interventions for elderly women who experience sexual abuse requires a more nuanced understanding of the dynamics of culture (Bourey et al. 2015; Alvarez et al. 2021) and the socio-territorial values of the rural and urban types.
The gender violence suffered by elderly women is classified as invisible because it is hidden (Heidari 2016; Sleap 2017), and there are no specific social care services for them, despite having been victims during their lives (Heidari 2016; Sleap 2017; Meneses Falcón et al. 2018). In Spain, 40% of battered women of that age have suffered violence from their partner or ex-partner for more than 40 years; 27% from 20 to 30 years (Ministerio de la Presidencia, Relaciones con las Cortes e Igualdad 2019). In Spain, there are significant differences in gender violence in relation to age (Ministerio de Igualdad 2020); it is stated that women aged 65 and over have resorted to formal support services to a lesser extent than younger women who less often speak with the people around them about the violence suffered than other women. Elderly women not only ask for less help but also have more difficulty recognizing violence, not knowing where to ask for help, or feeling that there is no way out of their situation (Ministerio de Igualdad 2020; Luoma et al. 2011; Meyer et al. 2020; Straka and Montminy 2006).
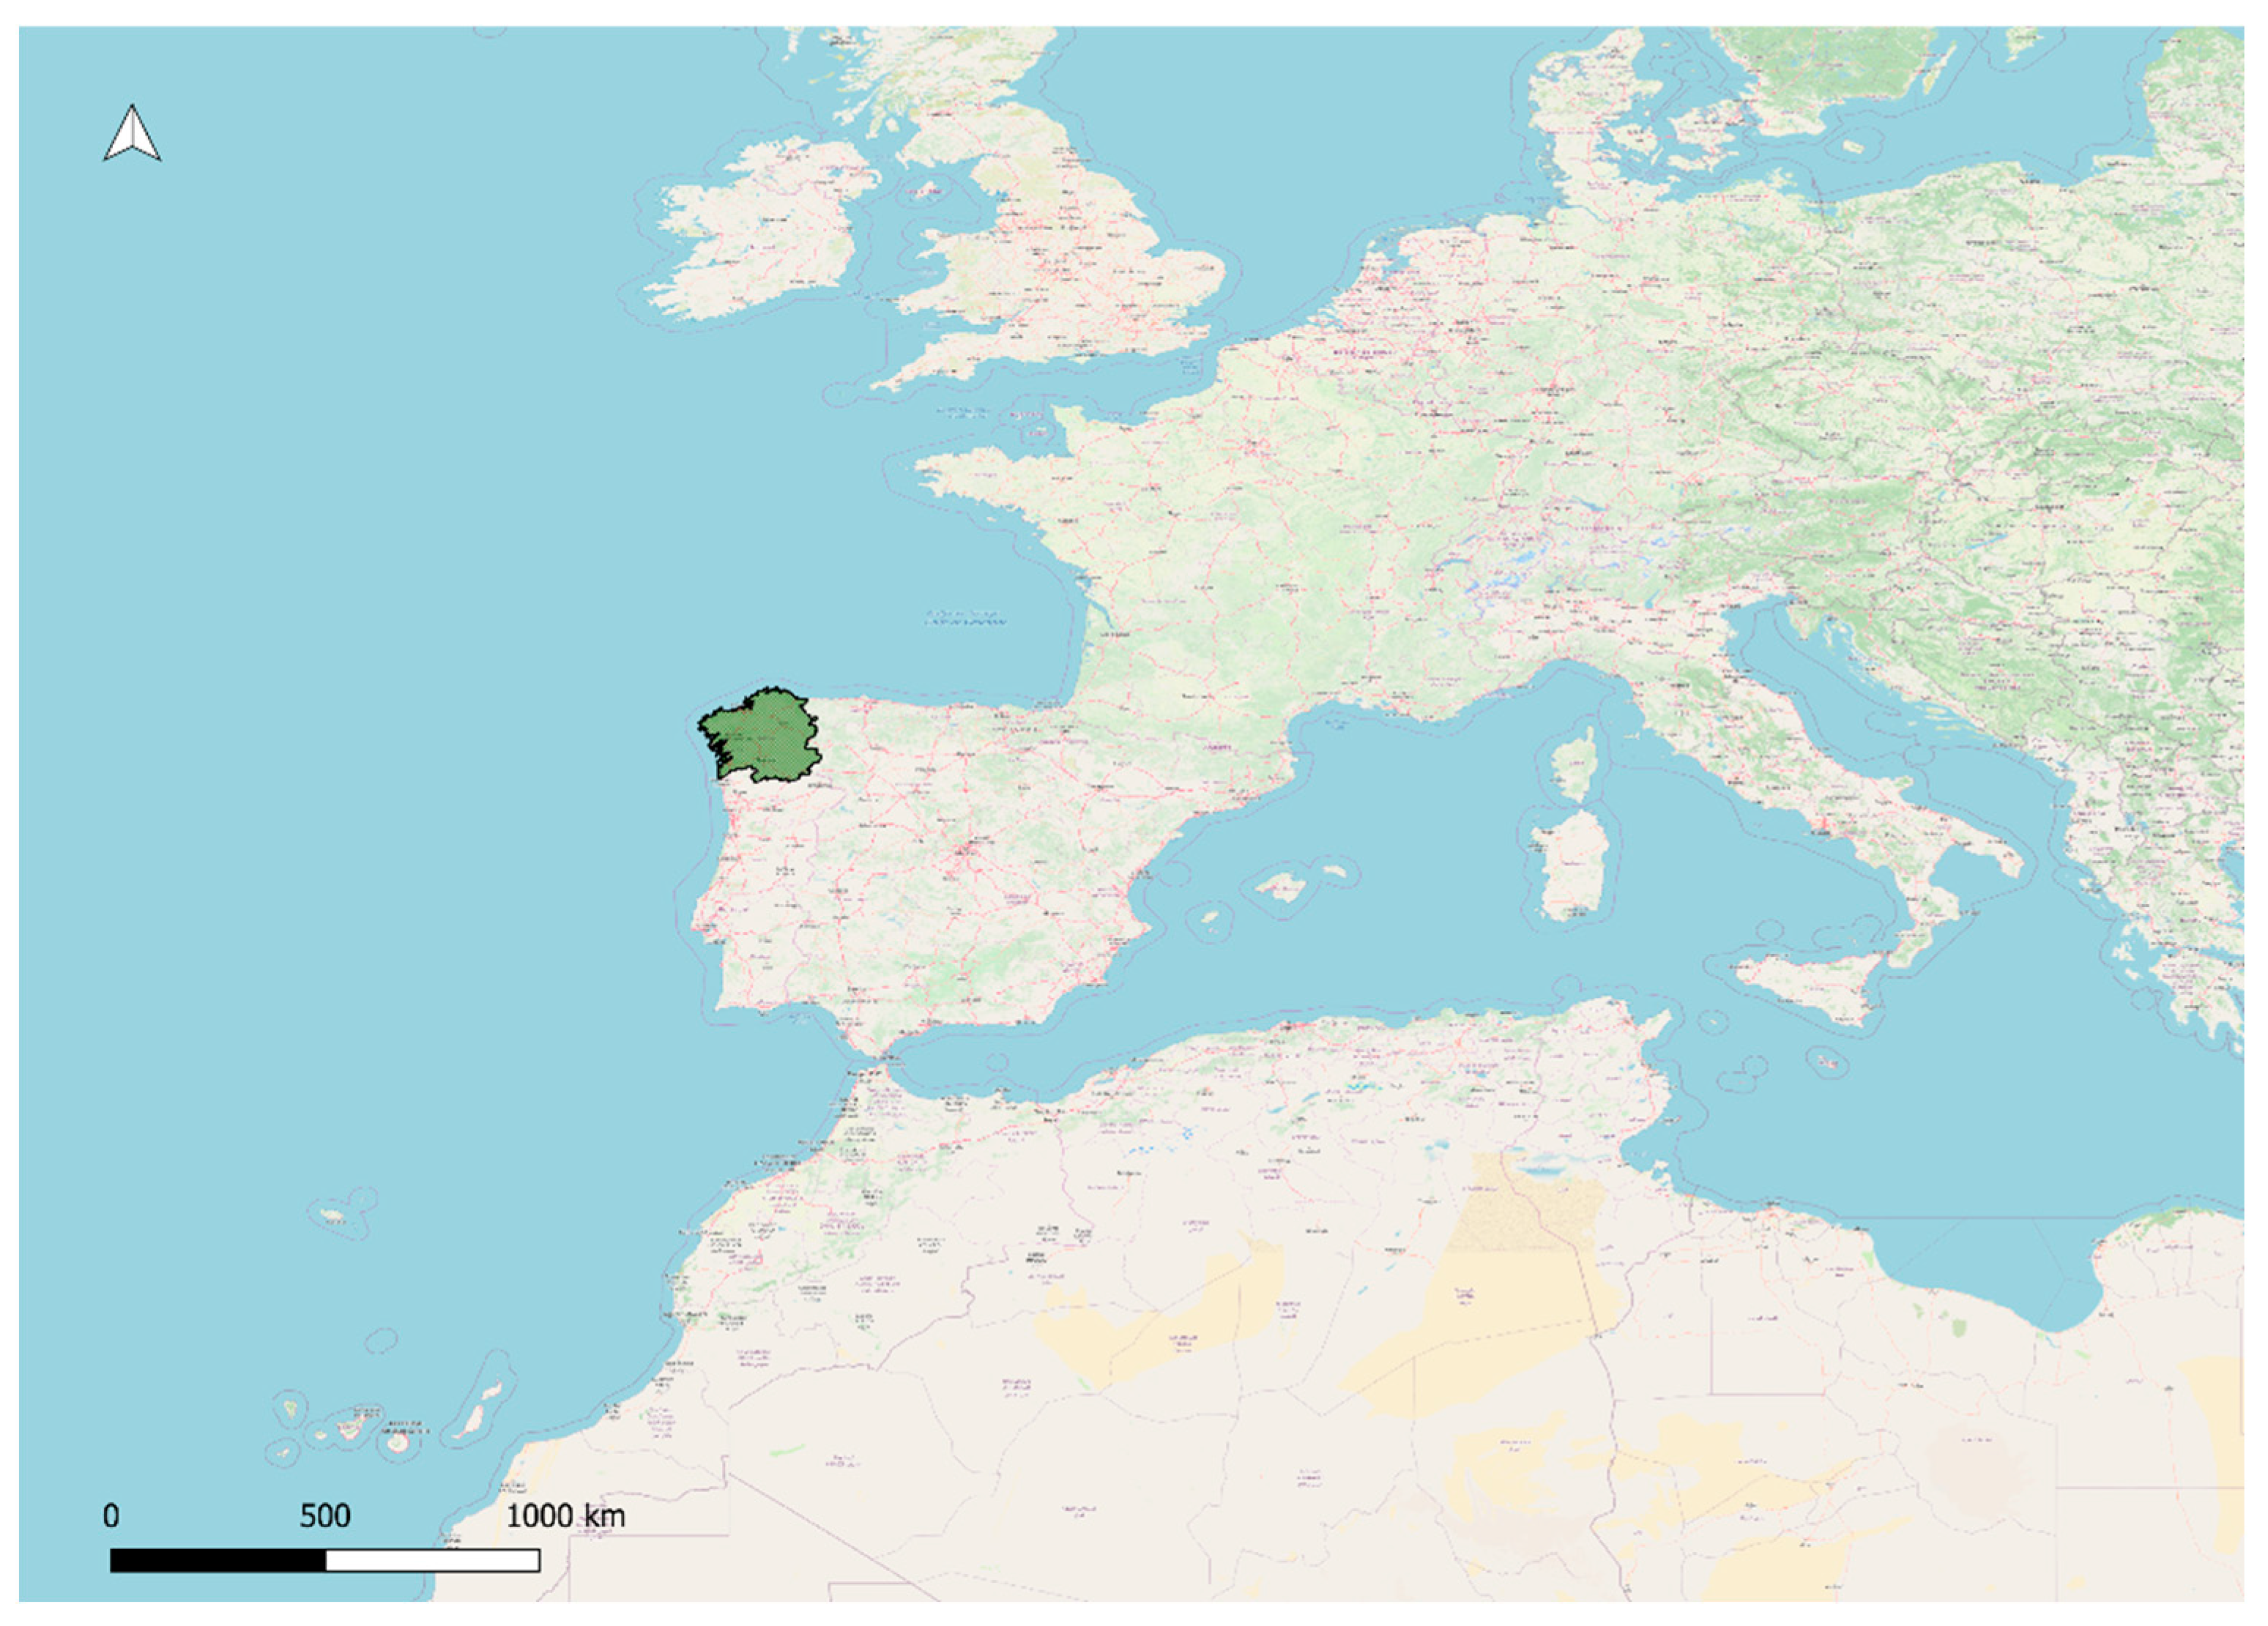
In this article, we present the results of a research that aims to prepare the Location Map of elderly women victims of gender violence, analyzing their territorial distribution in the specific case of the Autonomous Community of Galicia, Spain (Figure 1), and their relationship with environmental, social, and territorial variables. With this map, we want to provide empirical data and research results that help and/or facilitate the territorial planning of social services aimed at elderly women who are victims of gender violence. Galicia is characterized, unlike other Spanish regions, by the absence of a metropolis dominating the territory. Indeed, the urban network is made up of seven main cities (the four provincial capitals A Coruña, Pontevedra, Ourense, and Lugo, the political capital Santiago de Compostela, the industrial cities Vigo and Ferrol, and other small towns. The population is concentrated in two principal areas: from Ferrol to A Coruña on the northern coast, and in the Rías Baixas region in the southwest, including the cities of Vigo, Pontevedra, and the interior city of Santiago de Compostela. There are smaller populations around the interior cities of Lugo and Ourense. The political capital is Santiago de Compostela, in the province of A Coruña. Vigo, in the province of Pontevedra, is the largest municipality in Galicia and the most populated city.

2. Materials and Methods

The social and demographic data used come from the Municipal Register of Inhabitants for the year 2021, which is the continuous record of the Spanish population, available from official statistical bodies (Statistics National Institute, https://www.ine.es/, accessed on 4 September 2022), and the official statistics of the General Council of the Justice (https://www.poderjudicial.es/cgpj/es/Poder-Judicial/Consejo-General-del-Poder-Judicial/, accessed on 4 September 2022) of the Ministry of Justice of the Government of Spain.
We start from the fact that there are no data in official records on elderly women who suffer gender violence or on their location and geographical distribution. We have consulted the records of complaints of gender violence collected in the statistics of the Ministry of Justice, the records of requests for help in the municipal social services from the consultation of the Unified Information System of Social Services (https://inclusio.gva.es/es/web/s.sociales/siuss, accessed on 4 September 2022), and the help request records of the Women’s Assistance Centers (CIM); in all of them, the data collected are very scarce and do not allow statistical analysis. We were able to verify that, in Spain, due to the lack of data, we are facing a type of hidden gender violence, fully coinciding with the statement in this regard by Bridget Sleap (2017) when considering gender violence against elderly women as a type of “invisible violence”.
Consider index i = 1 , , n for denoting a certain geographical region, for example, a council in a region, R . For the collection of regions i = 1 , , n considered as a whole, t o t a l P o p denotes the total population size ( t o t a l P o p = i = 1 n t o t a l P o p i ) . These regions can be joined for administrative issues in other larger ones, giving rise, for example, to judicial districts, d , d < i . If d = 1 , , m denotes the judicial districts of a certain geographical region l = 1 m d l = R and l = 1 m d l = . Each municipality, i , belongs to a single judicial district, d .
To produce spatial data that would allow us to analyze the location and distribution of these women, we followed a process of statistical inference:
1. We start from the general fact that in Spain in 2019, 23.4% of women over 65 years of age suffered or were suffering gender-based violence by their current or past partners. Said data are calculated from the results obtained in the macro-survey on gender violence that is conducted annually in Spain (Ministerio de Igualdad 2020). It is a direct survey of 10,000 Spanish women conducted by the Center of Sociological Research (CIS) (https://www.cis.es/, accessed on 4 September 2022) and the Ministry of Equality of the Spanish Government. This survey follows sample selection criteria at a territorial level with a proportional stratification by age groups and demographic size of the municipalities at the level of the entire Spanish territory.
2. We obtained data on the total number of women over 64 years of age at the municipal level in 2021 from the records of the composition of the population by age, which was collected in the Municipal Register of Inhabitants, and we proceeded with the calculation of the percentage of women over 64 years of age that we estimate are or have been victims of gender-based violence; calculating 23.4% of the total number of elderly women residing in each municipality.
3. For a municipality, i , the percentage of elderly women is obtained ( p e r O W i ) which is defined as the ratio between the number of women 64+ years old ( N W o 64 ) and the total number of women ( t o t a l P o p W i ):
p e r O W i = ( N W o 64 t o t a l P o p W i ) × 100 ,   with   i = 1 , , n .
4. For a municipality, y , the percentage of foreigners ( p e r F o i ) is obtained as the ratio between the number of foreign inhabitants ( p o p F o ) over the total population ( t o t a l P o p i ):
p e r F o i = ( p o p F o t o t a l P o p i ) × 100 ,   with   i = 1 , , n .
5. Social protection actions are obtained per inhabitant ( s o c P r o A c P I ) as the ratio between social protection and social promotion actions by the municipality, i , (thousand euros) ( s o c P r o A c P C i ) between the number of inhabitants of the municipality, i :
s o c P r o A c P I = s o c P r o A c P C i t o t a l P o p i ,   with   i = 1 , , n .
6. Complaints of gender-based violence are calculated by the municipality, i ( N C G V C _ i ) as the ratio between the number of women ( t o t a l P o p W _ i ) and the number of complaints of gender-based violence by judicial district ( N D V G J d ) divided by the number of women by judicial party ( t o t a l P o p W d )
N C G V C i = t o t a l P o p W i × N D V G J d t o t a l P o p W d ,   with   i = 1 , , n ; d = 1 , , m .
7. At the municipal level, we calculated the rate of elderly women who are victims of gender-based violence, R O W V G V , by their current or past partner throughout their lives: where NWo64vgv is the number of women over 64 who are victims of gender-based violence and totalPop_i, is the total population:
R O W V G V = N W o 64 v g v × 1000 t o t a l P o p i ,   with   i = 1 , , n .
8. Disaggregated data at the municipal level were mapped from a Geographic Information System with the statistical software R (R Core Team 2020). We proceeded with the spatial statistical treatment, with a statistical analysis of the interquartile intervals (intervals between one quartile and the next) and with their cartographic representation.
9. For each interquartile interval, we proceeded to calculate social and demographic indicators and indices: on the one hand, those referring to the volume of the total population, demographic density ( Inhabitants / Km 2 ), number of municipalities, the total number of women, number of women over 64 years of age, young population under 16 years of age, population over 64 years and the number of foreign inhabitants; on the other hand, indicators referring to the number of social protection actions and the number of complaints of gender violence.
10. We used the I Moran autocorrelation1 and the p -value for the spatial distribution of the analyzed variables and the graphic representation on a logarithmic scale of the relationship between population density and R O W V G V at the municipal level (Equation (5)).
11. Moran’s I can be used either globally, i.e., to determine the extent of Spatial autocorrelation throughout a complete geographic area (in this case, Galicia), or locally, i.e., to determine the degree of Spatial autocorrelation within councils of the entire geographic area.
Two localities, i and j , are connected if, and only if, the square of the distance between i and j is less than the sum of the squares of their distances to any other locality l . It is possible to use the global Moran index to estimate the autocorrelation coefficient, defined as:
i j = n i = 1 n j = 1 n w i j ( R O W V G V i R O W V G V ¯ ) ( R O W V G V j R O W V G V ¯ ) W n i = 1 n ( R O W V G V i R O W V G V ¯ ) 2 ,   with   i , j = 1 , , n ,
where R O W V G V i and R O W V G V j are R O W V G V at the i -th and j -th locality, R O W V G V ¯ is the mean of R O W V G V i   ( i = 1 , , n ) , across the i = 1 , , n localities, w i j is equal to 1 for all the pairs of localities falling in the studied distance class and equal to 0 for all the other pairs, and W n is the sum of all w i j values in that distance class, which is actually the cardinal of regions neighbors.
In this particular measure, the distance used to create the matrix M is given by ( R O W V G V i R O W V G V ¯ ) ( R O W V G V j R O W V G V ¯ ) where R O W V G V i   and   R O W V G V j are the values of the variable R O W V G V in the areas i and j , respectively, being R O W V G V ¯ is the arithmetic mean of all the values of the areas to study.
Although it is one of the oldest measures, it remains one of the most widely used measures of Spatial autocorrelation by comparing the value of R O W V G V in the i area with the value of R O W V G V in all other j ( j i ) areas.
12. For the spatial and cartographic analysis, we proceeded with delimitation of 4 geographic areas of incidence from the quartiles of the R O W V G V .
In general, a quartile analysis is performed for the study variables.
Quantiles are cut points dividing the range of a probability distribution into continuous intervals with equal probabilities or dividing the observations in a sample in the same way. There is one fewer quantile than the number of groups created. Common quantiles have special names, such as quartiles (four groups), deciles (ten groups), and percentiles (one hundred groups); therefore, a quartile is a type of quantile that divides the number of data points into four parts, or quarters, of more-or-less equal size.
The interquartile range (IQR) is a measure of statistical dispersion, which is the spread of the data.
The IQR may also be called the midspread, middle 50%, fourth spread, or H-spread.
It is defined as the difference between the 75th and 25th percentiles of the data.
The dataset is divided into quartiles o calculate the IQR, or four ranks—ordered even parts via linear interpolation.
These quartiles are denoted by Q1 (also called the lower quartile), Q2 (the median), and Q3 (also called the upper quartile).
The lower quartile corresponds with the 25th percentile, and the upper quartile corresponds with the 75th percentile, so IQR = Q3 − Q1.

3. Results

We have developed an interquartile analysis of the Rate of Women over 64 years of age who are victims of gender-based violence by the municipality (see Figure 2). Table 1 shows the distribution in Galicia and provinces (4) of the number of municipalities (313) and judicial districts (45). The average population per municipality is 8632 inhabitants, with the minimum at 215 and the maximum at 296,692. For the judicial districts, the average population is 10,529, the minimum is 969, and the maximum is 85,317.
We have arranged the 313 municipalities of Galicia in quartiles based on the values of the Rate of Women over 64 victims of gender violence by their current or past partner ( R O W V G V ) (Equation (5)). The interquartile groups Q2, Q3, and Q4 have 78 municipalities each, and Q1 has 79 (see Table 2), sorted by population size; Q1 will be the municipalities with the smallest populations and Q4 with the largest populations.
The comparative cartography of Figure 2 allows us to observe the spatial distribution of the R O W V G V and the variables analyzed. We observe that the most urban, densely populated (above Q3 in density), and least aged2 municipalities in western Galicia are those that present the lowest R O W V G V , with the highest being in rural municipalities with smaller, very aged, and larger populations. Dependent population3: precisely the municipalities in the interior of Galicia, especially in the provinces of Lugo and Ourense, which encompass large territorial areas with the highest R O W V G V values. The municipalities with intermediate values Q2 and Q3 are located and distributed as a spatial transition between the areas of higher and lower incidence of the R O W V G V (Equation (5)).
On the other hand, regarding the results of the descriptive statistical analysis, they confirm that the R O W V G V is lower in the municipalities with a larger demographic size than in the smaller ones. There is a progressive increase in the R O W V G V (Equation (5)) between the Q1 (quartile: mean: 29, 27, SD = 3.91 IQR = 4.77) and Q4: mean: 58.55 SD = 6.00 IQR = 7.41 (see Table 3). Municipalities Q1 are the most urbanized and have a higher average number of inhabitants (20,088, Table 2, similar results in Table 4), compared to municipalities Q4, which are the most rural and have fewer average inhabitants (1532). This trend of progressive decrease in the R O W V G V values from the most populated and urbanized municipalities to the least populated and rural ones is maintained in the population density variables (Q1: mean: 335.49 SD = 351, 61 IQR = 336.70, Q4: mean: 20.08 SD = 11.52 IQR = 14.18, ordered from highest to lowest population density) (see Table 5).
R O W V G V increases with dependency and aging. Most urban municipalities with the highest population density have a younger and less dependent population; that is, the municipalities with the largest population and the most urban have lower R O W V G V than the less populated and rural ones. Dependence: Q1: mean: 54.64 SD = 4.92 IQR = 6.91; Q4: mean: 97.58 SD 12.16 IQR: 15.13 and the same is observed regarding aging: Q1: mean: 134.14 SD = 35.35 IQR = 40.47; Q4: mean: 681.59 SD = 202.64 IQR = 270.75, ordered from highest to lowest values of the indices dependency and aging (see Table 6 and Table 7).
Regarding feminization in the demographic structure, we did not observe differences in the R O W V G V between urban and rural municipalities; women predominate both in municipalities Q1 and Q4, with values of 51.80 and 50.71%, respectively, of their total population. However, if we observe the R O W V G V data in relation to the percentage of women over 64 years of age, urban–rural differences are evident. The urban municipalities in Q1 have an average of 24.56%, and the municipalities in Q4 have an average of 49.63% of the female population over 64 years of age, which determines its highest R O W V G V .
Table 8 shows the descriptive statistics for the percentage of elderly women ( p e r O W i ) (Equation (1)) distributed among the quartiles of the rate R O W V G V .
On the other hand, we have also observed that the R O W V G V in relation to the number of foreigners is lower in the Q1 municipalities, more urban, and with a greater number of foreigners than in the more rural Q4 municipalities with fewer foreigners (Q1: mean: 3.83 SD = 2.15 IQR = 2.25, Q4: mean: 2.72 SD = 1.72 IQR = 1.79, ordered from highest to lowest values of the number of foreigners) (see Table 9).
Regarding social protection actions measured in the expenditure of public money per inhabitant (Equation (3)), urban Q1 municipalities have lower results than rural Q4 municipalities (Q1: 0.12 SD = 0.05 IQR = 0.05; Q4 0.15 SD = 0.08 IQR = 0.07, ordered from lowest to highest values of social protection actions) (see Table 10).
Regarding the number of complaints of gender violence (Equation (4)), we observe that the most urban Q1 municipalities stand out with the highest number of complaints per inhabitant and with a great difference with respect to the rural Q4 municipalities (Q1: mean: 553.43 SD = 1372.66 IQR = 382.50, Q4: mean: 26.35 SD = 17.15 IQR = 22.75 ordered from highest to lowest values of the number of complaints of gender violence) (see Table 11).
Therefore, the data show that gender violence against elderly women has a comparatively higher incidence in small rural municipalities than in urban ones, which is associated with greater aging, feminization at advanced ages, a greater presence of socially dependent people, and low population density. However, this incidence does not correspond to the data on the number of complaints and the data on the presence of foreign populations, which are higher in urban areas.
The inversely proportional relationship between R O W V G V and population density is confirmed (see Figure 3). Gender-based violence against women over 64 years of age increases as population density decreases. In Figure 4, the blue line is the regression line of the R O W V G V on density; that is, it allows us to explain the R O W V G V as a function of density. The red line is the regression line of the R O W V G V on the logarithm of the density. From a statistical point of view, the model explains 55% of the variability of the variable R O W V G V .
Finally, it is important to point out that the Spatial autocorrelation of I Moran and the p-value show spatial distribution of the R O W V G V (I Moran 0.5404 p-value 0.0000) and between the R O W V G V with all the variables studied, being to a greater extent measured with the variables of the number of dependent persons and the percentage of women over 64 years of age and aging (see Figure 5, and Table 12).

4. Discussion

The results of our research on the location and distribution of the rates of elderly women victims of gender violence show their direct relationship with low demographic density, aging, and dependency, which is associated with disabled people. The resulting mapping can facilitate the territorial organization of social and health services aimed at elderly women in rural areas. The interquartile classification makes it possible to delimit areas of intervention at a spatial level, differentiating those municipalities with the highest and lowest prevalence.
Elderly women who suffer or have suffered gender-based violence in rural areas are determined by isolation, stigma, and the social and family environment (Camarero and Sampedro 2008). In such environments, disabled women are three times more likely to experience violence of any kind and have long-term mental health problems and self-destructive behavior (Muster 2021). In rural municipalities with low demographic density, elderly women who are victims of violence often have limited access to resources, isolation, difficulty in identifying this type of violence, suffer abuse by their partners, stigmatization, or physical barriers (Lorente and Castro 2009). These low-density rural municipalities correspond to quartile Q4 of the R O W V G V map of Galicia.
The Spanish government’s studies on gender-based violence in rural areas state that it is necessary to map such violence in order to direct resources to those areas where they are most needed (Ministerio de Medio Ambiente y Medio Rural y Marino 2011; Ministerio de Igualdad 2021; Luoma et al. 2011), and the methodology developed in our research that allows mapping areas of higher or lower prevalence of R O W V G V could facilitate this task.
A growing demographic masculinization is taking place in rural areas due to the abandonment and emigration of women (Martínez García and Camarero 2015) and the so-called “invisible violence” (Sleap 2017) suffered by elderly rural women who do not emigrate (Martínez García 2011) contributes to this. It is violence that, above all, needs to be made visible (Flueckiger 2008), and therefore, anticipatory prevention programs designed from a territorial perspective are necessary in order to direct them, to a greater extent, toward those places where they are most necessary. It is evident that in order to make this type of violence visible, it is necessary to generate data and know its location and distribution, that is, to know where, when, and why in that place and not in another.
We recommend the implementation of services that are specifically tailored to the needs of older rural women (Pathak et al. 2019). Professionals working in front-line social services where elderly women are commonly seen should be trained to identify and respond to gender-based violence in a manner appropriate to their social and cultural environment (Celdrán 2013; Meyer et al. 2020), for which the territorial approach and mapping of gender violence are configured as valuable tools. We can conclude it is especially important to know the location and distribution of gender-based violence to intervene and prevent such violence; only in this way can the resources and services to deal with it be efficiently planned.
However, more research is needed on why violence against elderly women is not reported (Crockett et al. 2015), as well as research with qualitative and quantitative data on the social and environmental determinants present in this type of violence (Straka and Montminy 2006; Crockett et al. 2015).

5. Conclusions

The location of the greater or lesser R O W V G V is determined by aging and dependency as dominant features in the demographic analysis at the municipal level. This means that we have observed that the greater the aging and dependency, the greater the R O W V G V , which are characteristics of rural municipalities that are farthest from cities.
We must also highlight the inverse linear correlation between population density and R O W V G V (−0.31, which, if we take the logarithm, is −0.74). We found that the lower the demographic density, the higher the R O W V G V . If we establish the direct relationship between rural space and low density, the arguments are reinforced to proceed with the association between gender violence, rural spaces, dependency, and aging.
In short, gender-based violence against elderly women is hidden in the statistics and is more prevalent in rural and low-density areas. Prevention and case identification interventions are needed in these areas. There is a lack of spatial data in the official statistics on gender violence, which does not allow the definition of policies for intervention and prevention of gender violence at the territorial level.
The correct territorial planning of social services for the care of elderly women who are victims of gender-based violence is necessary, which allows technical and human resources to be efficiently directed towards those places with the highest prevalence and social care needs for these elderly women. It is necessary to address the mapping of gender violence to plan prevention and social intervention actions. We believe that the territorial approach and cartography must be present in the organization of social services.

Author Contributions

C.F., M.J.G.V., and Y.G. discussed the results, wrote the manuscript and contributed to the final manuscript. All authors have read and agreed to the published version of the manuscript.

Funding

Work of Mª José Ginzo has been supported by the Project PID2021-124030NB-C32 from the Spanish State Research Agency (AEI), the Competitive Reference Groups 2021–2024 (ED431C 2021/24) from the Xunta de Galicia. Carlos Ferrás and Yolanda García have been supported by Project 2021-PU005 of the University of Santiago de Compostela with funding from the State Pact against Gender Violence of the Government of Spain.

Institutional Review Board Statement

Not applicable.

Informed Consent Statement

Not applicable.

Data Availability Statement

Not applicable.

Conflicts of Interest

The authors declare no conflict of interest.

Notes

1
Moran’s test statistic measures the correlation between attributes, in this case, R O W V G V , at each location i in a study area and some summary (usually the statistical mean) of the values from neighboring locations v .
2
Aging index: ratio of the population over 64 years old to the population under 20 years old expressed as a percentage, i.e., the number of people aged 65 and over for every 100 people under 20 years old.
3
Overall dependency ratio: ratio between the potentially dependent population groups (population under 15 and over 64) and the potential working-age population group (population between 15 and 64).

References

  1. Alvarez, Carmen, Maria Lameiras-Fernandez, Charvonne N. Holliday, Bushra Sabri, and Johns Campbell. 2021. Latina and Caribbean Immigrant Women’s Experiences with Intimate Partner Violence: A Story of Ambivalent Sexism. Journal of Interpersonal Violence 36: 3831–54. [Google Scholar] [CrossRef] [PubMed]
  2. Bourey, Christine, Whitney Williams, Erin Elizabeth Bernstein, and Rob Stephenson. 2015. Systematic review of structural interventions for intimate partner violence in low- and middle-income countries: Organizing evidence for prevention. BMC Public Health 15: 1165. [Google Scholar] [CrossRef] [Green Version]
  3. Bows, Hannah. 2018. Sexual violence against older people: A review of the empirical literature. Trauma, Violence, and Abuse 19: 567–83. [Google Scholar] [CrossRef] [Green Version]
  4. Bows, Hannah, and Nicole Westmarland. 2017. Rape of older people in the United Kingdom: Challenging the ‘real rape’ stereotype. British Journal of Criminology 57: 1–17. [Google Scholar] [CrossRef] [Green Version]
  5. Brownell, Patricia. 2015. Negligencia, abuso y violencia contra las mujeres mayores: Definiciones y marcos de investigación. Revista de Salud Pública de Europa Sudoriental (SEEJPH) 1. [Google Scholar] [CrossRef]
  6. Camarero, Luis, and Rosario Sampedro. 2008. ¿Por qué se van las mujeres? El continuum de movilidad como hipótesis explicativa de la masculinización rural. Revista Española de Investigaciones Sociológicas (Reis) 124: 73–105. [Google Scholar] [CrossRef]
  7. Carmona-Torres, Juan Manuel, Pablo Jesús López-Soto, Ana Isabel Coimbra-Roca, Ruth Mary Gálvez-Rioja, Thomas Goergen, and Mª Aurora Rodríguez-Borrego. 2018. Elder Abuse in a Developing Area in Bolivia. Journal of Interpersonal Violence 33: 339–56. [Google Scholar] [CrossRef] [PubMed]
  8. Celdrán, Montserrat. 2013. La violencia hacia la mujer mayor: Revisión bibliográfica. Papeles del Psicólogo 34: 57–64. [Google Scholar]
  9. Choi, Moon, Patricia Brownell, and Stefana I. Moldovan. 2017. International movement to promote human rights of older women with a focus on violence and abuse against older women. International Social Work 60: 170–81. [Google Scholar] [CrossRef]
  10. Crockett, Cailin, Bergen Cooper, and Bonnie Brandl. 2018. Intersectional Stigma and Late-Life Intimate-Partner and Sexual Violence: How Social Workers Can Bolster Safety and Healing for Older Survivors. The British Journal of Social Work 48: 1000–13. [Google Scholar] [CrossRef]
  11. Crockett, Cailin, Bonnie Brandl, and Firoza Chic Dabby. 2015. Survivors in the margins: The invisibility of violence against older women. Journal of Elder Abuse & Neglect 27: 291–302. [Google Scholar]
  12. Flueckiger, Jennifer. 2008. Older Women and Domestic Violence in Scotland. Edinburgh: Edinburgh University Centre for Research into Families and Relationships. [Google Scholar]
  13. Heidari, Shirin. 2016. Sexuality and older people: A neglected issue. Reproductive Health Matters 24: 1–5. [Google Scholar] [CrossRef] [PubMed]
  14. Lorente, Miguel, and Pedro Castro. 2009. Violencia de Género en los pequeños municipios del Estado Español; Madrid: Ministerio de Sanidad, Política Social e Igualdad.
  15. Luoma, Minna-Liisa, Mira Koivusilta, Gert Lang, Edith Enzenhofer, Liesbeth Donder, Dominique Verté, Jolanta Reingarde, Ilona Tamutiene, José Ferreira Alves, Ana João Santos, and et al. 2011. Prevalence Study of Abuse and Violence against Older Women. Results of a Multi-Cultural Survey in Austria, Belgium, Finland, Lithuania, and Portugal. European Report of the AVOW Project. Helsinki: National Institute for Health and Welfare (THL). [Google Scholar]
  16. Martínez García, María Ángeles. 2011. ¿Adónde puedo ir yo?: Violencia de Género en las áreas rurales de Asturias. Ph.D. thesis, UNED Universidad de Estudios a Distancia, Asturias, Spain. [Google Scholar]
  17. Martínez García, María Ángeles, and Luis Alfonso Camarero. 2015. La reproducción de la Violencia de Género: Una lectura desde las áreas rurales. Ager. Revista de Estudios sobre Despoblación y Desarrollo Rural 19: 117–46. [Google Scholar] [CrossRef]
  18. Meneses Falcón, María del Carmen, Antonio Rúa Vieites, María Belén Charro Baena, and Jorge Uroz Olivares. 2018. La violencia de género en la pareja o en la expareja de mujeres mayores de 60 años. Madrid: Universidad Pontificia Comillas ICAI-ICADE, Fundación Luz Casanova. [Google Scholar]
  19. Meyer, Sarah R., Molly E. Lasater, and Claudia García-Moreno. 2020. Violence against older women: A systematic review of qualitative literature. PLoS ONE 15: e0239560. [Google Scholar] [CrossRef] [PubMed]
  20. Ministerio De Igualdad. 2020. Macroencuesta de violencia contra la mujer 2019. Subdirección General de Sensibilización, Prevención y Estudios de la Violencia de Género (Delegación del Gobierno contra la Violencia de Género). Madrid. Available online: https://violenciagenero.igualdad.gob.es/violenciaEnCifras/macroencuesta2015/pdf/Macroencuesta_2019_estudio_investigacion.pdf (accessed on 4 September 2022).
  21. Ministerio de Igualdad. 2021. Mujeres Víctimas de Violencia de Género en el Mundo Rural; Madrid: Delegación del Gobierno Contra la Violencia de Género, 240p.
  22. Ministerio de la Presidencia, Relaciones con las Cortes e Igualdad. 2019. Estudio sobre las mujeres mayores de 65 años víctimas de violencia de género. Available online: https://violenciagenero.igualdad.gob.es/violenciaEnCifras/estudios/investigaciones/2019/pdfs/Estudio_VG_Mayores_65.pdf (accessed on 4 September 2022).
  23. Ministerio de Medio Ambiente y Medio Rural y Marino. 2011. Diagnóstico de la Igualdad de Género en el Medio Rural; Madrid: Ministerio de Medio Ambiente y Medio Rural y Marino, 338p.
  24. Muster, Caroline L. 2021. The Silenced Voices of Hidden Survivors: Addressing Intimate Partner Violence Among Women With Disabilities Through a Combined Theoretical Approach. Affilia 36: 156–66. [Google Scholar] [CrossRef]
  25. Pathak, Neha, Rageshri Dhairyawan, and Shema Tariq. 2019. The experience of intimate partner violence among older women: A narrative review. Maturitas 121: 63–75. [Google Scholar] [CrossRef] [PubMed] [Green Version]
  26. R Core Team. 2020. R: A Language and Environment for Statistical Computing. Vienna: R Foundation for Statistical Computing. Available online: https://www.R-project.org/ (accessed on 4 September 2022).
  27. Risco, Carmen Risco, María del Carmen Paniagua Vicioso, Gloria Jiménez Mendoza, María Dolores Poblador Curtó, Luis Molina Martínez, and Francisco Buitrago. 2005. Prevalence and risk factors of suspected abuse in the elderly population. Medicina Clínica 125: 51–55. [Google Scholar] [CrossRef]
  28. Sleap, Bridget. 2017. Tenemos los mismos derechos. ¿Qué dicen las mujeres adultas mayores sobre su derecho a la no discriminación, a la igualdad, a vivir libres de violencia, abuso y negligencia en la vejez? HelpAge International. Available online: https://www.helpage.org/silo/files/tenemos-los-mismos-derechos.pdf (accessed on 4 September 2022).
  29. Straka, Silvia M., and Lyse Montminy. 2006. Responding to the needs of older women experiencing domestic violence. Violence against Women 12: 251–67. [Google Scholar] [CrossRef] [PubMed]
  30. World Health Organization. 2013. Global and Regional Estimates of Violence against Women: Prevalence and Health Effects of Intimate Partner Violence and Non-Partner Sexual Violence. Available online: http://www.who.int/reproductivehealth/publications/violence/9789241564625/en/ (accessed on 4 September 2022).
Figure 1. Galicia in Spain.
Socsci 12 00072 g001
Figure 2. Rate of women over 64 years of age who are victims of gender-based violence by their current or past partner. Information by municipalities (2020) (Rate per 1000 inhabitants). Own elaboration based on data from the Ministry of Equality and the Center for Sociological Research CIS.
Socsci 12 00072 g002
Figure 3. Population density. Information by municipalities (2020) (Inhabitants/Km2). Source: National Statistics Institute.
Socsci 12 00072 g003
Figure 4. (a) Axis OX population density. Axis OY rates of elderly women as victims of gender violence. (b) Zoom of previous one.
Socsci 12 00072 g004
Figure 5. Aging index. Information by municipalities (2020). Source: National Institute of Statistics. Demographic indicators.
Socsci 12 00072 g005
Table 1. Distribution in Galicia and provinces of the number of municipalities and judicial districts.
Number of MunicipalitiesNumber of Judicial Districts
A Coruña9314
Lugo679
Ourense629
Pontevedra6113
Total Galicia31345
Table 2. Population (inhabitants). Sources: own elaboration based on data from the Galician Institute of Statistics (IGE), Municipal Register of Inhabitants, the year 2021.
MeanSDIQR0%25%50%75%100%n
Q120,08836,238.2512,756.502156411.511,40619,168296,69279
Q210,29430,497.563872.755242758.54457.56631.25247,60478
Q324671570.092176.003841237.751879.53413.75696378
Q41532802.58961.25315971.7513571933389978
Table 3. R O W V G V . Rate of Women over 64 years of age who are victims of Gender Violence by their current or previous partner throughout their lives ( R O W V G V ). Sources: own elaboration based on data from the Galician Institute of Statistics (IGE), Municipal Register of Inhabitants, 2021, General Council of the Judicial Power CGPJ), Ministry of Equality, and Center for Sociological Research CIS.
MeanSDIQR0%25%50%75%100%n
Q129.273.914.7716.8827.3630.3332.1234.4779
Q239.662.994.9134.4737.3840.1042.2943.9778
Q347.962.243.2444.0646.3747.9049.6051.7978
Q458.556.007.4151.9153.8856.8461.2977.0978
Table 4. Women (inhabitants). Sources: own elaboration based on data from the Galician Institute of Statistics (IGE), Municipal Register of Inhabitants, the year 2021.
MeanSDIQR0%25%50%75%100%n
Q110,40619,178.166605.5099324757879852.5156,52879
Q2541116,407.511958.252201404.52296.53362.75132,82878
Q31243821.861074.75186592.259301667361578
Q4777417.03496.75157479.5673.5976.25205578
Table 5. Density (Inhabitants/Km2). Sources: own elaboration based on data from the Galician Institute of Statistics IGE, Municipal Register of Inhabitants, the year 2021.
MeanSDIQR0%25%50%75%100%n
Q1335.49351.61336.704.10132.70263.40469.402643.3079
Q2189.76739.3866.703.5035.2358.80101.936454.8078
Q328.1019.3818.234.2016.4022.0534.6390.0078
Q420.0811.5214.183.1011.8817.4526.0558.9078
Table 6. Aging Index (people aged 65 or over for every 100 under 20). Sources: own elaboration based on data from the Galician Institute of Statistics IGE, Municipal Register of Inhabitants, the year 2021.
MeanSDIQR0%25%50%75%100%n
Q1134.1435.3540.4757.25110.85130.30151.32269.2779
Q2253.8477.4094.29148.26194.14236.09288.43501.4778
Q3433.22132.57168.52242.14331.55395.76500.07908.6378
Q4681.59202.64270.75400.35538.33624.71809.081392.3378
Table 7. Dependency Index (ratio of the population under 15 years of age to the population over 64 years of age). Sources: own elaboration based on data from the Galician Institute of Statistics (IGE), Municipal Register of Inhabitants, the year 2021.
MeanSDIQR0%25%50%75%100%n
Q154.644.926.9142.7351.3254.1758.2367.9979
Q267.095.426.2055.3063.3767.2169.5779.7178
Q378.756.177.9468.6774.4078.3782.34100.8378
Q497.5812.1615.1375.3188.5596.04103.68130.7078
Table 8. Percentage elderly women. Sources: own elaboration based on data from the Galician Institute of Statistics (IGE), Municipal Register of Inhabitants, the year 2021.
MeanSDIQR0%25%50%75%100%n
Q124.563.324.3013.9023.0025.2527.3029.6979
Q233.453.044.7927.8231.0533.5635.8440.4578
Q341.292.643.8136.2439.4841.1543.2947.9178
Q449.634.896.1643.4045.9348.2252.0964.7178
Table 9. Percentage of foreign people. Sources: own elaboration based on data from the Galician Institute of Statistics (IGE), Municipal Register of Inhabitants, the year 2021.
MeanSDIQR0%25%50%75%100%n
Q13.832.152.250.872.483.484.7311.5479
Q22.922.342.350.301.282.323.6214.8878
Q32.682.241.610.551.602.253.2014.8878
Q42.721.721.790.501.632.383.4211.9978
Table 10. Social protection actions per inhabitant. Sources: own elaboration based on data from the Galician Institute of Statistics (IGE), Municipal Register of Inhabitants, the year 2021, General Council of the Judiciary (CGPJ).
MeanSDIQR0%25%50%75%100%n
Q10.120.050.050.040.090.110.140.4279
Q20.140.040.050.050.110.140.160.2778
Q30.160.070.090.050.110.160.200.4278
Q40.150.080.070.050.110.150.180.4278
Table 11. Complaints of Gender Violence by a municipality. Sources: own elaboration based on data from the Galician Institute of Statistics (IGE), Municipal Register of Inhabitants, the year 2021, General Council of the Judiciary (CGPJ).
MeanSDIQR0%25%50%75%100%n
Q1553.431372.66382.502.00146.00266.00528.5011,818.0079
Q2263.401022.7384.756.0046.2586.00131.008473.0078
Q341.8228.3936.005.0019.0033.5055.00144.0078
Q426.3517.1522.755.0014.0020.0036.7579.0078
Table 12. Spatial autocorrelation of I and the p-value.
I Moranp-Value
Total population0.08360.0015
Female population0.07850.0027
Complaints of gender violence0.07050.0032
Density0.10550.0000
Aging Index0.53080.0000
Dependency Index0.51690.0000
R O W V G V 0.54040.0000
Number of women 64+ years0.53760.0000
Social protection social0.07310.0053
Number of Women 64+ victims of gender-based violence on the part of current couple0.04840.0387
Number of women 64+ victims of gender-based violence by their partner throughout their lives0.04840.0386
Disclaimer/Publisher’s Note: The statements, opinions and data contained in all publications are solely those of the individual author(s) and contributor(s) and not of MDPI and/or the editor(s). MDPI and/or the editor(s) disclaim responsibility for any injury to people or property resulting from any ideas, methods, instructions or products referred to in the content.

