
Perceived Organizational Culture and Turnover Intentions: The Serial Mediating Effect of Perceived Organizational Support and Job Insecurity


Abstract
:1. Introduction
1.1. Perceived Organizational Culture
1.2. Turnover Intentions
1.2.1. Perceived Organizational Culture and Turnover Intentions
1.3. Perceived Organizational Support
1.3.1. Perceived Organizational Culture and Perceived Organizational Support
1.3.2. Perceived Organizational Support and Turnover Intentions
1.4. Job Insecurity
1.4.1. Perceived Organizational Support and Job Insecurity
1.4.2. Job Insecurity and Turnover Intentions
1.5. Perceived Organizational Culture, Perceived Organizational Support, Job Insecurity and Turnover Intentions
2. Methods
2.1. Procedure
2.2. Participants
2.3. Data Analysis Procedure
2.4. Instruments
3. Results
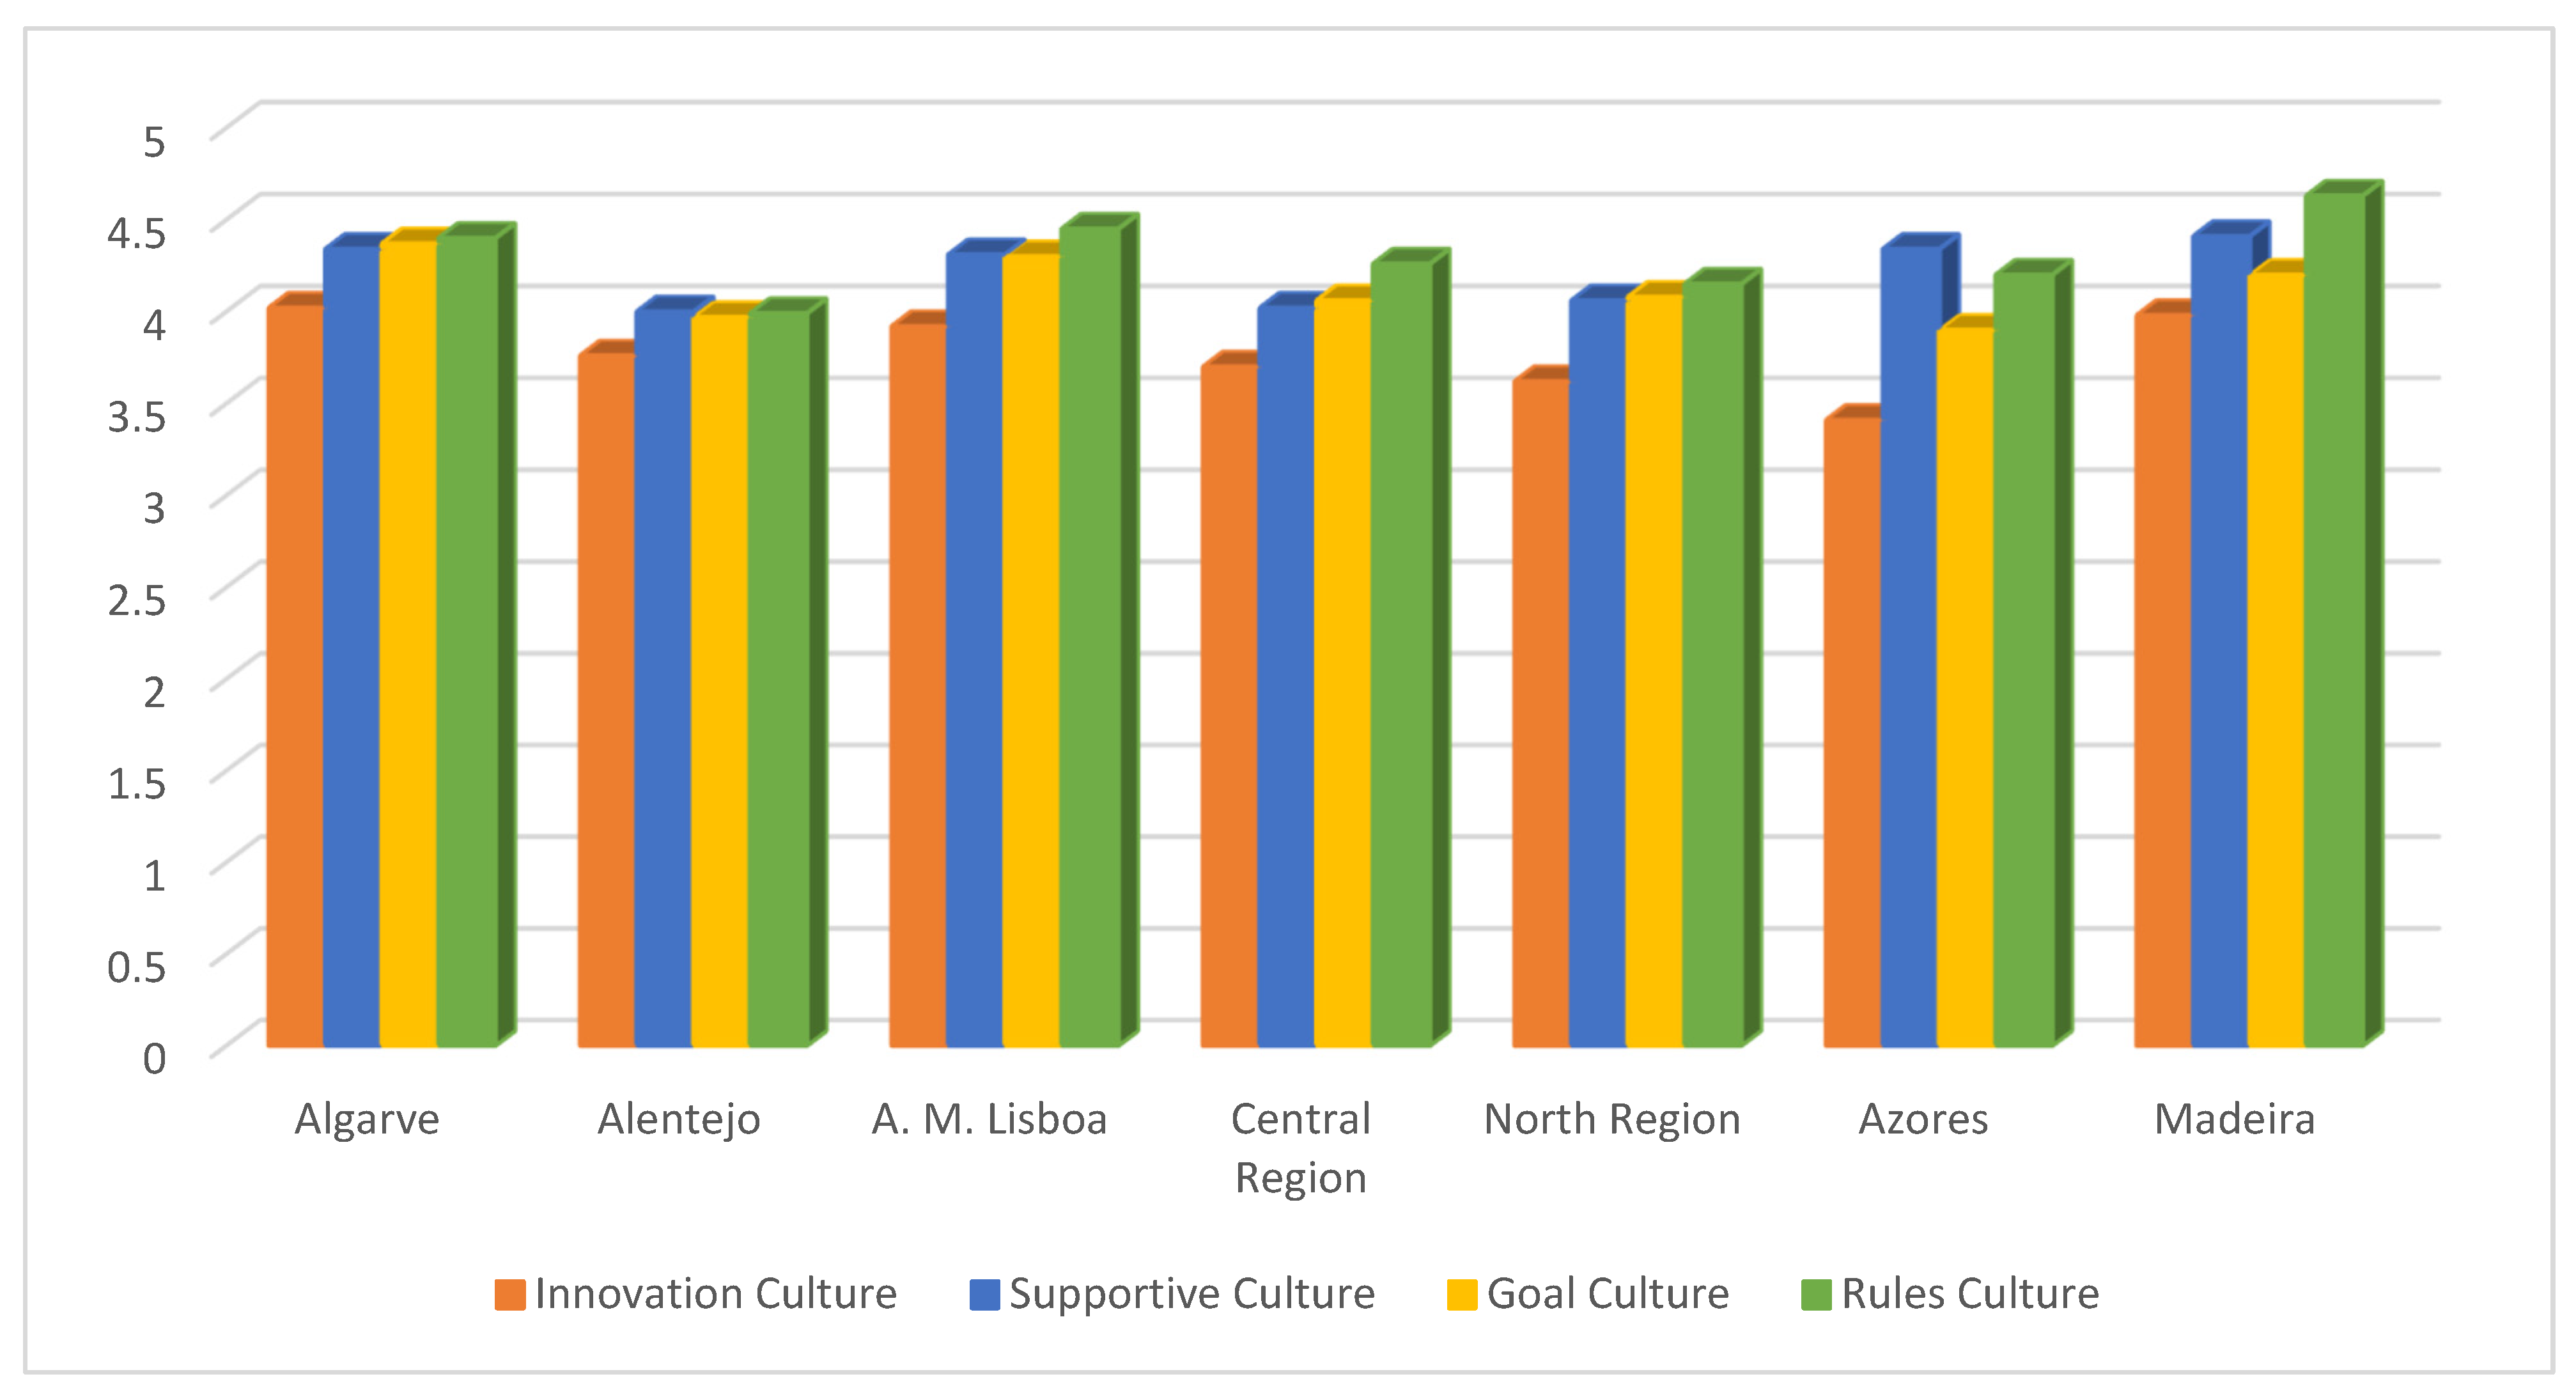
3.1. Descriptive Statistics of the Variables under Study
3.2. Association between the Variables under Study
3.3. Hypothesis Tests
4. Discussion
4.1. Limitations
4.2. Practical Implications
5. Conclusions
Author Contributions
Funding
Institutional Review Board Statement
Informed Consent Statement
Data Availability Statement
Conflicts of Interest
References
- Adams, John S. 1965. Inequity in social exchange. In Advances in Experimental Social Psychology. Edited by Leonard Berkowitz. New York: Academic Press, vol. 2, pp. 267–99. [Google Scholar]
- Afiouni, Fida. 2007. Human Resource Management and Knowledge Management: A Road Map Toward Improving Organizational Performance. Journal of American Academy of Business, Cambridge 11: 124–30. [Google Scholar]
- Allen, Tammy D., Timithy D. Golden, and Kristen M. Shockley. 2015. How effective is telecommuting? Assessing the status of our scientific findings. Psychological Science in the Public Interest 16: 40–68. [Google Scholar] [CrossRef] [PubMed]
- Barney, Jay B. 1991. Firm resources and sustained competitive advantage. Journal of Management 17: 99–120. [Google Scholar] [CrossRef]
- Baron, Reuben M., and David A. Kenny. 1986. The Moderator-Mediator Variable Distinction in Social Psychological Research: Conceptual, Strategic, and Statistical Considerations. Journal of Personality and Social Psychology 51: 1173–82. [Google Scholar] [CrossRef]
- Bártolo-Ribeiro, Rui. 2018. Desenvolvimento e Validação de uma Escala de Intenções de Saída Organizacional. In Diagnóstico e Avaliação Psicológica: Atas do 10º Congresso da AIDAP/AIDEP. Edited by Marcelino Pereira, Isabel M. Alberto, Josée J. Costa, José T. Silva, Cristina P. A. Albuquerque, Maria J. S. Santos, Manuela P. Vilar and Teresa M. D. Rebelo. Coimbra: AIDAP/AiDEP, pp. 378–90. ISBN 978-989-20-9329-1/978-989-20-9341-3. [Google Scholar]
- Basariya, Rabiyathul, and Ramyad R. Ahmed. 2019. A study on attrition—Turnover intentions of employees. International Journal of Civil Engineering and Technology 10: 2594–601. [Google Scholar]
- Benson, George S. 2006. Employee development, commitment and intention to turnover: A test of “employability” policies in action. Human Resource Management Journal 16: 173–92. [Google Scholar] [CrossRef]
- Berson, Yair, Shaul Oreg, and Taly Dvir. 2009. CEO values, organizational culture and firm outcomes. Journal of Organizational Behavior 29: 615–33. [Google Scholar] [CrossRef]
- Blau, Peter M. 1964. Exchange and Power in Social Life. New York: Wiley. [Google Scholar]
- Bohle, Sérgio A. L., Maria J. Chambel, Felipe M. Medina, and Bruno S. D. Cunha. 2018. Papel da percepção do suporte organizacional na insegurança e desempenho no trabalho. Revista de Administração de Empresas 58: 393–404. [Google Scholar] [CrossRef]
- Bozeman, Dennis P., and Pamela L. Perrewé. 2001. The effect of item content overlap on organizational commitment questionnaire—Turnover cognitions relationships. Journal of Applied Psychology 86: 161–73. [Google Scholar] [CrossRef]
- Brandão, Hugo, Jairo Borges-Andrade, and Tomás Guimarães. 2012. Desempenho Organizacional e as suas relações com competências gerenciais, suporte organizacional e treinamento. Revista de Administração 47: 523–39. [Google Scholar] [CrossRef]
- Bryman, Alan, and Duncan Cramer. 2003. Análise de dados em ciências sociais. Introdução às técnicas utilizando o SPSS para windows, 3rd ed. Oeiras: Celta. [Google Scholar]
- Çakmak-Otluoğlu, K. Övgü, and Banu S. Ünsal-Akbiyik. 2015. Perceived job insecurity, affective and normative commitment: The moderating effect of organizational career development opportunities. Psihologia Resurselor Umane Revista Asociaţiei de Psihologie Indusstrială şi Organizaţională 13: 179–88. [Google Scholar]
- De Cuyper, Nele, Claudia Bernhard-Oettel, Eric Berntson, Hans De Witte, and Barbara Alarco. 2008. Employability and employees’ well-being: Mediation by job insecurity. Journal of Applied Psychology 57: 488–509. [Google Scholar] [CrossRef]
- De Witte, Hans. 2000. Work ethic and job insecurity: Assessment and consequences for well-being, satisfaction and performance at work. In From Group to Community. Edited by Richard Bowen, Kristof De Witte, Hans De Witte and Tamara Taillieu. Leuven: Garant, pp. 325–50. [Google Scholar]
- De Witte, Hans. 2005. Job insecurity: Review of the international literature on definitions, prevalence, antecedents and consequences. Journal of Industrial Psychology 31: 1–6. [Google Scholar] [CrossRef]
- De Witte, Hans, Tine Vander Elst, and Nele De Cuyper. 2015. Job Insecurity, Health and Well-Being. Sustainable Working Lives 2015: 109–28. [Google Scholar] [CrossRef]
- Eisenberger, Robert, Jim Cummings, Stephen Armeli, and Patrick Lynch. 1997. Perceived organizational support, discretionary treatment and job satisfaction. Journal of Applied Psychology 82: 812–20. [Google Scholar] [CrossRef] [PubMed]
- Eisenberger, Robert, Robin Huntington, Steven Hutchison, and Debora Sowa. 1986. Perceived organizational support. Journal of Applied Psychology 71: 500–507. [Google Scholar] [CrossRef]
- Gouldner, Alvin W. 1960. The norm of reciprocity: A preliminary statement. American Sociological Review 25: 161–78. [Google Scholar] [CrossRef]
- Greenhalgh, Leonard, and Zehava Rosenblatt. 1984. Job Insecurity: Toward Conceptual Clarity. Academy of Management Review 9: 438–48. [Google Scholar] [CrossRef]
- Grunberg, Leon, Sarah Moore, and Edward S. Greenberg. 2006. Managers’ reactions to implementing layoffs: Relationship to health problems and withdrawal behaviors. Human Resource Management 45: 159–78. [Google Scholar] [CrossRef]
- Hayes, Andrew F. 2013. An Introduction to Mediation, Moderation, and Conditional Process Analysis: A Regression-Based Approach. New York: Guilford Press. [Google Scholar]
- Heavey, Angela L., Jacob A. Holwerda, and John P. Hausknecht. 2013. Causes and consequences of collective turnover: A meta-analytic review. Journal of Applied Psychology 98: 412–53. [Google Scholar] [CrossRef]
- Hill, Manuela, and Andrew Hill. 2002. Investigação por Questionário. Lisboa: Edições Sílabo. [Google Scholar]
- Hobfoll, Steven E. 1989. Conservation of resources: A new attempt at conceptualizing stress. American Psychologist 44: 513–24. [Google Scholar] [CrossRef] [PubMed]
- Hom, Peter W., Thomas W. Lee, Jason D. Shaw, and John P. Hausknecht. 2017. One hundred years of employee turnover theory and research. Journal of Applied Psychology 102: 530–45. [Google Scholar] [CrossRef] [PubMed]
- Hui, Chan, Alfred Wong, and Dean Tjosvold. 2007. Turnover intention and performance in China: The role of positive affectivity, chinese values, perceived organizational support and constructive controversy. Journal of Occupational and Organizational Psychology 80: 735–51. [Google Scholar] [CrossRef]
- Islam, Talat, Saif-ur-Rehman Khan, Muhammad Aamir, and Ungku Ahmad. 2012. Turnover intentions: The influence of organizational learning culture and multi foci citizenship behaviors. Middle-East Journal of Scientific Research 12: 650–61. [Google Scholar]
- Ivanova, Maryia. 2019. Main factors of turnover and minimization of turnover rate within business organization. Open Journal for Research in Economics 2: 73–84. [Google Scholar] [CrossRef]
- Jing, Jianwan, and Jinzhe Yan. 2022. Study on the Effect of Employees’ Perceived Organizational Support, Psychological Ownership, and Turnover Intention: A Case of China’s Employee. International Journal of Environmental Research and Public Health 19: 6016. [Google Scholar] [CrossRef]
- Jöreskog, Karl G., and Dag Sörbom. 1993. LISREL8: Structural Equation Modelling with the SIMPLIS Command Language. Chicago: Scientific Software International. [Google Scholar]
- Kim, Jae H., and Soon N. Jang. 2018. Seafarers’ quality of life: Organizational culture, self-efficacy, and perceived fatigue. International Journal of Environmental Research and Public Health 15: 2150. [Google Scholar] [CrossRef]
- Kurtessis, James N., Robert Eisenberger, Michael T. Ford, Louis C. Buffardi, Kathleen A. Stewart, and Cory S. Adis. 2015. Perceived organizational support: A meta-analytic evaluation of organizational support theory. Journal of Management 20: 1–31. [Google Scholar] [CrossRef]
- Kusmaul, Nancy, and Shalini Sahoo. 2019. Hypothesis Testing of CNA Perceptions of Organizational Culture in Long Term Care. Journal of Gerontological Social Work 62: 405–14. [Google Scholar] [CrossRef]
- Lee, Minhong, Jae S. Choi, Jinseop Lim, and Young S. Kim. 2013. Relationship between staff-reported culture change and occupancy rate and organizational commitment among nursing homes in South Korea. The Gerontologist 53: 235–45. [Google Scholar] [CrossRef]
- Ma, Bing, Shanshi Liu, Hermann Lassleben, and Guimei Ma. 2019. The relationships between job insecurity, psychological contract breach and counterproductive workplace behavior: Does employment status matter? Personnel Review 48: 595–610. [Google Scholar] [CrossRef]
- Mihajlov, Snežana, and Nenad Mihajlov. 2016. Comparing public and private employees’ job satisfaction and turnover intention. MEST Journal 4: 75–86. [Google Scholar] [CrossRef]
- Mobley, William H. 2011. Pergantian Karyawan: Sebab, Akibat dan Pengendaliannya (Terjemahan). Jakarta: PT Pustaka Binaman Pressindo. [Google Scholar]
- Moreira, Ana, Maria J. Sousa, and Francisco Cesário. 2022. Competencies development: The role of organizational commitment and the perception of employability. Social Sciences 11: 125. [Google Scholar] [CrossRef]
- Muneer, Saqib, Sied Iqbal, Saif-Ur-Rehman Khan, and Choi S. Long. 2014. An incorporated structure of perceived organizational support, knowledge-sharing behavior, organizational trust and organizational commitment: A strategic knowledge management approach. Pakistan Journal of Commerce and Social Sciences 8: 42–57. [Google Scholar]
- Neves, José G. 2000. Clima Organizacional, Cultura Organizacional e Gestão de Recursos Humanos. Lisboa: RH Editora, ISBN 972-6897-3-3. [Google Scholar]
- Obeng, Anthony F., Prince E. Quansah, and Erik Boakye. 2020. The Relationship between Job Insecurity and Turnover Intention: The Mediating Role of Employee Morale and Psychological Strain. Management 10: 35–45. [Google Scholar]
- Piccoli, Beatrice, William D. Reisel, and Hans De Witte. 2019. Understanding the Relationship Between Job Insecurity and Performance: Hindrance or Challenge Effect? Journal of Career Development 2: 089484531983318. [Google Scholar] [CrossRef]
- Pinto, Gatai M. C. 2019. Dinâmicas de grupo: Da teoria à prática. São Paulo: Editora Senac. [Google Scholar]
- Podsakoff, Phillip M., Scott B. MacKenzie, Jeong Y. Lee, and Nathan P. Podsakoff. 2003. Common method biases in behavioral research: A critical review of the literature and recommended remedies. Journal of Applied Psychology 88: 879–903. [Google Scholar] [CrossRef]
- Quinn, Robert E., and Kim Cameron. 1983. Organizational life cycles and shifting criteria of effectiveness: Some preliminary evidence. Management Science 29: 33–51. [Google Scholar] [CrossRef]
- Reiche, B. Sebastian. 2008. The configuration of employee retention practices in multinational corporations’ foreign subsidiaries. International Business Review 17: 676–87. [Google Scholar] [CrossRef]
- Rhoades, Linda, and Robert Eisenberger. 2002. Perceived organizational support: A review of the literature. Journal of Applied Psychology 87: 698–714. [Google Scholar] [CrossRef]
- Richter, Anne, Tinne Vander Elst, and Hans De Witte. 2020. Job insecurity and subsequent actual turnover: Rumination as a valid explanation? Frontiers in Psychology 11: 712. [Google Scholar] [CrossRef] [PubMed]
- Rus, Mihaela, and Dan O. Rusu. 2015. The Organizational Culture in Public and Private Institutions. Procedia—Social and Behavioral Sciences 187: 565–69. [Google Scholar] [CrossRef]
- Santos, Joana V., and Gabriela Gonçalves. 2010. Contribuição para a adaptação portuguesa da Escala de Percepção de Suporte Organizacional de Eisenberger, Huntington, Hutchison e Sowa (1986). Laboratório de Psicologia 8: 213–23. [Google Scholar] [CrossRef]
- Schein, Edgar M. 1999. The Corporate Culture Survival Guide Sense and Nonsense about Culture Change. San Francisco: Josey-Bass. [Google Scholar]
- Schultz, Theodore W. 1961. Investment in Human Capital. The American Economic Review 51: 1–17. [Google Scholar]
- Shore, Lynn M., and Harry J. Martin. 1989. Job satisfaction and organizational commitment in relation to work performance and turnover intentions. Human Relations 42: 625–38. [Google Scholar] [CrossRef]
- Stone, Patricia W., Cathy Mooney-Kane, Elaine L. Larson, Teresa Horan, Laurent G. Glance, Jack Zwanziger, and Andrew W. Dick. 2007. Nurse working conditions and patient safety outcomes. Medical Care 2007: 571–78. [Google Scholar] [CrossRef]
- Sverke, Magnus, Johnny Hellgren, and Katharina Näswall. 2006. Job Insecurity: A Literature Review. Stockholm: Arbetslivsinstitutet. [Google Scholar]
- Tajfel, Henti. 1978. Differentiation between Social Groups. Studies in the Social Psychology of Intergroup Relations. London: Academic Press. [Google Scholar]
- Tett, Robert P., and John P. Meyer. 1993. Job satisfaction, organizational commitment, turnover intention, and turnover: Path analyses based on meta-analytic findings. Personnel Psychology 46: 259–93. [Google Scholar] [CrossRef]
- Tomasi, Manueli, Vanessa Rissi, and Jandir Pauli. 2020. Influência do suporte organizacional nas vivências de prazer e sofrimento no trabalho em um contexto hospitalar. Revista Psicologia: Organizações & Trabalho 20: 1072–79. [Google Scholar] [CrossRef]
- Trochim, William. 2000. The Research Methods Knowledge Base, 2nd ed. Cincinnati: Atomic Dog Publishing. [Google Scholar]
- Van Beek, Adriana P. A., and Debby L. Gerritsen. 2010. The relationship between organizational culture of nursing staff and quality of care for residents with dementia: Questionnaire surveys and systematic observations in nursing homes. International Journal of Nursing Studies 47: 1274–82. [Google Scholar] [CrossRef]
- Ventura, Palloma, Isabela Velloso, and Marília Alves. 2020. Influencia da cultura organizacional na gestão da qualidade de um hospital universitário. Rev Rene 21: e43996. [Google Scholar] [CrossRef]
- Wang, Xingyu, Priyanko Guchait, and Aysin Paşamehmetoğlu. 2020. Why should errors be tolerated? Perceived organizational support, organization-based self-esteem and psychological well-being. International Journal of Contemporary Hospitality Management 32: 1987–2006. [Google Scholar] [CrossRef]
- Wang, Yau-D., Chyan Yang, and Kuei-Yng Wang. 2012. Comparing Public and Private Employees’ Job Satisfaction and Turnover. Public Personnel Management 41: 557–73. [Google Scholar] [CrossRef]


| Mean | SD | 1.1 | 1.2 | 1.3 | 1.4 | 2.1 | 2.2 | 3 | 4 | |
|---|---|---|---|---|---|---|---|---|---|---|
| 1.1. Innovation Culture | 3.78 | 1.04 | -- | |||||||
| 1.2. Supportive Culture | 4.17 | 1.07 | 0.74 *** | -- | ||||||
| 1.3. Goal Culture | 4.17 | 1.00 | 0.79 *** | 0.80 *** | -- | |||||
| 1.4. Rules Culture | 4.27 | 0.92 | 0.56 *** | 0.59 *** | 0.76 *** | -- | ||||
| 2.1. Affective POS | 4.32 | 1.60 | 0.68 *** | 0.74 *** | 0.70 *** | 0.49 *** | -- | |||
| 2.2. Cognitive POS | 4.42 | 1.62 | 0.38 *** | 0.45 *** | 0.41 *** | 0.24 *** | 0.60 *** | -- | ||
| 3. Job Insecurity | 2.16 | 0.93 | −0.24 *** | −0.33 *** | −0.27 *** | −0.17 *** | −0.37 *** | −0.39 *** | -- | |
| 4. Turnover Intentions | 2.23 | 1.16 | −0.28 *** | −0.34 *** | −0.34 *** | −0.26 *** | −0.46 *** | −0.38 *** | 0.45 *** | -- |
| Dependent Variable | t | p | Private | Public | ||
|---|---|---|---|---|---|---|
| Mean | SD | Mean | SD | |||
| Innovation Culture | 5.96 *** | <0.001 | 4.09 | 1.09 | 3.60 | 0.96 |
| Support Culture | 3.75 *** | <0.001 | 4.37 | 1.04 | 4.05 | 1.07 |
| Rules Culture | 2.32 * | 0.021 | 4.38 | 0.85 | 4.21 | 0.95 |
| Goals Culture | 3.83 *** | <0.001 | 4.34 | 0.89 | 4.06 | 1.03 |
| Affective POS | 2.85 ** | 0.005 | 4.55 | 1.70 | 4.18 | 1.52 |
| Cognitive POS | 1.81 | 0.071 | 4.57 | 1.76 | 4.33 | 1.52 |
| Job Insecurity | 1.20 | 0.232 | 2.22 | 0.98 | 2.13 | 0.89 |
| Turnover Intentions | 5.84 *** | <0.001 | 2.57 | 1.21 | 2.02 | 1.07 |
| Independent Variables | Dependent Variable | F | p | R2a | β | p |
|---|---|---|---|---|---|---|
| Innovation Culture | Turnover Intentions | 23.74 | <0.001 | 0.12 | 0.02 | 0.788 |
| Supportive Culture | −0.19 ** | 0.002 | ||||
| Goal Culture | −0.18 * | 0.034 | ||||
| Rules Culture | −0.03 | 0.427 |
| Independent Variables | Dependent Variable | F | p | R2a | β | p |
|---|---|---|---|---|---|---|
| Innovation Culture | Affective POS | 245.96 *** | <0.001 | 0.60 | 0.19 *** | <0.001 |
| Supportive Culture | 0.43 *** | <0.001 | ||||
| Goal Culture | 0.27 *** | <0.001 | ||||
| Rules Culture | −0.08 * | 0.042 | ||||
| Innovation Culture | Cognitive POS | 45.87 *** | <0.001 | 0.21 | 0.05 | 0.369 |
| Supportive Culture | 0.31 *** | <0.001 | ||||
| Goal Culture | 0.23 ** | 0.004 | ||||
| Rules Culture | −0.14 ** | 0.008 |
| Independent variables | Dependent Variable | F | p | R2a | β | p |
|---|---|---|---|---|---|---|
| Affective POS | Turnover Intentions | 94.97 *** | <0.001 | 0.22 | −0.36 *** | <0.001 |
| Cognitive POS | −0.16 *** | <0.001 |
| Independent variables | Dependent Variable | F | p | R2a | β | p |
|---|---|---|---|---|---|---|
| Affective POS | Job Insecurity | 71.44 *** | <0.001 | 0.18 | −0.21 *** | <0.001 |
| Cognitive POS | −0.27 *** | <0.001 |
| Independent variable | Dependent Variable | F | p | R2 | β | p |
|---|---|---|---|---|---|---|
| Job Insecurity | Turnover Intentions | 166.33 *** | <0.001 | 0.20 *** | 0.45 | <0.001 |
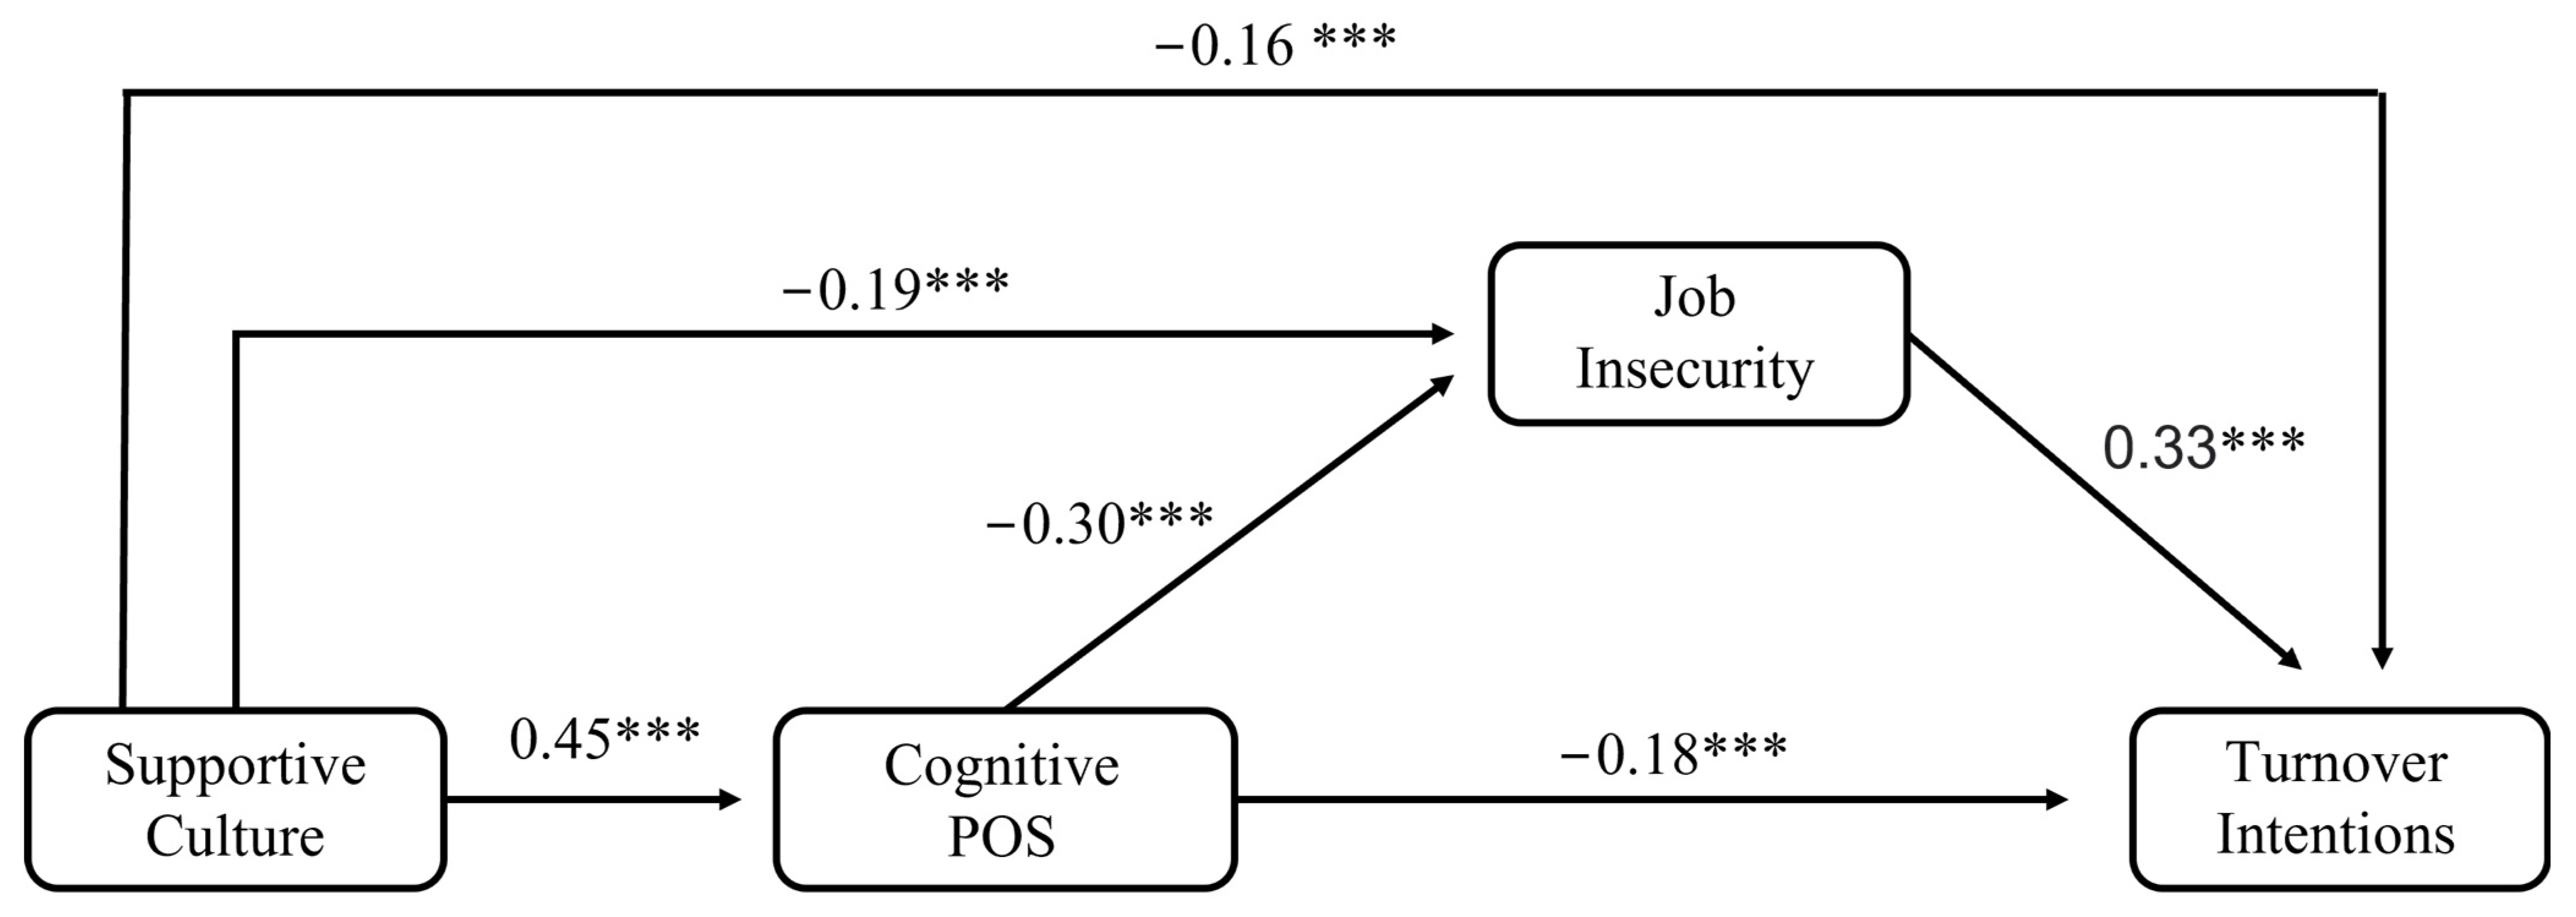
| Indirect Effects | ||
|---|---|---|
| Estimates | 95% CI with Bootstrap Correction | |
| Model 1 | ||
| Total | −0.41 (0.05) | [−0.50; −0.32] |
| SC → APOS → TI | −0.29 (0.04) | [−0.38; −0.21] |
| SC → JI→ TI | −0.04 (0.02) | [−0.09; −0.01] |
| SC → APOS → JI → TI | −0.07 (0.02) | [−0.11; −0.04] |
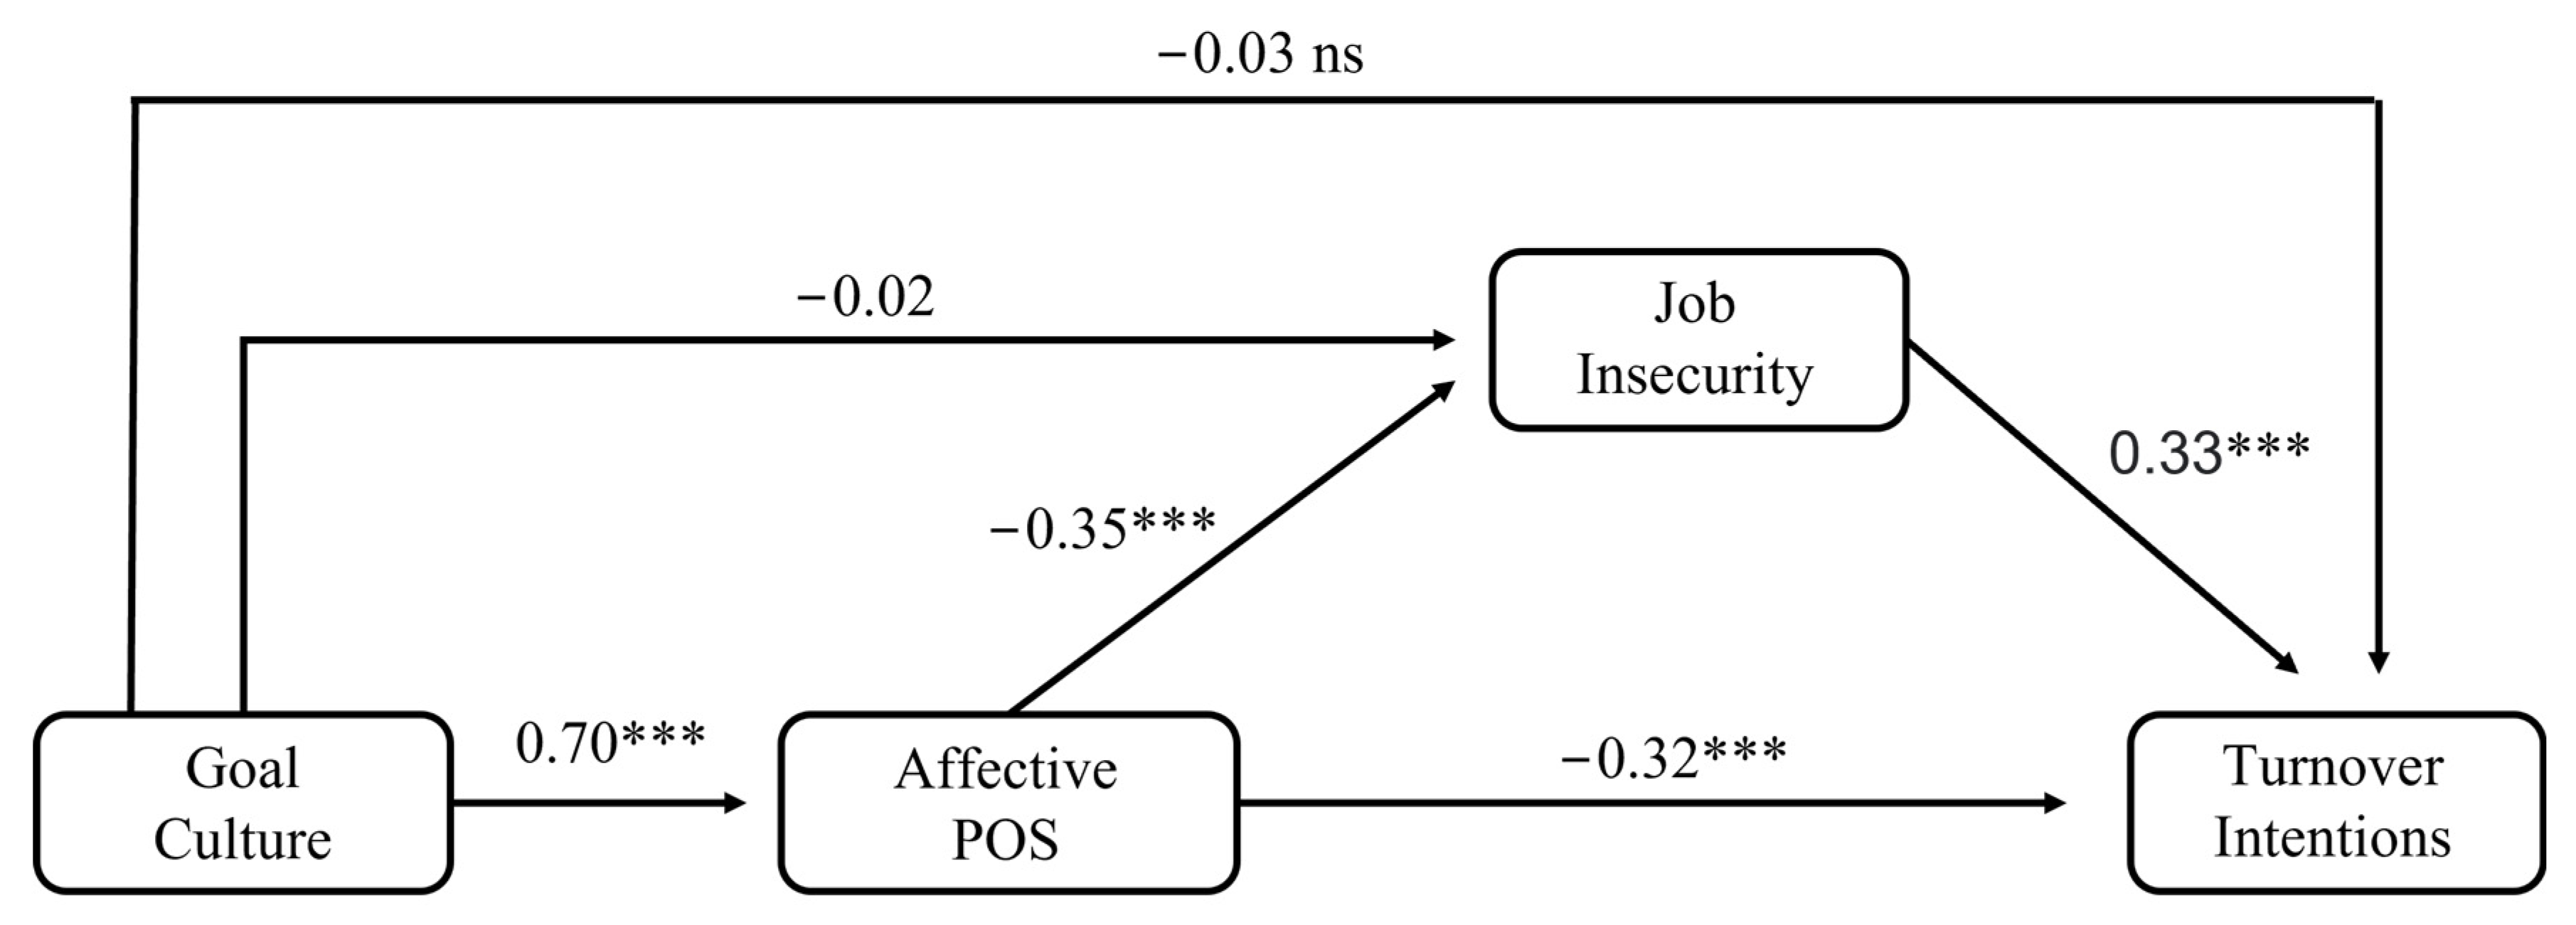
| Indirect Effects | ||
|---|---|---|
| Estimates | 95% CI with Bootstrap Correction | |
| Model 2 | ||
| Total | −0.21 (0.27) | [−0.26; −0.15] |
| SC → CPOS → TI | −0.09 (0.02) | [−0.14; −0.05] |
| SC → JI→ TI | −0.68 (0.02) | [−0.11; −0.03] |
| SC → CPOS → JI → TI | −0.05 (0.01) | [−0.07; −0.03] |
| Indirect Effects | ||
|---|---|---|
| Estimates | 95% CI with Bootstrap Correction | |
| Model 3 | ||
| Total | −0.36 (0.05) | [−0.45; −0.28] |
| GC → APOS → TI | −0.26 (0.04) | [−0.35; −0.18] |
| GC → JI→ TI | −0.01 (0.02) | [−0.05; 0.03] |
| GC → APOS → JI → TI | −0.09 (0.02) | [−0.13; −0.06] |
| Indirect Effects | ||
|---|---|---|
| Estimates | 95% CI with Bootstrap Correction | |
| Model 4 | ||
| Total | −0.19 (0.03) | [−0.25; −0.14] |
| GC → CPOS → TI | −0.08 (0.02) | [−0.13; −0.04] |
| GC → JI→ TI | −0.05 (0.02) | [−0.09; −0.17] |
| GC → CPOS → JI → TI | −0.05 (0.01) | [−0.08; −0.03] |
Publisher’s Note: MDPI stays neutral with regard to jurisdictional claims in published maps and institutional affiliations. |
© 2022 by the authors. Licensee MDPI, Basel, Switzerland. This article is an open access article distributed under the terms and conditions of the Creative Commons Attribution (CC BY) license (https://creativecommons.org/licenses/by/4.0/).
Share and Cite
Salvador, M.; Moreira, A.; Pitacho, L. Perceived Organizational Culture and Turnover Intentions: The Serial Mediating Effect of Perceived Organizational Support and Job Insecurity. Soc. Sci. 2022, 11, 363. https://doi.org/10.3390/socsci11080363
Salvador M, Moreira A, Pitacho L. Perceived Organizational Culture and Turnover Intentions: The Serial Mediating Effect of Perceived Organizational Support and Job Insecurity. Social Sciences. 2022; 11(8):363. https://doi.org/10.3390/socsci11080363
Chicago/Turabian StyleSalvador, Mónica, Ana Moreira, and Liliana Pitacho. 2022. "Perceived Organizational Culture and Turnover Intentions: The Serial Mediating Effect of Perceived Organizational Support and Job Insecurity" Social Sciences 11, no. 8: 363. https://doi.org/10.3390/socsci11080363