Article

Did Immigrants Perceive More Job Insecurity during the SARS-CoV-2 Pandemic? Evidence from German Panel Data

1
Faculty of Sociology, Bielefeld University, 33501 Bielefeld, Germany
2
Center for Civil Society Research, Berlin Social Science Center (WZB), 10785 Berlin, Germany
3
German Centre for Integration and Migration Research (DeZIM), 10117 Berlin, Germany
4
Department of Social and Economic Sciences, University of Bamberg, 96045 Bamberg, Germany
5
German Socio-Economic Panel (SOEP), German Institute for Economic Research (DIW), 10117 Berlin, Germany
*
Author to whom correspondence should be addressed.
Soc. Sci. 2022, 11(5), 224; https://doi.org/10.3390/socsci11050224
Submission received: 11 April 2022 / Revised: 13 May 2022 / Accepted: 18 May 2022 / Published: 21 May 2022
(This article belongs to the Section Work, Employment and the Labor Market)

Abstract

:
Immigrants have been affected more than native-born ethnic majority populations by the negative economic consequences of the SARS-CoV-2 pandemic. This contribution examines whether they have also experienced higher levels of perceived job insecurity, reflected in a differential increase in financial concerns and the fear of job loss during the SARS-CoV-2 pandemic. This empirical study employs the SOEP-CoV survey, which assesses the socio-economic consequences of SARS-CoV-2. It is embedded in the ongoing German Socio-Economic Panel (SOEP). We present OLS models to compare perceptions of job insecurity across groups, capturing the situation before and during the pandemic. The analyses reveal that first-generation immigrants reported more financial worries, and they perceived a higher chance of job loss than second-generation immigrants and the native-born ethnic majority. This difference in economic concerns emerged only in the pandemic. Despite covering a wide range of conditions signaling objective risk of job loss, as well as individuals’ means and resources for dealing with looming job loss, these disparities persisted in the empirical study. Considering group-membership-related feelings of acceptance and inclusion could provide a promising route for future inquiry that may allow the remaining gap in subjective job insecurity to be accounted for.

1. Introduction

The coronavirus outbreak of 2019 has developed into a global crisis with far-reaching consequences for individuals and societies worldwide. The pandemic has affected certain groups more than others. Disruptions in the economic sphere, for example, have hit less-educated workers harder than well-educated professionals (Adams-Prassl et al. 2020; Naumann et al. 2020; OECD 2021; Schröder et al. 2020). There are also indications that immigrants have been particularly vulnerable to the economic impacts of SARS-CoV-2 in terms of furloughing, short-time work, declines in the numbers of hours worked, falls in earnings, and job loss (Auer 2022; Brücker et al. 2021; Clark et al. 2020; Couch et al. 2020; Fassani and Mazza 2020; Gelatt 2020; Guadagno 2020; Lopez et al. 2020). In addition, initial findings suggest that the psychological costs of employment disruptions have been more pronounced among immigrants, resulting in feelings of disorientation (Falkenhain et al. 2021) and issues with mental well-being (Shen and Bartram 2021).
Economic changes induced by an exogenous shock, such as a pandemic, can contribute to uncertainties about the future course of an individual’s career (Lübke and Erlinghagen 2014). The concept of subjective (or perceived) job insecurity (JI) can be used to depict individual perceptions of such uncertainties. On the one hand, it captures individuals’ perceptions of such risks, oftentimes measured as the anticipated probability of job loss (i.e., its cognitive component), and, on the other hand, their emotions in terms of worries or anxieties that go along with these perceptions (i.e., the affective component; Probst et al. 2014, p. 6). The fear that one’s job is under threat can give rise to a number of negative consequences; for example, the deterioration of physical and mental health (Bambra and Eikemo 2015; Cheng and Chan 2008; László et al. 2010) and a wide range of work-related outcomes, such as reduced job satisfaction or lower commitment at work (de Witte and Näswall 2003; Jiang and Lavaysse 2018). According to these findings, increased levels of job-related uncertainty, which are likely to have arisen in the aftermath of the coronavirus outbreak, can have lasting consequences for the individuals affected. Subjective JI, therefore, can be considered as indicative of the manifold strains that a worldwide health crisis can put on individuals and societies.
Considering that immigrants, similarly to lower-educated individuals, have been affected to a greater extent than native-born ethnic majority populations by the negative economic consequences of the pandemic, they may have also experienced higher levels of perceived JI. In this contribution, we examine whether there has been such a differential increase in subjective JI. Theoretically, we start from the notion that perceived JI results from an evaluation process in which individuals assess their current situation (Erlinghagen 2008). In their assessments, they consider contextual factors at the macro level, such as the exogenous shock of the coronavirus outbreak or the welfare policies available in times of an economic crisis (e.g., measures mitigating income loss or safeguarding jobs). In addition, their evaluations will be based on individual-level circumstances, including, most importantly, their resource endowment (e.g., their education or financial assets), but also other features characterizing their personal situation (e.g., being the main provider for their household).
For our empirical study, we employed a novel data source, SOEP-CoV, which is embedded in the ongoing German Socio-Economic Panel (SOEP; Goebel et al. 2019). SOEP-CoV was launched to assess the socio-economic consequences of SARS-CoV-2. It includes 6694 regular SOEP respondents who were surveyed between April and July 2020 (Kühne et al. 2020). A second wave of SOEP-CoV data collection took place between January and February 2021. It includes 6038 interviews with individuals who participated in the first wave. In addition to the data collected in the new SOEP-CoV survey, we relied on information from previous SOEP waves. The combination of these data sources allows subjective JI to be considered over time, while also covering a range of conditions that were measured prior to, as well as during the pandemic.
In a first step, we aim to describe the development of subjective JI over time, including potential changes because of SARS-CoV-2. We focus on first-generation immigrants in Germany and compare them to second-generation immigrants and to the native-born ethnic majority population. Following this longitudinal description of differences in perceived JI, in a second step, we examine a range of conditions that may account for the observed patterns.
While JI is a prominent concept in organizational psychology and the management literature, in sociology, it has been addressed only occasionally (e.g., Erlinghagen 2008; Lübke and Erlinghagen 2014). Against this background, inequalities in the distribution of perceived JI have received limited attention, and if categories of social group membership are considered, they have been part of a longer list of factors associated with JI rather than having taken center stage (e.g., Probst et al. 2014). It is, therefore, unsurprising that few studies have examined differences in JI between immigrants and native-born ethnic majority populations (e.g., Liu et al. 2019). We thus advance the literature on subjective JI by discussing a range of circumstances specific to immigrants—in addition to the general processes known to be relevant to perceived JI—and by empirically disentangling these conditions. While previous research on subjective JI predominantly relied on cross-sectional data, we employ panel data to describe and examine differential developments in subjective JI following the coronavirus outbreak.

2. Do Immigrants Experience More Subjective Job Insecurity?

2.1. Objective and Subjective Job Insecurity

The concept of JI has been defined and used in a variety of ways (for an overview, see Shoss 2017). Academic research distinguishes between objective and subjective JI (Probst et al. 2014; de Witte and Näswall 2003). Objective job insecurity refers to characteristics of the job or the employment situation that indicate a certain level of risk or threat of job loss. Important signals include the temporary nature of the job in question, declining employment opportunities in certain occupations, organizational plans for restructuring or downsizing of the employing firm, or an imminent bankruptcy (Probst et al. 2014; de Witte and Näswall 2003). A prominent signal of objective JI caused by the SARS-CoV-2 pandemic has been the use of short-time work as a response to the economic risks faced by industries, companies, and employees.
Subjective (or perceived) job insecurity, in contrast, refers to an individual’s subjective assessment of the risk of losing one’s job. It consists of two components: (a) the person’s risk perception, often measured as the anticipated probability of job loss (i.e., the cognitive component reflecting a certain belief), and (b) the emotions accompanying the fear that one’s job is under threat in terms of concern, worry, or anxiety (i.e., the affective component reflecting a certain emotional state; Probst et al. 2014, p. 6; Huang et al. 2010; Jiang and Lavaysse 2018). In our empirical study, the emotional component is captured by concerns about one’s financial situation. JI is most commonly conceptualized in terms of subjective assessments (Probst et al. 2014).
While the link between the objective and the subjective component of JI has been discussed in the literature (e.g., Landsbergis et al. 2012; Muñoz de Bustillo and de Pedraza 2010), empirically, it has been explored to a lesser degree. A recent study conducted during the SARS-CoV-2 pandemic points to a moderate to strong association between the two (Nemteanu et al. 2021).

2.2. Differences in Subjective Job Insecurity

To tackle the origins of group-specific differences in perceived JI, we start from the notion that subjective JI results from an evaluation process in which individuals assess their current situation (Erlinghagen 2008). In their assessments, they consider (a) the risk of losing their current job and, thus, objective JI. Additionally, they assess (b) how well they could cope with a potential job loss in light of their personal situation and the resources that they have at their disposal. Finally, they take into account less tangible conditions related to (c) whether members of certain social groups feel accepted and taken care of in a society. The degree of acceptance and inclusion indicates whether, in times of crisis, immigrants can expect protection and support from members and institutions of the receiving society. In the following, we discuss these three aspects in light of the coronavirus outbreak, considering general processes relevant to subjective JI, as well as processes that specifically apply to immigrants. By taking up key arguments discussed in the literature, applying them to individuals of immigrant origin, and supplementing them with additional considerations, we contribute to a theoretical account of migration-related inequalities in subjective JI. Based on this account, it is possible to derive expectations of how the onset of the SARS-CoV-2 pandemic may have affected immigrants in comparison to the native-born ethnic majority.

2.2.1. Conditions Signaling Objective Risk of Job Loss

Starting from the assumption that objective economic conditions are relevant for individuals’ assessments of their current situation, we expect that social groups who are more likely to lose their job and, therefore, experience greater objective JI will suffer from higher levels of subjective JI (Muñoz de Bustillo and de Pedraza 2010, p. 6; Nemteanu et al. 2021). Accordingly, individuals who control resources that are indicative of job stability should display lower levels of perceived JI.
Human capital is a key feature of a person’s marketability. Especially unskilled individuals who work in precarious jobs experience higher risk of job loss and should, therefore, experience greater JI (Erlinghagen 2008; Keim et al. 2014; Muñoz de Bustillo and de Pedraza 2010; de Witte and Näswall 2003). First-generation immigrants who acquired their education abroad may face additional difficulties due to the limited transferability of their educational qualifications to a different setting (Friedberg 2000). Together with other aspects of human capital that are restricted in their portability to the destination country, such as language skills, these devaluations should serve to heighten subjective JI in the first generation compared to the second generation and to the native-born ethnic majority.
A second set of conditions pertains to individuals’ situations on the labor market, where they receive signals of whether their job is at risk. Previous spells of unemployment, for example, should increase JI, as these periods make labor market re-entry on a permanent basis more difficult (Erlinghagen 2008, p. 184). Compared with standard employment, atypical forms of employment also point to a less secure and less stable employment situation, which can be terminated more easily (Muñoz de Bustillo and de Pedraza 2010; Keim et al. 2014; Probst et al. 2014; de Witte and Näswall 2003). Persons employed in such relationships should, therefore, report higher levels of JI. Conversely, being employed in the public sector, being a civil servant, or having long tenure with an employer should reduce JI, as such forms of employment signal high job security (Anderson and Pontusson 2007; Erlinghagen 2008; Lübke and Erlinghagen 2014; Probst et al. 2014). These various conditions should influence JI across the board, regardless of the person’s origin or generation status.
The coronavirus outbreak and its economic consequences increased the salience of job-related vulnerabilities among individuals who were already at greater risk of job loss, likely resulting in an increase in subjective JI. This reasoning applies to less-educated individuals, to immigrants who experienced a devaluation of their human capital, and to the workforce employed in atypical forms of employment or under otherwise less stable and secure conditions. In the German context, short-time work has been an important tool in the employment protection legislation aimed at securing work relationships under difficult economic circumstances. Notwithstanding the policy’s protective purpose, for the employees affected, short-time work might have signaled that their job was at stake and, thus, operated as an antecedent to self-perceived JI.

2.2.2. Conditions Signaling Means to Cope with Job Loss

Worries associated with the fear of losing one’s employment are expected to vary with an individual’s personal situation in terms of how well she or he is prepared to cope with looming job loss. Therefore, available financial resources, such as income or assets, should influence individuals’ assessments of the severity of the threat to their employment. In addition, as the significance of an individual’s income for the family livelihood increases, subjective JI should become more pronounced (Erlinghagen 2008, p. 184). Thus, parents who provide for their children usually have more reason to be concerned, as they are responsible for the family’s wellbeing (Erlinghagen 2008, p. 184). For those whose households are already in a precarious financial situation, the threat of job loss, induced by the economic shock of the pandemic, could have been particularly worrisome, resulting in heightened levels of JI. These processes associated with the availability of household resources should apply both to individuals of immigrant origin and to the native-born ethnic majority.

2.2.3. Conditions Signaling Acceptance and Inclusion

Individuals’ assessments of perceived JI may also be shaped by whether members of certain social groups feel accepted, included, and taken care of in a society. Signals of belonging and membership can be manifold. With respect to immigrants, they include institutional features, such as their legal status, which specifies the conditions of their stay. It indicates whether it is meant to be permanent and whether there is an opportunity to become a full member of the respective society (Probst et al. 2014). Apart from such institutionally defined conditions of membership, immigrants receive a variety of usually less tangible messages in their everyday environments, which can signal varying degrees of acceptance. For example, Muslim immigrant groups in Europe face bright boundaries (Alba 2005). Such boundaries are reflected in debates about the alleged unwillingness of Muslim groups to adapt (Diehl et al. 2016, p. 243), in prevailing unfavorable stereotypes and prejudices (Degner and Wentura 2010; Froehlich and Schulte 2019; Strabac and Listhaug 2008), and in discriminatory behaviors (Diehl et al. 2016; Zschirnt and Ruedin 2016). Individuals from social groups who encounter salient boundaries are more likely to perceive themselves as targets of dislike, rejection, and discrimination (Diehl et al. 2021). Correspondingly, they may have less reason to expect protection and support from members and institutions of the receiving society. These emotional strains should be reflected in generally higher levels of subjective JI among immigrants compared to the native-born ethnic majority population.
Following the onset of the pandemic, the gap in perceived JI may have widened in view of signs that some social groups were seen as entitled to protection and support, whereas others were at risk of being excluded from the community of fate. For instance, throughout the SARS-CoV-2 pandemic, many countries have concentrated on national responses and, thereby, have transmitted the message that solving the health crisis runs along national lines. This notion was reflected in the closing of borders for individual travel or vaccine allocation conflicts between nation states. The underlying message to immigrants may have been that resources and support were reserved for full members of the respective nation state, primarily the native-born ethnic majority population. Empirical evidence supports this reasoning by showing that safeguarding against health risks tended to be approved for those who were perceived as belonging (Larsen and Schaeffer 2021). Immigrants, therefore, may have felt rejected, which would be reflected in a pandemic-induced increase in JI.
In sum, we expect that the coronavirus outbreak and the subsequent economic consequences have affected distinct social groups differently. Less qualified individuals, those working in jobs characterized by less stable and secure conditions, and individuals with family responsibilities and fewer financial resources may have felt more vulnerable, likely resulting in a steeper increase in subjective JI compared to those living in more safeguarded circumstances. Considering processes of human capital devaluation, the first generation may have experienced an extra penalty. The pandemic could also have affected individuals of immigrant origin more generally, especially those perceived as culturally distant, as signals of exclusion unfolded in the form of border closures and national narratives for solving the SARS-CoV-2 crisis. Therefore, we expect the surge in JI to be more pronounced among immigrants than among otherwise similar members of the native-born ethnic majority.

3. Materials and Methods

3.1. Data, Sample, and Target Population

For our empirical analyses of subjective JI, we use data from the German SOEP-CoV study conducted in 2020 and 2021. It was designed to capture the societal consequences of the SARS-CoV-2 pandemic (Kühne et al. 2020), and it is based on a random subsample of households participating in the German Socio-Economic Panel Study (SOEP). The SOEP is an ongoing longitudinal survey of randomly sampled private households in Germany with annual interviews since 1984 (Goebel et al. 2019). Each year, about 30,000 individuals in about 20,000 households are interviewed. The first wave of the SOEP-CoV study was collected between 1 April and 4 July 2020. It covers the first lockdown in Germany (from 22 March to 4 May 2020), as well as the following period when distancing and containment measures were less strict. The second wave of the survey, which was conducted in January and February 2021, covers 90 percent of the respondents from the first wave. During the first wave, all SOEP households with a valid telephone number were split up into nine random sample tranches, which were separately contacted within the survey period over the course of two to three weeks (Kühne et al. 2020). Overall, the SOEP-CoV data include 12,732 interviews (first wave: 6694; second wave: 6038).
To investigate subjective JI during the SARS-CoV-2 pandemic, we restrict our sample to employees aged 18 to 65 who were employed either full or part-time1 and who were neither self-employed nor in education at the time of the first SOEP-CoV interview in 2020.2 We also focus on individuals who were in full- or part-time employment during both observed years of the coronavirus outbreak (i.e., 2020 and 2021). Accordingly, we exclude individuals who were in education, were unemployed, or were marginally employed in 2021. By disregarding individuals who lost their jobs during the pandemic, we avoid indirect selection on the dependent variable. Our restricted SOEP-CoV sample includes 774 interviews with first-generation immigrants (wave 1: 415; wave 2: 359), 362 interviews with individuals who belong to the second generation (wave 1: 190; wave 2: 172), and 4547 interviews with respondents from the native-born ethnic majority (wave 1: 2377; wave 2: 2170).
When considering information on subjective JI that was collected prior to the pandemic (i.e., before 2020), we again restrict the sample to individuals who were employed full or part time in 2019. This procedure ensures comparability between 2019 and the subsequent pandemic years of 2020 and 2021. In addition, we apply the same sample constraints outlined above to each survey year (2015–2019) and, accordingly, include individuals aged 18 to 65 in full- or part-time employment who were neither self-employed nor in education. The analysis sample available for 2019 covers 99.5 percent of the individuals of the first SOEP-CoV wave (2020), and the analysis sample for 2015 covers 65 percent of the respondents of the first wave.

3.2. Measures

We use two questions to operationalize perceived JI. The first dependent variable captures a cognitive component of subjective JI, the fear of job loss, with the following question: “How likely do you think it is that you will experience the following in the next 12 months due to measures to prevent and slow the spread of the coronavirus?” Respondents were asked to specify the likelihood (in percent) that they would lose their “[…] job as the result of layoffs or company closure”. This question was asked only in 2020 and 2021, but not prior to the SARS-CoV-2 pandemic.
With the second dependent variable, we address an affective component of subjective JI, individuals’ financial worries (“How concerned are you about your own financial situation?”). Respondents could indicate whether they were “very concerned” (coded to 2), “somewhat concerned” (coded to 1), or “not concerned at all” (coded to 0). As the same question was asked in the years prior to the pandemic, we can consider financial worries on a yearly basis for the period between 2015 and 2021.
The key independent variable is individuals’ generation status. To distinguish between individuals with a history of immigration and the native-born ethnic majority, we use a variable generated by the SOEP team that combines information on respondents’ countries of birth with information on their parents’ country of birth and citizenship (Kara et al. 2021, p. 13). Being born in another country indicates that an individual belongs to the first generation, while respondents born in Germany belong either to the second generation or to the native-born ethnic majority. To distinguish between these two groups, respondents whose parents were born in Germany were assigned to the native-born ethnic majority, while respondents whose father or mother was born in another country were assigned to the second generation (Kara et al. 2021, p. 13; Liebau and Tucci 2015). Further demographic characteristics considered in our study include gender, age, and, for the first generation, years since migration. We also controlled for survey years.
In line with the theoretical considerations, we include a range of additional independent variables that may account for differences in perceived JI. We cover measures that apply likewise to immigrants and the native-born ethnic majority, as well as indicators that are specific to immigrants.
With three indicators of human capital, we measure individuals’ objective risks of job loss. They cover their educational attainment (collapsed ISCED−2011 categories) and, for first-generation immigrants, indicators on whether they acquired their highest educational credentials abroad or in Germany, as well as their level of German proficiency (sum score of self-assessed speaking, reading, and writing skills). Further measures capturing objective economic risks include individuals’ occupational status (SIOPS; Treiman 1977) and their self-assessed health (on a 11-point scale). Another set of conditions on objective risks pertains to individuals’ situations on the labor market, where they receive signals regarding their job stability. These include prior episodes of unemployment (in years, measured on a monthly basis), part-time work (versus full-time work), type of job (white collar versus blue collar; civil servant), tenure with their employer (linear and squared, in years, measured on a monthly basis), and whether they work in the public sector (versus the private sector). Furthermore, to identify employees who are relatively more vulnerable to layoffs, we consider whether respondents did short-time work during the pandemic (i.e., in 2020 and/or 2021), if they worked less than 20 h per week, or worked under a fixed-term contract or a subcontract. If at least one of the last two conditions applies, we consider them as having an “atypical employment” relationship. To capture unobserved heterogeneity between occupations and industries, we include corresponding dummies (2-digit KldB 2010 for occupations and 2-digit NACE for industries).
When addressing how well respondents are prepared to cope with looming job loss, we focus on the resources available in the household, as well as on the family situation. Correspondingly, we include the household income (logarithmic), the proportion of the household income that the respondent contributes (respondent contributes more than 2/3; respondent contributes equal to or less than 2/3; single-person household), whether the respondent is a single parent, and how many children below the age of 14 are living in the household.
Regarding the conditions signaling the degree of acceptance and inclusion of individuals of immigrant origin, we take into account respondents’ legal status, which indicates whether their stay is meant to be permanent (German/EU citizen versus unlimited residence permit; temporary residence permit). We also consider religious boundaries in terms of individuals’ affiliation (Muslim versus Christian; other; no affiliation) for all respondents, regardless of whether they have a history of immigration or belong to the native-born ethnic majority.
For our two dependent variables and for indicators of respondents’ employment situation in terms of prior episodes of unemployment and short-time work, we rely on yearly measures. For the remaining variables, we use information from the survey year 2019 or from 2018 when information from 2019 was missing due to unit- or item-non-response. Fortunately, 99.5 percent of the SOEP-CoV respondents in our sample participated in 2019. For the descriptive statistics, we apply cross-sectional survey weights to account for variation in sample and response propensities and to allow for comparisons across survey years.

3.3. Modeling Strategy

For each dependent variable, we present two sets of OLS models3, with the first set covering the whole sample (M1a/M2a [fear of job loss] and Models M3a/M4a [financial worries]), and the second set the first generation (M1b/M2b [fear of job loss] and Models M3b/M4b [financial worries]). Models suffixed with ‘b’ differ from models suffixed with ‘a’ in that they additionally include independent variables specific to immigrants (i.e., years since migration, education abroad, German language proficiency, and legal status).4 Both sets of models follow the same setup and start by including the full set of independent variables described above without considering occupational and industry categories (M1a/b and M3a/b). Thereafter, they additionally account for unobserved heterogeneity between occupations and industries with fixed effects (dummy variables; M2a/b and M4a/b).5 To consider dependencies of respondent characteristics in the panel data, we compute the models with cluster-robust standard errors at the individual level.
For the first dependent variable, the anticipated probability of job loss, we rely on information from the SOEP-CoV survey, as the measure of the fear of job loss was not part of the regular SOEP and, therefore, cannot be included in the years prior to the coronavirus outbreak. Therefore, models M1a/b and M2a/b, which are presented in a reduced econometric form in Formula (1), regress the anticipated fear of job loss ( y ( F J ) i t ) on individual characteristics ( β k ) for 2020 and 2021 without a pre-pandemic comparison. We estimate a general time trend for 2021 ( β l ) to account for differences between the early onset of the pandemic (2020) and the situation a year later (2021).
Formula (1): Models M1a/b and M2a/b (fear of job loss):
y ( F J ) i t = β 0 + β k X i t + β l y e a r t + u i t
Notes: FJ = fear of job loss, β k = effects for independent variables in 2020 and 2021, X i t = independent variables, β l = time trend for 2021 (vs. 2020), y e a r t = dummy for survey year 2021, u i t = person–year-specific error term.
For the second dependent variable, “financial worries”, we compare the situation before and after the coronavirus outbreak. The corresponding models M3a/b and M4a/b are depicted in a reduced econometric form in Formula (2). To examine whether concerns about the financial situation ( y ( F W ) i t ) changed after the onset of the pandemic, we interact the variables included in models M3a/b and M4a/b with the survey years 2020 and 2021 (one dummy). The main effects β k m a i n specify the relationships of the independent variables with the measure of financial worries for the years prior to the pandemic (2015–2019). The interaction effects β l I A (between the independent variables and the dummy variable for the survey years 2020 and 2021) assess how these relationships changed after the onset of the pandemic. We estimate the various coefficients while accounting for a discrete yearly time trend ( β m ) for the complete observational period.6
Formula (2): Models M3a/b and M4a/b (financial worries):
y ( F W ) i t = β 0 + β k m a i n X i t + β l I A ( X i t C o V t ) + β m y e a r t + u i t
Notes: FW = financial worries, β k m a i n = main effects for independent variables in 2015–2019, X i t = independent variables, β l I A = change in main effects (interaction effects) for independent variables in 2020–2021 (M4a/b: occupation and industry dummies not interacted), C o V t = dummy for 2020 and 2021, β m = discrete yearly time trend, y e a r t = dummies for survey year, u i t = person–year-specific error term.

4. Results

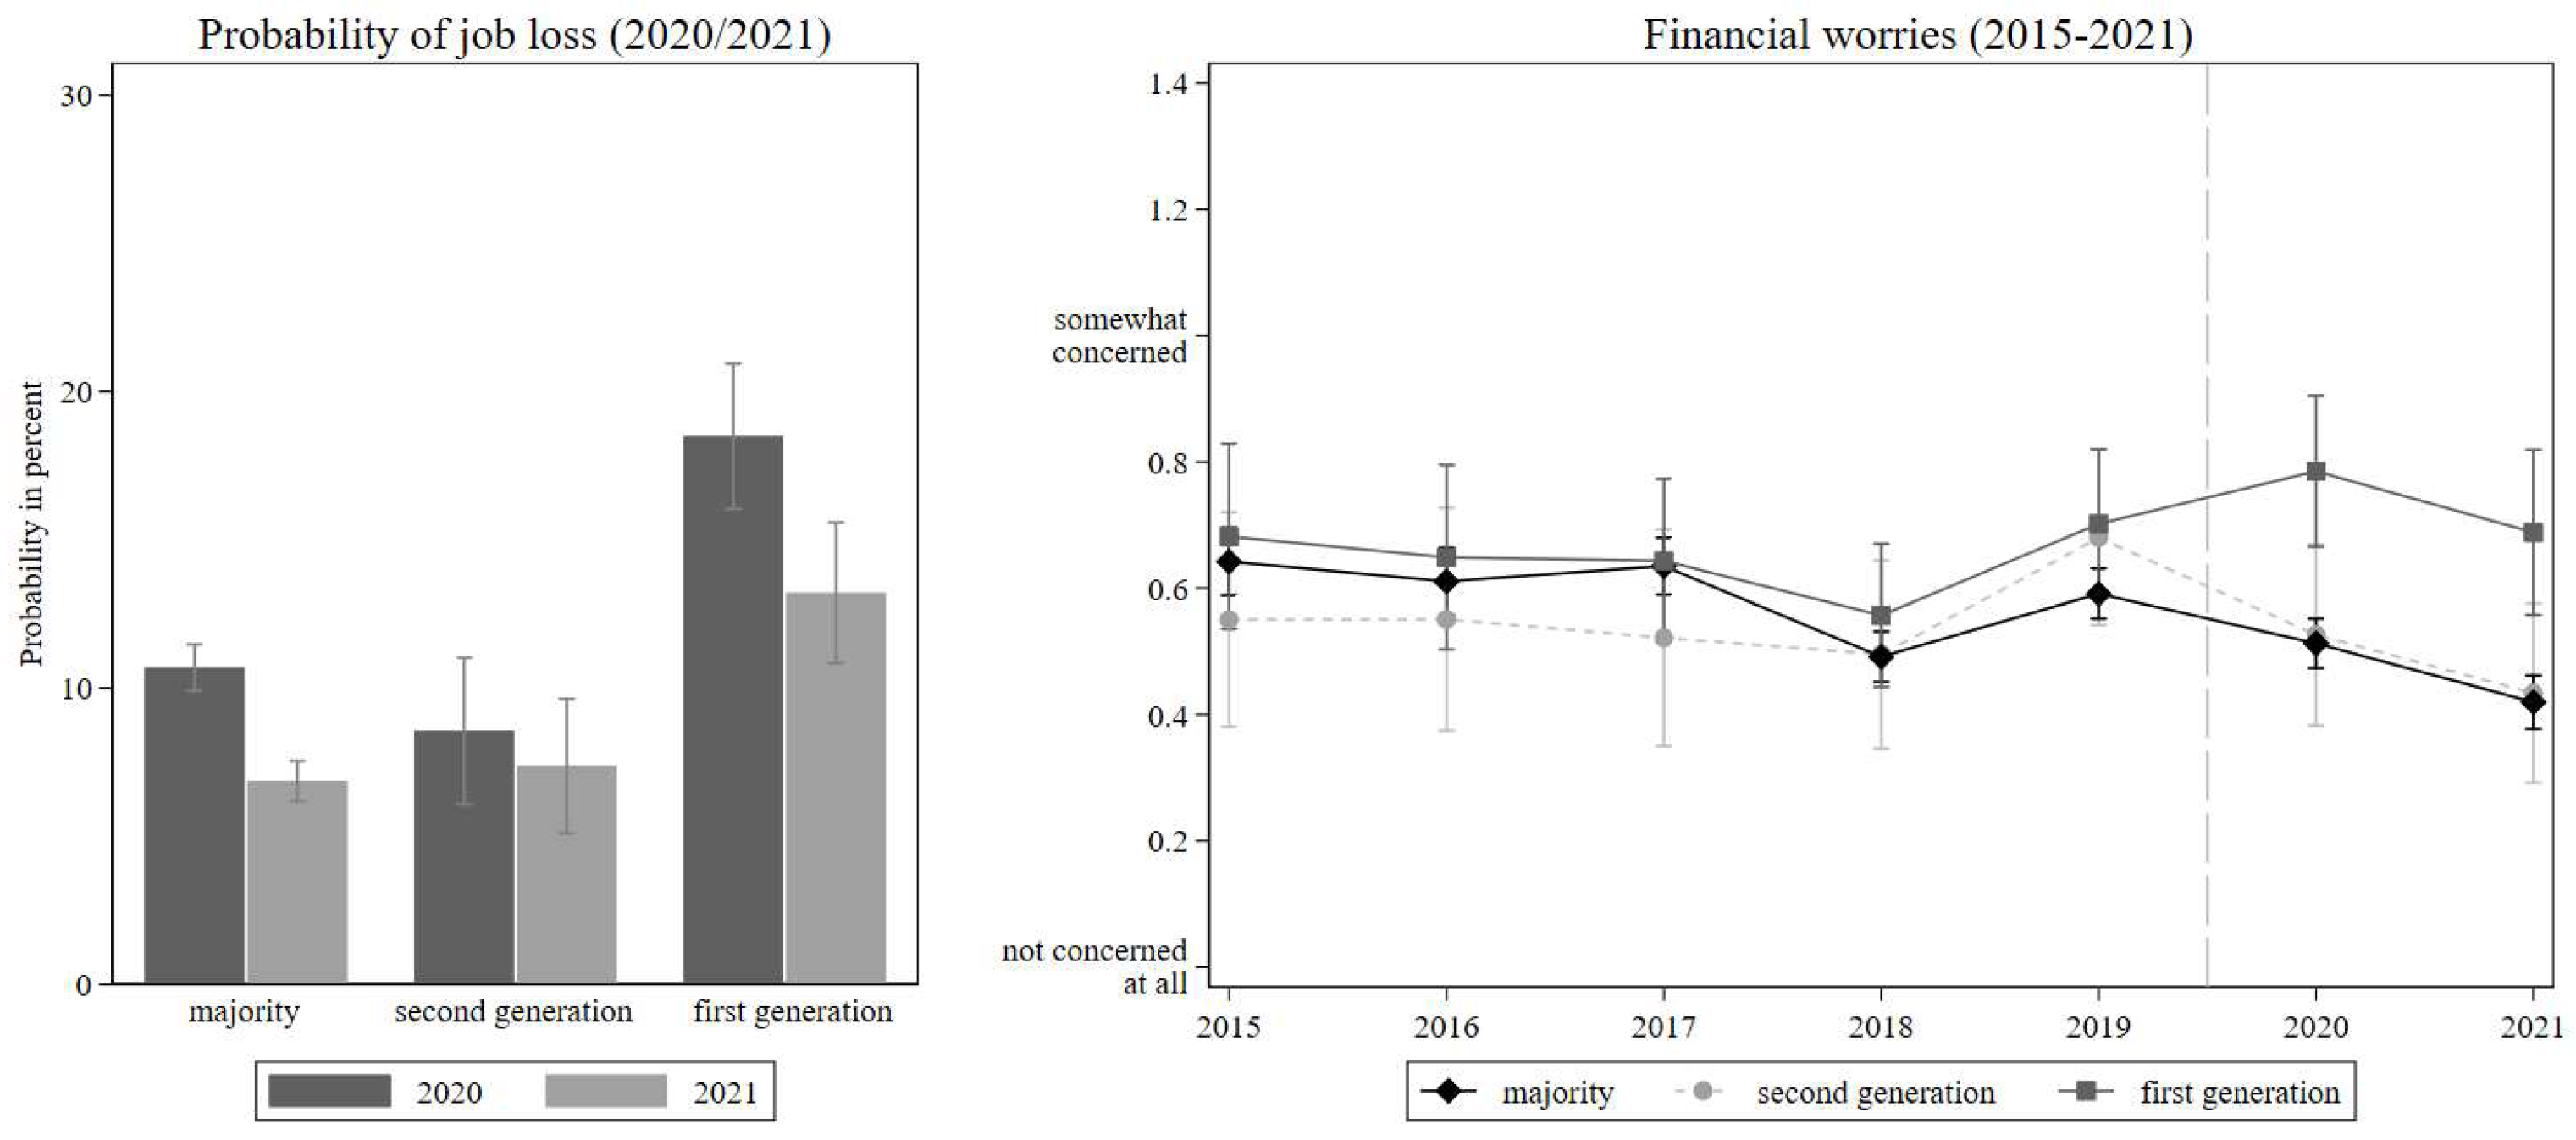
4.1. Descriptive Statistics of Subjective Job Insecurity before and during the SARS-CoV-2 Pandemic

Figure 1 displays the developments of perceived JI over time for the native-born ethnic majority, for second-generation immigrants, and for first-generation immigrants. On the left-hand side, it captures an illustration of the anticipated fear of job loss. Over both years of the pandemic, employees report, on average, a 10 percent chance that they will lose their job as the result of pandemic-related layoffs or company closures. While the average chances for the two years reported by the native-born ethnic majority amount to 8.8 percent, and those by the second generation amount to 8.0 percent, first-generation immigrants indicate an above-average level of subjective JI of 16.0 percent.
Sample sizes vary across groups and are smaller for individuals of immigrant origin, especially for the second generation (n = 355 compared to n = 766 for the first generation and n = 4490 for the native-born ethnic majority). This limitation is relevant when interpreting group-specific descriptions separately for 2020 and 2021, as displayed on the left-hand side of Figure 1. The bars depict a decline in the anticipated chance of job loss in the second year of the pandemic in all groups. At the same time, the first generation stands out, as it reports a considerably higher level of subjective JI than the second generation and the native-born ethnic majority. This finding holds for both years under study. The absolute decline in the fear of job loss between 2020 and 2021 amounts to ∆ = −3.8 percentage points among ethnic-majority members and to ∆ = −5.3 percentage points among first-generation immigrants. The relative decrease in the perceived chances of job loss, in contrast, is slightly greater among members of the native-born ethnic majority (∆ = −36 percent) than among first-generation immigrants (∆ = −29 percent).
The second measure of subjective JI, financial worries, is moderately correlated with the first measure of perceived JI (Cramer’s V = 0.38, p < 0.001). The illustration on the right-hand side captures the yearly means in worries about the financial situation prior to and during the SARS-CoV-2 pandemic.7 The curves illustrate a similar trend across groups before the pandemic (i.e., between 2015 and 2019). During this period, first-generation immigrants show marginally higher levels of financial worries than the other two groups while sharing a similar yearly trend. The dynamics change with the onset of the coronavirus outbreak in 2020. While members of the native-born ethnic majority, as well as those of the second generation, are slightly less worried than they were the year before (majority: 0.59 compared to 0.51 points; second generation: 0.68 compared to 0.53 points), financial concerns increase in the first generation (from 0.70 to 0.79 points), as does the gap in the level of concern experienced by them compared to the other two groups. Then, at the beginning of 2021, in the midst of the pandemic, worries decline in all three groups, roughly to the same extent. While the absolute difference between the first generation and the native-born ethnic majority remains unchanged (∆ = −0.27 points in 2021 compared to ∆ = −0.28 points in 2020), the relative difference increases marginally during that time (∆ = −39 percent in 2021 compared to ∆ = −35 percent in 2020).
Overall, concerns about individuals’ financial situations vary, but lie at levels below “somewhat concerned” in all years and for all groups under study. The emerging picture, therefore, does not depict a situation of great concern following the onset of SARS-CoV-2. Still, as for the fear of job loss, one group stands out as being harder hit by the pandemic, namely, the first generation.

4.2. Results from Regression Models on Fear of Job Loss during the SARS-CoV-2 Pandemic

For both dependent variables of subjective JI, we estimate models with and without occupational and industry fixed effects (FEs). The estimates for the first dependent variable, the fear of job loss, are sensitive to heterogeneity between occupations and industries. Therefore, we present the results from models with and without fixed effects alongside each other. Table 1 displays the corresponding findings for all respondents in models M1a and M2a and those for first-generation immigrants in models M1b and M2b.
The analyses reveal that first-generation immigrants anticipate an approximately four-percentage-point-higher chance of job loss (M1a; β = 3.98, p < 0.001; M2a; β = 4.37; p < 0.001) than employees from the native-born ethnic majority. In the second generation, the fear of losing one’s job resembles that of the majority. As illustrated in Figure 1, the first generation stands out as the group that is most vulnerable to subjective JI, while the patterns for the second generation are indistinguishable from those of the native-born ethnic majority.
The results of the impact of various conditions on the fear of job loss overall support the considerations on subjective JI, even though not all coefficients reach statistical significance, and despite some differences between the findings for the two specifications (with and without occupation and industry fixed effects). Lower objective risk of job loss in terms of more education, better health, and a secure position as a civil servant or in the public sector go along with a lower anticipated probability of job loss. Vice versa, atypical employment and, above all, short-time work signal that the job is at risk. Variables capturing individuals’ means to cope with job loss are also important. While those with higher incomes have less to fear, having children and being obliged to contribute substantially to the household income correlate with a greater fear of losing one’s job. Finally, the coefficients for religious boundaries indicate that, in comparison to Christians, Muslims are more fearful. However, the coefficients for respondents’ religious affiliation are not significant, their sizes vary across specifications, and individuals of denominations other than Christian and those without religious affiliation also seem to be at a disadvantage compared to Christians.
In models M1b and M2b, we estimate the same regression for first-generation immigrants, while adding the set of characteristics specific to immigrants. The coefficients for these group-specific variables largely point in the expected direction, but mostly are moderate in size and not significant. Compared to the model without fixed effects (M1b), the specification with occupation and industry categories (M2b) yields many discrepant findings.8 Given low cell frequencies for many occupations and industries in the sample on the first generation, only a tentative interpretation of such discrepancies is possible. Therefore, we turn to those coefficients that are substantive in size and for which the two specifications provide a consistent picture. In line with the results for all respondents, better health, working in a secure position as a civil servant, and having a higher household income reduces the perceived chances of job loss, while working short-time increases subjective JI.

4.3. Results from Regression Models on Financial Worries before and during the SARS-CoV-2 Pandemic

For financial worries, our second dependent variables of subjective JI, we also estimate models with and without occupational and industry fixed effects (FEs). With the exception of the type of job, the consideration of heterogeneity does not substantially alter the results. Therefore, we discuss the models with fixed effects (M4a/b in Table 2) in the remainder of this section9 and present the models without fixed effects in Appendix A (M3a/b in Table A4).
Table 2 displays the findings for all respondents in model M4a and for first-generation immigrants in model M4b. Regarding our core question of how individuals of immigrant origin fare in comparison to the native-born ethnic majority, we contrast the situation before the pandemic (main effects) with the development during the pandemic (interaction effects). In these models, we also interact the full range of independent variables. The results reveal that, already before the SARS-CoV-2 outbreak, first-generation immigrants were more concerned about their financial situation than the native-born ethnic majority (β = 0.11; p < 0.00). During the pandemic, this gap increased (β = 0.13; p < 0.001), resulting in an overall difference between the two groups of 0.24 points. Discrepancies of this kind are not discernible for the second generation either before or during the pandemic. The second generation is, thus, on par with the native-born ethnic majority, and the observed patterns speak for an alignment in the sequence of immigrant generations.
Considering the conditions that were discussed as potentially affecting subjective JI, our findings indicate that all of the variables signaling individuals’ means to cope with job loss are relevant. While those with higher incomes and single-person households who usually just need to care for themselves are less worried, single parents and families with children report more concerns. There are also indications that objective risks of job loss matter when it comes to the degree of worry experienced by individuals. More education provides a shield against perceived JI, as does being healthy and holding a civil servant position. Still, quite a few of the conditions of job (in)stability turn out to be unrelated to respondents’ financial concerns. Finally, the coefficients for religious boundaries, which signal the degree of acceptance and inclusion, do not reach statistical significance. However, the larger and positive coefficient for being Muslim compared to being Christian is in line with the theoretical expectations, according to which a religious group that faces bright boundaries is more likely to be worried.
Most of these relationships with perceived JI do not change with the onset of the SARS-CoV-2 pandemic. There are, however, three exceptions. First, after the outbreak, employees in the public sector express lower levels of worry compared to those working in the private sector. A job in the public sector thus seems to protect against financial concerns. Second, in the pandemic, the coefficient for income was halved compared to the years before, indicating that higher earnings do not offer the same level of protection against subjective JI. Third, while single parents were more concerned about their financial situation before the pandemic, this discrepancy with other household constellations disappeared in 2020 and 2021.
In model M4b, we estimate the same regression for first-generation immigrants, adding additional characteristics that apply only to this group (i.e., years since migration, education abroad, German language proficiency, and legal status). The coefficients for these group-specific variables point in the expected direction, but are mostly minor in size and not significant. One exception pertains to the question of where respondents acquired their education. Already before the pandemic, immigrants who obtained their highest degree abroad expressed more worry compared to their counterparts with domestic degrees (β = 0.15; p < 0.05). During the pandemic, this gap further increased (β = 0.09; p > 0.05), though not significantly.
The remaining coefficients, which were also included in the model for all respondents (M4a), turn out to be very similar. Given the smaller sample size available for first-generation immigrants, however, p-values tend to get larger. However, two differences from the preceding model are worth noting. First, in the years prior to the pandemic, atypical employment (β = 0.12; p < 0.05) was accompanied by a significant increase in financial worries only in the first generation, but not among all respondents. With the onset of SARS-CoV-2, this difference to the sample of all respondents largely disappears, as worries associated with atypical employment fade among first-generation immigrants. Second, prior to the pandemic, responsibility for contributing to the household income is a more relevant source of concern in the first generation than in the overall sample. After the coronavirus outbreak, this discrepancy also vanishes.

5. Discussion and Conclusions

The SARS-CoV-2 pandemic hit first-generation immigrants harder than second-generation immigrants and the native-born ethnic majority. This finding holds for both indicators of subjective JI considered in our study. Accordingly, first-generation immigrants report more financial worries, and they perceive a higher chance of job loss than the other groups. This gap in economic concerns emerges only in the pandemic and is driven by an increase in these worries in the first generation. Equally important is the finding that the patterns observed for the second generation do not differ from those of the native-born ethnic majority. The immigration-specific penalty in subjective JI thus seems to disappear across generations.
Moreover, our results reveal that, in addition to immigrants, other groups who already felt fragile in their work situation experienced higher levels of subjective JI as well. In fact, the findings indicate that the pandemic has amplified the fear of job loss among employees with lower incomes, among those working in the private sector, among individuals who did short-time work, and among persons in the blue-collar workforce.
As many empirical studies demonstrate, subjective JI can give rise to various negative work-related outcomes, such as a lower job satisfaction or lower commitment at work (de Witte and Näswall 2003; Jiang and Lavaysse 2018). It can also lead to a deterioration of physical and mental health (Bambra and Eikemo 2015; Cheng and Chan 2008; László et al. 2010). It thus remains to be seen whether the observed inequalities in perceived JI that coincided with the onset of the SARS-CoV-2 pandemic will last.
To investigate the gaps in levels of fear of job loss and financial concern between the first generation and the native-born ethnic majority, we considered a range of well-known conditions signaling objective risk of job loss, as well as the available means and resources to deal with potential job loss. Many findings were in line with our expectations—also when controlling for unobserved heterogeneity between occupations and industries. However, we were unable to account fully for the observed group differences in subjective JI. Additional analyses revealed that the characteristics specific to immigrants, which we included in our analyses, were of little relevance to their levels of fear of job loss and financial worry and are, therefore, unlikely candidates to shed light on the gap between the first generation and the native-born ethnic majority. Nevertheless—and we will return to this issue below—immigrant-specific explanations may be key to disentangling the remaining disparity. Moreover, despite considering a wide range of job-related measures that have received much attention in the literature on subjective JI, the gap in perceived JI persists. At this point, we assume that including even more fine-grained measures that capture further differences between the jobs that immigrants and their native-born counterparts hold may not turn out to be relevant to the disparity either. What, then, could account for the remaining difference in subjective JI?
In the theoretical part, we discussed the degree to which immigrants felt accepted and included in a society and how the pandemic and the accompanying national narratives may have shaped these feelings. However, the features that we could include in our empirical analyses in this regard, such as immigrants’ legal status and their religious affiliation, did not account for the relatively higher levels of perceived JI among the first generation. Still, recalling the argument that solving the health crisis ran along national lines, at least part of the difference between immigrants and the native-born ethnic majority may be traced back to diffuse feelings of connection to a community or a society. Sentiments of this kind were not captured to a sufficient extent by the variables included in our models, as they are not part of the data. An advancement of this route of inquiry calls for detailed measurements of belonging (e.g., Fuchs et al. 2021), but also of other features that are indicative of salient ethnic boundaries across groups (e.g., phenotypical distinctiveness).
Another data-related limitation involves our measure of the affective component of subjective JI in terms of individuals’ concerns about their financial situation. This variable does not directly capture the emotions accompanying the fear that one’s job is under threat and, therefore, is not entirely in line with the conceptual distinction made in the literature (Probst et al. 2014, p. 6). In addition, information on most of the independent variables, which are technically time-variant, was unavailable in 2020 and 2021. To fill in these blanks, we used information collected prior to the pandemic. This strategy can yield biased estimates if unobserved time variance in the various independent variables is correlated with the dependent variables.
A further shortcoming typical in analyses on immigrants relates to the number of cases that are available for the first and second generations. These numbers are lower in the SOEP-CoV survey compared to the SOEP, as the former is a subsample of the latter. Accordingly, sample sizes are smaller for the pandemic years 2020 and 2021. For already sparsely populated categories, such as those with low education, short-time work, or single parenthood, we obtained less precise estimates for immigrants than for the overall SOEP-CoV sample. The smaller sample sizes available for immigrants also prevent us from investigating patterns in subjective JI that are distinct for certain ethnic minorities. As empirical work on ethnic inequality in labor market outcomes has demonstrated, disparities vary across groups of different ethnic origins (Heath and Cheung 2007). It is thus perfectly conceivable that such patterns would also appear in measures of perceived JI.
A promising route of further inquiry, which also requires larger sample sizes, pertains to the question of who actually lost their job during the pandemic. While the number of cases is not sufficiently large to separately analyze immigrants who became unemployed in the SOEP-CoV data, this may be feasible with other data sources. The interest would be in investigating the patterns of job loss due to the SARS-CoV-2 pandemic, as well as the circumstances under which this happened. Again, these analyses would center on the question of how immigrants differ in this regard from the native-born ethnic majority.

Author Contributions

Conceptualization, M.B., J.J., C.K., S.K. and D.T.; Formal analysis, M.B.; Investigation, M.B., J.J., C.K., S.K. and D.T.; Methodology, M.B.; Project administration, M.B.; Visualization, M.B.; Writing—original draft, M.B., J.J., C.K., S.K. and D.T.; Writing—review & editing, M.B., J.J., C.K., S.K. and D.T. All authors have read and agreed to the published version of the manuscript.

Funding

This research received no external funding.

Data Availability Statement

Our analyses rely on data from the German Socio-Economic Panel Study (SOEP) and SOEP-CoV, which can be accessed for scientific use only after signing data disclosure contracts, which reasonably prevents us from making the data available. Requests to access these datasets should be directed to www.diw.de/en/soep (accessed on 11 April 2022). The replication code for the presented study can be found at www.github.com/mbue/ji-cov-mig (accessed on 11 April 2022).

Conflicts of Interest

The authors declare no conflict of interest.

Appendix A

Table A1. Descriptive statistics, all respondents.
Sample for M1aSample for M3a
MeanSDMeanSD
Financial worries--0.600.64
Fear of job loss9.0918.31--
Generation status
 Native-born ethnic majority0.800.400.800.40
 Second generation0.060.240.060.24
 First generation0.140.340.130.34
Female0.610.490.600.49
Age in years47.429.7245.939.49
Educational attainment
 Low (ISCED 1-2)0.040.200.040.19
 Medium (ISCED 3-5)0.590.490.600.49
 High (ISCED 6-8)0.370.480.360.48
Self-assessed health7.501.777.201.87
Occupational status (SIOPS)47.0312.7547.1113.02
Atypical employment1.140.351.160.36
Prior episodes of unemployment (in years)0.732.180.702.07
Employment tenure (in years)13.1710.5212.0010.32
Employment tenure squared (in years2)0.330.470.330.47
Public sector
Type of job
 Blue collar0.110.310.120.33
 White collar0.800.400.780.41
 Civil servant0.100.290.090.29
Part-time0.340.470.350.48
Short-time work0.050.21--
Household income (net, ln(Euro))8.170.488.140.48
Household income contribution
 One-person household0.320.460.310.46
 Respondent contributes more than 2/3 to income0.530.500.520.50
 Respondent contributes equal/less than 2/30.160.360.170.37
Single parent0.050.220.060.23
Number of children in household (<age 14)0.580.870.640.91
Religious boundaries
 Christian0.600.490.600.49
 Muslim0.000.060.000.06
 Other0.010.110.010.11
 No affiliation0.380.490.380.49
Survey year
 2015--0.110.31
 2016--0.110.31
 2017--0.140.35
 2018--0.150.36
 2019--0.170.38
 20200.520.500.170.37
 20210.480.500.150.36
N535716,704
Sources: SOEP-CoV waves 1 and 2, SOEP v36.1.
Table A2. Descriptive statistics, first generation.
Sample for M1bSample for M3b
MeanSDMeanSD
Financial worries--0.820.66
Fear of job loss15.3023.36-
Years since migration22.1210.1920.2110.23
Female0.630.480.610.49
Age in years44.769.2143.369.16
Educational attainment
 Low (ISCED 1–2)0.090.290.090.28
 Medium (ISCED 3–5)0.430.500.440.50
 High (ISCED 6–8)0.480.500.470.50
Degree acquired abroad0.330.470.350.48
German language proficiency3.510.613.460.66
Self-assessed health7.621.757.431.82
Occupational status (SIOPS)44.1914.7044.2914.99
Atypical employment0.190.390.210.41
Prior episodes of unemployment (in years)0.741.880.661.70
Employment tenure (in years)8.386.697.376.72
Employment tenure squared (in years2)0.240.430.240.43
Public sector
Type of job
 Blue collar0.170.370.190.40
 White collar0.810.390.780.41
 Civil servant0.020.150.020.14
Part-time0.310.460.310.46
Short-time work0.070.26--
Household income (net, ln(Euro))8.100.488.070.46
Household income contribution
 One-person household0.240.430.230.42
 Respondent contributes more than 2/3 to income0.560.500.570.50
 Respondent contributes equal/less than 2/30.200.400.210.40
Single parent0.040.200.030.18
Number of children in household (<age 14)0.730.930.750.93
Religious boundaries
 Christian0.580.490.580.49
 Muslim0.020.130.020.14
 Other0.060.230.050.23
 No affiliation0.350.480.340.48
Legal status
 German/EU-citizen0.830.370.820.38
 Unlimited residence permit0.140.350.150.36
 Temporary residence permit0.020.150.020.14
Survey year
 2019--0.090.29
 2016--0.120.32
 2017--0.140.34
 2018--0.150.36
 2019--0.180.38
 20200.540.500.180.38
 20210.460.500.150.36
n6511988
Sources: SOEP-CoV waves 1 and 2, SOEP v36.1.
Table A3. Linear regression M2b with alternative FE specifications, first generation.
DV: Fear of Job LossNACENACEKldB 10KldB 10NACE
Scale: Self-Assessed Percentage (0–100)1-Digit2-Digit1-Digit2-DigitKldB 10
1-Digit
Years since migration−0.13−0.12−0.10−0.17−0.14
Female (vs. male)−3.26−3.51−1.92−0.85−2.12
Age in years0.040.02−0.010.140.07
Conditions signaling objective risks of job loss
Educational attainment (Ref.: low (ISCED 1–2))
 Medium (ISCED 3–5)−0.62−1.95−1.94−0.68−0.52
 High (ISCED 6–8)0.21−2.22−0.700.210.26
Degree acquired abroad0.712.681.090.940.79
German language proficiency0.530.82−0.73−0.760.19
Self-assessed health−1.43 *−1.56 *−1.44 *−0.96−1.52 *
Occupational status (SIOPS)−0.04−0.020.020.130.05
Atypical employment (Ref.: no)3.104.973.163.773.09
Prior episodes of unemployment (in years)1.281.831.150.241.16
Employment tenure (in years)0.470.880.800.870.60
Employment tenure squared (in years2)−0.03−0.04 *−0.04−0.04 *−0.03
Public sector (vs. private sector)0.972.96−0.30−2.511.87
Type of job (Ref.: blue collar)
 White collar1.071.861.471.841.33
 Civil servant−6.74−11.68 *−7.07−2.41−7.21
Part-time work (vs. full-time work)5.27 *4.673.182.934.89 *
Short-time work10.38 *7.218.91 *8.388.95 *
Conditions signaling means to cope with job loss
Household income (net, ln(Euro))−3.81−4.52−2.83−4.45−4.16
Household income contribution (Ref. one-person HH)
 Respondent contributes more than 2/3 to income0.380.780.633.420.01
 Respondent contributes equal/less than 2/3−2.32−1.29−1.662.10−2.60
Single parent−5.55−5.50−6.15−5.05−5.54
Number of children in household (<age 14)1.902.241.19−0.041.67
Conditions signaling acceptance and inclusion
Religious boundaries (Ref.: Christian)
 Muslim−9.55−10.89−7.60−7.61−10.18
 Other−0.83−0.05−0.581.39−0.48
 No affiliation−0.91−1.37−2.10−0.58−2.09
Legal status (Ref.: German/EU-citizen)
 Unlimited residence permit3.802.854.294.675.17
 Temporary residence permit7.374.127.8111.979.10
Occupation and industry FEsyesyesyesyesyes
Survey year 2021 (Ref.: 2020)−5.43 ***−5.91 ***−5.84 ***−6.15 ***−5.63 ***
Intercept62.20 *65.97 *42.6639.8155.26 *
R20.1720.2620.1690.2280.200
n649649644644642
Notes: Unstandardized coefficients; significance levels (SEs clustered on individual level): * p < 0.05, *** p < 0.001. Sources: SOEP-CoV waves 1 and 2, SOEP v36.1.
Table A4. Linear regression, financial worries, 2015 to 2021.
M3a
All Respondents
M3b
First Generation
DV: Financial Worries
Scale: 0–2 (0 = Not Concerned, 2 = Very Concerned)
Main Effects (’15–’19)Interactions with ‘20/’21Main Effects (’15–’19)Interactions with ‘20/’21
Generation status (Ref.: native-born ethnic majority)
 Second generation0.05−0.01
 First generation0.11 ***0.12 ***
Years since migration--−0.00−0.00
Female (vs. male)0.09 ***−0.040.02−0.03
Age in years0.000.00−0.010.00
Conditions signaling objective risks of job loss
Educational attainment (Ref.: low (ISCED 1–2))
 Medium (ISCED 3–5)−0.12 *−0.01−0.090.02
 High (ISCED 6–8)−0.18 ***0.02−0.200.08
Degree acquired abroad--0.120.04
German language proficiency--−0.060.04
Self-assessed health−0.05 ***0.01−0.05 ***−0.02
Occupational status (SIOPS)−0.00 ***0.00−0.000.00
Atypical employment (Ref.: no)0.030.030.12 *−0.05
Prior episodes of unemployment (in years)0.01 *0.01 *0.020.01
Employment tenure (in years)−0.000.000.000.00
Employment tenure squared (in years2)−0.000.000.00−0.00
Public sector (vs. private sector)−0.01−0.17 ***−0.00−0.20 **
Type of job (Ref.: blue collar)
 White collar−0.08 **−0.010.01−0.01
 Civil servant−0.20 ***−0.030.09−0.43
Part-time work (vs. full-time work)−0.02−0.010.010.00
Conditions signaling means to cope with job loss
Household income (net, ln(Euro))−0.31 ***0.16 ***−0.32 ***0.17
Household income contribution (Ref. one-person HH)
 Respondent contributes more than 2/3 to income0.11 ***−0.020.24 **−0.15
 Respondent contributes equal/less than 2/30.10 ***−0.030.14−0.18
Single parent0.11 **−0.13 *0.14−0.45 *
Number of children in household (<age 14)0.03 ***0.01−0.010.04
Conditions signaling acceptance and inclusion
Religious boundaries (Ref.: Christian)
 Muslim0.200.060.37 *−0.20
 Other0.07−0.00−0.100.05
 No affiliation0.01−0.020.04−0.15 *
Legal status (Ref.: German/EU-citizen)
 Unlimited residence permit--−0.02−0.00
 Temporary residence permit--−0.010.01
Occupation and industry FEsnono
Survey year (Ref.: 2015)
 2016−0.05 **0.02
 2017−0.04 *0.03
 2018−0.13***−0.12 *
 2019−0.04 *0.06
 2020 (conditional)0.09 ***0.12 **
 2021 (conditional)−1.66 ***−1.23
Intercept3.75 ***4.22 ***
R20.1650.156
n16,7041988
Notes: Unstandardized coefficients; significance levels (SEs clustered on individual level): * p < 0.05, ** p < 0.01, *** p < 0.001. Sources: SOEP-CoV waves 1 and 2, SOEP v36.1.
Table A5. Linear regressions, estimates for occupation and industry fixed effects.
DV: Fear of Job Loss
Scale: Self-Assessed Percentage (0–100)
M2aM2b
DV: Financial Worries
Scale: 0–2 (0 = Not Concerned, 2 = Very Concerned)
M4aM4b
KldB 2010 (2-digit)Ref.: 11Ref.: 12Ref.: 11Ref.: 11
120.81-−0.09−2.13 ***
21−23.31 *18.940.25−1.87 ***
224.8141.70 *0.00−1.69 ***
23−2.036.560.18−1.85 ***
240.9627.320.16−1.65 ***
25−1.0330.240.13−1.52 ***
26−5.0311.010.07−1.44 ***
27−4.2817.000.03−1.73 ***
28−14.0861.80 *−0.03−1.47 ***
29−2.966.33−0.01−1.79 ***
31−1.3432.01−0.08−1.36 ***
325.16100.41 ***0.02−1.62 ***
334.4330.72−0.10−1.80 ***
342.38−4.190.05−1.71 ***
41−2.54−2.08−0.07−1.80 ***
425.2566.63 ***0.01−0.78 *
43−2.6923.89−0.02−1.68 ***
51−0.3928.72−0.00−1.75 ***
522.4140.88 *0.07−1.49 ***
53−1.904.420.03−1.52 ***
543.0527.78 *0.04−1.35 ***
610.3539.44 *0.09−1.65 ***
62−1.2931.82−0.01−1.96 ***
630.705.34−0.19−2.32 ***
71−3.3124.530.00−1.53 ***
72−2.6813.26−0.05−1.72 ***
73−3.1326.14−0.00−1.50 ***
81−4.5213.64−0.07−1.78 ***
82−4.6112.390.00−1.50 ***
83−3.4419.44−0.01−1.42 ***
84−3.796.82−0.04−1.59 ***
916.0711.530.01−1.64 ***
92−2.2527.50−0.04−1.43 ***
9312.44-0.10-
942.30-−0.02-
NACE (2-digit)Ref.: 1Ref.: 10Ref.: 1Ref.: 1
21.17-−0.02-
3−7.62-−0.85 ***-
534.65 ***-−0.04-
6--0.30 **-
108.09 *-−0.100.55 *
110.79-−0.03-
1325.09 *10.030.160.75 ***
145.90−52.78 ***−0.100.33
1555.60 ***−14.64−0.090.18
16−0.21−40.78 **−0.090.08
174.06−19.23−0.200.66 ***
1814.67 **−7.54−0.160.77 *
19−0.01-−0.65 ***-
207.20 *12.25−0.20 *0.64 **
218.14−1.36−0.030.90 ***
224.95−32.880.060.79 ***
2314.70 *-−0.190.52
2415.67 **-0.101.03 ***
2511.65 **2.20−0.20 *0.41 *
2611.54 **−1.83−0.090.50
279.61 **−10.12−0.080.43
2811.40 ***10.43−0.160.25
2910.04 **−10.05−0.090.44 *
3014.08 *−18.160.020.72 **
311.53-−0.250.27
3213.52 ***−1.22−0.060.58 *
33−2.50−30.27*−0.33−0.46 *
3510.05 *-−0.13-
360.32-−0.13−0.08
37--0.43-
382.46-−0.09-
415.63−24.56 *−0.120.38
425.55−31.48 *−0.24 *−0.54
435.55−9.81−0.100.35
4510.14 *−17.06−0.200.21
468.33 *−29.36−0.130.36
473.61−14.46−0.070.72 ***
495.83−20.25−0.090.31
50−2.96-0.06-
5127.27 **9.75−0.040.33
521.91−18.37−0.110.58 *
530.84−17.84−0.160.59 *
558.1420.38−0.030.94 ***
5619.39 ***16.330.100.75 **
5812.61-−0.24*0.44
59−9.43-−0.62*-
6016.03 *−30.00 **0.030.42
612.75−21.01−0.18−0.20
628.31 **−8.80−0.080.45 *
633.02−43.96 **−0.15−0.21
646.40 *−15.82−0.060.72 **
653.82−6.46−0.150.51*
662.34-−0.04-
681.350.34−0.180.89 ***
693.33−2.35−0.090.56 **
707.70-−0.12-
714.96−29.35−0.180.31
725.80−24.37 *−0.000.47
7312.13*−29.37 *−0.040.32
745.76−0.780.030.64 *
75−0.38-−0.18-
789.052.310.181.18 ***
794.22−7.98−0.120.60 *
805.02-−0.20−0.02
813.052.61−0.050.69 **
825.50−17.35−0.060.36
843.16−17.41−0.17*0.29
854.14−10.80−0.090.34
862.71−16.10−0.040.62 ***
87−0.52−15.88−0.150.30
881.87−22.10 *−0.100.23
9013.8312.360.060.96 ***
915.68-−0.32-
9217.0821.15−0.37 **0.27
9320.26 *-0.03-
946.000.00−0.140.41 *
9527.42-−0.04-
969.11−2.650.03-
9710.03-0.30-
990.16-−0.32*-
n531064216,4091942
Notes: Unstandardized coefficients; significance levels (SEs clustered on individual level): * p < 0.05, ** p < 0.01, *** p < 0.001. Sources: SOEP-CoV waves 1 and 2, SOEP v36.1.

Notes

1.
Individuals who worked short-time in 2020 (n = 221) were not asked whether they usually worked full time or part time. To fill in these blanks, we had to rely on information from 2019 and were able to assign corresponding values to 190 employees.
2.
Data preparation and data analyses were performed using Stata 17.0 MP. Replication code is available at www.github.com/mbue/ji-cov-mig (accessed on 11 April 2022).
3.
Despite the ordinal measurement of the dependent variable “financial worries”, we refrain from presenting ordered logit models for two reasons: They show comparable effects to linear models (results upon request), and linear models allow for comparisons across model specifications (Mood 2010).
4.
We present descriptive statistics separately for the two samples in Appendix A (for the overall sample used in models M1a/3a, see Table A1, and for the sample of first-generation immigrants used in models M1b/M3b, see Table A2).
5.
We had to drop a small number of cases in models M2a/b and M4a/b due to missing information on occupation and/or industry categories.
6.
Although it seems counter-intuitive to estimate interactions for the years 2020/2021 while controlling for a discrete time trend, separate models for both periods of interest (i.e., 2015–2019 and 2020–2021) with a discrete time trend yield the same point estimates as the fully interacted model.
7.
Practically, we derive yearly weighted means for the first generation, the second generation, and the native-born ethnic majority with an OLS regression capturing only the interactions between generation status and survey-year dummies while applying weights.
8.
In Table A3 in Appendix A, we present five additional models with alternative fixed-effects specifications. They illustrate the degree to which the various coefficients are sensitive to the kind of specification. While some of the estimates show variation across specifications, the various alternatives yield robust results for most estimates.
9.
Table A5 in Appendix A displays the estimates for occupation and industry fixed effects for models M2a/2b and M4a/4b.

References

  1. Adams-Prassl, Abi, Teodora Boneva, MartaGolin, and Christopher Rauh. 2020. Inequality in the impact of the coronavirus shock: Evidence from real time surveys. Journal of Public Economics 189: 104245. [Google Scholar] [CrossRef]
  2. Alba, Richard. 2005. Bright vs. blurred boundaries: Second-generation assimilation and exclusion in France, Germany, and the United States. Ethnic and Racial Studies 28: 20–49. [Google Scholar] [CrossRef]
  3. Anderson, Christopher J., and Jonas Pontusson. 2007. Workers, worries and welfare states: Social protection and job insecurity in 15 OECD countries. European Journal of Political Research 46: 211–35. [Google Scholar] [CrossRef]
  4. Auer, Daniel. 2022. Firing discrimination: Selective labor market responses of firms during the COVID-19 economic crisis. PLoS ONE 17: e0262337. [Google Scholar] [CrossRef] [PubMed]
  5. Bambra, Clare, and Terje A. Eikemo. 2015. Insecurity, unemployment, and health: A social epidemiological perspective. In The Oxford Handbook of Job Loss and Job Search. Edited by Ute-Christine Klehe and Edwin A. J. van Hoof. Oxford: Oxford University Press. [Google Scholar]
  6. Brücker, Herbert, Lidwina Gundacker, Andreas Hauptmann, and Philipp Jaschke. 2021. Die Arbeitsmarktwirkungen der COVID-19-Pandemie auf Geflüchtete und andere Migrantinnen und Migranten. IAB-Forschungsbericht, 5. Nürnberg: IAB. [Google Scholar]
  7. Cheng, Grand H.-L., and Darius K.-S. Chan. 2008. Who suffers more from job insecurity? A metaanalytic review. Applied Psychology: An International Review 57: 272–303. [Google Scholar] [CrossRef]
  8. Clark, Eva, Karla Fredricks, Laila Woc-Colburn, Maria Elena Bottazzi, and Jill Weatherhead. 2020. Disproportionate impact of the COVID-19 pandemic on immigrant communities in the United States. PLoS Neglected Tropical Diseases 14: e0008484. [Google Scholar] [CrossRef]
  9. Couch, Kenneth A., Robert W. Fairlie, and Huanan Xu. 2020. Early evidence of the impacts of COVID-19 on minority unemployment. Journal of Public Economics 192: 104287. [Google Scholar] [CrossRef]
  10. de Witte, Hans, and Katharina Näswall. 2003. Objective versus subjective job insecurity: Consequences of temporary work for job satisfaction and organizational commitment in four European countries. Economic and Industrial Democracy 24: 149–88. [Google Scholar] [CrossRef]
  11. Degner, Juliane, and Dirk Wentura. 2010. Automatic prejudice in childhood and early adolescence. Journal of Personality and Social Psychology 98: 356–74. [Google Scholar] [CrossRef]
  12. Diehl, Claudia, Elisabeth Liebau, and Peter Mühlau. 2021. How often have you felt disadvantaged? Explaining perceived discrimination. Kölner Zeitschrift für Soziologie und Sozialpsychologie 73: 1–24. [Google Scholar] [CrossRef]
  13. Diehl, Claudia, Marion Fischer-Neumann, and Peter Mühlau. 2016. Between ethnic options and ethnic boundaries: Recent Turkish and Polish migrants’ identification with Germany. Ethnicities 16: 236–60. [Google Scholar] [CrossRef] [Green Version]
  14. Erlinghagen, Marcel. 2008. Self-perceived job insecurity and social context: A multi-level analysis of 17 European countries. European Sociological Review 24: 183–97. [Google Scholar] [CrossRef]
  15. Falkenhain, Mariella, Uwe Flick, Andreas Hirseland, Shahed Naji, Kristina Seidelsohn, and Thomas Verlage. 2021. Setback in labour market integration due to the COVID-19 crisis? An explorative insight on forced migrants’ vulnerability in Germany. European Societies 23: 448–63. [Google Scholar] [CrossRef]
  16. Fassani, Francesco, and Jacopo Mazza. 2020. A Vulnerable Workforce: Migrant Workers in the COVID-19 Pandemic. Luxembourg: Publications Office of the European Union. [Google Scholar]
  17. Friedberg, Rachel. 2000. You can’t take it with you? Immigrant assimilation and the portability of human capital. Journal of Labor Economics 18: 221–51. [Google Scholar] [CrossRef] [Green Version]
  18. Froehlich, Laura, and Isabel Schulte. 2019. Warmth and competence stereotypes about immigrant groups in Germany. PLoS ONE 14: e0223103. [Google Scholar] [CrossRef]
  19. Fuchs, Lukas M., Jannes Jacobsen, Lena Walther, Eric Hahn, Thi Minh Tam Ta, Malek Bajbouj, and Christian von Scheve. 2021. The Challenged Sense of Belonging Scale (CSBS)—A validation study in English, Arabic, and Farsi/Dari among refugees and asylum seekers in Germany. Measurement Instruments for the Social Sciences 3: 3. [Google Scholar] [CrossRef]
  20. Gelatt, Julia. 2020. Immigrant Workers: Vital to the U.S. COVID-19 Response, Disproportionately Vulnerable. Washington, DC: Migration Policy Institute. [Google Scholar]
  21. Goebel, Jan, Markus M. Grabka, Stefan Liebig, Martin Kroh, David Richter, Carsten Schröder, and Jürgen Schupp. 2019. The German Socio-Economic Panel (SOEP). Jahrbücher für Nationalökonomie und Statistik 239: 345–60. [Google Scholar] [CrossRef] [Green Version]
  22. Guadagno, Lorenzo. 2020. Migrants and the COVID-19 Pandemic: An Initial Analysis. Geneva: IOM. [Google Scholar]
  23. Larsen, Mikkel Haderup, and Merlin Schaeffer. 2021. Healthcare chauvinism during the COVID-19 pandemic. Journal of Ethnic and Migration Studies 47: 1455–73. [Google Scholar] [CrossRef]
  24. Heath, Anthony, and Sin Yi Cheung. 2007. Unequal Chances: Ethnic Minorities in Western Labor Markets. Oxford: Oxford University Press. [Google Scholar]
  25. Huang, Guo, Cynthia Lee, Susan Ashford, Zhenxiong Chen, and Xiaopeng Ren. 2010. Affective job insecurity: A mediator of cognitive job insecurity and employee outcomes relationships. International Studies of Management and Organization 40: 20–39. [Google Scholar] [CrossRef] [Green Version]
  26. Jiang, Lixin, and Lindsey M. Lavaysse. 2018. Cognitive and affective job insecurity: A meta-analysis and a primary study. Journal of Management 44: 2307–42. [Google Scholar] [CrossRef]
  27. Kara, Selin, Christian Schmitt, and SOEP Group. 2021. SOEP-Core v36: Biographical Information in the Meta file PPFAD (Month of Birth, Immigration Variables, Living in East or West Germany in 1989). SOEP Survey Papers, Series D; Berlin: DIW, p. 987. [Google Scholar]
  28. Keim, Alaina C., Ronald Landis, Charles Pierce, and David R. Earnest. 2014. Why do employees worry about their jobs? A meta-analytic review of predictors of job insecurity. Journal of Occupational Health Psychology 19: 269–90. [Google Scholar] [CrossRef] [PubMed]
  29. Kühne, Simon, Martin Kroh, Stefan Liebig, and Sabine Zinn. 2020. The need for household panel surveys in times of crisis: The case of SOEP-CoV. Survey Research Methods 14: 195–203. [Google Scholar]
  30. Landsbergis, Paul A., Joseph G. Grzywacz, and Anthony D. LaMontagne. 2012. Work organization, job insecurity, and occupational health disparities. American Journal of Industrial Medicine 57: 495–515. [Google Scholar] [CrossRef] [PubMed]
  31. László, Krisztina D., Hynek Pikhart, Mária S. Kopp, Martin Bobak, Andrzej Pajak, Sofia Malyutina, Gyöngyvér Salavecz, and Michael Marmot. 2010. Job insecurity and health: A study of 16 European countries. Social Science & Medicine 70: 867–74. [Google Scholar]
  32. Liebau, Elisabeth, and Ingrid Tucci. 2015. Migrations- und Integrationsforschung mit dem SOEP von 1984 bis 2012: Erhebung, Indikatoren und Potenziale. SOEP Survey Papers, Series C; Berlin: DIW, p. 270. [Google Scholar]
  33. Liu, Xiaomin, Steven J. Bowe, Allison Milner, Lin Li, Lay San Too, and Anthony D. LaMontagne. 2019. Job insecurity: A comparative analysis between migrant and native Workers in Australia. International Journal of Environmental Research and Public Health 16: 4159. [Google Scholar] [CrossRef] [Green Version]
  34. Lübke, Christiane, and Marcel Erlinghagen. 2014. Self-perceived job insecurity across Europe over time: Does changing context matter? Journal of European Social Policy 24: 319–36. [Google Scholar] [CrossRef]
  35. Mood, Carina. 2010. Logistic regression: Why we cannot do what we think we can do, and what we can do about it. European Sociological Review 26: 67–82. [Google Scholar] [CrossRef] [Green Version]
  36. Muñoz de Bustillo, Rafael, and Pablo de Pedraza. 2010. Determinants of job insecurity in five European countries. European Journal of Industrial Relations 16: 5–20. [Google Scholar] [CrossRef]
  37. Naumann, Elias, Katja Möhring, Maximiliane Reifenscheid, Alexander Wenz, Tobias Rettig, Roni Lehrer, Ulrich Krieger, Sebastian Juhl, Sabine Friedel, Marina Fikel, and et al. 2020. COVID-19 policies in Germany and their social, political, and psychological consequences. European Policy Analysis 6: 191–202. [Google Scholar] [CrossRef]
  38. Nemteanu, Marcela-Sefora, Vasile Dinu, and Dan-Cristian Dabija. 2021. Job insecurity, job instability, and job satisfaction in the context of the COVID-19 pandemic. Journal of Competitiveness 13: 65–82. [Google Scholar] [CrossRef]
  39. OECD. 2021. COVID-19 and Well-Being. Life in the Pandemic. Paris: OECD. [Google Scholar]
  40. Lopez, Mark Hugo, Lee Rainie, and Abby Budiman. 2020. Financial and Health Impacts of COVID-19 Vary Widely by Race and Ethnicity. Available online: https://www.pewresearch.org/fact-tank/2020/05/05/financial-and-health-impacts-of-covid-19-vary-widely-by-race-and-ethnicity/ (accessed on 1 March 2022).
  41. Probst, Tahira M., Lixin Jiang, and Wendi Benson. 2014. Job insecurity and anticipated job loss: A primer and exploration of possible interventions. In The Oxford Handbook of Job Loss and Job Search. Edited by Ute-Christine Klehe and Edwin van Hooft. Oxford: Oxford University Press. [Google Scholar]
  42. Schröder, Carsten, Jan Goebel, Markus M. Grabka, Daniel Graeber, Martin Kroh, Hannes Kröger, Simon Kühne, Stefan Liebig, Jürgen Schupp, Johannes Seebauer, and et al. 2020. Erwerbstätige Sind Vor Dem COVID-19-Virus Nicht Alle Gleich. SOEP Papers on Multidisciplinary Panel Data Research. Berlin: DIW, p. 1080. [Google Scholar]
  43. Shen, Jing, and David Bartram. 2021. Fare differently, feel differently: Mental well-being of UK-born and foreign-born working men during the COVID-19 pandemic. European Societies 23: 370–83. [Google Scholar] [CrossRef]
  44. Shoss, Mindy K. 2017. Job insecurity: An integrative review and agenda for future research. Journal of Management 43: 1911–39. [Google Scholar] [CrossRef]
  45. Strabac, Zan, and Ola Listhaug. 2008. Anti-Muslim prejudice in Europe: A multilevel analysis of survey data from 30 countries. Social Science Research 37: 268–86. [Google Scholar] [CrossRef]
  46. Treiman, Donald J. 1977. Occupational Prestige in Comparative Perspective. New York: Academic Press. [Google Scholar]
  47. Zschirnt, Eva, and Didier Ruedin. 2016. Ethnic discrimination in hiring decisions: A meta-analysis of correspondence tests 1990–2015. Journal of Ethnic and Migration Studies 42: 1115–34. [Google Scholar] [CrossRef] [Green Version]
Figure 1. Developments of subjective job insecurity over time. Sources: SOEP-CoV waves 1 and 2, SOEP v36.1, weighted.
Socsci 11 00224 g001
Table 1. Linear regressions, fear of job loss, 2020/2021.
DV: Fear of Job LossM1aM2aM1bM2b
Scale: Self-Assessed Percentage (0–100)All RespondentsFirst Generation
Generation status (Ref.: native-born ethnic majority)
 Second generation0.050.40
 First generation3.98 ***4.37 ***
Years since migration−0.09−0.16
Female (vs. male)0.492.32 ***−4.54−1.88
Age in years−0.010.04−0.090.16
Conditions signaling objective risks of job loss
Educational attainment (Ref.: low (ISCED 1–2))
 Medium (ISCED 3–5)−2.24−1.20−2.212.41
 High (ISCED 6–8)−1.57−1.14−0.123.50
Degree acquired abroad−0.250.21
German language proficiency−0.170.58
Self-assessed health−0.89 ***−0.86 ***−1.29 *−1.16
Occupational status (SIOPS)−0.030.05−0.130.18
Atypical employment (Ref.: no)1.711.763.324.37
Prior episodes of unemployment (in years)0.370.321.320.72
Employment tenure (in years)−0.05−0.110.821.22 *
Employment tenure squared (in years squared)−0.000.00−0.03−0.06 **
Public sector (vs. private sector)−6.59 ***−4.18 ***−4.360.89
Type of job (Ref.: blue collar)
 White collar−2.36 *−0.48−0.161.30
 Civil servant−4.30 ***−1.39−10.34 *−7.20
Part-time work (vs. full-time work)−0.370.222.745.06 *
Short-time work17.11 ***13.89 ***12.00 **6.96
Conditions signaling means to cope with job loss
Household income (net, ln(Euro))−2.39 **−3.28 ***−2.39−7.05 *
Household income contribution (Ref. one-person household)
 Respondent contributes more than 2/3 to income0.741.190.734.07
 Respondent contributes equal/less than 2/3−0.10−0.04−2.043.08
Single parent−0.13−0.13−6.66−4.51
Number of children in household (<age 14)0.710.561.560.45
Conditions signaling acceptance and inclusion
Religious boundaries (Ref.: Christian)
 Muslim1.472.14−4.50−11.88
 Other1.510.79−1.841.26
 No affiliation0.810.540.080.40
Legal status (Ref.: German/EU-citizen)
 Unlimited residence permit1.314.10
 Temporary residence permit3.2613.68
Occupation and industry FEsnoyesnoyes
Survey year 2021 (Ref.: 2020)−3.60 ***−3.77 ***−5.58 ***−6.41 ***
Intercept42.55 ***36.43 ***57.51 *47.31
R20.1490.2130.1220.361
n53575310651642
Notes: Unstandardized coefficients; significance levels (SEs clustered on individual level): * p < 0.05, ** p < 0.01, *** p < 0.001. Table A5 in Appendix A displays the estimates for occupation and industry fixed effects (M2a/b). Sources: SOEP-CoV waves 1 and 2, SOEP v36.1.
Table 2. Linear regressions, financial worries, 2015–2021.
M4a
All Respondents
M4b
First Generation
DV: Financial Worries
Scale: 0–2 (0 = Not Concerned, 2 = very Concerned)
Main Effects (’15–’19)Interactions with ’20/’21Main effects (’15–’19)Interactions with ’20/’21
Generation status (Ref.: native-born ethnic majority)
 Second generation0.04−0.01--
 First generation0.11 ***0.13 ***--
Years since migration--−0.00−0.01
Female (vs. male)0.10 ***−0.04−0.02−0.03
Age in years0.000.00−0.010.00
Conditions signaling objective risks of job loss
Educational attainment (Ref.: low (ISCED 1–2))
 Medium (ISCED 3–5)−0.13 *−0.02−0.03−0.04
 High (ISCED 6–8)−0.18 ***0.02−0.160.02
Degree acquired abroad--0.15 *0.09
German language proficiency--−0.060.05
Self-assessed health−0.05 ***0.01−0.05 ***−0.02
Occupational status (SIOPS)−0.00 **0.00−0.000.00
Atypical employment (Ref.: no)0.030.030.12 *−0.08
Prior episodes of unemployment (in years)0.010.010.020.01
Employment tenure (in years)−0.000.00−0.000.01
Employment tenure squared (in years squared)−0.000.000.00−0.00
Public sector (vs. private sector)0.01−0.17 ***−0.03−0.22 **
Type of job (Ref.: blue collar)
 White collar−0.04−0.020.03−0.03
 Civil servant−0.14 **−0.030.23−0.40
Part-time work (vs. full-time work)−0.01−0.01−0.02−0.02
Conditions signaling means to cope with job loss
Household income (net, ln(Euro))−0.31 ***0.17 ***−0.38 ***0.19 *
Household income contribution (Ref. one-person HH)
 Respondent contributes more than 2/3 to income0.11 ***−0.020.27 **−0.17
 Respondent contributes equal/less than 2/30.10 ***−0.030.18 *−0.21 *
Single parent0.10 *−0.12 *0.10−0.46 *
Number of children in household (<age 14)0.03 **0.01−0.020.03
Conditions signaling acceptance and inclusion
Religious boundaries (Ref.: Christian)
 Muslim0.180.050.35−0.16
 Other0.07−0.01−0.080.01
 No affiliation0.01−0.020.03−0.16 *
Legal status (Ref.: German/EU-citizen)
 Unlimited residence permit--−0.00−0.05
 Temporary residence permit--−0.04−0.00
Occupation and industry FEsyesyes
Survey year (Ref.: 2015)
 2016−0.05 **0.01
 2017−0.03 *0.04
 2018−0.13 ***−0.12 *
 2019−0.04 *0.07
 2020 (conditional)0.10 ***0.12 **
 2021 (conditional)−1.72 ***−1.39 *
Intercept3.82 ***5.85 ***
R20.1800.245
n16,4091942
Notes: Unstandardized coefficients; significance levels (SEs clustered on individual level): * p < 0.05, ** p < 0.01, *** p < 0.001. Table A5 in Appendix A displays the estimates for occupation and industry fixed effects (M4a/b). Sources: SOEP-CoV waves 1 and 2, SOEP v36.1.
Publisher’s Note: MDPI stays neutral with regard to jurisdictional claims in published maps and institutional affiliations.

