Article

Peer Effects of the Same and Different Religions on Faithfulness: A Comparison between Indonesia and India

by
Muhammad Zilal Hamzah
1,
Yukichika Kawata
2,*,
Syed Ahmed Salman
3 and
Eleonora Sofilda
1
1
Faculty of Business and Economics, Trisakti University, Jalan Kyai Tapa No.1 Grogol, Jakarta Barat 11440, Indonesia
2
Faculty of Economics, Kindai University, 4-1 Kowakae 3-chome, Higashiosaka 577-8502, Japan
3
Faculty of Business and Accountancy, Lincoln University College, Wisma Lincoln, No. 12-18, Jalan SS 6/12, Petaling Jaya 47301, Malaysia
*
Author to whom correspondence should be addressed.
Soc. Sci. 2022, 11(5), 220; https://doi.org/10.3390/socsci11050220
Submission received: 15 April 2022 / Revised: 13 May 2022 / Accepted: 15 May 2022 / Published: 18 May 2022

Abstract

:
By employing questionnaire surveys to empirically examine peer effects on religious faithfulness, this study mainly compares Muslims in Indonesia and India as examples. This study uses religious restrictions on foods as the main component of the questionnaire. A total of two variables were selected to examine peer effects: (1) the percentage of respondents’ close friends who follow a different religion and (2) the percentage of people in the respondents’ city who follow the same faith. Ordinary least squares/generalized least squares regression was conducted, and six models were estimated. The results reveal that Indian/Indonesian respondents are more affected by those who follow the same/different religions, respectively, suggesting that relatively smaller groups have larger peer effects on religious faithfulness. Although further investigations are required, these symmetric results may be attributed to the fact that tensions among people from different religions are high/low, and that the percentage of people who follow a different faith in the respondents’ city is high/low in India and Indonesia, respectively.

1. Introduction

It is often the case that a variety of religions exist in a country, and people follow different faiths (Taylor 2002; Bellah and Hammond 2013). There are multiple main religions in some countries (Type A countries), while a certain religion dominates in other countries (Type B countries). Type B countries include Indonesia and India, where 86.7% and 80.5% of people follow Islam and Hinduism, respectively (Kementerian Dalam Negeri 2020; Ministry of Home Affairs 2020). Religious faithfulness or religiosity can be affected by the same and other religious groups, but there seems to be a lack of accumulated scientific knowledge. The present study seeks to fill this knowledge gap. To examine the peer effects on religious faithfulness, Type B countries may be more relevant. People’s attitudes toward religious taboos, such as that which is considered haram for Muslims, are selected as the variables of spiritual faithfulness because such taboos, especially those for foods, are the most understandable, and people face it daily.
If there are some main religions in a country (i.e., Type A countries), people may be more careful with their religious restrictions. Malaysia, where Islam is the official religion, can be regarded as a typical Type A country, and Malay people are expected to follow Islam (Hooker 2004; Shamsul 2001), but other religions also account for a large portion of the population. The share of Islam is 61.3%, while other religions such as Buddhism, Christianity, and Hinduism account for 19.8%, 9.2%, and 6.3%, respectively (Department of Statistics Malaysia 2011). Because nearly 40% of the population are non-Muslim, halal certification plays a vital role in distinguishing halal products for Malaysian Muslims (Abdul et al. 2009; Talib et al. 2017; Nasirun et al. 2019). The Malaysian halal certificate is one of the most respected and influential Islamic credentials, and Malaysia is becoming a leading country in the global halal market (Mahiah Said et al. 2014; Shirin Asa 2017; Kawata et al. 2018). Both Muslims and non-Muslims recognize the Malaysian halal logo; for example, based on a recent study, for the question “have you ever seen the Malaysian halal logo?” 561 (80%) and 139 (20%) of Malaysian respondents selected “definitely yes” and “probably yes,” while no respondents selected “maybe yes,” “maybe no,” or “definitely no” (Kawata and Salman 2020). Malaysian Muslims may be careful in selecting products in their daily lives to better follow religious beliefs (Muhamad et al. 2016; Haque et al. 2018). To do so, they may maximize the use of halal certification.
The situation may be different if a particular religion is dominant (Type B countries). For example, while Indonesian Muslims are faithful to Islamic teachings (Hasan 2009), they are not concerned about halal certification when purchasing products because most products sold in Indonesia are halal (Viverita et al. 2017; Anwar et al. 2018; Nusran et al. 2018). This situation may be similar to that in India. It can be inferred that people who live in countries where a particular religion dominates (Type B countries) are more affected by people of both the same and other religions while being less concerned about certification. Thus, people in these countries are more appropriate as subjects for this study. Thus, in this study, we selected Type B countries to examine peer effects. Indonesia and India were selected because Indonesia is the largest Muslim-majority country (Roslan Mohd Nor and Malim 2014) and India is the largest Hindu-dominant country. There are two methods for examining peer effects. One involves comparing the religious majority of each country (that is, Muslims in Indonesia and Hindus in India), and the other involves comparing those from the same faith. This study employed the latter comparison. Since people from different religions may have different traditions, religious habits, and ways of thinking, the former method of comparison would be more complicated.
People may be affected by people of the same and other religions in their daily lives. Using data obtained through a questionnaire survey, this study selected the following two variables to examine peer effects on people’s religious faithfulness: (1) the percentage of close friends whose religion is different from that of the respondent, and (2) the rate of people in the respondents’ city who believe in the same faith. Both close friends and people living in the same city are expected to significantly affect religious faithfulness (Yasid et al. 2016). It is also essential to select a criterion that appropriately represents religious faithfulness. Since the main targets of this study are Muslims, while replies from followers of other religions can be included, evident and common criteria such as halal for Muslims are preferable (Othman et al. 2016). This study creates such criteria based on respondents’ self-evaluation of their product (mainly foods) selection (Sun et al. 2012). If people follow either Islam or Hinduism, they are expected to avoid consuming pork and beef in their daily lives; these commonly consumed meats are easily obtainable in Indonesia and India (Meyer-Rochow 2009; Erwanto et al. 2014). Thus, a promising criterion of religious faithfulness can be created by asking the respondents the degree to which they adhere to religious rules regarding taboo subjects/aspects in their daily lives.
This study empirically presents the symmetric results of peer effects on religious faithfulness regarding the above two variables for Indonesian and Indian Muslim residents.

2. Materials and Methods

2.1. Questionnaire Survey

The questionnaire was circulated in both Indonesia and India. The Indonesian survey was conducted in the middle of September 2020 via the Internet for citizens in and around Jakarta (Jabodetabek). The Indian surveys were conducted between September and December using snowball sampling in Bengaluru, Chennai, Cochin, Hyderabad, and Vijayawada. The religious ratios of Jakarta and the five study sites in India are tabulated in Table 1. As this study mainly compares Muslims in both countries, five study areas of different Indian states with varied Muslim ratios were selected (Table 1).
The following questions were asked: place of residence (Q1), gender (Q2), age (Q3), marital status (Q4), religion (Q5), educational background (Q6), occupation (Q7), if respondents had family members (including friends living together) who believed in a different religion (Q8), the percentage of respondents’ close friends who believe in a different religion (Q9), and the percentage of people who believe in the same religion in the respondents’ city (Q10). Moreover, 11 questions regarding the religious restrictions on foods (Q11–Q21) were also investigated using a 5-point Likert-type scale. The 11 questions are presented in Table 2.

2.2. Analytical Methods

The primary purpose of this study was to examine the peer effects on religious faithfulness. The ordinary least squares (OLS) and generalized least squares (GLS) regressions were applied for this purpose. The index of faithfulness was constructed using the average values of Q11–Q21 and was used as the explained variable y i (Table 3). The candidate explanatory variables were Q2–Q6, Q9, and Q10. The estimations were performed in R (R Core Team 2019). The regression procedure was as follows: OLS was applied, and the Breusch–Pagan (BP) test was conducted to check for heteroscedasticity. If the H0: BP test statistic = 0 was rejected, GLS was applied; otherwise, the OLS result was used. After selecting OLS/GLS, the variance inflation factor (VIF) of all variables was calculated to check for multicollinearity. VIF < 10 was typically used as the rule of thumb, and this study followed this criterion.
There are six models as tabulated in Table 4.
Specifically, models were constructed as follows:
A_A and A_M models
y i = β i 0 + β i D 1 D 1 + β i D 2 D 2 + β i D 3 D 3 + β i D 4 D 4 + β i D 5 D 5 + β i G E N G E N + β i A G E A G E + β i M A R M A R + β i C H R C H R + β i H I D H I D + β i E D U E D U + β i D I F D I F + β i S A M E S A M E + ε i .
Indonesia_A and Indonesia_M models:
y i = β i 0 + β i G E N G E N + β i A G E A G E + β i M A R M A R + β i C H R C H R + β i H I D H I D + β i E D U E D U + β i D I F D I F + β i S A M E S A M E + ε i .
India_A and India_M models:
y i = β i 0 + β i D 1 D 1 + β i D 2 D 2 + β i D 3 D 3 + β i D 4 D 4 + β i G E N G E N + β i A G E A G E + β i M A R M A R + β i C H R C H R + β i H I D H I D + β i E D U E D U + β i D I F D I F + β i S A M E S A M E + ε i
Note that the dummy variable D5 was removed in the India_A and India_M models to avoid the occurrence of perfect multicollinearity.
In the above models, β s are parameters, ε is the error term, and i I represents the respondents. The questionnaire also asked whether respondents had family members (including friends living together) who believed in a different religion (Q8). Because those who lived with family members whose faith was different were expected to be exceptional, the result of Q8 was examined separately and was not used as the candidate of the explanatory variable of OLS/GLS regressions.

3. Results

3.1. Descriptive Statistics for Q1 to Q7

The descriptive statistics for Q1 to Q7 are presented in Table 5. The Indonesian sample size was 131, while the Indian sample size was 90 for each region, resulting in 450 respondents. In total, 581 respondents were included. The percentage of Muslims among the respondents in the five Indian study areas was 68.9% (Bengaluru), 45.6% (Chennai), 85.6% (Cochin), 66.7% (Hyderabad), and 52.2% (Vijayawada); thus, replies from Muslims accounted for the majority of the sample in all the study sites.

3.2. Explanatory Variable Concerning Peer Effects (Q9 and Q10)

The most critical candidates for the explanatory variables were the replies to Q9 and Q10. The results of these questions are presented in Figure 1 and Figure 2. Q9 asked about the percentage of respondents’ close friends who believed in a different religion. As illustrated in Figure 1, the Indian respondents tended to have more close friends who believed in different religions compared to Indonesian respondents. Q10 asked about the percentage of people who believed in the same faith in the respondents’ city. As illustrated in Figure 2, the Indonesian respondents tended to live in cities where the percentage of citizens with the same religion was higher.

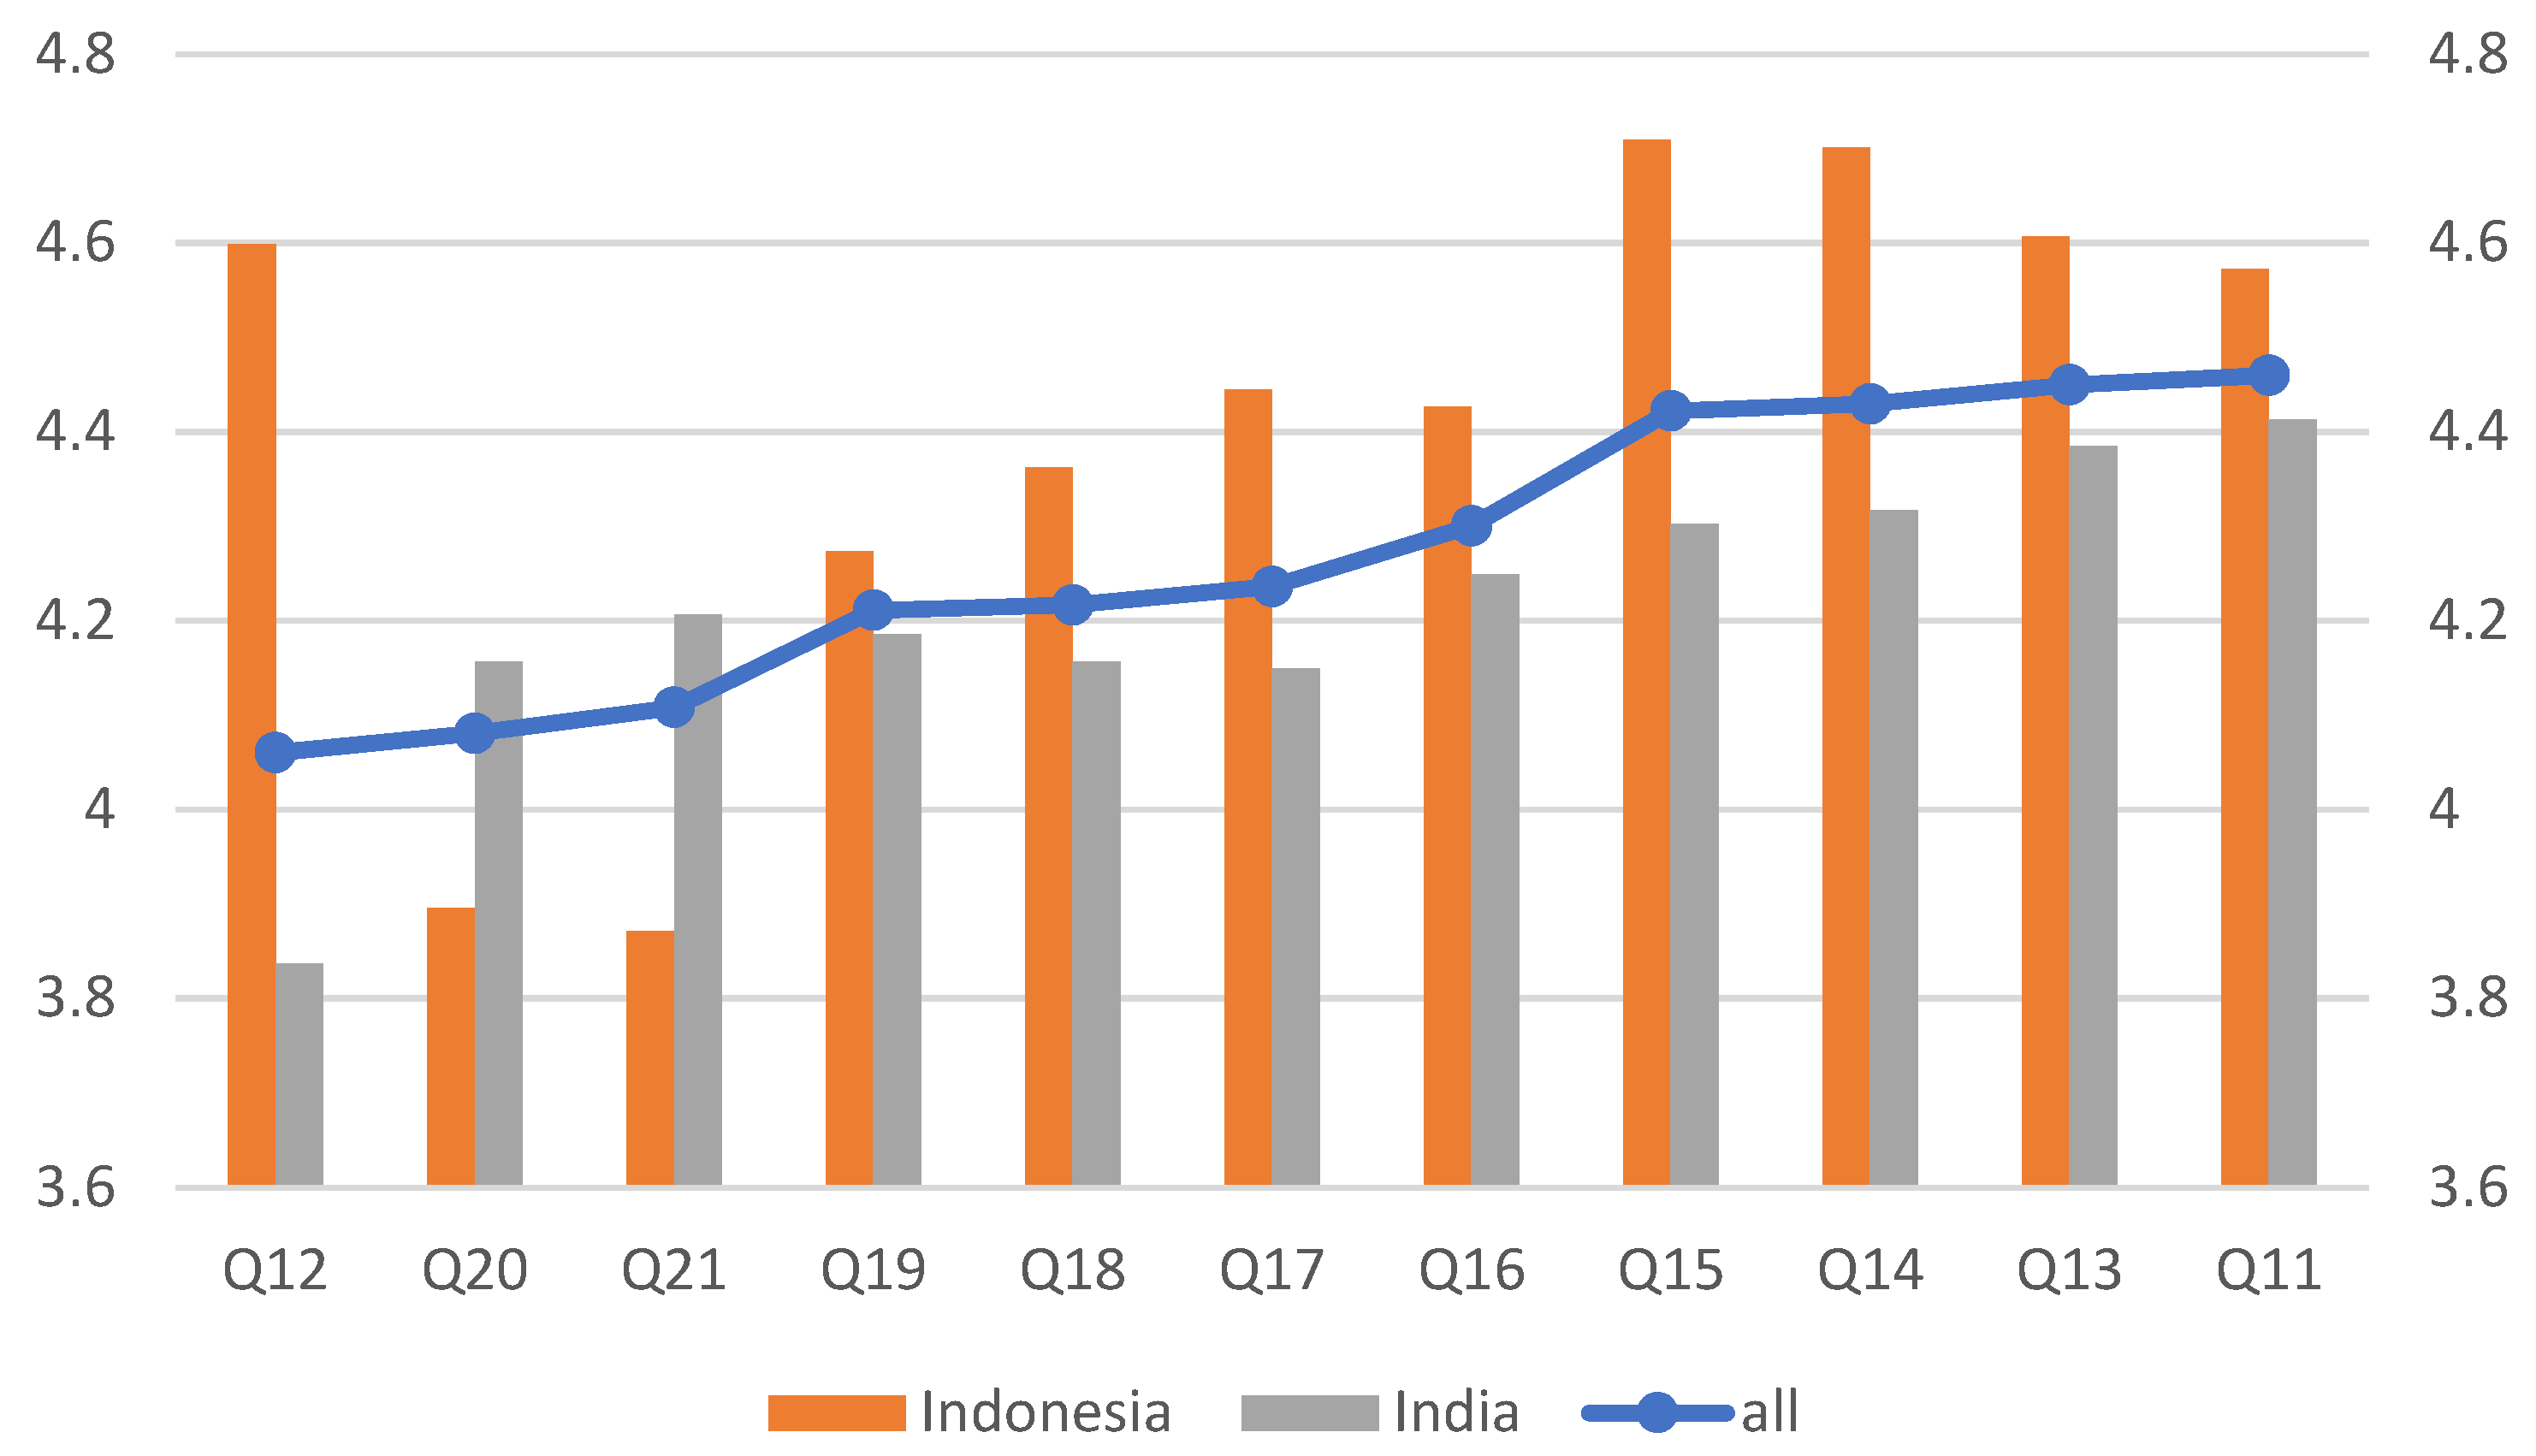
3.3. Explained Variable (Q11–Q21)

The index of faithfulness for each respondent i was constructed using the average values of Q11–Q21 and was used as the explained variable y i for all the models. The scores of Q11–Q21 for the Indonesian respondents (n = 115–117) and Indian respondents (n = 281) are presented in Figure 3. Some respondents did not answer this question because they did not think they were under religious restrictions, such as that which is considered haram for Muslims. Such samples were not included in the estimation because the value of y i was not available. If they provided answers to most of the questions in Q11–Q21 but not for some, these data were used in the analyses. As illustrated in Figure 1, the Indonesian respondents provided higher scores for most questions. The exceptions were exposure (Q20 and Q21). The most apparent difference between the Indonesian and Indian respondents was observed for Q12 ("You avoid buying taboo foods"). The average score was 4.27 for all the respondents, 4.41 for the Indonesian respondents, and 4.21 for the Indian respondents, respectively.

3.4. Examination of Peer Effects

The estimation results of the six models are reported in Table 6. Those who did not answer Q1–Q21, except for Q7 and Q8, were removed. The sample sizes were 395 for the A_A model and less for the other models. Based on the results of the BP test, OLS was applied for one case (Indonesia_M model), whereas GLS was applied for the other five cases. The value of VIF was less than 6 for all cases, suggesting that multicollinearity was not a concern.
The parameter value of the dummy variables (D1 to D5) was negative for the A_A and A_M models, implying that Indonesian respondents had a higher score ( y i ). This result was consistent with the result that the average score of the Indonesian respondents (4.41) was higher than that of the Indian respondents (4.21). The variables GEN (Q2) and AGE (Q3) were not statistically significant at the 10% level, except for the India_A and India_M models. The MAR (Q4) variable was not statistically significant at the 10% level for all six models. The parameter values of CHR (Q5) and HID (Q5) in the A_A, Indonesia_A, and India_A models were negative, implying that Christians and Hindus had lower scores than Muslims. The variable EDU (Q6) parameter values were positive for Indonesian cases (Indonesia_A and Indonesia_M models), meaning that those with higher education had a higher score, and the sign condition was satisfied. However, the variable EDU (Q6) parameter values were negative for Indian cases (India_A and India_M models). The variable DIF (Q9) parameter values were negative for all six models, implying that the score decreases as “the percentage of respondents’ close friends who believe in different religion” increased. However, the variable DIF (Q9) was not statistically significant at the 10% level for the Indian cases (India_A and India_M models). The sign condition was satisfied for the rest of the models (A_A, A_M, Indonesia_A, and Indonesia_M models). The parameter values of the variable SAME (Q10) were positive for the Indonesia_A and Indonesia_M models but were not statistically significant. The parameter values for the variable SAME (Q10) were statistically significantly negative for Indian cases (India_A and India_M models) at the 1% level. The sign condition was satisfied for Indonesian cases (Indonesia_A and Indonesia_A models) but not for Indian cases (India_A and India_M models).

3.5. Living Together with Family Members of a Different Religion (Q8)

As expected, the percentage of respondents who lived with family members (or friends) whose religion was different was small (Table 7). There were 11 (8.4%) and 26 (5.8%) respondents in Indonesia and India, respectively. Because some of the Indonesian respondents live with two or more members whose religion is different, the total number in Table 7 is 14. Although the sample size is small, it can be inferred that religious minorities tend to live with members of different religions. For example, in Indonesia, Christians are a minority, but the number of cases was 11, while the number of Muslims, the majority, was 3. In India, Muslims and Christians are religious minorities, but the number of cases was 22, while there were 4 instances of Hindus. Because the percentage of Muslim respondents was the highest in Indonesia and India, it is more accurate to use percentages for this investigation. The proportion of people living with members of a different religion was 3.0% (3/102) and 4.1% (4/97) for the religious majority in Indonesian Muslims and Indian Hindus, and 41.0% (11/27) and 6.2% (22/353) for religious minorities in Indonesia and India, respectively.

4. Discussion

4.1. Symmetric Results for Indonesian and Indian Models

Many existing studies consider religiosity or religious faithfulness with other factors such as self-identity, knowledge, education, and certification logos in the analyses of purchase behavior (Rahman et al. 2020), business ethics (Kum-Lung and Teck-Chai 2010), job satisfaction (Wening and Choerudin 2015; Amaliah et al. 2015), and economic achievement (Yusof et al. 2018). As such, religious faithfulness is an essential component in the relevant analyses, but the number of studies that examine peer effects on religiosity is limited. Some existing studies discuss peer effects on adolescents’ religiosity in Indonesia (French et al. 2011) and other countries such as the United States (Schwartz et al. 2005; King and Roesner 2009). Others have revealed that both parents and friends influence adolescents’ attendance of religious services (Regnerus et al. 2004). To the best of our knowledge, this study is the first to incorporate peer effects in examining religious faithfulness while considering different countries (Indonesia and India) and religions (e.g., Islam and Hinduism).
Peer effects are essential components by which to explain religious faithfulness based on both existing studies (e.g., Yasid et al. 2016) and the results of the current study. In what follows, some relevant studies are briefly reviewed before discussing the main results of this study. Lon and Widyawati (2019) provide an interesting case from Flores, Indonesia, which investigates the relationship between Catholics and Muslim families. In the communal dining of Catholic and Muslim families, Catholic families offer a pork-free menu to Muslim families. In contrast, Muslim families usually provide a menu with pork for Catholic families. This tradition implies that mutual understanding among different religions is deep, and there are no serious tense relationships. Because the six religions (i.e., Islam, Christianity, Hinduism, and three more) are officially acknowledged, there is freedom of faith in Indonesia (Bräuchler 2014). Note that there are few exceptions, such as conflicts among Christians and Muslims in the Moluccas (Qurtuby 2019). On the other hand, it has been highlighted that there is tension between Hindus, the religious majority, and people of other religions such as Muslims in India (Sen and Wagner 2005; Tausch et al. 2009; Mitra and Ray 2014).
The DIF (Q9) and SAME (Q10) variables are symmetric for the Indonesian and Indian cases (Table 8). DIF (Q9) is significantly negative for the Indonesian cases (Indonesia_A and Indonesia_M models), while SAME (Q10) is significantly negative for the Indian cases (India_A and India_M models) (Table 6). On the other hand, DIF (Q9) is not a statistically significant variable for the Indian cases, and SAME (Q10) is not a statistically significant variable for the Indonesian cases. These results imply that the respondents’ religious faithfulness (i.e., explained variable y i ) takes a lower value if the percentage of respondents’ close friends who believe in a different religion (Q9) increases in Indonesia. On the other hand, respondents’ religious faithfulness (i.e., explained variable y i ) takes a lower value if the percentage of people who believe in the same religion in the respondents’ city (Q10) increases in India.
The surrounding situations for the Indonesian and Indian respondents were also symmetric (Table 8). As illustrated in Figure 1 and Figure 2, the percentage of respondents’ close friends who believe in a different religion (Q9) is low and high for Indonesia and India, respectively. On the other hand, the percentage of people who believe in the same faith in the respondents’ city (Q10) is high and low for Indonesia and India, respectively. Based on the above results, it may be inferred that relatively smaller groups have larger peer effects on respondents’ religious faithfulness. In the Indonesian case, the percentage of people who believe in different religions in the respondents’ city is low, and the Indonesian respondents are affected by DIF (Q9). Similarly, in the Indian case, the percentage of respondents’ close friends who believe in the same religion is low, and the Indian respondents are affected by SAME (Q10).
These results seem to be consistent with the aforementioned studies. There are tensions among people of different religions in India. Thus, it is natural that people would be more self-restrictive when surrounded by people of other religions and vice versa, resulting in statistically significant negative results for SAME (Q10) in the Indian models. There are no such tensions among people of different religions in Jabodetabek. Thus, it is natural that people would be affected by those who believe in different religions and vice versa, resulting in statistically significant and negative results for DIF (Q9) in the Indonesian models. However, limited studies have been conducted on this topic, and future studies are required to confirm the possible influence of religious tensions.

4.2. Influence of Family Members Whose Religion Is Different (Q8)

The number of Indonesian and Indian respondents who indicated that they lived with family members whose religion was different from theirs was 11 and 26, respectively. The percentage of people living with members of a different religion was 3.0% and 4.1% for the religious majority in Indonesian Muslims and Indian Hindus, and 41.0% and 6.2% for religious minorities in Indonesia and India, respectively. There seems to be a tendency for religious minorities to live with members of different religions.

4.3. Validity of Self-Evaluation Results

The results of Q11 to Q21 were averaged, and the average score was used as the explained variables in the models. The average scores of all the respondents, the Indonesian respondents, and the Indian respondents were 4.27, 4.41, and 4.21, respectively. The Indonesian value was 0.2 points higher than that of India, which is statistically significant at the 1% level (two-sided t-test, p = 0.0027, d.f. = 140). The results seem to be valid because religion permeates the daily lives of Indonesian people (French et al. 2008), resulting in high self-evaluation.

5. Conclusions

This study investigated peer effects on religious faithfulness in Indonesia and India using regression analyses with (1) the percentage of respondents’ close friends who follow a different religion and (2) the percentage of people in the respondents’ city who follow the same faith as the main variables. Since religious restrictions on foods are an easily understandable issue for subjects, this study employed 11 questions on food restrictions (Q11–21), and the average scores of these 11 questions were used as the explained variables. The score of the Indonesian sample was higher for most questions, especially Q12, while the score of the Indian sample for Q20 and Q21 was higher than that of the Indonesian sample. Since both Q20 and Q21 are related to exposure, a higher score for these questions among the Indian sample indicates that Muslims in India need to gather information as they constitute the religious minority; additionally, Indonesian Muslims concentrate on religious faithfulness, resulting in a high score for Q12.
In the regression analyses, two variables were used in the examinations: (1) the percentage of respondents’ close friends whose religion is different (DIF (Q9)), and (2) the percentage of people in the city in which the respondent lives who believe in the same faith (SAME (Q10)). The results indicate that the Indonesian respondents are affected more by those who believe in the same religion, while the Indian respondents are affected more by those who believe in a different religion, suggesting that relatively smaller groups have larger peer effects on religious faithfulness. These symmetric results may be attributed to the fact that tensions among people from different religions are high and low in India and Indonesia, respectively, and that the percentage of people who believe in a different faith in the respondents’ city is high and low in India and Indonesia, respectively.
There seems to be a tendency for religious minorities to accept family members whose religion is different. Based on the discussions in Section 4.1 and Section 4.2, it can be concluded that relatively smaller groups such as religious minorities are more important when considering peer effects on religious faithfulness. Although policies in Type B countries may stress the benefits of the religious majority, this study revealed the important roles of religious minorities, and policy makers need to consider the influence of such groups.
Finally, this study has the following limitations. First, only one city from Indonesia was selected. Because Indonesia is varied in both religions and ethnicities, it may be better to gather data from the whole country. However, our samples are still valid because (1) the samples were collected from citizens in Jabodetabek, which is a substantially heterogeneous society (Ariane 2020), and (2) the primary purpose of this study was to check the peer effects of different situations, which may not necessarily require an entire Indonesian sample. Moreover, Indonesia is composed of more than 13,000 islands with varied languages; thus, it is realistic to gather samples from a large region such as Jabodetabek that attracts immigrants from other parts of the country. Second, while Hindus constitute the religious majority in India, most of the Indian sample in this study were Muslims. As pointed out in the Introduction section, different faiths could also have been compared, but people from different faiths may follow different traditions, habits, and ways of thinking, which makes comparisons difficult. Comparisons of different faiths should be addressed in future studies. Third, this study examined only Indonesia and India. These countries were selected because religion is an essential part of the respective populations’ lives, and the religions of Indonesia, especially Islam, are strongly tied to citizens’ daily lives (Snibbe and Markus 2002; Cohen et al. 2005; French et al. 2011); in addition, we selected India because there are tensions among people of different religions in India.

Author Contributions

All the authors have contributed equally, and their surnames are presented alphabetically. All the authors have read and agreed to the published version of the manuscript. The authors are grateful for the reviewers’ helpful comments.

Funding

This research received no external funding.

Data Availability Statement

Contact the corresponding author regarding requests for data.

Conflicts of Interest

The authors declare no conflict of interest.

References

  1. Abdul, Mohani, Hashanah Ismail, Haslina Hashim, and Juliana Johari. 2009. Consumer decision making process in shopping for halal food in Malaysia. China-USA Business Review 8: 40–47. [Google Scholar]
  2. Amaliah, Ima, Tasya Aspiranti, and Pupung Purnamasari. 2015. The impact of the values of Islamic religiosity to Islamic job satisfaction in Tasikmalaya West Java, Indonesia, Industrial Centre. Procedia—Social and Behavioral Sciences 211: 984–91. [Google Scholar] [CrossRef] [Green Version]
  3. Anwar, Moch. Khoirul, A’rasy Fahrullah, and Ahmad Ajib Ridlwan. 2018. The problems of Halal certification for food industry in Indonesia. International Journal of Civil Engineering and Technology 9: 1625–32. [Google Scholar]
  4. Ariane, J. Utomo. 2020. Love in the melting pot: Ethnic intermarriage in Jakarta. Journal of Ethnic and Migration Studies 46: 2896–913. [Google Scholar] [CrossRef]
  5. Bellah, Robert N., and Phillip E. Hammond. 2013. Varieties of Civil Religion (Reprint). Eugene: Wipf and Stock Publishers. [Google Scholar]
  6. Bräuchler, Birgit. 2014. Christian–Muslim relations in post-conflict Ambon, Moluccas: Adat, religion, and beyond. In Religious Diversity in Muslim-Majority States in Southeast Asia: Areas of Toleration and Conflict. Edited by Bernhard Platzdasch and Johan Saravanamuttu. Singapore: ISEAS–Yusof Ishak Institute, Chp. 8. pp. 154–72. [Google Scholar]
  7. Census Organization of India. 2022. The Census 2011 (the 15th National Census Survey). Available online: https://www.census2011.co.in/ (accessed on 9 April 2022).
  8. Cohen, Adam B., Daniel E. Hall, Harold G. Koenig, and Keith G. Meador. 2005. Social versus individual motivation: Implications for normative definitions of religious orientation. Personality and Social. Psychology Review 9: 48–61. [Google Scholar] [CrossRef] [PubMed]
  9. Department of Statistics Malaysia. 2011. Population Distribution and Basic Demographic Characteristic Report 2010. Available online: https://www.dosm.gov.my/v1/index.php?r=column/cthemeByCat&cat=117&bul_id=MDMxdHZjWTk1SjFzTzNkRXYzcVZjdz09&menu_id=L0pheU43NWJwRWVSZklWdzQ4TlhUUT09 (accessed on 24 December 2020).
  10. Erwanto, Yuny, Mohammad Zainal Abidin, Eko Yasin Prasetyo Muslim Sugiyono, and Abdul Rohman. 2014. Identification of pork contamination in meatballs of Indonesia local market using polymerase chain reaction-restriction fragment length polymorphism (PCR-RFLP) analysis. Asian-Australasian Journal of Animal Sciences 27: 1487–92. [Google Scholar] [CrossRef] [Green Version]
  11. French, D. C., N. Eisenberg, J. Vaughan, U. Purwono, and T. A. Suryanti. 2008. Religious involvement and social competence and adjustment of Indonesian Muslim adolescents. Developmental Psychology 44: 597–611. [Google Scholar] [CrossRef]
  12. French, Doran C., Urip Purwono, and Airin Triwahyuni. 2011. Friendship and the religiosity of Indonesian Muslim adolescents. Journal of Youth and Adolescence 40: 1623–33. [Google Scholar] [CrossRef]
  13. Haque, Ahasanul, Naila Anwar, Arun Kumar Tarofder, Nor Suhana Ahmad, and Sultan Rahaman Sharif. 2018. Muslim consumers’ purchase behavior towards halal cosmetic products in Malaysia. Management Science Letters 8: 1305–18. [Google Scholar] [CrossRef]
  14. Hasan, Noorhaidi. 2009. The making of public Islam: Piety, agency, and commodification on the landscape of the Indonesian public sphere. Contemporary Islam 3: 229–50. [Google Scholar] [CrossRef]
  15. Hooker, Virginia Matheson. 2004. Reconfiguring Malay and Islam in Contemporary Malaysia. In Contesting Malayness: Malay Identity Across Boundaries. Edited by Timothy P. Barnard. Singapore: Singapore University Press. [Google Scholar]
  16. Kawata, Yukichika, and Syed Ahmed Salman. 2020. Do different halal certificates have different impacts on Muslims? A case study of Malaysia. Journal of Emerging Economies & Islamic Research 8: 26–39. [Google Scholar] [CrossRef]
  17. Kawata, Yukichika, Sheila Nu Nu Htay, and Syed Ahmed Salman. 2018. Non-Muslims’ acceptance of imported products with halal logo: A case study of Malaysia and Japan. Journal of Islamic Marketing 9: 191–203. [Google Scholar] [CrossRef]
  18. Kementerian Agama (Indonesia). 2022. Portal Data Kementerian Agama. (in Indonesian). Available online: https://data.kemenag.go.id/statistik/agama/umat/agama (accessed on 6 April 2022).
  19. Kementerian Dalam Negeri (Indonesia). 2020. Berdasar Jumlah Pemeluk Agama Menurut Agama. (in Indonesian). Available online: https://data.kemenag.go.id/agamadashboard/statistik/umat (accessed on 24 December 2020).
  20. King, Pamela Ebstyne, and Robert W. Roesner. 2009. Religion and spirituality in adolescent development. In Handbook of Adolescent Psychology. Edited by Richard M. Lerner and Laurence Steinberg. Hoboken: Wiley and Sons, Chp. 13. pp. 435–78. [Google Scholar]
  21. Kum-Lung, Choe, and Lau Teck-Chai. 2010. Attitude towards business ethics: Examining the influence of religiosity, gender, and education levels. International Journal of Marketing Studies 2: 225–32. [Google Scholar] [CrossRef] [Green Version]
  22. Lon, Yohanes S., and Fransiska Widyawati. 2019. Food and local social harmony: Pork, communal dining, and Muslim-Christian relations in Flores, Indonesia. Studia Islamika 26: 445–74. [Google Scholar] [CrossRef]
  23. Meyer-Rochow, Victor Benno. 2009. Food taboos: Their origins and purposes. Journal of Ethnobiology and Ethnomedicine 5: 18. [Google Scholar] [CrossRef] [PubMed] [Green Version]
  24. Ministry of Home Affairs (India). 2020. Religion. Available online: https://censusindia.gov.in/Census_and_You/religion.aspx (accessed on 24 December 2020).
  25. Mitra, Anirban, and Debraj Ray. 2014. Implications of an economic theory of conflict: Hindu-Muslim violence in India. Journal of Political Economy 122: 719–65. [Google Scholar] [CrossRef] [Green Version]
  26. Muhamad, Nazlida, Vai Shiem Leong, and Dick Mizerski. 2016. Consumer knowledge and religious rulings on Products: Young Muslim consumers’ perspective. Journal of Islamic Marketing 7: 74–94. [Google Scholar] [CrossRef]
  27. Nasirun, Noraini, Sarina Muhamad Noor, Abdulsatar Abduljabbar Sultan, and Wan Mohamad Haqimie Wan Mohamad Haniffza. 2019. Role of marketing mix and halal certificate towards purchase intention of agro based products. International Journal of Modern Trends in Business Research 2: 37–46. [Google Scholar]
  28. Nusran, Muhammad, Gunawan, Mashur Razak, Sudirman Numba, and Ismail Suardi Wekke. 2018. Halal Awareness on the Socialization of Halal Certification. IOP Conference Series: Earth and Environmental Science 175: 012217. [Google Scholar] [CrossRef]
  29. Othman, Baharudin, Sharifudin Md Shaarani, and Arsiah Bahron. 2016. The potential of ASEAN in halal certification implementation: A review. Pertanika Journal of Social Science and Humanities 24: 1–24. [Google Scholar]
  30. Qurtuby, Sumanto Al. 2019. Religious Violence and Conciliation in Indonesia: Christians and Muslims in the Moluccas. London: Routledge. [Google Scholar]
  31. R Core Team. 2019. R: A Language and Environment for Statistical Computing. Vienna: R Foundation for Statistical Computing, Available online: https://www.R-project.org/ (accessed on 22 December 2020).
  32. Rahman, Md. Hafizur, Munmun Rahaman, Abdur Rakib Nayeem, Md. Bashir Uddin, and Mohammad Abdul Zalil. 2020. Purchase intention of halal food among the young university students in Malaysia. Globus. An International Journal of Management & I 12: 6–13. [Google Scholar] [CrossRef]
  33. Regnerus, Mark D., Christian Smith, and Brad Smith. 2004. Social context in the development of adolescent religiosity. Applied Developmental Science 8: 27–38. [Google Scholar] [CrossRef]
  34. Roslan Mohd Nor, Mohd, and Maksum Malim. 2014. Revisiting Islamic education: The case of Indonesia. Journal for Multicultural Education 8: 261–76. [Google Scholar] [CrossRef]
  35. Said, Mahiah, Faridah Hassan, Rosidah Musa, and N. A. Rahman. 2014. Assessing consumers’ perception, knowledge, and religiosity on Malaysia’s halal food products. Procedia—Social and Behavioral Sciences 130: 120–28. [Google Scholar] [CrossRef] [Green Version]
  36. Schwartz, Kelly Dean, William M. Bukowski, and Wayne T. Aoki. 2005. Mentors, friends, and gurus: Peer and non-parent influences on spiritual development. In The Handbook of Spiritual Development in Childhood and Adolescence. Edited by E. C. Roehlkepartain, P. E. King, L. Wagener and P. L. Benson. Southern Oaks: SAGE Publications, Chp. 22. pp. 310–23. [Google Scholar] [CrossRef]
  37. Sen, R., and W. Wagner. 2005. History, Emotions and Hetero-Referential Representations in Inter-Group Conflict: The Example of Hindu-Muslim Relations in India. Papers on Social Representations 14: 2.1–2.23. [Google Scholar]
  38. Shamsul, A. B. 2001. A History of an identity, an identity of a history: The idea and practice of “Malayness” in Malaysia reconsidered. Journal of Southeast Asian Studies 32: 355–66. [Google Scholar] [CrossRef]
  39. Shirin Asa, Rokshana. 2017. Malaysian halal certification: Its religious significance and economic value. Journal Syariah 25: 137–56. [Google Scholar] [CrossRef]
  40. Snibbe, Alana Conner, and Hazel Rose Markus. 2002. The psychology of religion and the religion of psychology. Psychological Inquiry 13: 229–34. [Google Scholar]
  41. Sun, Susan, Tiong Goh, Kim-Shyan Fam, Yang Xue, and Yang Xue. 2012. The influence of religion on Islamic mobile phone banking services adoption. Journal of Islamic Marketing 3: 81–98. [Google Scholar] [CrossRef]
  42. Talib, Mohamed Syazwan Ab, Thoo Ai Chin, and Johan Fischer. 2017. Linking Halal food certification and business performance. British Food Journal 119: 1606–18. [Google Scholar] [CrossRef]
  43. Tausch, Nicole, Miles Hewstone, and Ravneeta Roy. 2009. The relationships between contact, status and prejudice: An integrated threat theory analysis of Hindu–Muslim relations in India. Journal of Community & Applied Social Psychology 19: 83–94. [Google Scholar] [CrossRef]
  44. Taylor, Charles. 2002. Varieties of Religion Today: William James Revisited. Harvard: Harvard University Press. [Google Scholar]
  45. Viverita, Ratih Dyah Kusumastuti, and Riani Rachmawati. 2017. Motives and challenges of small businesses for halal certification: The case of Indonesia. World Journal of Social Sciences 7: 136–46. [Google Scholar]
  46. Wening, Nur, and Achmad Choerudin. 2015. The influence of religiosity towards organizational commitment, job satisfaction, and personal performance. Polish Journal of Management Studies 11: 181–91. [Google Scholar]
  47. Yasid, Fikri Farhan, and Yuli Andriansyah. 2016. Factors affecting Muslim Students awareness of halal Products in Yogyakarta, Indonesia. International Review of Management and Marketing 6: 27–31. [Google Scholar]
  48. Yusof, Selamah Abdullah, Mochammad Budiman, and Ruzita Mohammad Amin. 2018. Relationship between religiosity and individual economic achievement: Evidence from South Kalimantan, Indonesia. Journal of King Abdulaziz University: Islamic Economics 31: 3–16. [Google Scholar] [CrossRef]
Figure 1. Results of Q9 (percentage of respondents’ close friends who believe in different religions). Sample sizes are n = 128 and 450 for Indonesia and India, respectively.
Socsci 11 00220 g001
Figure 2. Results of Q10 (percentage of people who believe in the same religion in respondents’ city). Note: Sample sizes are n = 129 and 450 for Indonesia and India, respectively.
Socsci 11 00220 g002
Figure 3. Scores for Q11–Q21. Note: Sample size is n = 115 (Q16, Q20), =116 (Q21), and =117 (Q11–15, Q17–Q19) for Indonesia, and n = 281 for India.
Socsci 11 00220 g003
Table 1. The religious ratios in the study sites (unit: %).
IndonesiaIndia
JakartaBengaluruChennaiCochinHyderabadVijayawada
Muslim83.713.09.517.643.59.1
Christian12.55.37.738.12.23.6
Hindu0.280.380.743.851.985.2
Buddhist3.60.10.10.00.00.0
Others0.01.42.00.52.42.1
Table 2. Questions on the religious restrictions on foods.
Awareness
Q11: You can differentiate taboo and non-taboo foods
Q12: You avoid buying taboo foods
Q13: You eat only non-taboo foods
Religious Belief
Q14: You avoid taboo foods due to your religious beliefs
Q15: You select non-taboo foods because your religion teaches you to do so
Health Reasons
Q16: You believe non-taboo foods are good for your health
Q17: You believe the consumption of taboo foods would harm your health
Logo Certification
Q18: You always check if a food logo for your religion is put on the food
Q19: If you do not find a logo, you will check the ingredients
Exposure
Q20: You always update your knowledge about taboo and non-taboo foods
Q21: You often talk about taboo foods with family members, friends, and/or colleagues
Table 3. Variables.
Table 3. Variables.
VariableExplanation/Sign Condition
Explained variableRespondents’ religious faithfulness (average value of Q11–Q21)
Explanatory variables
GENGender (Q2)
=1 if men
=0 if women
AGEAge (Q3)
=1 if 19 or less
=2 if 20–29
=3 if 30–39
=4 if 40–49
=5 if 50–59
=6 if 60–69
=7 if 70 or more
MARMarital status (Q4)
=1 if single
=0 if married
CHRReligion (Q5)
=1 if Christian
=0 if Hindu or Muslim
HIDReligion (Q5)
=1 if Hindu
=0 if Christian or Muslim
EDUEducational background (Q6)
=1 if high school or less
=2 if college
=3 if bachelor
=4 if master
=5 if doctor
Sign condition (+): Respondents’ religious faithfulness is expected to increase with a higher “educational background”.
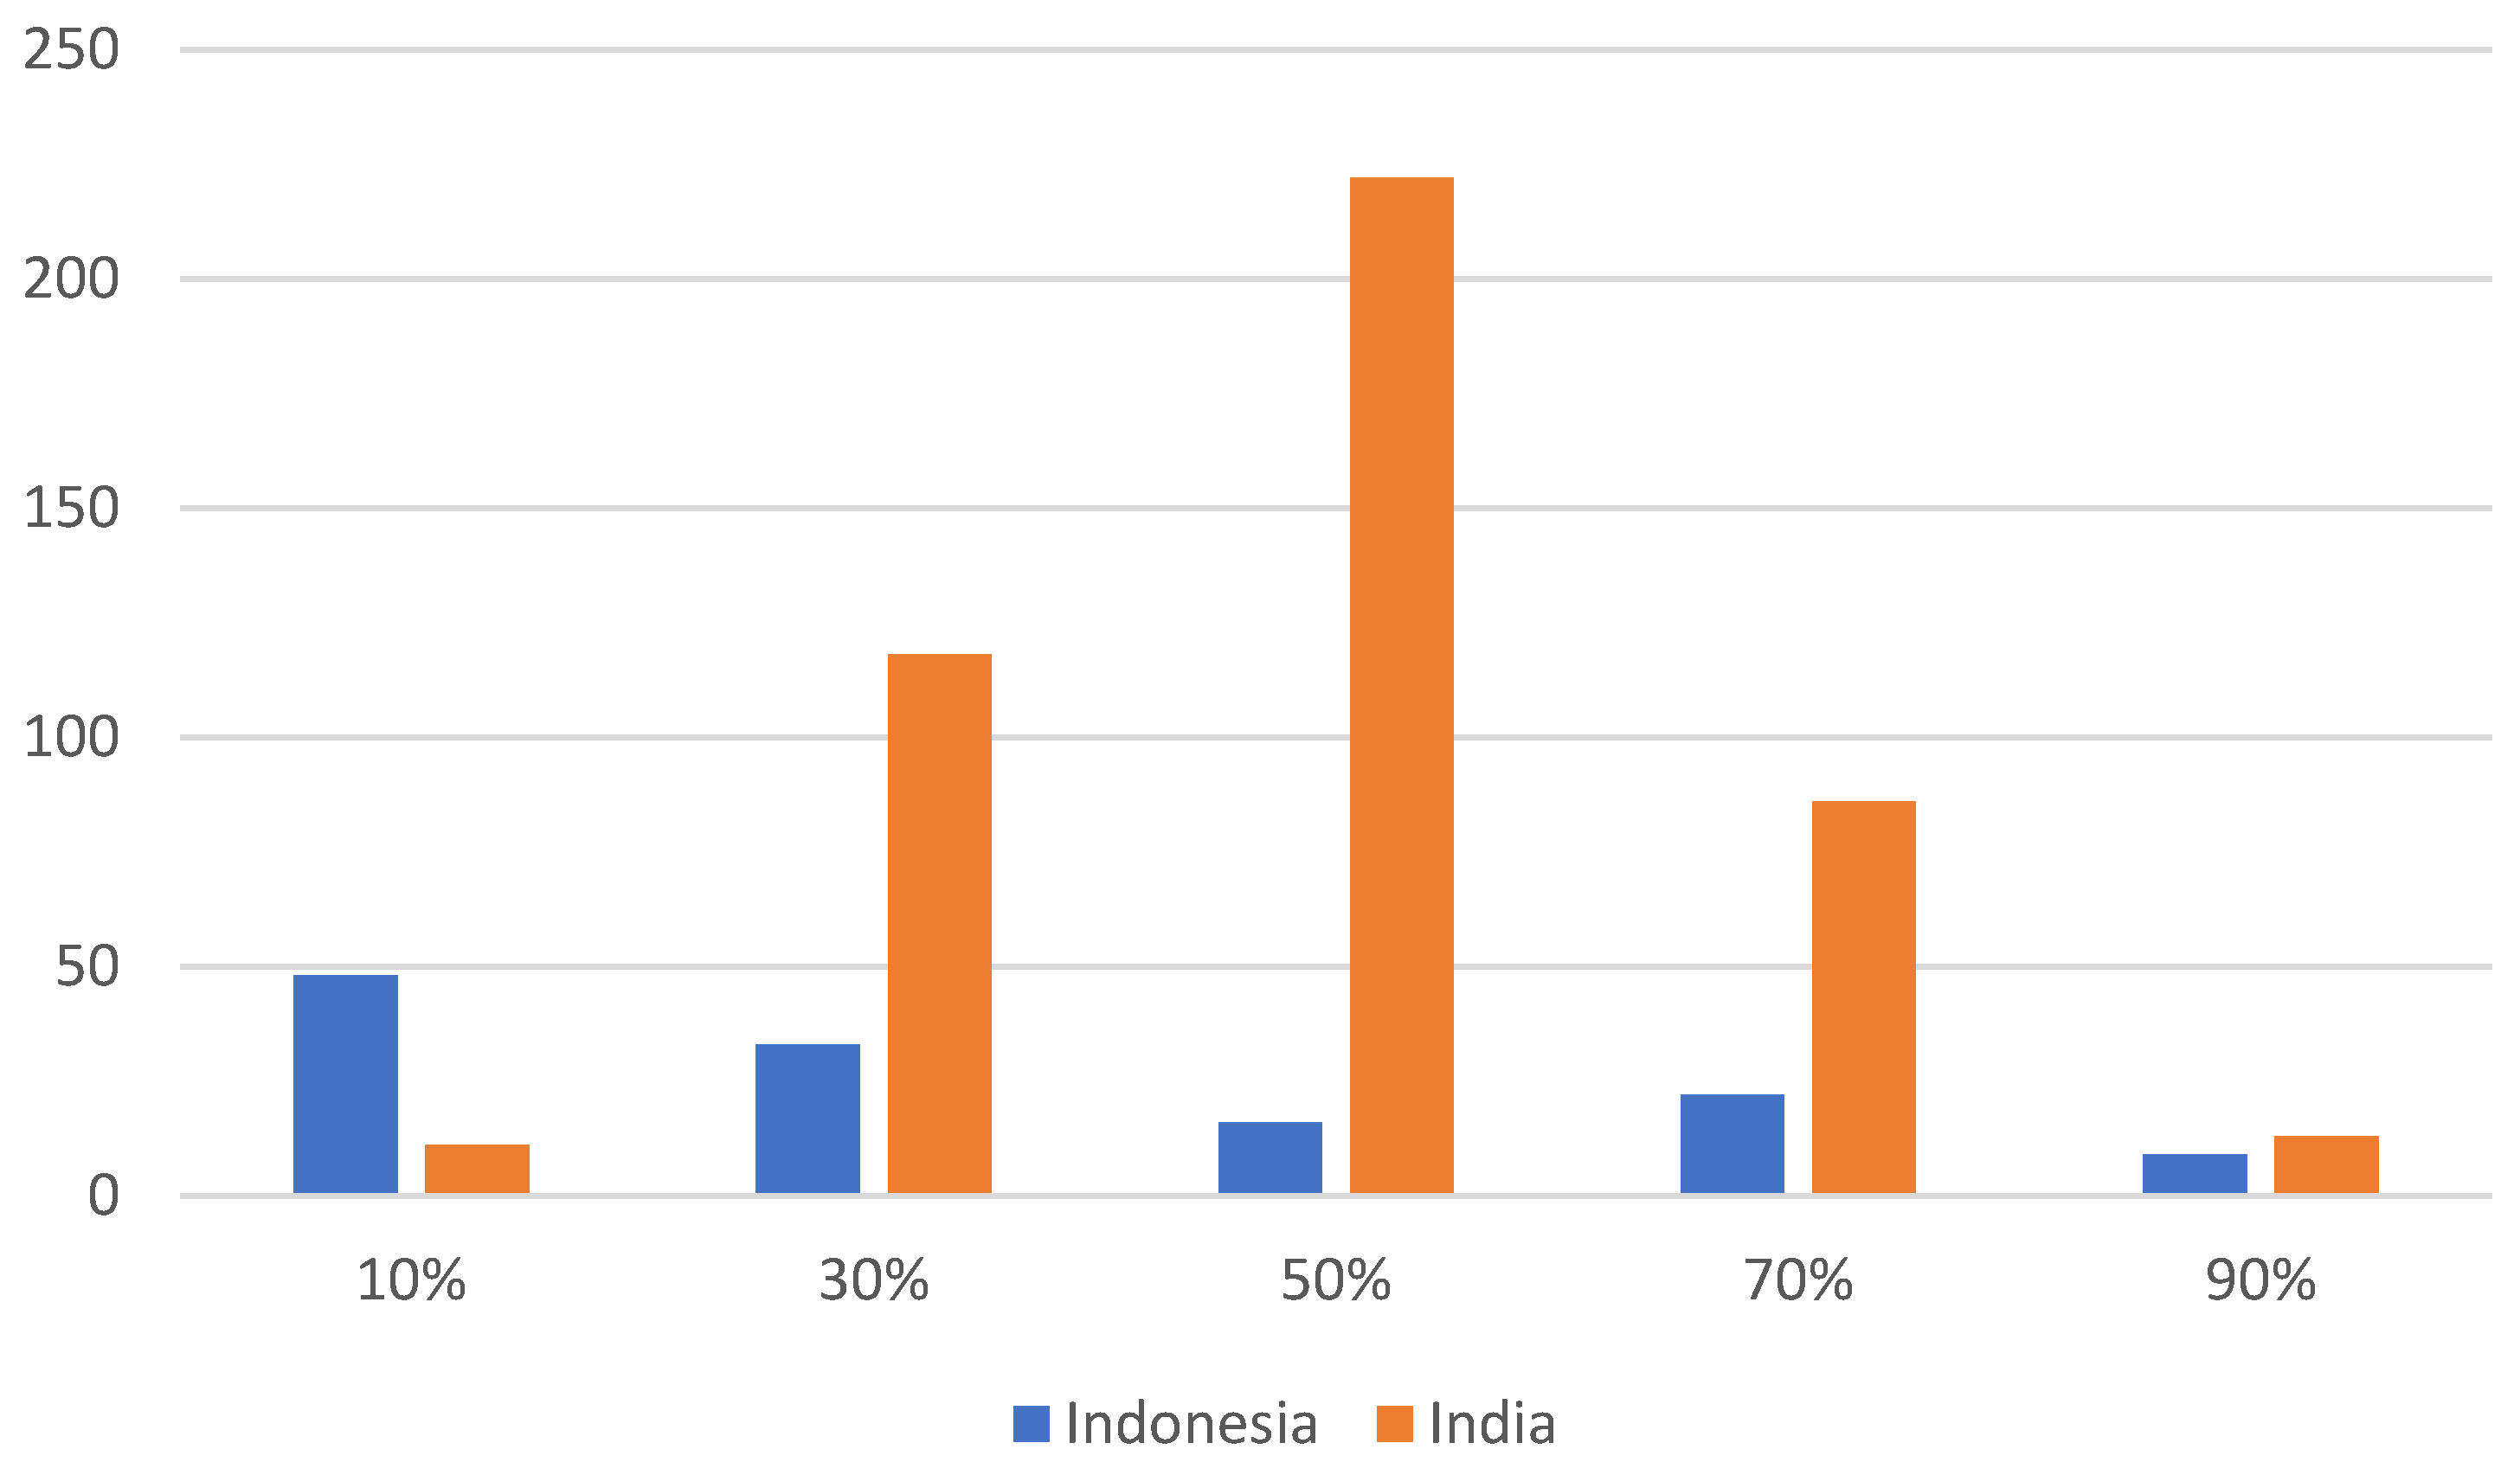
DIFQ9
=1 if 10%
=2 if 30%
=3 if 50%
=4 if 70%
=5 if 90%
Sign condition (–): Respondents’ religious faithfulness is expected to decrease as “the percentage of respondents’ close friends who believe in different religion” increases.
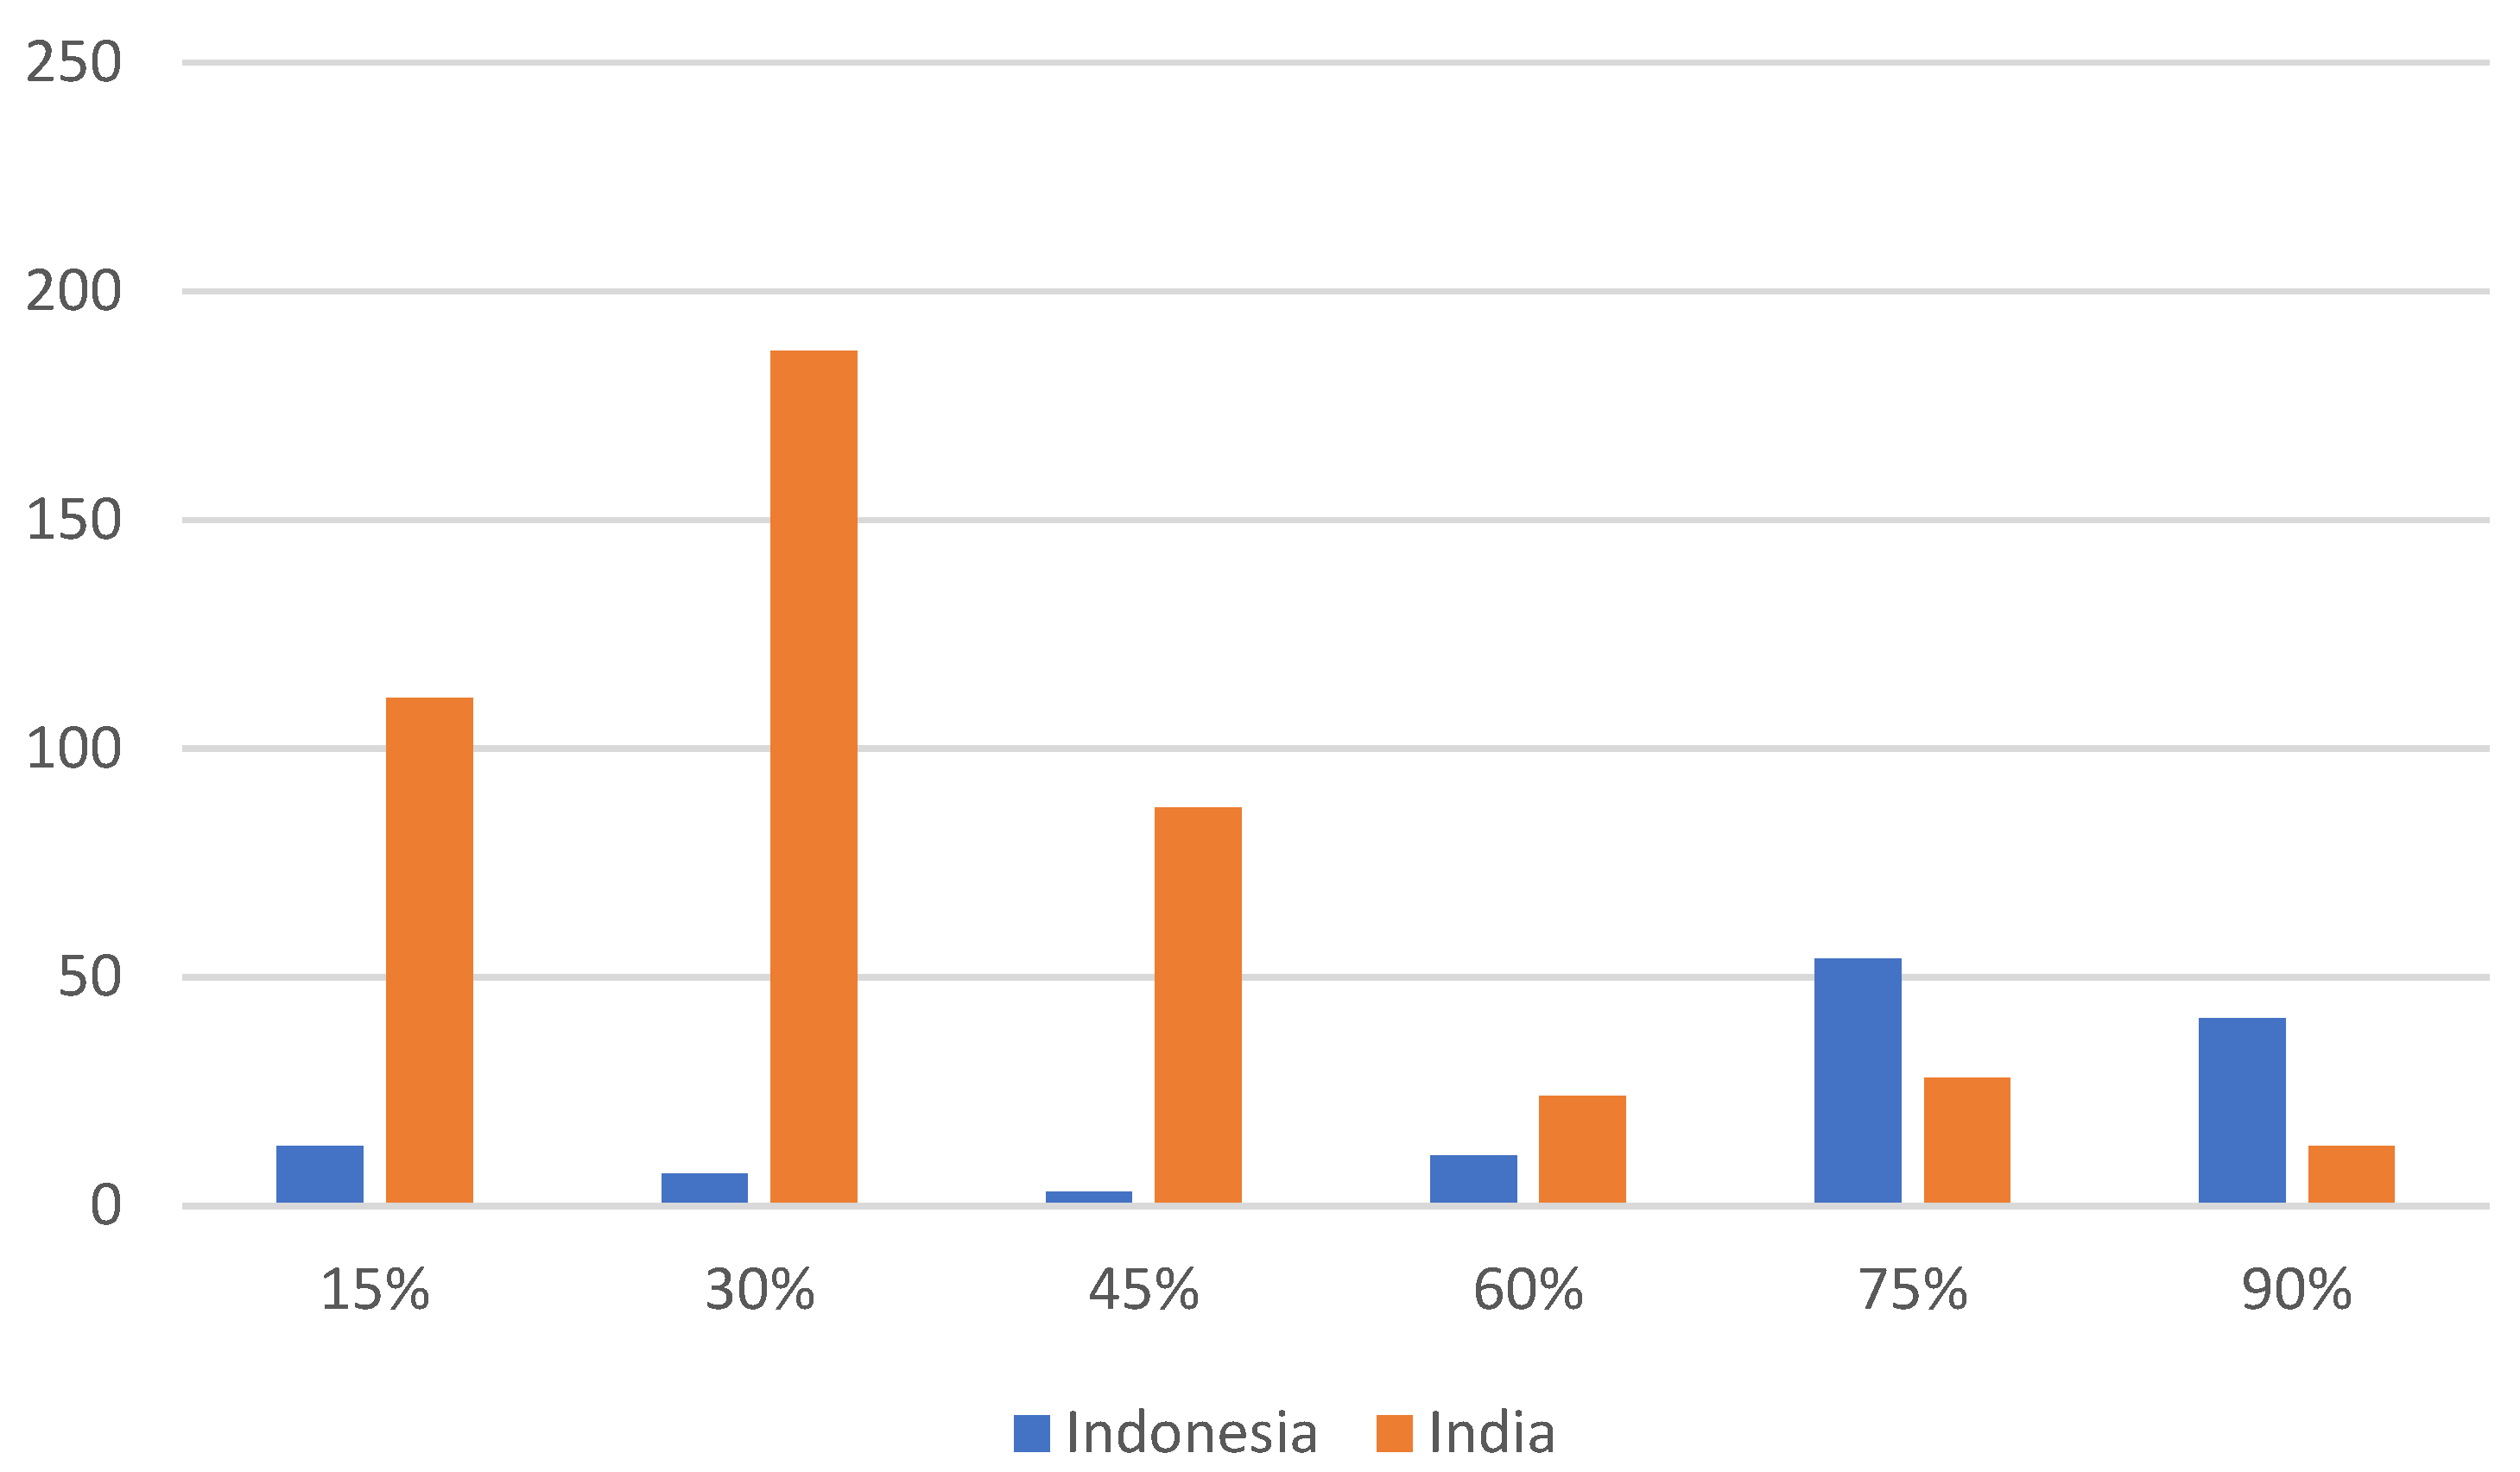
SAMEQ10
=1 if 15%
=2 if 30%
=3 if 45%
=4 if 60%
=5 if 75%
=6 if 90%
Sign condition (+): Respondents’ religious faithfulness is expected to increase as “the percentage of people who believe in the same religion in respondents’ city” increases.
D1=1 if a respondent is from Hyderabad, India; =0 otherwise
D2=1 if a respondent is from Bengaluru, India; =0 otherwise
D3=1 if a respondent is from Cochin, India; =0 otherwise
D4=1 if a respondent is from Chennai, India; =0 otherwise
D5=1 if a respondent is from Vijayawada, India; =0 otherwise
Note that D5 was removed in India_A and India_M (see Table 4) to avoid perfect multicollinearity.
Table 4. Models.
Table 4. Models.
Muslim + Non-Muslim (A)Muslim (M)
All data (A)A_A modelA_M model
Indonesian dataIndonesia_A modelIndonesia_M model
Indian dataIndia_A modelIndia_M model
Table 5. Descriptive statistics for Q1 to Q7.
TotalIndonesiaIndia
Place of residence (Q1)
  Indonesia131131
  India450
  Hyderabad 90
  Bengaluru 90
  Cochin 90
  Chennai 90
  Vijayawada 90
Gender (Q2)
  Men30261241
  Women27970209
Age (Q3)
  19 or less69861
  20–29884642
  30–3918525160
  40–4918033147
  50–59531835
  60–69615
  70 or more000
Marital status (Q4)
  Single (including widow, divorcee)1376077
  Married44471373
Religion (Q5)
  Muslim389102287
  Christian922666
  Hindu98197
  N/A220
Education background (Q6)
  High school or less29128
  College803050
  Bachelor21626190
  Master23271161
  Doctor23221
  N/A110
Occupation (Q7)
  Private sector20649157
  Government sector843549
  Self-employed1275122
  Housewife66066
  Students913556
  No job/Retired000
  N/A770
Table 6. Estimation results.
A_A ModelA_M Model
Estimatet-valuep-value Estimatet-valuep-value
Intercept (Indonesia)4.4323.850.00***4.5623.700.00***
Intercept (Vijayawada)
D1 (Hyderabad)−0.32−2.900.00***−0.38−3.420.00***
D2 (Bangalore)−0.38−3.530.00***−0.46−4.220.00***
D3 (Cochin)−0.33−3.810.00***−0.39−4.300.00***
D4 (Chennai)−0.10−0.900.37 −0.17−1.530.13
D5 (Vijayawada)−0.05−0.440.66 −0.12−1.080.28
GEN (Q2)0.051.310.19 0.051.410.16
AGE (Q3)0.020.660.51 0.020.870.39
MAR (Q4)0.091.180.24 0.111.530.13
CHR (Q5)−0.85−4.940.00***
HID (Q5)−0.28−1.590.11
EDU (Q6)0.082.600.01**0.072.540.01**
DIF (Q9)−0.10−4.140.00***−0.10−4.390.00***
SAME (Q10)−0.01−0.450.65 −0.04−1.540.12
n395 369
Breusch–Pagan test126.92 42.69
(p-value)0.00 0.00
GLS GLS
AIC457.81 366.38
RSE23.90 1.14
R2
Adj.R2
F-statistic
(p-value)
Indonesia_A ModelIndonesia_M Model
Estimatet-valuep-value Estimatet-valuep-value
Intercept (Indonesia)4.0610.650.00***3.9610.660.00***
Intercept (Vijayawada)
D1 (Hyderabad)
D2 (Bangalore)
D3 (Cochin)
D4 (Chennai)
D5 (Vijayawada)
GEN (Q2)0.010.130.90 0.010.090.93
AGE (Q3)−0.05−0.880.38 −0.02−0.370.71
MAR (Q4)−0.04−0.260.80 0.060.460.64
CHR (Q5)−0.68−2.650.01**
HID (Q5)
EDU (Q6)0.192.760.01**0.223.370.00***
DIF (Q9)−0.13−2.680.01**−0.13−2.990.00***
SAME (Q10)0.051.170.25 0.020.550.58
n114 99
Breusch–Pagan test36.66 4.11
(p-value)0.00 0.66
GLS OLS
AIC195.13 −133.30
RSE41.81 0.42
R2 0.32
Adj.R2 0.28
F-statistic 7.44
(p-value) 0.00
India_A ModelIndia_M Model
Estimatet-valuep-value Estimatet-valuep-value
Intercept (Indonesia)
Intercept (Vijayawada)4.5134.800.00***4.5234.860.00***
D1 (Hyderabad)−0.13−2.650.01**−0.12−2.560.01**
D2 (Bangalore)−0.42−6.550.00***−0.42−6.420.00***
D3 (Cochin)−0.21−4.220.00***−0.21−4.200.00***
D4 (Chennai)−0.06−1.520.13 −0.07−1.570.12
D5 (Vijayawada)
GEN (Q2)0.061.950.05*0.072.070.04**
AGE (Q3)0.062.920.00***0.062.930.00***
MAR (Q4)0.081.040.30 0.081.030.30
CHR (Q5)−0.46−1.150.25
HID (Q5)−0.32−1.720.09*
EDU (Q6)−0.04−1.660.10*−0.04−1.690.09*
DIF (Q9)−0.02−0.790.43 −0.02−0.930.35
SAME (Q10)−0.08−3.080.00***−0.09−3.160.00***
n281 269
Breusch–Pagan test57.11 57.27
(p-value)0.00 0.00
GLS GLS
AIC178.76 158.32
RSE84,267.15 133,352.70
R2
Adj.R2
F-statistic
(p-value)
***, **, and * indicate statistical significance at the 1%, 5%, and 10% levels, respectively.
Table 7. Living together with family members of a different religion (Q8).
RespondentsLive Together withIndonesiaIndia
MuslimChristian22
Hindu113
ChristianBuddhist2-
Hindu11
Muslim86
HinduChristian-2
Muslim-2
Total1426
Number of respondents1126
Some respondents live with two or more members of different religions (e.g., Muslim respondents live together with Christians and Hindus).
Table 8. Summary of the main results.
Indonesia_A and Indonesia_M ModelsIndia_A and India_M Models
DIF (Q9)Significantly negativeNot significant
Interpretation:
The respondents’ religious faithfulness (i.e., explained variable y i ) takes a lower value if the percentage of respondents’ close friends who believe in a different religion (Q9) increases in Indonesia
Impacts of the religious minority
The percentage of people who believe in a different religion in the respondents’ city is low (Figure 2), and the Indonesian respondents are affected only by DIF (Q9)
SAME (Q10)Not significantSignificantly negative
Interpretation:
The respondents’ religious faithfulness (i.e., explained variable y i ) takes a lower value if the percentage of people who believe in the same religion in the respondents’ city (Q10) increases in India
Impacts of the religious minority:
The percentage of respondents’ close friends who believe in the same religion is low (Figure 1), and the Indian respondents are affected only by SAME (Q10)
Publisher’s Note: MDPI stays neutral with regard to jurisdictional claims in published maps and institutional affiliations.

