Article

Educational Trajectories and Outcomes of Multiracial College Students

Department of Sociology, The Ohio State University, Columbus, OH 43223, USA
*
Author to whom correspondence should be addressed.
Soc. Sci. 2022, 11(3), 101; https://doi.org/10.3390/socsci11030101
Submission received: 14 October 2021 / Revised: 22 February 2022 / Accepted: 24 February 2022 / Published: 28 February 2022
(This article belongs to the Special Issue Multiracial Identities and Experiences in/under White Supremacy)

Abstract

:
Although higher education research has identified racial/ethnic disparities in college enrollment and degree completion, few studies investigate the educational outcomes of multiracial students relative to monoracial student groups. This paper begins to fill this gap and aims to open a conversation about the precarious state of data collection and empirical research on the growing multiracial population. Using several waves from the Educational Longitudinal Study (ELS) and the National Longitudinal Study of Adolescent to Adult Health (Add Health), we center multiracial college students in our empirical analysis, which investigates the following questions: (1) how do enrollment rates and patterns of enrollment based on institutional type differ, if at all, for multiracial college students relative to monoracial college students? and (2) how does retention and overall degree attainment differ between multiracial and monoracial groups of college students? Our analyses identify several trends that suggest that multiracial people enroll in college at significantly lower rates, are more likely to enroll in private colleges and universities and four-year institutions, and are less likely to earn bachelor’s degrees relative to other racial groups.

1. Introduction

It is well established that a college education positively influences mobility prospects and generates significant social and economic returns for college graduates (see Hout 2012 for a review). Considered “the minimum threshold for entry into the middle-class”, a college degree can mean the difference between upward and arrested mobility (DeAngelo and Franke 2016, p. 1589). However, a growing body of literature in sociology and related disciplines has identified troubling disparities in college enrollment, student retention, and degree attainment across different racial and ethnic groups. While rates of college enrollment have been approaching parity in recent decades (Adelman 2006), disparities in degree attainment persist: 64% of white students complete a bachelor’s degree within six years of matriculation compared to only 40% of Black students, 54% of Hispanic students, and 39% of Native American students (U.S. Department of Education 2017). These trends suggest that while college access for nonwhite populations has improved, there are persistent systemic barriers in higher education that work to reinforce and reproduce existing race-based inequalities.
Despite significant work on race and college outcomes, limited and imprecise data on multiracial people have rendered multiracial college students an underexplored group. The historic exclusion of multiracial categories in survey research as well as analytical decisions which obscure or omit multiracial people in empirical research leave us with relatively little knowledge about how multiracial college students fare in college, especially relative to their monoracial counterparts. Recent qualitative work has pointed to the discrimination and feelings of exclusion experienced by multiracial students at predominantly white institutions (PWIs) (e.g., Harris 2017; Museus et al. 2016), yet a significant gap in the literature remains regarding the pathways and success of multiracial students. With this paper, we begin to fill this gap by investigating the educational pathways and degree attainment of multiracial college students compared to their monoracial peers. Additionally, we draw attention to the paucity of data on multiracial people, which plagues not just educational research but the social sciences more broadly.
Our paper proceeds in the following way: First, we define multiracial groups and identify how issues in data collection and management have negatively affected research on multiracial people. Second, we review literature on racial disparities in higher education, providing a basis for our own work. Following, we present our methods and analyses, which are carried out using several waves from the Education Longitudinal Study (ELS) and the National Longitudinal Study of Adolescent to Adult Health (Add Health). In our analyses, we investigate the differential rates of applying, enrolling, and graduating from college between multi- and monoracial student groups. Additionally, we examine what types of institutions multiracial college students enroll in relative to their monoracial counterparts. Our results identify trends that suggest that multiracial students enroll at different types of postsecondary institutions relative to monoracial student groups and are less likely to earn bachelor’s degrees. However, as we will describe below, the data available on multiracial students are suboptimal and do not allow us to draw strong conclusions based on our results. As more comprehensive data on multiracial students become available, it is our hope that future research will extend this line of work. We conclude with a discussion of trends identified in our results, after which we highlight the limitations of our work and describe our intentions for future work supplementing this project.

2. Background

2.1. Multiracial Populations

Multiracial people, defined as those having biological parents of two or more races, have existed for as long as the concept of race itself. Despite this, social science research has historically excluded multiracial people from analysis. This is accomplished by collapsing multiracial individuals into one of their racial components (e.g., black/white biracial individuals being categorized solely as black) or by excluding them from analysis entirely. When multiracial individuals are included in analyses, specific details of their identities are often obscured by failing to allow for the selection of multiple races, instead forcing individuals to select an ambiguous “multiracial” identity. Adjusting for multiracial people in research about race requires both experimental design choices (e.g., how to define race and how to ask about race) and analytic questions (e.g., how to split racial categories for analysis, whether to include multiracial people in one or more categories, and whether to separate out multiracial people) (Bratter 2018; Campbell et al. 2016).
Today, multiracial people constitute one of the fastest growing demographic groups, growing substantially just in the last few decades alone (Bratter and Kimbro 2013; Renn 2000). Undoubtedly, this is at least partly the consequence of developments in data collection; the option for respondents to self-identify as more than one race was rare prior to the year 2000, when the Census introduced a multiracial category, but has become more common over the last two decades (Hirschman et al. 2000). By allowing individuals to identify as more than one race, multiracial people have been afforded greater visibility and representation in research.
Research that has focused on multiracial people has found that their lived experiences differ greatly from those of their monoracial counterparts. Multiracial individuals tend to score worse on measures of mental health than monoracial people, experiencing elevated levels of depression, lower rates of satisfaction, and higher rates of suicidality (Bratter and Gorman 2011; Bratter and Kimbro 2013; Tabb et al. 2016; Yoo et al. 2016). In addition, the policing of racial boundaries by monoracial people often leads to a sense of racial homelessness and social displacement in multiracial people (Campion 2019; Fisher et al. 2014; Gullickson 2016; Gullickson and Morning 2011). Multiracial people, particularly those with a white parent, tend to experience poverty at levels more consistent with their white ancestry than their non-white ancestry, although research indicates that not all markers of household wellbeing fit perfectly as an average between the component racial groups of the parents (Bratter and Kimbro 2013). Indeed, these disparities begin at birth, with multiracial infants of mixed white/nonwhite couples having lower birth weights than their white peers, although these patterns are shaped by which parent is white and most research often focuses solely on comparisons with Black/white biracial children (Choi and Reichman 2019). Multiracial children born to cohabitating but unmarried parents also experience higher levels of family instability relative to their monoracial counterparts (Choi and Goldberg 2021). In families headed by a single mother, multiracial children experience higher levels of poverty than their white peers with single mothers (Bratter and Damaske 2013).
Multiracial college students provide a uniquely well-suited population of interest because so much of multiracial identity formation occurs during the high school and college years. While previous work examines the early life experiences of multiracial individuals, focusing on college students allows for effects to be somewhat separated from the influence of parents. For the first time, students are able to build their own identities outside of the racial identification of their parents (Brunsma 2005; Campion 2019). This transition allows students to explore the fluidity of race writ large and the specific malleability of multiracial identification.

2.2. Racial Disparities in Higher Education

Depending on one’s ideological orientation, higher education either constitutes a powerful springboard for upward mobility or a stratifying force which contributes to the reproduction of existing class- and race-based inequalities. To be sure, the power of a college degree is clear: despite growing concern that the returns of a college degree no longer offset the ever-increasing cost of higher education, even cautious projections estimate that college graduates earn between $636,000 and $1.1 million more in lifetime earnings than their non-degreed counterparts (Hout 2012). Yet the financial profits of a college education can only be reaped when one completes a degree, and existing research has identified vast disparities in enrollment patterns and degree completion on the basis of class (Mettler 2014; Ishitani 2006; Goldrick-Rab 2006) and race (Allen 1992; Alon and Tienda 2005), calling into question whether college offers equitable access to mobility, or if it simply operates as an “inherited meritocracy”, which offers mobility only for the already-privileged (Leonhardt 2005).
Below, we provide a brief overview of recent trends in college enrollment and degree attainment by race. We describe the hierarchical structure that has emerged from contemporary enrollment patterns and highlight the material and cultural challenges faced by monoracial nonwhite students in higher education. We highlight existing studies on the educational experiences of multiracial college students and conclude this section with a description of our research agenda and hypotheses.

Trends in College Enrollment and Degree Attainment

College enrollment has skyrocketed since the 1970s, resulting in near-mass-participation in higher education. Today, approximately 90% of high school graduates enroll in college within eight years of completing high school (Rosenbaum et al. 2006). While racial and ethnic minority students have historically been underrepresented on college campuses, the racial gap in college attendance largely disappeared by the early 2000s. Adelman (2006) found that 83.5% of white high school graduates enrolled in college within eight years after high school, with Black high school graduates and Hispanic high school graduates demonstrating markedly similar rates of enrollment (80.2% and 80.6%, respectively). By 2019, the rates of immediate enrollment had widened slightly but remained comparable—69% of white high school graduates, 57% of Black graduates, 64% of Hispanic graduates, and 82% of Asian graduates immediately enrolled in some form of postsecondary institution following high school graduation (U.S. Department of Commerce 2020). While not yet equal, enrollment rates by race/ethnicity have been approaching parity in recent decades, with Asian and white high school graduates leading in college enrollment.
Despite growth in enrollment, the percentage of students who earn degrees has been declining steadily in recent decades—while the U.S. was the “undisputed leader” of countries producing college graduates in the 1980s, now only about one-third of Americans aged 25–34 have earned a college degree (Mettler 2014). Declining degree attainment may be partly explained by students enrolling in postsecondary institutions with varied educational goals, including students who aim to earn lower-level credentials such as certificates and associate degrees. However, estimates indicate that at least two-thirds of the decline in graduation rates can be attributed to the “lack of institutional resources in the lower-tier colleges and community colleges” (Carnevale and Strohl 2010, p. 74).
Disparities in institutional funding as well as campus policies and programming contribute to differential rates of student retention and degree attainment. Selective flagships and elite private colleges are better equipped to support student retention thanks to greater funding toward student support services and more generous financial aid, as well as campus policies and programming which promote student integration on campus, including mandatory time spent living on-campus with peers and programming aimed at integrating students into campus life (Khan 2010; Armstrong and Hamilton 2013; Jack 2019; Stuber 2015). In contrast, community colleges and less-selective four-year colleges and universities offer fewer student support services and demonstrate greater reliance on part-time faculty due to recent cuts in federal funding. With large student bodies and open-door policies, community colleges especially lack institutional structures to disincentivize withdrawal, resulting in low student retention (Smith Morest 2013).
With relatively inexpensive tuition and open-door or less selective admission policies, community colleges and less selective four-year institutions have removed nearly all barriers to entry for prospective students from less advantaged backgrounds. Indeed, much of the closing of racial gaps in college enrollment can be attributed to the expansion these institutions: prior research finds that racial and ethnic minority students are disproportionately concentrated in two-year colleges and less selective four-year institutions (Mettler 2014). While these institutions offer ease of access to higher education, they often lack the necessary funding and resources to fully support students and their varied educational goals, resulting in poorer rates of retention and significantly lower rates of degree attainment (Rosenbaum et al. 2006; Carnevale and Strohl 2010).
The culture of college campuses similarly influences student retention. Prior work argues that the culture of higher education generally mirrors white, middle-class culture (e.g., Jack 2019), disfavoring those who are nonwhite and/or lack the cultural capital that is rewarded in predominantly white spaces (e.g., Lareau 2015). Nonwhite students must often utilize strategies to deal with the ethno-racially segregated nature of predominantly white institutions (PWIs) (Johnson 2019), and even so, are often left feeling marginalized and isolated in their own institutions, preventing social and professional integration on campus and ultimately negatively affecting academic performance and retention. Historically Black Colleges and Universities (HBCUs), Hispanic Serving Institutions (HSIs), and Tribal Colleges and Universities (TCUs) offer educational spaces where whiteness is not centered in campus culture, yet these institutions may not offer the same privileges that we argue are associated with proximity to whiteness. Moreover, these institutions serve a small fraction of nonwhite college students nationwide (HBCUs, for example, enroll only 9% of Black college students), meaning that most nonwhite students are concentrated at PWIs.
Emerging from these differential enrollment patterns is a hierarchical system of higher education with which most high school graduates will engage but from which only a fraction will earn a degree. Not all colleges are equally equipped to promote student retention and success, and the significant class- and race-based differences in the kinds of institutions in which students enroll have considerable implications for students’ chances of graduation and achieving upward mobility. In this hierarchy, students are highly concentrated at the low and high end of selectivity: poor and/or nonwhite students are overwhelmingly represented at open-enrollment and less-selective institutions while upper-class white students are represented largely at selective flagships and private universities (Mettler 2014). These trends suggest that rather than operating as a vehicle for mobility, “our system of higher education…stratifies Americans by income group rather than providing them with ladders of opportunity” (Mettler 2014, p. 8).

2.3. Multiracial People, White Supremacy, and Higher Education

Recent trends towards the inclusion of nonwhite people in historically white spaces such as historically segregated neighborhoods and predominantly white elite academic institutions has afforded limited access to the resources gatekept by white members of those communities. Nominally, nonwhite people in those spaces are afforded the same benefits as the white members. For example, nonwhite students who graduate from a selective PWI may leverage their connections to whiteness following graduation, particularly after their elite institutions provide them with social markers of success and class (Jones et al. 2002; Khan 2010; Rivera 2012). In racialized organizations such as higher education, however, multiracial students are forced into identity meaning making by the organization (e.g., racialized support systems, minority focused institutions) and by their peers (e.g., exclusion from racialized student groups or other affinity focused social opportunities) (Gasser 2002; Renn 2000). As Renn describes, multiracial students are “doing the work of identity development on campuses not set up to accommodate those who do not fit into previously defined categories” (Renn 2000, p. 405). In this way, the prevalence of white supremacy in higher education and the role of institutions of higher education as vehicles for the perpetuation of white supremacy uniquely burden multiracial students who claim access to these spaces.
Access to guarded white spaces and resources often comes at social and emotional cost to multiracial people who are dually punished for challenging white supremacy through their claim to access and punished for their distance from communities of color. In a society dominated by binary thinking around race (who is white vs. who is not white), multiracial peoples’ very existence challenges the structure of supremacy. Multiracial students face pressure to form a monoracial identity or to continually defend their non-conforming multiracial identity (Gasser 2002). These pressures can result in negative health outcomes (Choi and Reichman 2019) and displacement from racialized communities (Gasser 2002).

Multiracial Experiences of Higher Education

While racial disparities in enrollment patterns, educational experiences, and rates of degree attainment are relatively well-explored for monoracial nonwhite student groups (see, for example, Bowen et al. 2016), less is known about the postsecondary experiences and educational outcomes of multiracial students. Between 2010 and 2018, the college enrollment of multiracial students increased by 120 percent, from 294,000 to 647,000 students (U.S. Department of Education 2019). Undoubtedly, this dramatic increase can be partly explained by developments in the collection of racial/ethnic data in institutional forms and surveys. Whether this growth is a reflection of true demographic shifts or simply changes in the precision of data collection, we are left with a group of students whose postsecondary trajectories and experiences have gone largely unexplored.
Recent qualitative research on multiracial college students indicates that they face a number of challenges during college, including racial microaggressions, the policing of racial categories, and feelings of isolation from monoracial groups. Harris’ (2017) interviews with multiracial women at a PWI revealed that all interviewees had experienced microaggressions from peers and regularly had their multiracial realities denied. Despite the fact that “[m]ultiracial women’s close friends and loved ones knew about their multiple racial identities ... they placed multiracial students into monoracial categories” (Harris 2017, p. 438). The university environment subscribed to the traditional monoracial view of race, denying the reality of women’s experiences and leaving the women feeling that they weren’t monoracial “enough” to fit in on campus and in multicultural student groups. Focus groups and interviews conducted by Museus et al. (2016) similarly revealed that multiracial undergraduate students face persistent prejudice and exclusion and identified eight distinct forms of discriminatory experiences: (1) racial essentialization, (2) invalidation of racial identities, (3) external imposition of racial identities, (4) racial exclusion and marginalization, (5) challenges to racial authenticity, (6) suspicion of ‘chameleons’, (7) exoticization, and (8) pathologizing of multiracial individuals.
In a study of Black-white multiracial students at HBCUs and PWIs, Clayton (2020) found that HBCUs’ emphasis on Black history in curriculum helped Black-white multiracial students develop their Black identities. Interestingly, many Black-white students in this sample indicated that prior to attending their HBCU, they would have self-identified as biracial, but later began to self-identify as Black. While this identity shift is characterized as a positive one by these respondents, reflecting feelings of inclusion around monoracial Black peers and a sense of belonging to the Black community, it is worth noting that these results suggest that multiracial students at both HBCUs and PWIs may face having their multiracial identities de-emphasized or denied, albeit in distinct ways.
While college can constitute an important period of identity development for multiracial students (Clayton 2020), qualitative evidence demonstrates that multiracial students may be a particularly vulnerable group that struggles to find community on campus, faces exclusion for failing to be monoracial “enough”, and has their multiracial identity denied by both their white and nonwhite monoracial peers.

2.4. Toward a More Complete Understanding of Multiracial Student Pathways and Outcomes under White Supremacy

Given the outsized impact of higher education on mobility, we argue that a more focused interrogation of the differential rates of enrollment, the patterns of enrollment across institutional types, and the overall educational outcomes for multiracial college students warrants investigation. Earning a college degree constitutes the eminent route to upward mobility, and the mobility which higher education purports to offer is all the more valuable for marginalized populations, including racial and ethnic minorities. The discrimination and feelings of exclusion that multiracial (as well as monoracial nonwhite) students face in higher education may preclude student success and ultimately negatively affect life outcomes and adulthood financial stability.
Specifically, we interrogate the following research questions: (1) how do enrollment rates and patterns of enrollment based on institutional type differ, if at all, for multiracial college students relative to monoracial college students? and (2) how does retention and overall degree attainment differ between multiracial and monoracial groups of college students? Acknowledging existing findings about the experiences of racial and ethnic minority college students, our expectations for multiracial college students’ patterns are as follows:
Hypothesis 1.
Given that racial disparities in postsecondary enrollment have been approaching parity for several decades, we expect that multiracial high school graduates will exhibit similar rates of enrollment in college to the national average.
Hypothesis 2a.
Given racial and ethnic minority students’ high concentration in community colleges, for-profit colleges, and lower-tier colleges and universities, we expect that multiracial high school graduates will similarly be disproportionately represented in these types of institutions.
Hypothesis 2b.
We expect that “proximity to whiteness” will have moderating effects on enrollment patterns across institutional type for multiracial students, e.g., we expect that multiracial students whose primary parent is white may exhibit higher rates of postsecondary enrollment, retention, and degree attainment relative to multiracial students whose primary parent is not white.

3. Materials and Methods

Our primary analysis makes use of several waves of data from the Education Longitudinal Study (ELS), a longitudinal, nationally representative cohort study that tracks a cohort of 10th graders as they progress through secondary and postsecondary education and into the workforce. We utilized the publicly available dataset. Data for the ELS was collected in waves, beginning in 2002 when the sample was in 10th grade and with three follow-ups in 2004, 2006, and 2012. For the ELS, students, parents, and key individuals in students’ educations including math, science, English teachers and school administrators were surveyed, providing extensive data that can help measure how student background and academic performance influences access to and success in higher education. We chose this dataset because it captures the experiences of multiracial students. However, as we will describe in the limitations at the end of the paper, the public-use ELS data is less than ideal for our analyses, as the relatively modest number of multiracial students (n = 640) meant that variables measuring race could not be as precise as possible due to potential privacy and anonymity concerns.
Because of the limitations of ELS data, we supplement our analyses using educational data from the National Longitudinal Study of Adolescent to Adult Health (Add Health). Our use of the restricted data set was approved by The Ohio State University Institutional Review Board. Add Health began collecting data with an initial sample in 1994 and 1995 of over 20,000 respondents in grades 7–12. Five follow up interviews, most recently in 2018, provide researchers with insights and information about respondents as they move from adolescence into and beyond young adulthood. For additional information regarding Add Health, see Harris et al. (2019). We use restricted data from Waves I-IV to assess college characteristics and eventual degree attainment. In addition to robust information about the higher education pathways of respondents, Add Health provides multiple measures of race, including asking respondents about all their racial ancestry. This question allowed us to construct our multiracial variable without losing information about the overall racial makeup of respondents. Our analytic sample of about 9752 is approximately 5.5% multiracial (n = 533). To the best of our ability, we matched outcomes of interest across the two data sets, allowing us to validate our findings and provide additional context to the experiences of multiracial college students.

3.1. Descriptive Statistics of the Datasets

Descriptive statistics of the two datasets is presented in Table 1. The ELS data set is 56.95% monoracial white, 38.22% monoracial non-white, and 4.82% multiracial. The Add Health data set has a slightly higher proportion of monoracial white respondents (62.93%) and multiracial students (5.46%), with a lower proportion of monoracial non-white students (31.60%). Both data sets are split evenly between male and female respondents (ELS: 50.21%; Add Health: 50.52%) with a mean GPA (grade point average) in the B range (ELS: 2.70; Add Health: 2.56). The parents of respondents are overwhelmingly monoracial, with only 1.47% of parents in the ELS sample identified as multiracial and only 2.56% of respondents in the Add Health sample identified as multiracial. ELS provides educational attainment information for both parents, with 27.37% of respondents in the sample having a mother with a college degree and 31.92% of respondents having a father with a college degree. Add Health collects educational attainment data from the primary parent. 22.98% of Add Health respondents had a primary parent with a college degree.

3.2. Variables and Analyses

The dependent variables for our four analyses are whether or not a high school graduate applied to college, whether or not they enrolled in college, what kind of institution they enrolled in, and, finally, what type of postsecondary degree was attained, if any. Our independent variables were informed by prior research and include demographic variables such as student race, gender, and GPA during high school. We are particularly interested in students’ proximity to whiteness, so we include parent race. Because education studies find that first-generation college students often have negative postsecondary outcomes (e.g., Wilbur and Roscigno 2016), we also include parental educational attainment.
Our analyses were carried out using the statistical software package Stata, version 16. Because of the binary outcome variables for our first two analyses, we utilized binomial logistic regression to measure differential rates of applying to college (0 = did not apply, 1 = did apply) and enrollment (0 = did not enroll, 1 = did enroll). We then restricted our analyses to students who attended college in some capacity and utilized binomial logistic regression to measure enrollment across institution type (private versus public, for-profit versus not-for-profit, and two- versus four year). Finally, we used multinomial logistic regression to examine overall degree attainment (0 = less than associate degree, 1 = associate degree, 2 = bachelor’s degree).

4. Results

Across all results we present first the results for the analyses with ELS data. We then present supplemental analyses with Add Health data where available. Broadly, ELS and Add Health results mirror each other, strengthening the validity of our conclusions as these trends are present in two distinct datasets.

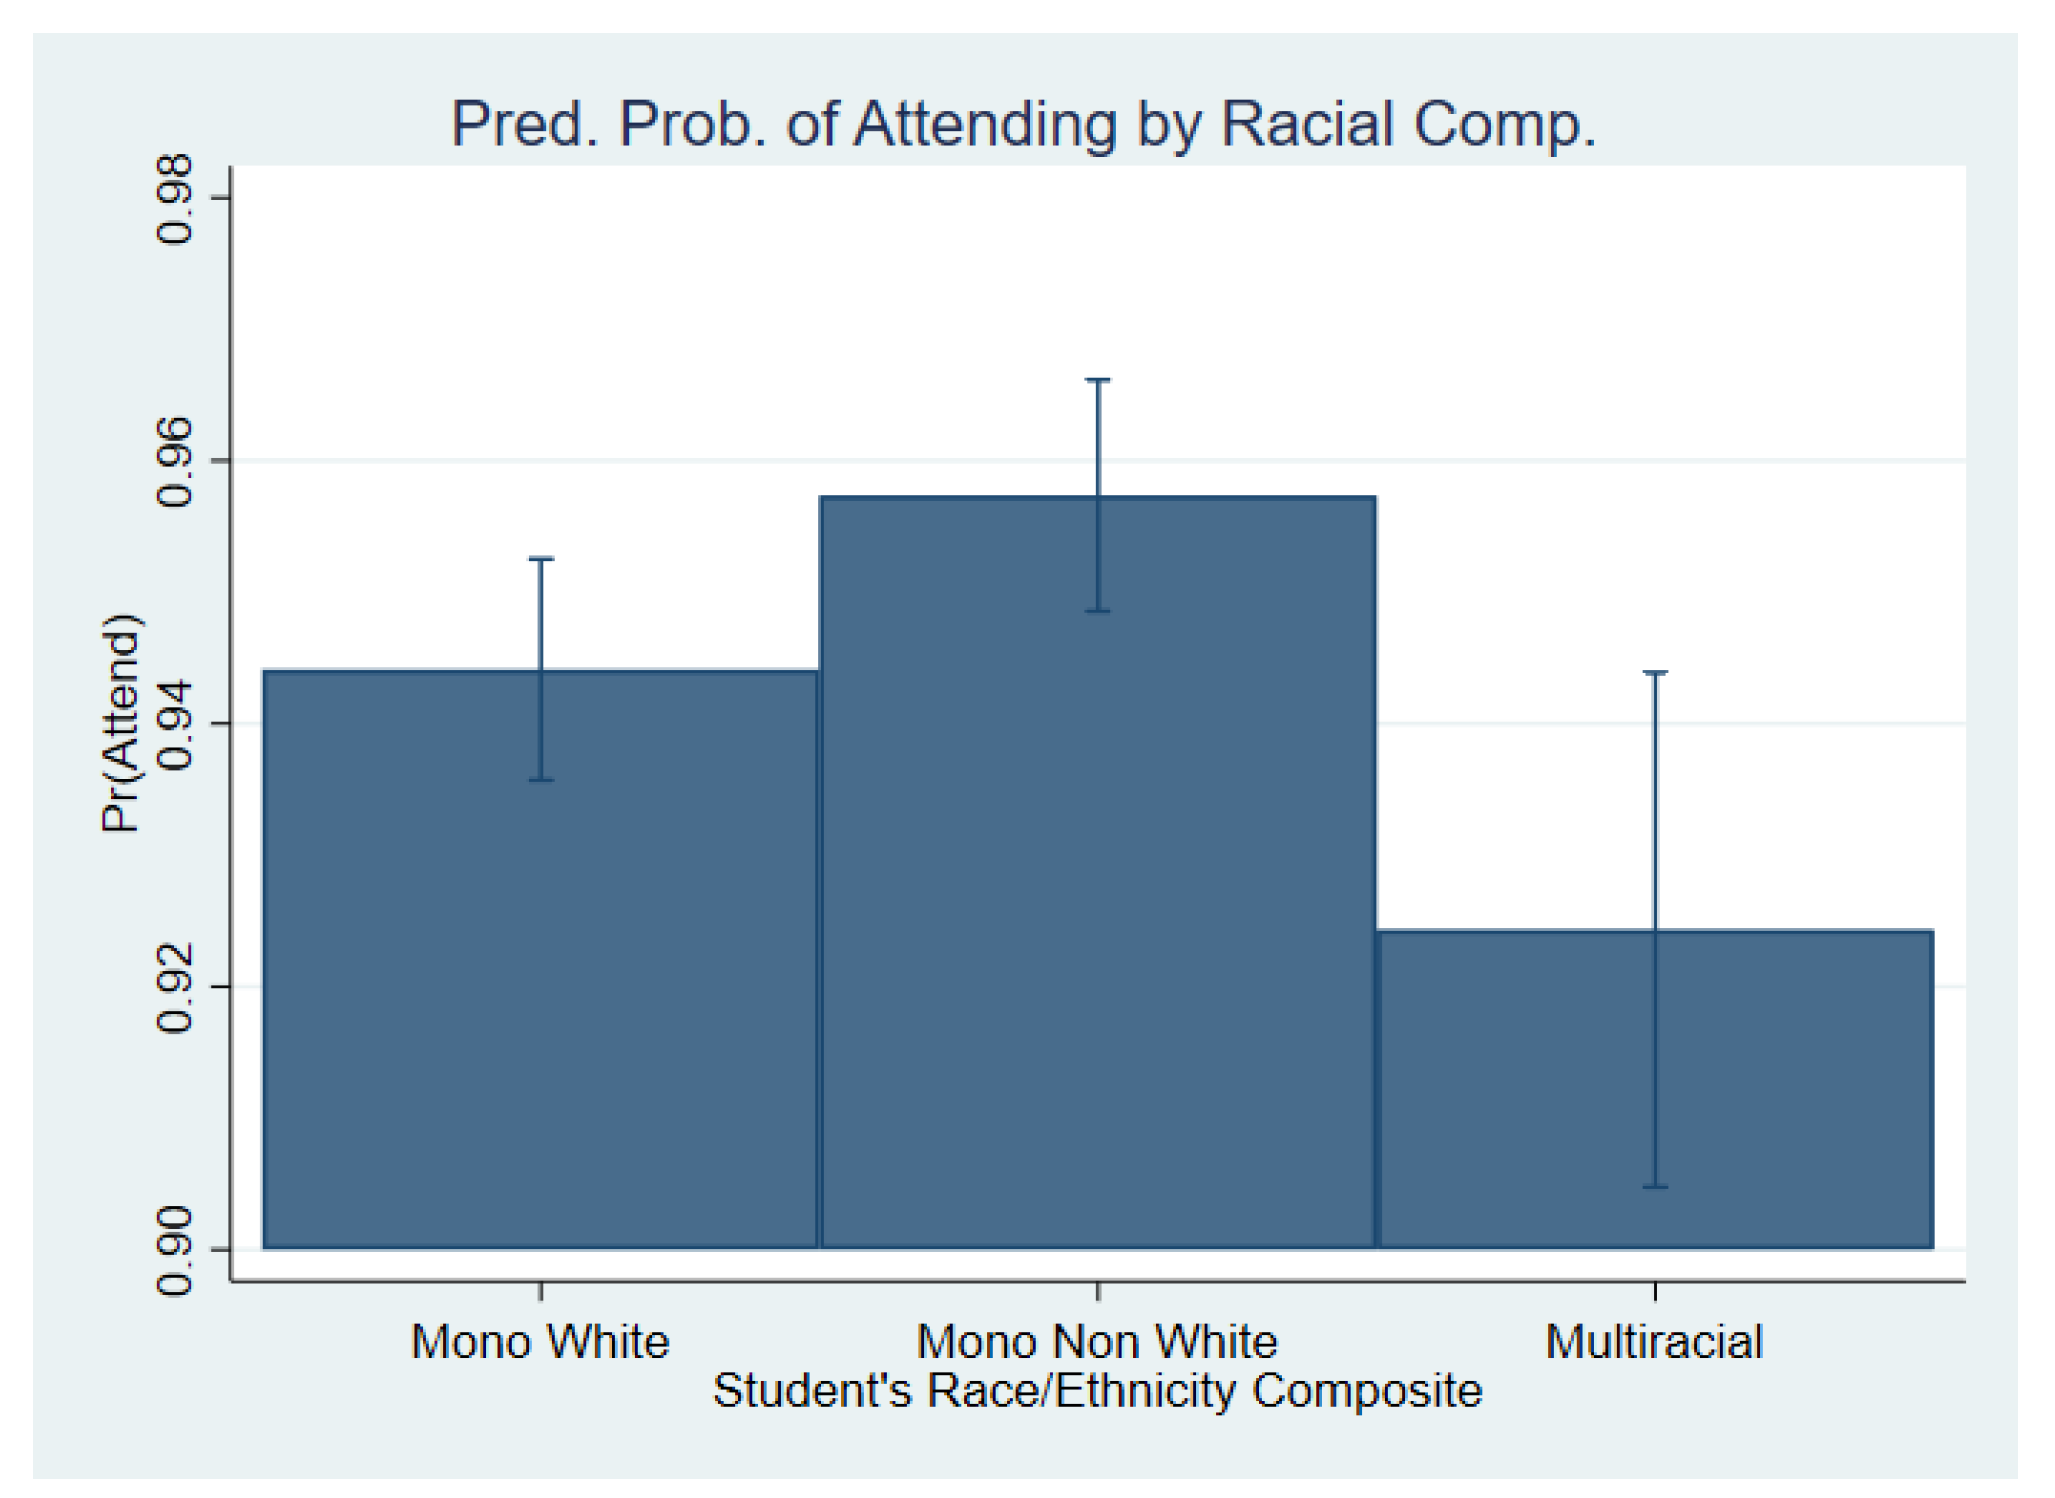
4.1. Logistic Regressions of College Application, Choice, and Enrollment

Table A1 presents logistic regression models for college application and college enrollment in the ELS. For the predicted odds of applying to college only sex, income at the highest levels, GPA, and parental education (both mother and father) are highly significant. Parental race is moderately significant when comparing monoracial non-white primary parents to monoracial white primary parents. Broadly, multiracial students trend more closely with monoracial white students than with monoracial nonwhite students, showing multiracial students to be only 7% more likely to apply to college than monoracial white students. GPA continues to be one of the strongest predictors of college application, with each one unit increase in GPA resulting in a student being 3.57 times more likely to apply to college (p < 0.001). Income is the only predictor with a larger magnitude. Consistent with previous research, high income is a strong predictor of applying to college, with children in families with a reported income above $200,001 being 10.7 times more likely to apply to college than those in the lowest income categories (p < 0.001).
Figure 1 demonstrates that, when controlling for all other variables, the predicted probabilities of applying to college for multiracial students fall between those for monoracial white students and monoracial nonwhite students. The differences in predicted probabilities presented here, however, are marginal, and so a conclusive effect is not apparent. This makes sense as barriers to application are significantly lower than barriers to enrollment and completion. As such, it is the metric that should exhibit the fewest disparities.
We see a significant effect in respondent’s race when looking at college enrollment. For enrollment, multiracial students are 28% less likely to enroll than their monoracial white counterparts (p < 0.05). Monoracial nonwhite students are 33% more likely to enroll than their monoracial white counterparts. Consistent with existing research, we find that female students are 20% more likely to enroll than male students (p < 0.01), and each one unit increase in GPA results in a student being 2.78 times more likely to enroll in a postsecondary institution (p < 0.001). Parental education is a highly significant predictor of enrollment as well. Parental race appears to be non-significant in this model and income is only significant at annual incomes above $75,001.
Figure 2 that predicted probabilities for enrollment are lower for multiracial students than for all monoracial students when holding all other variables at their means. This is an unexpected result, but given the large confidence interval the result is likely due to the small sample size, and further investigation is necessary. Application and enrollment data was not available for comparison in Add Health.

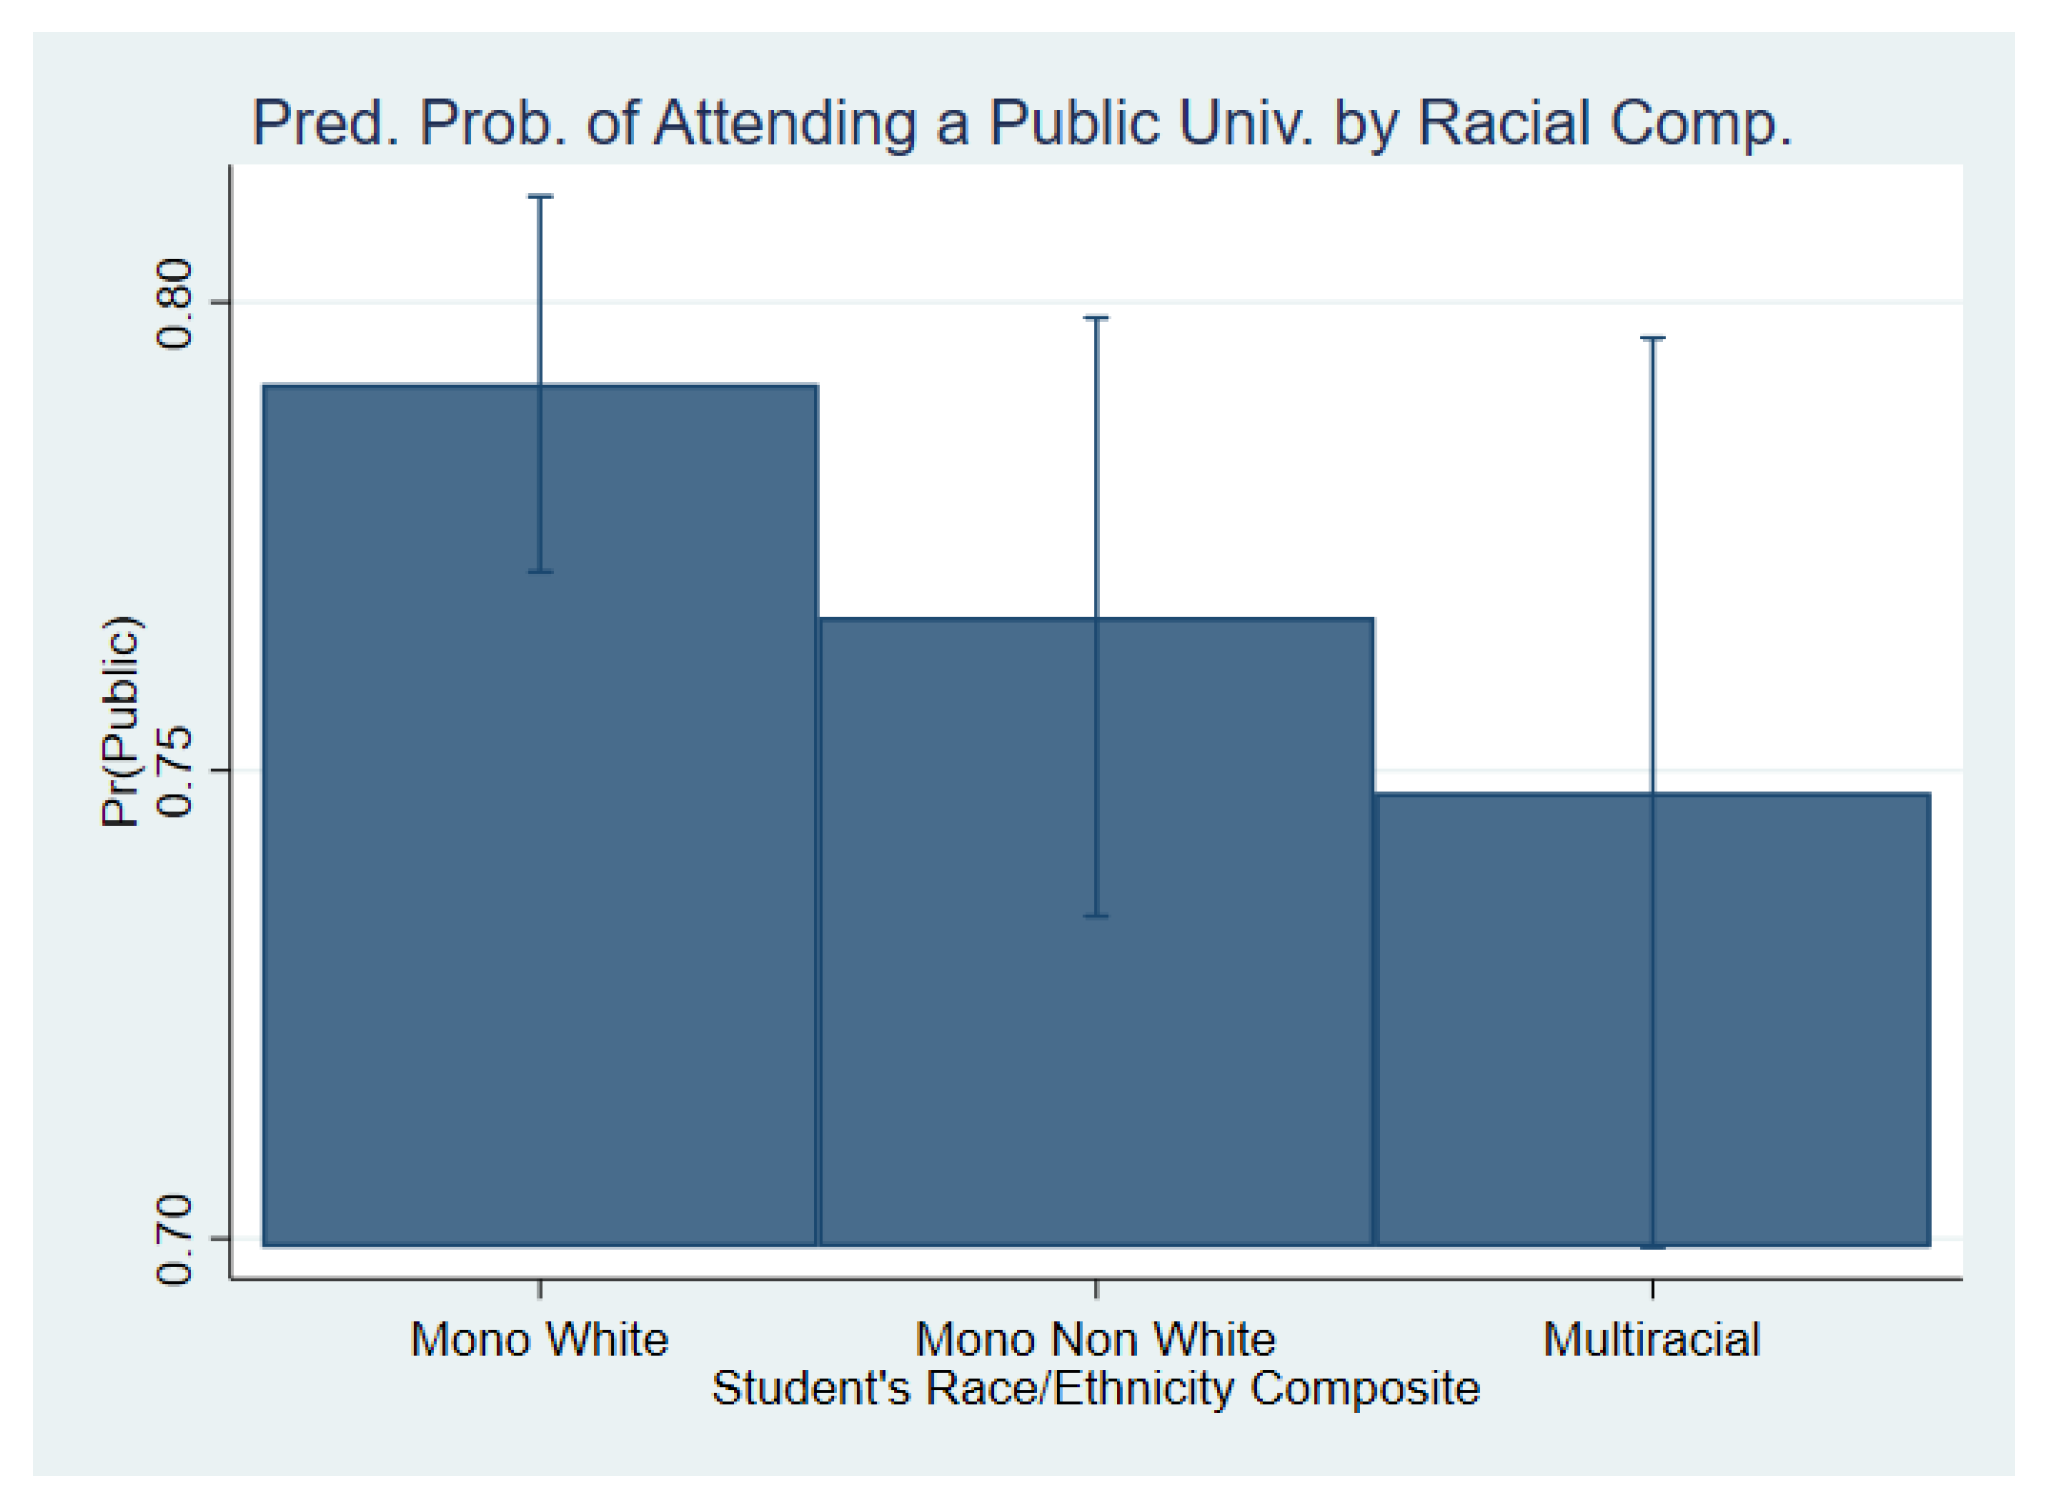
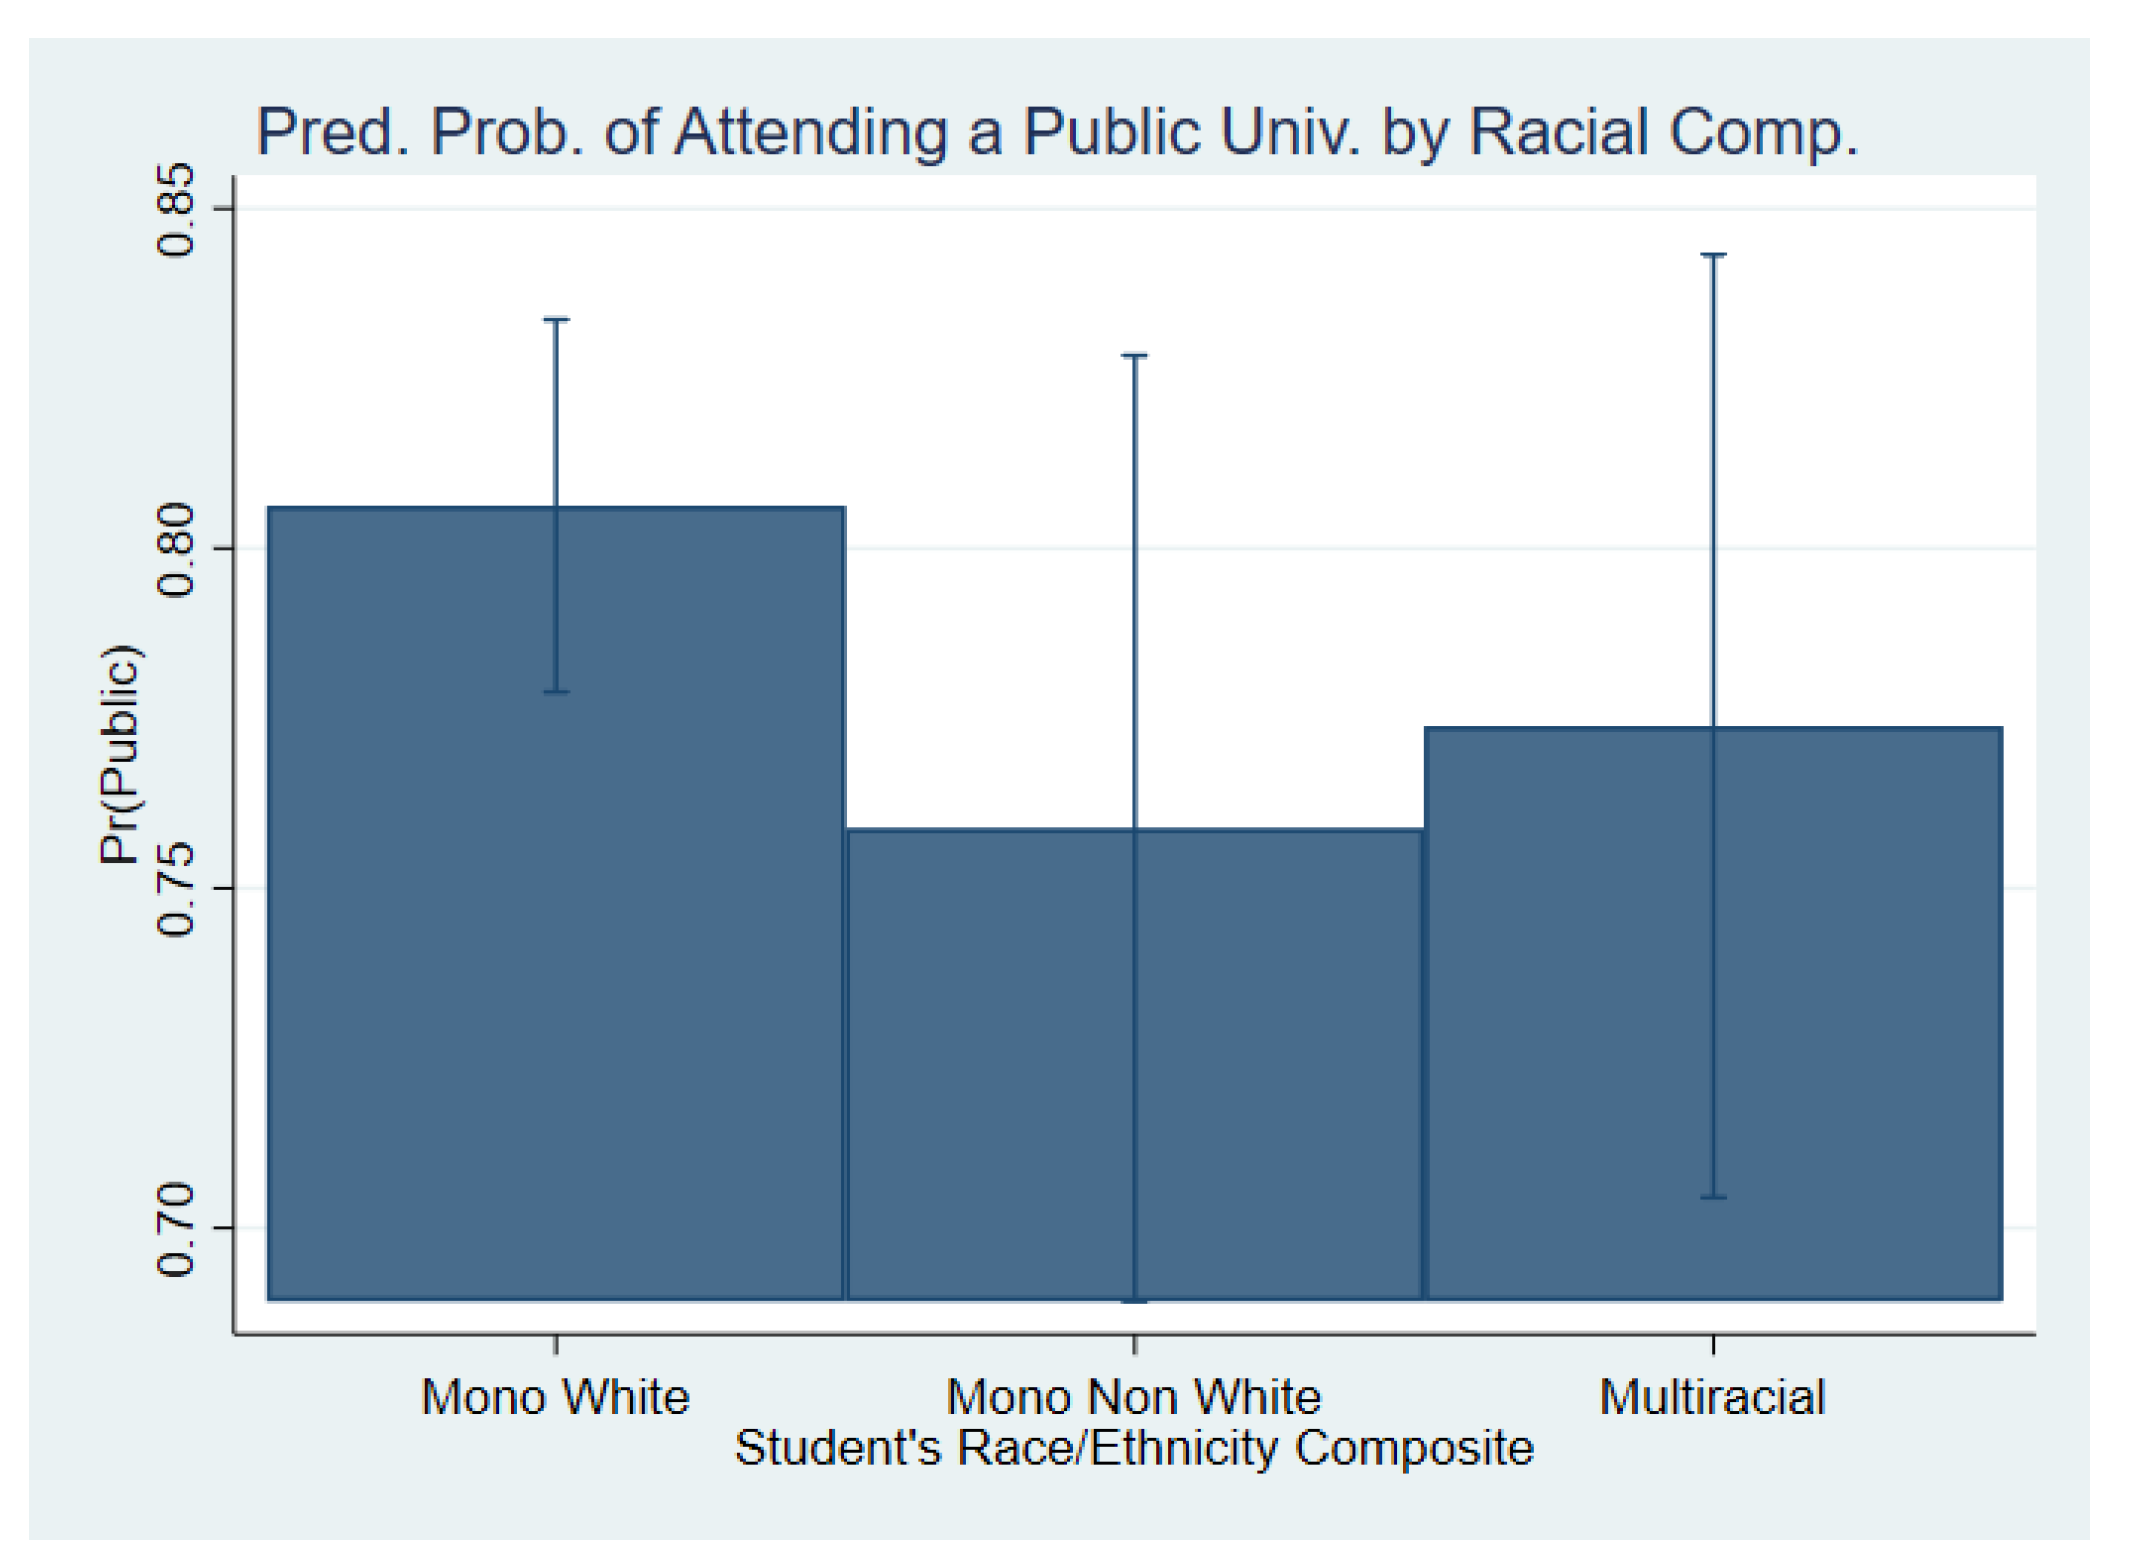
4.2. Logistic Regressions of College Characteristics

Table A2 presents results for logistic regressions of ELS respondents’ selection of college type, comparing public schools to private schools, for-profit schools to not for profit schools, and two-year schools to four-year schools. Across all three regressions, most predictors are not significant, with racial categorization of respondents nonsignificant in all models. Compared to monoracial white students, multiracial students are less likely to choose public schools and for-profit schools and more likely to choose four-year schools. GPA and parental degrees are all statistically significant predictors of school choice in all three models. Parental race and income were only partially significant in the third model (two- vs. four-year). Figure 3 shows that multiracial students have a lower predicted probability of choosing public universities, however the confidence interval is large enough to render these results less meaningful. Figure 4 demonstrates that multiracial students exhibit a comparable predicted probability of choosing for-profit colleges to monoracial white students. Figure 5 shows, again with a large confidence interval, that the predicted probability of choosing a four-year university is higher for multiracial students than for both categories of monoracial students.
Add Health comparison data is presented in Table A4. As demonstrated in Figure 6, Add Health data show that multiracial students have a lower predicted probability of attending public colleges than monoracial white students. There is only a marginal difference in predicted probability for monoracial non-white and multiracial students. Given the overlaps in error, we consider this difference to be unremarkable. Due to cell size constraints, we did not include our analysis of for-profit enrollment. We find Add Health data generally predict a higher probability of attending a four-year institution across the board when compared to the ELS results. We suspect this may be due to survey differences, specifically the variable we utilize to measure enrollment from ELS measures the first institution that students enrolled in, whereas Add Health measures the current institution in which students were enrolled at the time of interview.
As seen in Figure 7, the predicted probability of attending a four-year institution for multiracial students in the Add Health dataset is similar to that seen in Figure 5 for the ELS dataset. In comparing the results for ELS (Figure 5) and Add Health (Figure 7), The largest difference between the results for the two datasets is the predicted probability of attending a four-year school for monoracial non-white students. We consider this to be explained by the difference in survey style.

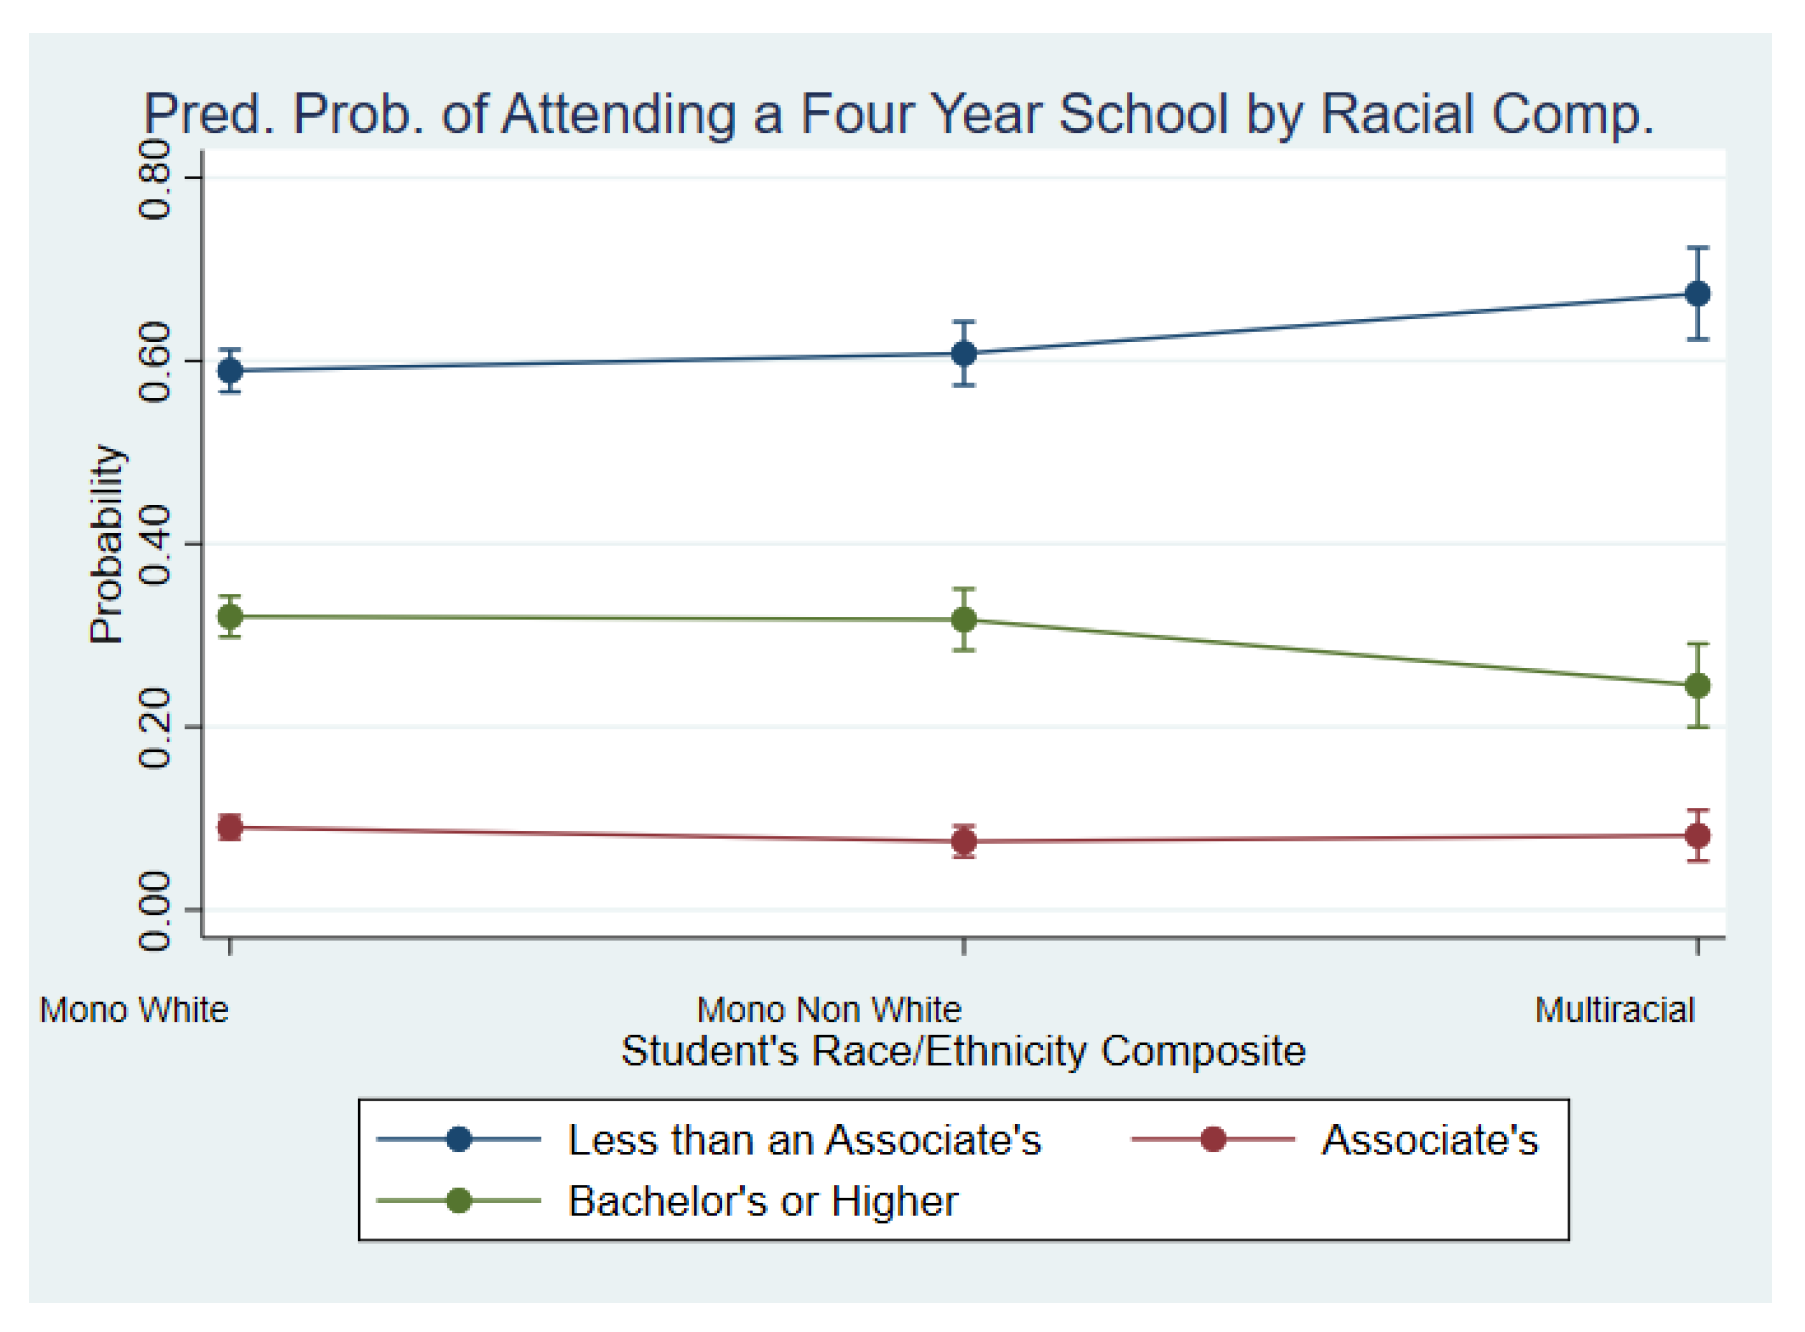
4.3. Multinomial Regression for Degree Attainment

Table A3 contains results for a multinomial regression of degree attainment comparing all possible outcomes for degree. Race of respondent was not significant in any comparison. Sex of respondent, income, and GPA were significant across all three comparisons. Parent degree was only significant when comparing attainment of a bachelor’s degree to attainment of an associate degree. Parental race was not significant in any model. Using Figure 8, we can see overall trends in degree attainment. Multiracial students have approximately a 5% higher predicted probability of graduating with less than an associate degree than either monoracial category. They also have approximately a 10% lower predicted probability of graduating with a bachelor’s degree or higher than both monoracial categories.
In Add Health, the number of participants who attain an associate degree is small enough to prevent robust and ethical analysis. To address this, we chose a simple binomial logistic regression to assess attainment of a bachelor’s degree instead of analyzing the three degree categories used in the ELS analysis. Results are detailed in Table A5. Figure 9 demonstrates that multiracial students have a lower predicted probability of graduating with a bachelor’s degree than monoracial nonwhite students but a higher predicted probability of attaining a bachelor’s degree than monoracial white students. All three groups, however, have nearly equal predicted probability of attaining the degree.

5. Discussion and Conclusions

Broadly, our results identify trends that suggest that multiracial students follow distinct college pathways and demonstrate different educational outcomes from those of their monoracial peers. Although multiracial high school graduates apply to college at similar rates to monoracial groups, our analyses find that multiracial individuals are 28% less likely to enroll in college than monoracial white students and are slightly more likely to enroll at private schools and four-year schools relative to monoracial white students. Additionally, multiracial college students have 10% lower predicted probabilities of earning a bachelor’s degree relative to monoracial white and nonwhite student groups.
Consistent with previous research, our results indicate that family income is positively correlated with applying, enrolling, and completing college. Additionally, parental degree attainment continues to be a strong predictor of degree attainment. This is particularly relevant to multiracial students as interracial marriages with Asian parents are more common amongst highly educated women (Qian et al. 2001). There are substantive differences in socioeconomic status between interracial partners depending on their racial composition. With the limitations of the ELS and Add Health datasets, we are unable to quantify the effects of both parents and are, instead, able to include only the race of the primary parent.
We now revisit our initial hypotheses:
Hypothesis 1.
Given that racial disparities in postsecondary enrollment have been approaching parity for several decades, we expect that multiracial high school graduates will exhibit similar rates of enrollment in college to the national average.
We find that Hypothesis 1 is not supported by our data. Multiracial students are 28% less likely to enroll in college compared to their monoracial white counterparts (p < 0.05).
Hypothesis 2a.
Given racial and ethnic minority students’ high concentration in community colleges, for-profit colleges, and lower-tier colleges and universities, we expect that multiracial high school graduates will similarly be disproportionately represented in these types of institutions.
We do not find support for Hypothesis 2a. Rather, our analyses find that multiracial students are overrepresented in four-year and private not-for-profit institutions. That 63% and 64% of respondents in ELS and Add Health, respectively, indicate having a monoracial white parent suggests that multiracial people with a white parent more closely align with the educational expectations of high-achieving white parents, therefore more commonly landing in institutions that are likely to be predominantly white. Further research disentangling racial makeup may be able to better test this supposition.
It may also be the case that the growing value of a four-year degree (see Hout 2012) may be influencing enrollment patterns. If parents and their children view four-year and private not-for-profit institutions as better investments than other institutions, they may base their application and enrollment decisions on this assessment. Students from more disadvantaged backgrounds, for example, may prefer to enroll at four-year institutions rather than two-year colleges because they understand the four-year degree as a route to upward mobility. Advantaged students, conversely, may be tracked into more elite private colleges because of their known prestige and social benefits (see Khan 2010, for example).
Hypothesis 2b.
We expect that “proximity to whiteness” will have moderating effects on enrollment patterns across institutional type for multiracial students, e.g., we expect that multiracial students whose primary parent is white may exhibit higher rates of postsecondary enrollment, retention, and degree attainment relative to multiracial students whose primary parent is not white.
We draw no conclusion for Hypothesis 2b as our results show no significant relationship between parental racial composition and child educational outcomes.
When examining these results through the lens of multiracial experiences under white supremacy, we see how multiracial students are pressured by the structures and institutions of white supremacy. Multiracial students are more likely to enroll in four-year and private not-for profit colleges and universities, spaces that are disproportionately white compared to two-year public colleges and for-profit colleges and universities. PWIs can garner significant social and economic benefits for multiracial students via proximity to whiteness—the ability to leverage the social connections and prestige of attending a PWI in the post-grad years can indeed be invaluable. Yet prior work indicates that demographically and culturally white spaces such as PWIs can be alienating and unwelcoming for students with complex racial identities (e.g., Harris 2017; Museus et al. 2016). While many schools have directed efforts toward diversity and equity initiatives to support minority students in PWIs, much of the messaging around these programs unintentionally excludes multiracial students who may not identify with opportunities coded for monoracial groups (Ozaki and Johnston 2008). This is an area of outreach that can be taken up by student affairs professionals with some facility, and we hope this research provides a view into a community of students who often fall between the cracks of diversity and initiative efforts.

5.1. Limitations and Avenues for Further Study

While we believe our results to be significant contributions to the study of race and education, data limitations prevent stronger conclusions about the reach of our findings. Our most significant limitation is the small sample sizes available in these larger data sets. Importantly, the ELS public-use data are not optimal for our analyses due to the lack of precision in measurement of race. With imprecise data, the extent to which we can disentangle the influence of race from other important explanatory variables such as family income, high school GPA, and parental educational attainment is stunted. Although Add Health provides more granular race data than the ELS, our cell sizes become so small that responsible analysis is not possible. As a result, we are unable to tease out the experiences of multiracial students without white ancestry from multiracial students with white ancestry. In addition, because we are unable to examine the specific ancestry of multiracial students, we cannot compare multiracial students directly to their monoracial counterparts (i.e., we cannot compare a half Asian and half Black person to the monoracial Asian and Black respondents).
Because of nature of the Add Health and ELS datasets, we were not able to disaggregate school type by predominantly white institutions from minority serving instructions such as HBCUs, HSIs, and TCs. Future comparative work measuring these differential educational outcomes for monoracial and multiracial students will provide valuable insights into the educational trajectories of multiracial students.
With regards to the role of family income in shaping college trajectories, and when considering multiracial students in this framework, it is important to acknowledge the disparate financial patterns that exist across racial groups. Future research must account for the racial makeup of multiracial students to adjust for this. We think it imperative that future research delineate between the experiences of multiracial students with and without Black heritage given the constraints of systemic anti-Black racism within the context of the United States.
These limitations and restrictions to analysis are largely unavoidable due to the general lack of data on multiracial populations. It is our hope that future work focused on the educational experiences of multiracial people will inspire data collection on a large enough scale that these more fine-grained analyses are possible. The restrictions we faced provide a fruitful direction for future research on the subject of educational outcomes as data becomes more widely available. Specifically, we look forward to analyses comparing outcomes for multiracial students by their respective parental races and research that documents the differing impacts of student racial identity, parental racial identity, and socioeconomic factors, which are so deeply shaped by the racial dynamics of the United States.

5.2. Conclusions

Carrying out analyses with what we believe to be the best available data on multiracial college students, our results indicate that multiracial students exhibit distinct patterns of college enrollment and persistence compared to monoracial white and non-white students. This indicates that something unique about multiracial students warrants further investigation. As more comprehensive data on multiracial populations becomes available, we urge future work to replicate and extend our analyses to better understand multiracial students’ educational outcomes.

Author Contributions

Conceptualization, S.M. and E.W.; methodology, S.M. and E.W.; software, S.M. and E.W.; validation, S.M. and E.W.; formal analysis, S.M. and E.W.; data curation, S.M. (ELS) and E.W. (Add Health); writing—original draft preparation, S.M. and E.W.; writing—review and editing S.M. and E.W.; project administration, S.M. and E.W. All authors have read and agreed to the published version of the manuscript.

Funding

This research uses data from Waves I-IV of Add Health, grant P01 HD31921 (Harris) from Eunice Kennedy Shriver National Institute of Child Health and Human Development (NICHD), with cooperative funding from 23 other federal agencies and foundations. Add Health was designed by J. Richard Udry, Peter S. Bearman, and Kathleen Mullan Harris at the University of North Carolina at Chapel Hill. Add Health is directed by Robert A. Hummer and funded by the National Institute on Aging cooperative agreements U01 AG071448 (Hummer) and U01AG071450 (Aiello and Hummer) at the University of North Carolina at Chapel Hill. No direct support was received from grant P01-HD31921 or cooperative agreements U01 AG071448 and U01AG071450. The authors received no direct or external funding for this project.

Institutional Review Board Statement

Ethical review and approval were not required to access the ELS data as the use in this research is a secondary analysis of publicly available data. Access to the restricted Add Health dataset was conducted in accordance with the Declaration of Helsinki and approved by the Institutional Review Board of The Ohio State University (Study Number 2006B0274) under The Ohio State University’s OHRP Federalwide Assurance #00006378 (PI: Bethany Boettner).

Data Availability Statement

Publicly available ELS datasets were analyzed in this study. This data can be found here: https://nces.ed.gov/surveys/els2002/avail_data.asp (Accessed 20 November 2020). Restrictions apply to the availability of the Add Health data. Data was obtained from the Carolina Population Center and are available for request here: https://data.cpc.unc.edu/projects/2/view. The analytic dataset was constructed in September 2021 using the available restricted data at the time.

Acknowledgments

The authors would like to thank ZM, GM, and OW for their administrative support. The authors would also like to thank members of their department for their guidance and feedback throughout this project as well as the editors and the anonymous reviewers who provided invaluable insight and advice throughout the revision process.

Conflicts of Interest

The authors declare no conflict of interest.

Appendix A

Appendix A contains the regression results for the ELS data.
Table A1. Logistic Regression of Application and Enrollment.
VariableApplicationEnrollment
Race (monoracial white)
 Mono Non White1.2131.329
(0.153)(0.194)
 Multiracial1.0690.723 *
(0.151)(0.108)
Female1.286 ***1.204 **
(0.075)(0.081)
Income (none)
$1000 or less0.9461.131
(0.378)(0.511)
$1001–$50001.4820.806
(0.564)(0.340)
$5001–$10,0000.9931.103
(0.366)(0.465)
$10,001–$15,0001.2660.908
(0.450)(0.365)
$15,001–$20,0001.5671.018
(0.554)(0.408)
$20,001–$25,0001.4901.057
(0.523)(0.421)
$25,001–$35,0001.8841.318
(0.650)(0.517)
$35,001–$50,0002.208 *1.483
(0.757)(0.579)
$50,001–$75,0002.373 *2.104
(0.816)(0.829)
$75,001–$100,0004.020 ***3.036 **
(1.419)(1.234)
$100,001–$200,0004.731 ***4.919 ***
(1.724)(2.160)
$200,001 or more10.723 ***28.613 **
(5.357)(30.810)
GPA3.570 ***2.781 ***
(0.152)(0.127)
Mother w/degree1.507 ***1.842 ***
(0.135)(0.225)
Father w/degree1.607 ***1.981 ***
(0.130)(0.214)
Parent Race (monoracial white)
 Monoracial Non-White1.367 *1.274
(0.173)(0.183)
 Multiracial1.0231.256
(0.242)(0.347)
Log Likelihood−3957.215−3182.246
chi22008.9741331.490
Exponentiated coefficients; Standard errors in parentheses. * p < 0.05, ** p < 0.01, *** p < 0.001.
Table A2. Logistic Regression of School Types.
VariablePublic vs. PrivateFor vs. Not for ProfitTwo vs. Four Year
Race (monoracial white)
 Mono Non White0.8660.6450.912
(0.105)(0.176)(0.113)
 Multiracial0.7820.9421.091
(0.107)(0.278)(0.158)
Female1.0591.0750.797 ***
(0.056)(0.123)(0.044)
Income (none)
$1000 or less2.1371.3250.612
(1.267)(1.678)(0.338)
$1001–$50001.5132.3430.756
(0.748)(2.596)(0.374)
$5001–$10,0001.7191.8290.940
(0.838)(2.025)(0.456)
$10,001–$15,0001.4622.6270.839
(0.665)(2.789)(0.390)
$15,001–$20,0001.2862.9771.078
(0.578)(3.146)(0.498)
$20,001–$25,0001.8792.2310.744
(0.840)(2.361)(0.340)
$25,001–$35,0001.5082.7200.926
(0.655)(2.839)(0.416)
$35,001–$50,0001.5902.1421.011
(0.686)(2.233)(0.452)
$50,001–$75,0001.5771.6051.220
(0.679)(1.677)(0.545)
$75,001–$100,0001.4671.8161.567
(0.634)(1.905)(0.703)
$100,001–$200,0001.3610.9331.986
(0.590)(0.997)(0.897)
$200,001 or more0.8611.2743.405 *
(0.381)(1.431)(1.632)
GPA0.735 ***0.375 ***4.181 ***
(0.033)(0.031)(0.198)
Mother w/degree0.820 **0.728 *1.497 ***
(0.051)(0.117)(0.099)
Father w/degree0.781 ***0.646 **1.706 ***
(0.048)(0.097)(0.108)
Parent Race (monoracial white)
 Mono Non White1.2491.0221.354 *
(0.155)(0.272)(0.171)
 Multiracial0.8791.1510.903
(0.191)(0.527)(0.205)
Friend Race (monoracial white)
 Mono Non White1.1591.459 *0.951
(0.091)(0.243)(0.075)
 Multiracial0.8030.9951.317
(0.137)(0.412)(0.253)
Log Likelihood−4418.622−1300.840−4236.000
chi2243.137272.1241959.173
Exponentiated coefficients; Standard errors in parentheses. * p < 0.05, ** p < 0.01, *** p < 0.001.
Table A3. Multinomial Regression of Degree Attainment.
VariableAssociates vs. Less Than AssociatesBachelors vs. Less Than AssociatesBachelors vs. Associates
Race (monoracial white)
 Mono Non White0.8041.2440.838
(0.151)(0.234)(0.168)
 Multiracial0.7881.2691.178
(0.167)(0.269)(0.267)
Female1.403 ***0.713 ***1.191 *
(0.115)(0.058)(0.103)
Income
 None0.6261.5980.612
(0.463)(1.183)(0.482)
$1000 or less1.911 *0.523 *2.747 *
(0.615)(0.168)(1.169)
$1001–$50000.5091.9660.525
(0.204)(0.789)(0.227)
$5001–$10,0000.5211.9190.654
(0.186)(0.686)(0.254)
$10,001–$15,0000.7221.3841.144
(0.166)(0.318)(0.295)
$15,001–$20,0000.7571.3220.871
(0.165)(0.289)(0.210)
$20,001–$25,0000.625 *1.601 *0.750
(0.134)(0.342)(0.174)
$25,001–$35,0000.9871.0141.140
(0.141)(0.145)(0.178)
$50,001–$75,0001.476 ***0.678 ***1.083
(0.174)(0.080)(0.135)
$75,001–$100,0001.2830.7790.683 **
(0.183)(0.111)(0.100)
$100,001–$200,0001.0660.9380.457 ***
(0.186)(0.164)(0.080)
$200,001 or more0.8311.2030.230 ***
(0.309)(0.446)(0.083)
GPA2.060 ***0.486 ***0.241 ***
(0.132)(0.031)(0.017)
Mother w/degree0.9931.0070.643 ***
(0.108)(0.109)(0.070)
Father w/degree1.0690.9360.542 ***
(0.110)(0.096)(0.056)
Parent’s Race (monoracial white)
 Mono Non White1.1200.8930.885
(0.211)(0.168)(0.178)
 Multiracial0.5531.8080.543
(0.240)(0.785)(0.245)
Friend’s Race (monoracial white)
 Mono Non White0.9321.0731.036
(0.112)(0.129)(0.131)
 Multiracial0.8241.2130.740
(0.262)(0.385)(0.242)
Log Likelihood−7002.310−7002.310−7002.310
chi24903.3384903.3384903.338
Exponentiated coefficients; Standard errors in parentheses. * p < 0.05, ** p < 0.01, *** p < 0.001.

Appendix B

Appendix B includes regression results using Add Health data.
Table A4. Logistic Regression of School Types.
VariablePublic vs. PrivateTwo vs. Four Year
Race (monoracial white)
 Mono Non White0.756
(0.200)
2.609 ***
(0.643)
 Multiracial0.822
(0.189)
1.315
(0.288)
Female0.912
(0.085)
0.710 ***
(0.063)
Income 0.997 ***
(0.001)
1.006 ***
(0.001)
GPA0.752 ***
(0.056)
3.631 ***
(0.264)
Parent w/degree0.948
(0.091)
1.753 ***
(0.170)
Parent Race (monoracial white)
 Mono Non White1.315
(0.340)
0.628
(0.149)
 Multiracial2.006
(0.854)
0.419 **
(0.130)
Log Likelihood−1528.822−1626.094
chi243.095564.954
Exponentiated coefficients; Standard errors in parentheses. * p < 0.05, ** p < 0.01, *** p < 0.001.
Table A5. Logistic Regression Predicting Degree Attainment.
VariableBachelors Degree
Race (monoracial white)
 Mono Non White1.211
(0.228)
 Multiracial1.119
(0.191)
Female0.923
(0.066)
Income 1.011 ***
(0.001)
GPA6.964 ***
(0.444)
Parent w/degree1.931 ***
(0.151)
Parent Race (monoracial white)1.328
(0.245)
 Mono Non White0.702
(0.181)
 Multiracial1.211
(0.228)
Log Likelihood−2509.578
chi21943.550
Exponentiated coefficients; Standard errors in parentheses. * p < 0.05, ** p < 0.01, *** p < 0.001.

References

  1. Adelman, Clifford. 2006. The Toolbox Revisited: Paths to Degree Completion from High School through College; Washington, DC: U.S. Department of Education.
  2. Allen, Walter. 1992. The Color of Success: African-American College Student Outcomes at Predominantly White and Historically Black Public Colleges and Universities. Harvard Educational Review 62: 26–45. [Google Scholar] [CrossRef]
  3. Alon, Sigal, and Marta Tienda. 2005. Assessing the ‘Mismatch’ Hypothesis: Differences inCollege Graduation Rates by Institutional Selectivity. Sociology of Education 78: 294–315. [Google Scholar] [CrossRef]
  4. Armstrong, Elizabeth A., and Laura T. Hamilton. 2013. Paying for the Party: How College Maintains Inequality. Harvard: Harvard University Press. [Google Scholar]
  5. Bowen, William G., Derek Bok, and Glenn C. Loury. 2016. The Shape of the River: Long-Term Consequences of Considering Race in College and University Admissions. Princeton: Princeton University Press, Available online: Muse.jhu.edu/book/45834 (accessed on 20 November 2020).
  6. Bratter, Jenifer L. 2018. Multiracial Identification and Racial Gaps: A Work in Progress. Annals of the American Academy of Political and Social Science 677: 69–80. [Google Scholar] [CrossRef]
  7. Bratter, Jenifer L., and Bridget K. Gorman. 2011. Does Multiracial Matter? A Study of Racial Disparities in Self-Rated Health. Demography 48: 127–52. [Google Scholar] [CrossRef]
  8. Bratter, Jenifer L., and Rachel Tolbert Kimbro. 2013. Multiracial Children and Poverty: Evidence From the Early Childhood Longitudinal Study of Kindergartners. Family Relations 62: 175–89. [Google Scholar] [CrossRef]
  9. Bratter, Jenifer L., and Sarah Damaske. 2013. Poverty at a racial crossroads: Poverty among multiracial children of single mothers. Journal of Marriage and Family 75: 486–502. [Google Scholar] [CrossRef]
  10. Brunsma, David L. 2005. Interracial Families and the Racial Identification of Mixed-Race Children: Evidence from the Early Childhood Longitudinal Study. Social Forces 84: 1131–57. [Google Scholar] [CrossRef]
  11. Campbell, Mary E., Jenifer L. Bratter, and Wendy D. Roth. 2016. Measuring the Diverging Components of Race: An Introduction. American Behavioral Scientist 60: 381–89. [Google Scholar] [CrossRef]
  12. Campion, Karis. 2019. ‘You Think You’re Black?’ Exploring Black Mixed-Race Experiences of Black Rejection. Ethnic and Racial Studies 42: 196–213. [Google Scholar] [CrossRef] [Green Version]
  13. Carnevale, Anthony P., and Jeff Strohl. 2010. How Increasing College Access is Increasing Inequality, and what to do About it. In Rewarding Strivers. New York: The Century Foundation Press. [Google Scholar]
  14. Choi, Kate H., and Nancy E. Reichman. 2019. The health of biracial children in two-parent families in the United States. Demographic Research 41: 197–230. [Google Scholar] [CrossRef] [Green Version]
  15. Choi, Kate H., and Rachel E. Goldberg. 2021. Multiracial Children’s Experiences of Family Instability. Journal of Marriage and Family 83: 627–43. [Google Scholar] [CrossRef]
  16. Clayton, Kristen A. 2020. Biracial Identity Development at Historically White and Historically Black Colleges and Universities. Sociology of Education 93: 238–55. [Google Scholar] [CrossRef]
  17. DeAngelo, Linda, and Ray Franke. 2016. Social Mobility and Reproduction for Whom? College Readiness and First-Year Retention. American Educational Research Journal 53: 1588–625. [Google Scholar] [CrossRef]
  18. Fisher, Sycarah, Jennifer L. Reynolds, Wei Wen Hsu, Jessica Barnes, and Kenneth Tyler. 2014. Examining Multiracial Youth in Context: Ethnic Identity Development and Mental Health Outcomes. Journal of Youth and Adolescence 43: 1688–99. [Google Scholar] [CrossRef] [Green Version]
  19. Gasser, Heather S. 2002. Portraits of Individuality: A Qualitative Study of Multiracial College Students. Journal of Student Affairs 11: 42–53. [Google Scholar]
  20. Goldrick-Rab, Sara. 2006. Following Their Every Move: An Investigation of Social-Class Differences in College Pathways. Sociology of Education 79: 67–79. [Google Scholar] [CrossRef]
  21. Gullickson, Aaron. 2016. Essential Measures: Ancestry, Race, and Social Difference. American Behavioral Scientist 60: 498–518. [Google Scholar] [CrossRef]
  22. Gullickson, Aaron, and Ann Morning. 2011. Choosing Race: Multiracial Ancestry and Identification. Social Science Research 40: 498–512. [Google Scholar] [CrossRef]
  23. Harris, Jessica C. 2017. Multiracial College Students’ Experiences with Multiracial Microaggressions. Race, Ethnicity, and Education 20: 429–45. [Google Scholar] [CrossRef] [Green Version]
  24. Harris, Kathleen Mullan, Carolyn Tucker Halpern, Eric A. Whitsel, Jon M. Hussey, Ley A. Killeya-Jones, Joyce Tabor, and Sarah C. Dean. 2019. Cohort Profile: The National Longitudinal Study of Adolescent to Adult Health (Add Health). International Journal of Epidemiology 48: 1415–25. [Google Scholar] [CrossRef]
  25. Hirschman, Charles, Richard Alba, and Reynolds Farley. 2000. The Meaning and Measurement Of Race in the U.S. Census: Glimpses into the Future. Demography 37: 381–93. [Google Scholar] [CrossRef] [PubMed]
  26. Hout, Michael. 2012. Social and Economic Returns to College Education in the United States. Annual Review of Sociology 38: 379–400. [Google Scholar] [CrossRef] [Green Version]
  27. Ishitani, Terry T. 2006. Studying Attrition and Degree Completion Behavior Among First-Generation College Students in the United States. The Journal of Higher Education 77: 861–85. [Google Scholar] [CrossRef]
  28. Jack, Anthony A. 2019. The Privileged Poor. Cambridge, MA: Harvard University Press. [Google Scholar]
  29. Johnson, Anthony. 2019. ‘I can turn it on when I need to’: Pre-college Integration, Culture, and Peer Academic Engagement among Black and Latino/a Engineering Students. Sociology of Education 92: 1–20. [Google Scholar] [CrossRef]
  30. Jones, Lee, Jeanett Castellanos, and Darnell Cole. 2002. Examining the Ethnic Minority Student Experience at Predominantly White Institutions: A Case Study. Journal of Hispanic Higher Education 1: 19–39. [Google Scholar] [CrossRef]
  31. Khan, Shamus. 2010. Privilege: The Making of an Adolescent Elite at St. Paul’s School. Princeton: Princeton University Press. [Google Scholar]
  32. Lareau, Annette. 2015. Cultural Knowledge and Social Inequality. American Sociological Review 80: 1–27. [Google Scholar] [CrossRef] [Green Version]
  33. Leonhardt, David. 2005. The College Dropout Boom. The New York Times, May 24. [Google Scholar]
  34. Mettler, Suzanne. 2014. Degrees of Inequality: How the Politics of Higher Education Sabotaged the American Dream. New York: Basic Books. [Google Scholar]
  35. Museus, Samuel D., Susan A. Lambe Sariñana, April L. Yee, and Thomas E. Robinson. 2016. A Qualitative Analysis of Multiracial Students’ Experiences with Prejudice and Discrimination in College. Journal of College Student Development 57: 680–97. [Google Scholar] [CrossRef]
  36. Ozaki, Casey, and Marc Johnston. 2008. The space in between: Issues for multiracial student organization and advising. New Directions for Student Services 2008: 53–61. [Google Scholar] [CrossRef]
  37. Qian, Zhenchao, Sampson Lee Blair, and Stacey D. Ruf. 2001. Asian American Interracial and Interethnic Marriages: Differences by Education and Nativity. International Migration Review 35: 557–86. [Google Scholar] [CrossRef]
  38. Renn, Kristen A. 2000. Patterns of situational identity among biracial and multiracial college students. Review of Higher Education 23: 399–420. [Google Scholar] [CrossRef]
  39. Rivera, Lauren A. 2012. Diversity within Reach: Recruitment versus Hiring in Elite Firms. The ANNALS of the American Academy of Political and Social Science 639: 71–90. [Google Scholar] [CrossRef]
  40. Rosenbaum, James E., Regina Deil-Amen, and Ann E. Person. 2006. After Admission: From College Access to College Success. New York: Russell Sage Foundation, USA. [Google Scholar]
  41. Smith Morest, Vanessa. 2013. From Access to Opportunity: The Evolving Social Roles of Communiy Colleges. The American Sociologist 44: 319–28. [Google Scholar] [CrossRef]
  42. Stuber, Jenny M. 2015. Pulled in or Pushed Out? How Organizational Factors Shape the Social and Extra-Curricular Experiences of First-Generation Students. In College Students’ Experiences of Power and Marginality: Sharing Spaces and Negotiating Differences. Edited by Elizabeth M. Lee and Chaise LaDousa. New York: Routledge, pp. 118–35. [Google Scholar]
  43. Tabb, Karen M., Christopher R. Larrison, Shinwoo Choi, and Hsiang Huang. 2016. Disparities in Health Services Use Among Multiracial American Young Adults. Journal of Immigrant and Minority Health 18: 1462–69. [Google Scholar] [CrossRef] [PubMed]
  44. U.S. Department of Commerce, Census Bureau, Current Population Survey (CPS), October Supplement, 2010 through 2019. 2020, See Digest of Education Statistics 2020, Table 302.20. Available online: https://nces.ed.gov/programs/digest/d20/tables/dt20_302.20.asp (accessed on 20 November 2020).
  45. U.S. Department of Education, National Center for Education Statistics, Integrated Postsecondary Education Data System (IPEDS), Winter 2016–17, Graduation Rates Component. 2017, See Digest of Education Statistics 2017, Table 326.10. Available online: https://nces.ed.gov/programs/digest/d20/tables/dt20_326.10.asp (accessed on 20 November 2020).
  46. U.S. Department of Education, National Center for Education Statistics, Integrated Postsecondary Education Data System (IPEDS), Spring 2001, Spring 2011, and Spring 2019, Fall Enrollment Component. 2019, See Digest of Education Statistics 2019, Table 306.10. Available online: https://nces.ed.gov/programs/digest/d19/tables/dt19_306.10.asp (accessed on 20 November 2020).
  47. Wilbur, Tabitha G., and Vincent J. Roscigno. 2016. First-Generation Disadvantage and College Enrollment/Completion. Socius 2: 1–11. [Google Scholar] [CrossRef] [Green Version]
  48. Yoo, Hyung Chol, Kelly F. Jackson, Rudy P. Guevarra, Matthew J. Miller, and Blair Harrington. 2016. Construction and Initial Validation of the Multiracial Experiences Measure (MEM). Journal of Counseling Psychology 63: 198–209. [Google Scholar] [CrossRef] [Green Version]
Figure 1. Pred. Prob. of Applying by Racial Comp. using ELS data.
Socsci 11 00101 g001
Figure 2. Pred. Prob. of Enrollment by Racial Comp. using ELS data.
Socsci 11 00101 g002
Figure 3. Pred. Prob. of Public v Private Choice by Racial Comp. using ELS data.
Socsci 11 00101 g003
Figure 4. Pred. Prob. of Profit v Not for Profit Choice by Racial Comp. using ELS data.
Socsci 11 00101 g004
Figure 5. Pred. Prob. of Two Year v Four Year Choice by Racial Comp. using ELS data.
Socsci 11 00101 g005
Figure 6. Pred. Prob. of Attending a Public School by Racial Comp. using Add Health data.
Socsci 11 00101 g006
Figure 7. Pred. Prob. of Attending a Four Year Institution by Racial Comp. using Add Health Data.
Socsci 11 00101 g007
Figure 8. Pred. Prob. of Degree Attainment by Racial Comp. using ELS data.
Socsci 11 00101 g008
Figure 9. Pred. Prob. of BA Degree Attainment by Racial Comp. using Add Health Data.
Socsci 11 00101 g009
Table 1. Descriptive Statistics for Samples.
VariablesELSAdd Health
Mean (S.D.) or %Mean (S.D.) or %
Respondent’s Race
 Monoracial White56.9562.93
 Monoracial Non-White38.2231.60
 Multiracial4.825.46
Female50.2150.52
GPA2.70 (0.78)2.56 (0.84)
Parent’s Race
 Monoracial White62.6364.47
 Monoracial Non-White35.9033.02
 Multiracial1.472.52
Mother w/College Degree27.37N/A
Father w/College Degree31.92N/A
Parent w/College DegreeN/A22.98
n13,2859752
ELS (Education Longitudinal Study); GPA (Grade Point Average); Add Health (National Longitudinal Study of Adolescent to Adult Health).
Publisher’s Note: MDPI stays neutral with regard to jurisdictional claims in published maps and institutional affiliations.

