Article

Economic Poverty: Does the Break-Up of Families Matter?

by
Maria Alessandra Antonelli
and
Valeria De Bonis
*
Department of Legal and Economic Studies, Faculty of Law, Sapienza University of Rome, 00185 Rome, Italy
*
Author to whom correspondence should be addressed.
Soc. Sci. 2021, 10(6), 224; https://doi.org/10.3390/socsci10060224
Submission received: 26 April 2021 / Revised: 7 June 2021 / Accepted: 7 June 2021 / Published: 10 June 2021
(This article belongs to the Special Issue Research on Family Well-Being)

Abstract

:
In this paper we investigate the relationship between family structure and poverty for European countries using Eurostat and OECD data. In particular, we focus on the change in living arrangements, with the traditional type of household—couple with children—being partially replaced by single and extended families. The results of our econometric analysis show that the decline in the traditional family type affects individual poverty: the marriage rate and the share of couples, both with and without children, are inversely related to poverty; the divorce rate, the shares of extended families and singles with children are, instead, positively related to poverty.

1. Introduction and Literature Review

The last decades have been characterized by relevant social changes. The increased participation of women in the labor market, longer life expectancy, reduced marriages and fertility, an ageing population, and the introduction or increased application of divorce laws have affected the family structure modifying its size and composition. This transformation has represented an interdisciplinary issue analyzed either by sociologists—because the family is considered the basic unit of social organization—(Thornton and Fricke 1987), or by economists.
The economic literature has focused on the relationships between family composition and a range of socioeconomic variables such as child outcomes (Thomson et al. 1994; Iacovou 2001; Mackay 2005; Björklund et al. 2007; Menaghan 2009; Zill 2009; Åslund and Grönqvistet 2010; LaFave and Thomas 2017; Lee and McLanahan 2015; Chen et al. 2019), income inequality (Lerman 1996; Burtless 1999; Jędrzejczak and Pekasiewicz 2020) and poverty. While the economic literature on poverty is extensive with a particular emphasis on economic growth, redistribution and poverty (Kakwani 1993; Sen 1996; Goudie and Ladd 1999; Ferreira et al. 2010; Amarante and Brun 2018), the economic analyses on poverty and family composition are not very numerous—unlike sociological ones—and mainly deal with sectoral analyses considering particular countries and type of families. The latter has been the subject of mainly sectoral analyses considering particular countries and households’ composition. Some contributions focus on the poverty risk pointing out to specific “more vulnerable” groups, such as family—couples or single—with children (Bradbury and Jäntti 1999; Cappellari and Jenkins 2002; Dwyer 2015; Thévenon et al. 2018) and young adults (Aassve et al. 2002, 2005, 2006, 2007), or considering other elements, such as the ethnic characteristics of the family and/or the household’s head gender (Zinn 1989; Smith 2004; Cancian and Reed 2008; Cancian and Haskins 2014; Snyder et al. 2006). Other analyses dealing with family composition and poverty in a more general perspective either restrict the investigation to specific countries (Stern 1993; Meenakshi and Ray 2002) or, by extending the geographical area, offer an interesting descriptive picture of the data on the topic (Proctor and Dalaker 2002; OECD 2011; Iacovou and Skew 2011; Iacovou 2013). Sectoral analysis in this area stems from the complexity of the relationship between household composition and poverty. Households including a couple are generally less vulnerable to the risk of poverty given the economies of scale of the cohabitation and the possible working status of the second adult. As a consequence, singles and the decline in marriages can be poverty increasing.
However, if the decline in marriages is associated with fewer children per woman, the resulting reduction in the family size can have a poverty reducing effect. The empirical evidence shows that, while the decrease of fertility tends to reduce poverty, the growth of children born outside marriage has an opposite effect (Cancian and Reed 2008). Finally, extended households of three or more adults including at least one elderly person can be poverty increasing if the cohabitation arises from income needs due to the unemployment of the youngest members of the family, overcoming the economic benefits of the cohabitation due to the economies of scale. The transformation of household composition and its complex correlation with poverty also entails reconsidering family welfare policies (Butcher 2017; Aizer et al. 2016).
In particular, we analyze the change in living arrangements, with the traditional type of household—couple with children—being partially replaced by single and extended families. These different types of households might provide a different balance between addition to income and addition to needs, worsening the economic outcome of the living arrangements. We concentrate on families with children that—as specified before—are more vulnerable to poverty.
The aim of the paper is twofold: to describe the social changes that have taken place in recent decades and that are directly correlated to the composition of families (increase in divorces, decrease in fertility, decrease in marriages) and to test whether and in what direction these changes have influenced poverty. Our specific research question is whether the displacement of the traditional household (couple with children) by other family types is correlated with an increase in poverty.
To this purpose, we first describe the evolution of the household structure and poverty in Europe; then, we analyze the empirical relationship between household structure, poverty and family policies. With respect to the existing literature, we attempt a more general econometric approach to assess the relationship between family composition and poverty in Europe. We can focus on an extended geographical area since it is composed by countries characterized by fairly homogeneous socioeconomic and demographic elements.
We use Eurostat and OECD data (see the Appendix A for a description). Differently from the existing econometric analysis, our dependent variable is a standard individual indicator of poverty given by the share of individuals at risk of poverty (i.e., with disposable income lower than 60% of median income).
Our choice is motivated by the evidence that the share of individuals in poverty can significantly differ from the share of households in poverty because of the variability in the number of family components. The use of an individual poverty indicator also allows us to highlight possible external effects of personal decisions about alternative living arrangements in terms of increased/decreased poverty of all individuals of society and not only of the persons involved in the decisions (becoming poorer because of the loss of cohabitation’s benefits such as the related economies of scale).
As for the independent variables, we add family structure to the traditional socio-economic variables (GDP, education, income inequality, unemployment and public support for families). We are aware that income affects the choice of living arrangements and that living arrangements affect income; to partially overcome the problem, we use lagged values for family composition variables. Our analysis confirms the existence of “social external effects” in terms of community poverty of different living arrangements. In particular, the results show that the breaking up of existing traditional families (relevant because of the increase in the divorce rate) increases the poverty of the whole societies. These initial findings, that deserve further study, can be extended to draw policy implications to reshape welfare public policies for families in a modified social context.
The paper is structured as follows. Section 2 analyzes the social scenario as for family structure in Europe (Section 2.1) and the trends in household structure and poverty (Section 2.2); Section 3 describes methods and results of the analysis—in particular, some poverty indicators are introduced (Section 3.1), and the empirical relationship between household structure, poverty and family policies is analyzed (Section 3.2); Section 4 presents a general discussion of the results and the conclusions of the paper.

2. Discussion of the Socio-Economic Framework

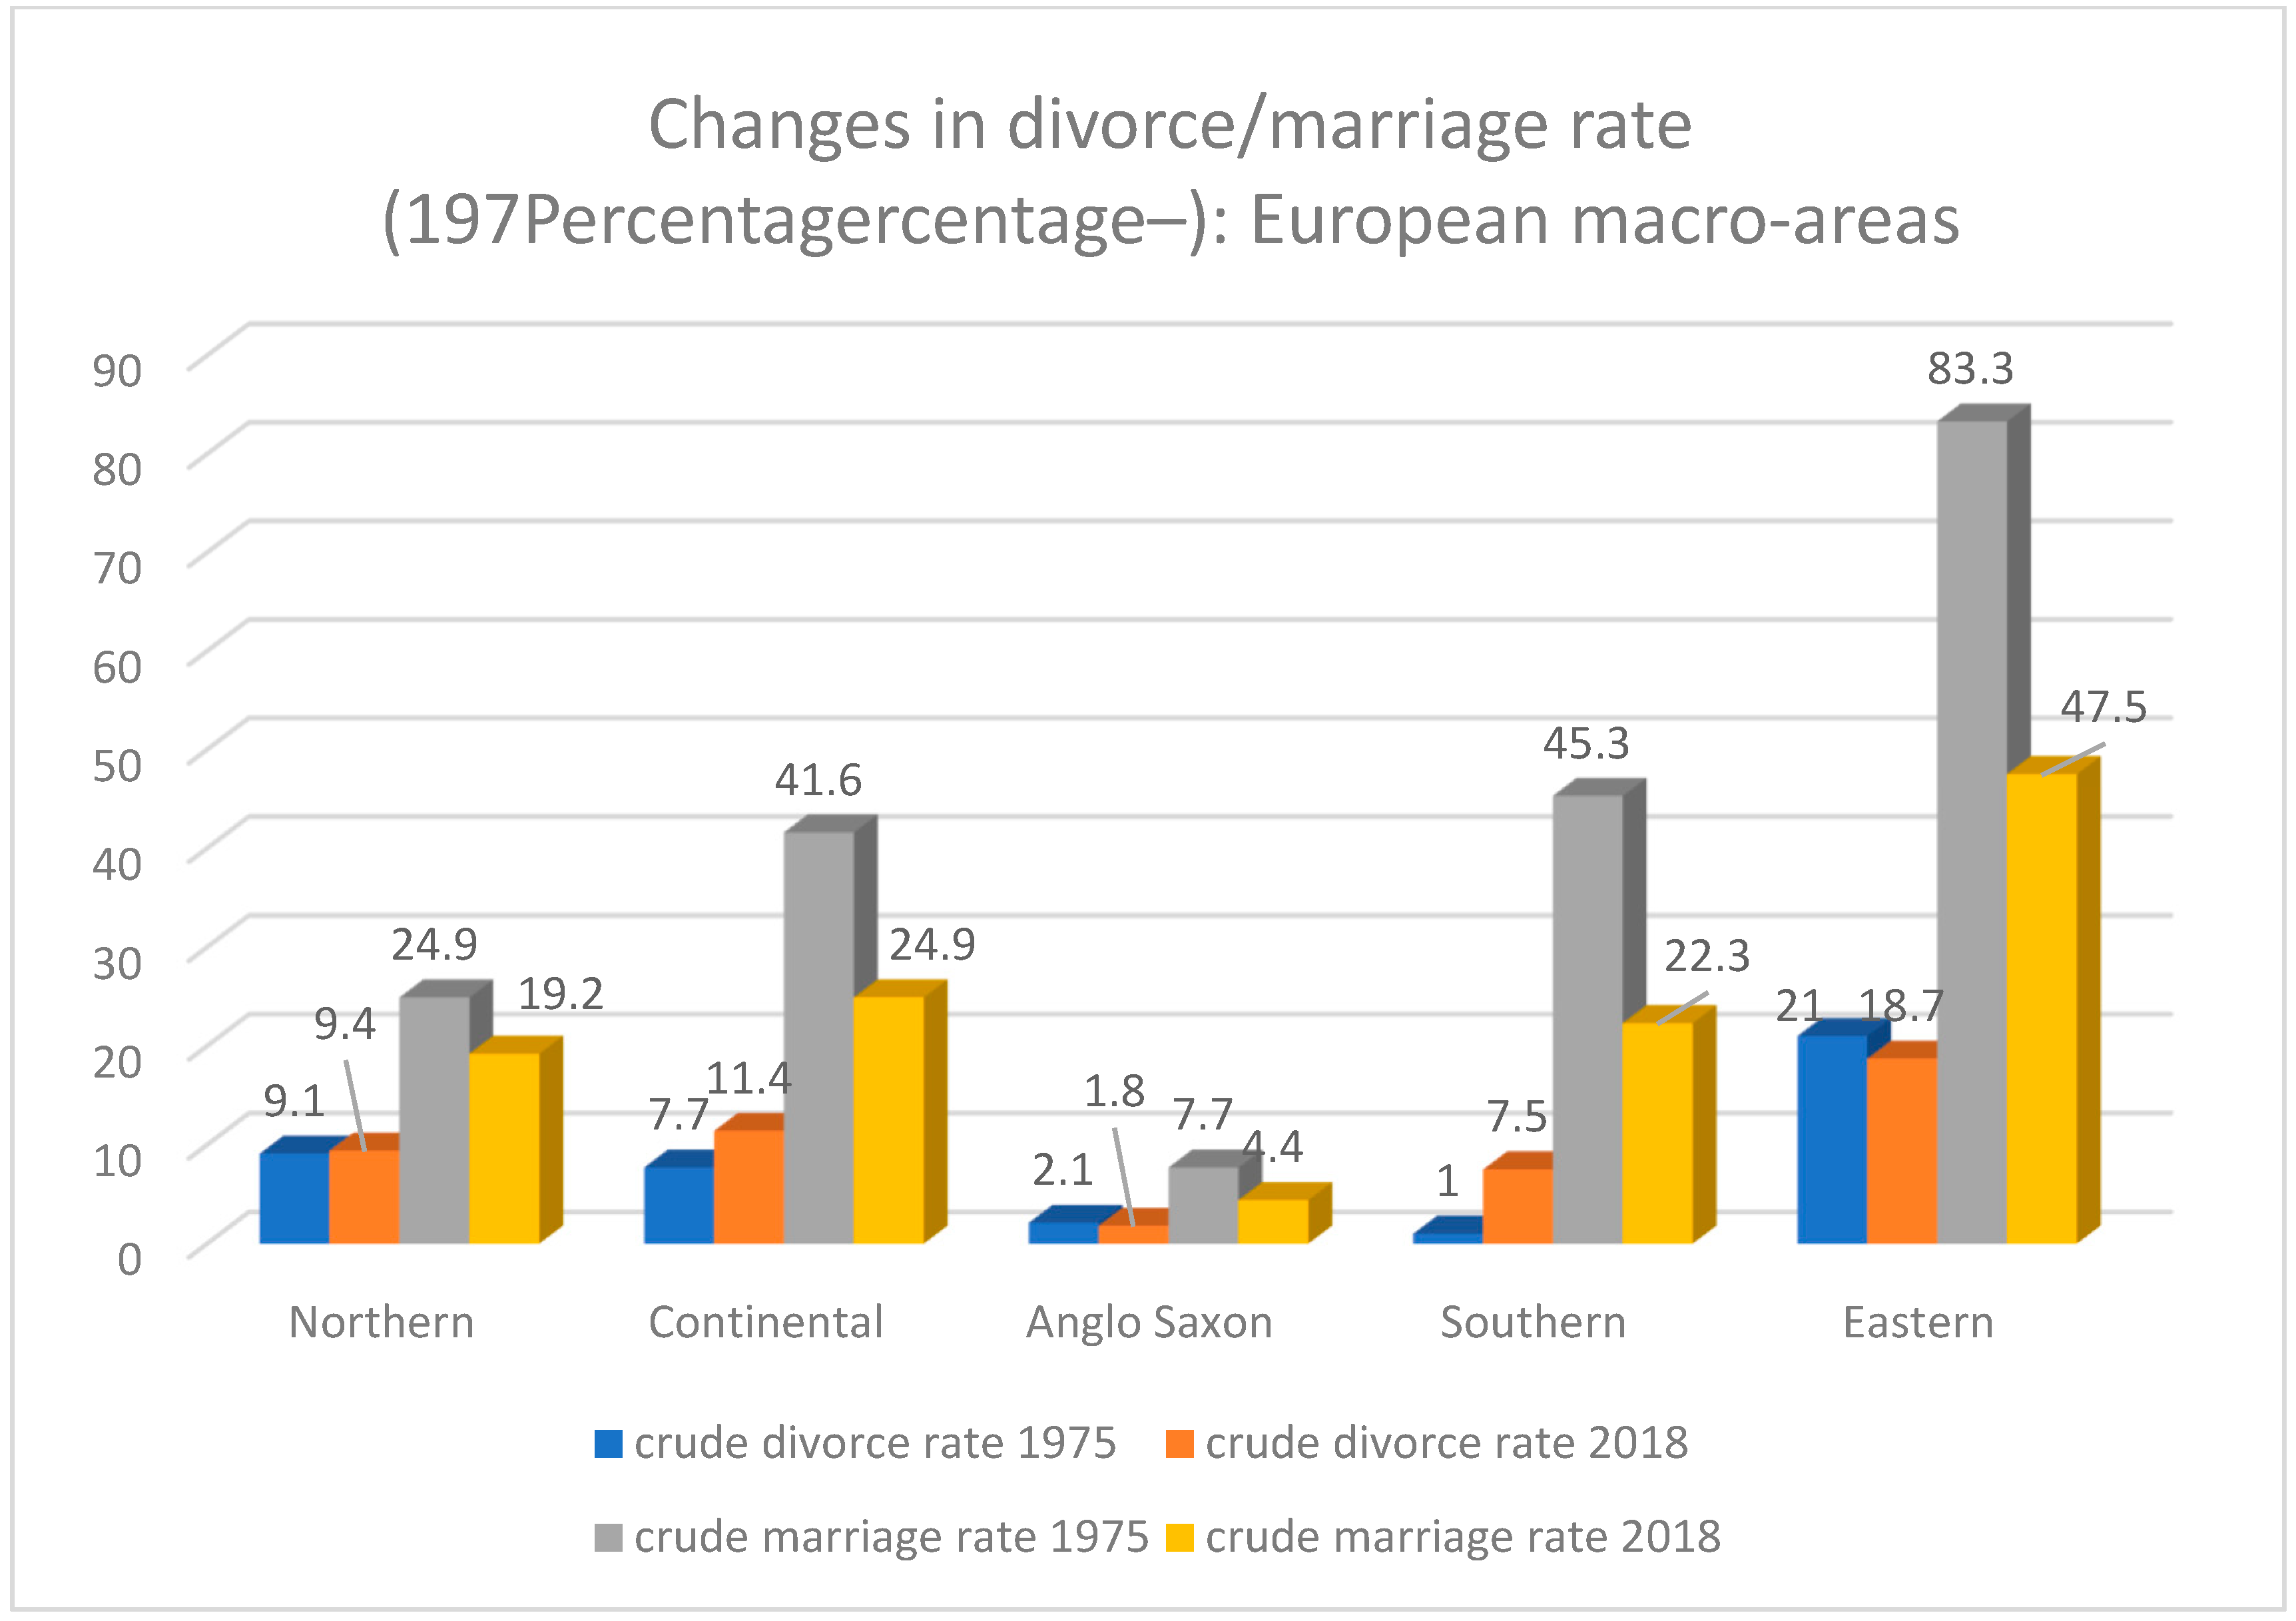
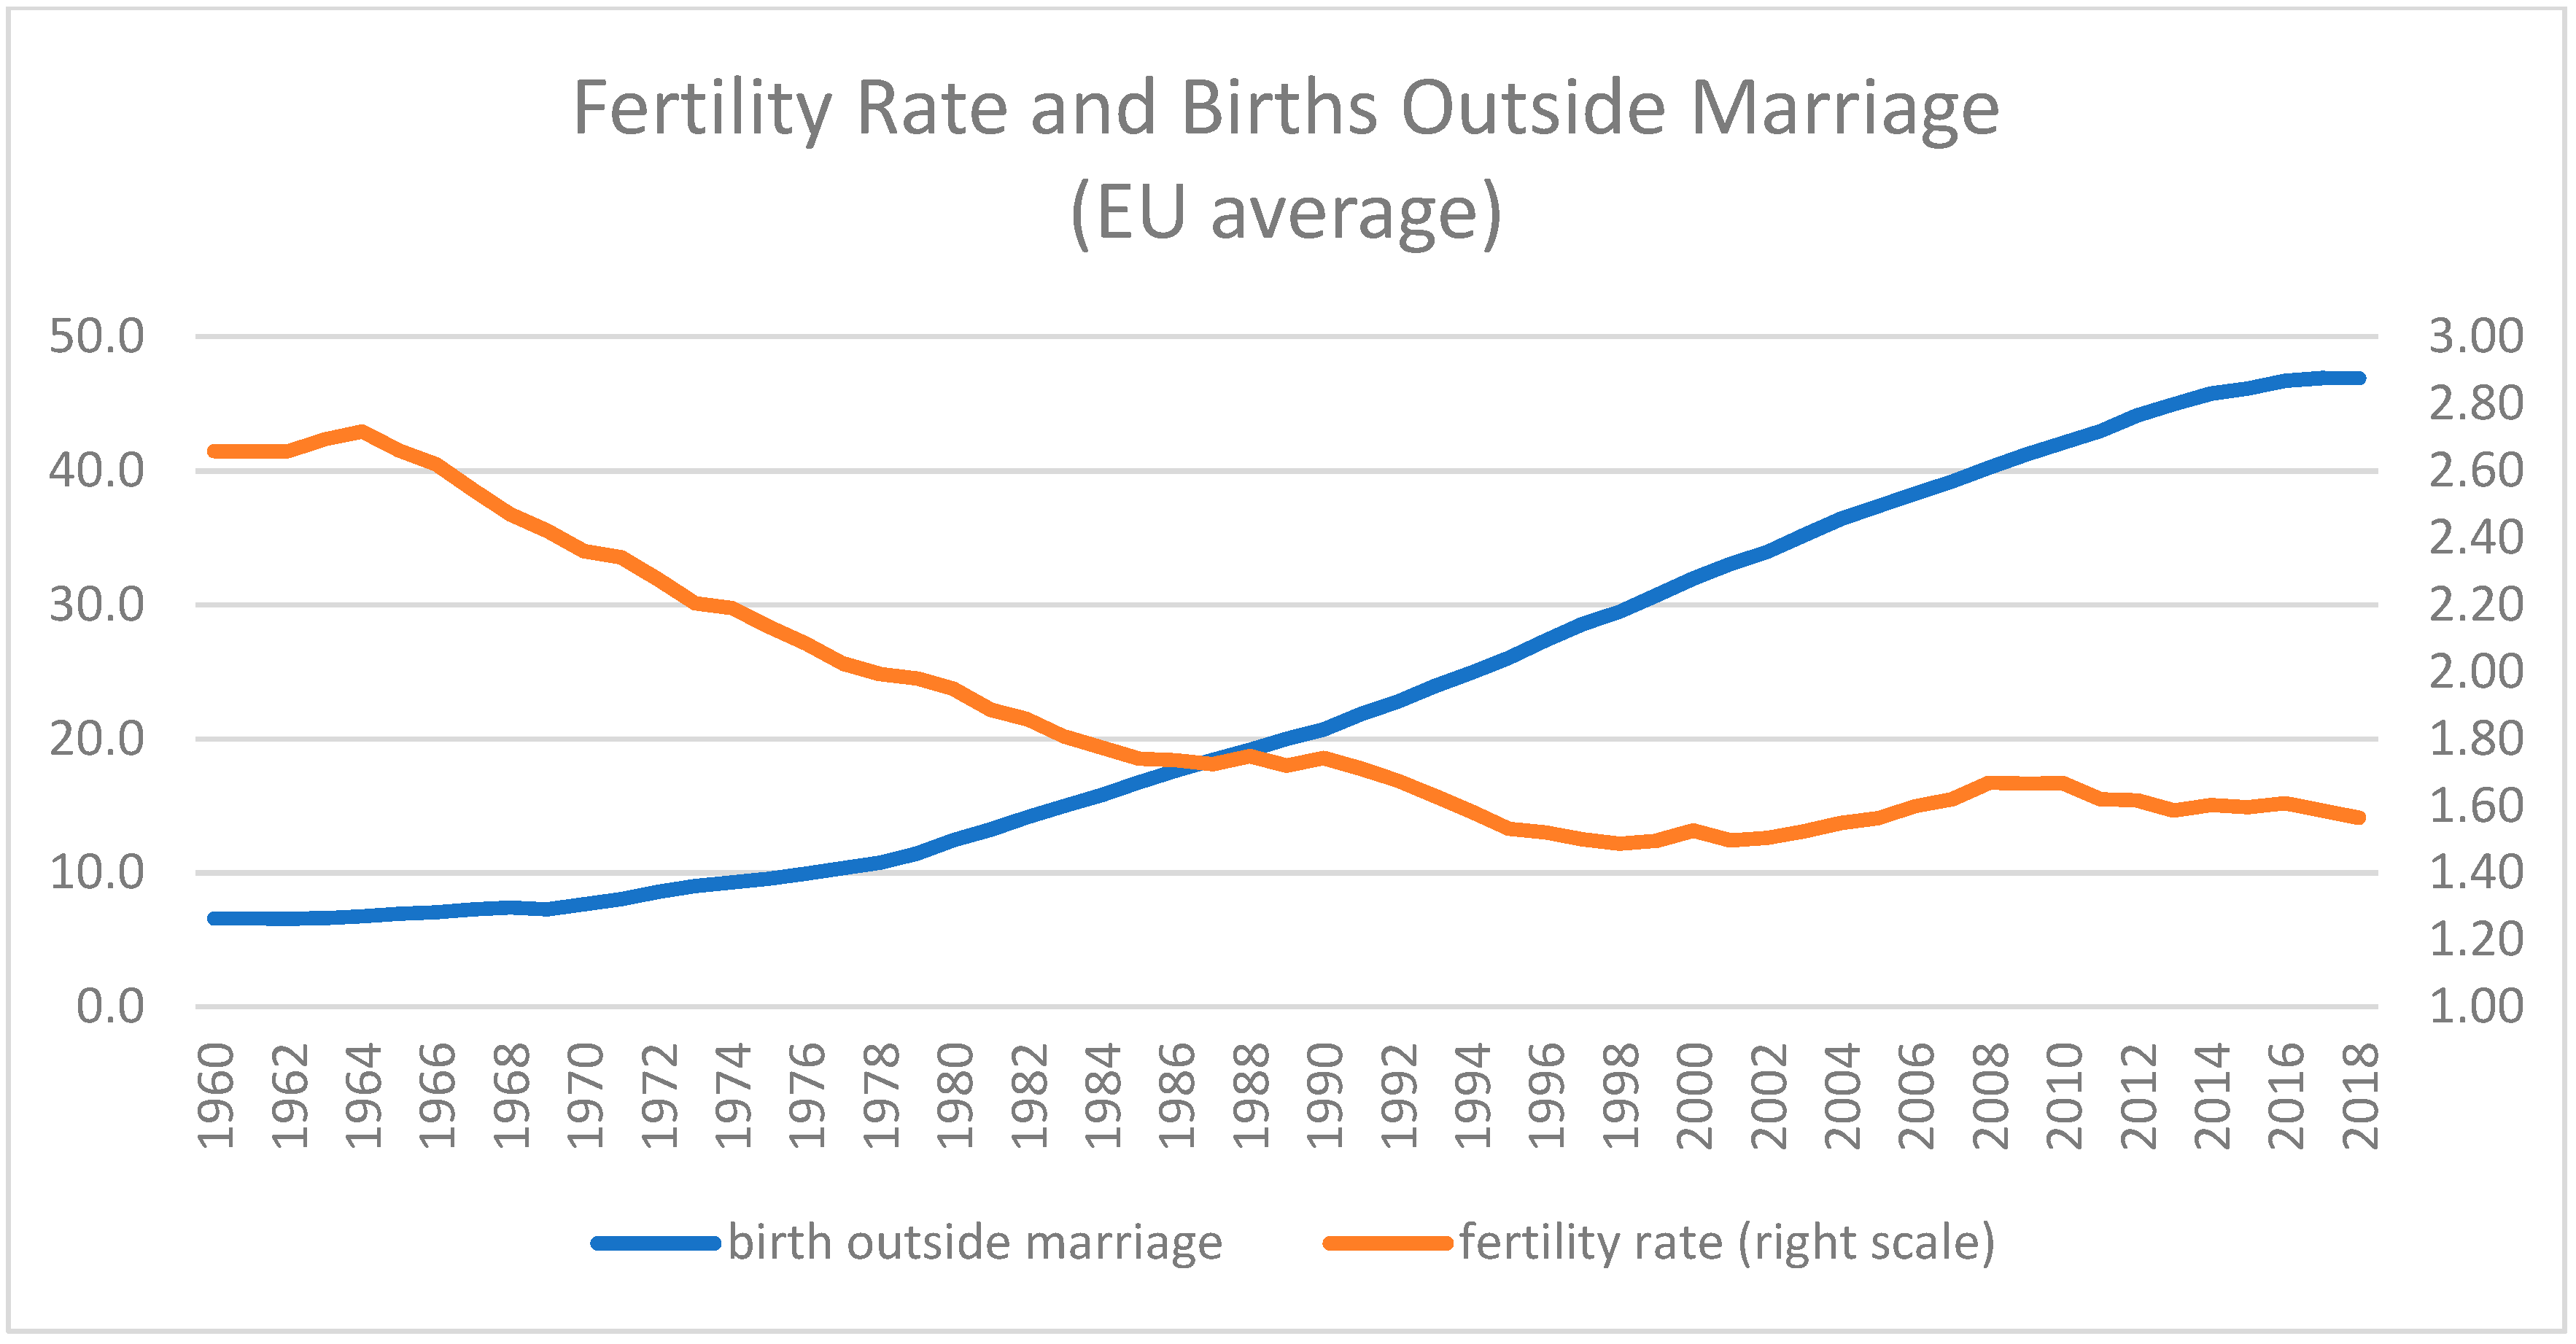
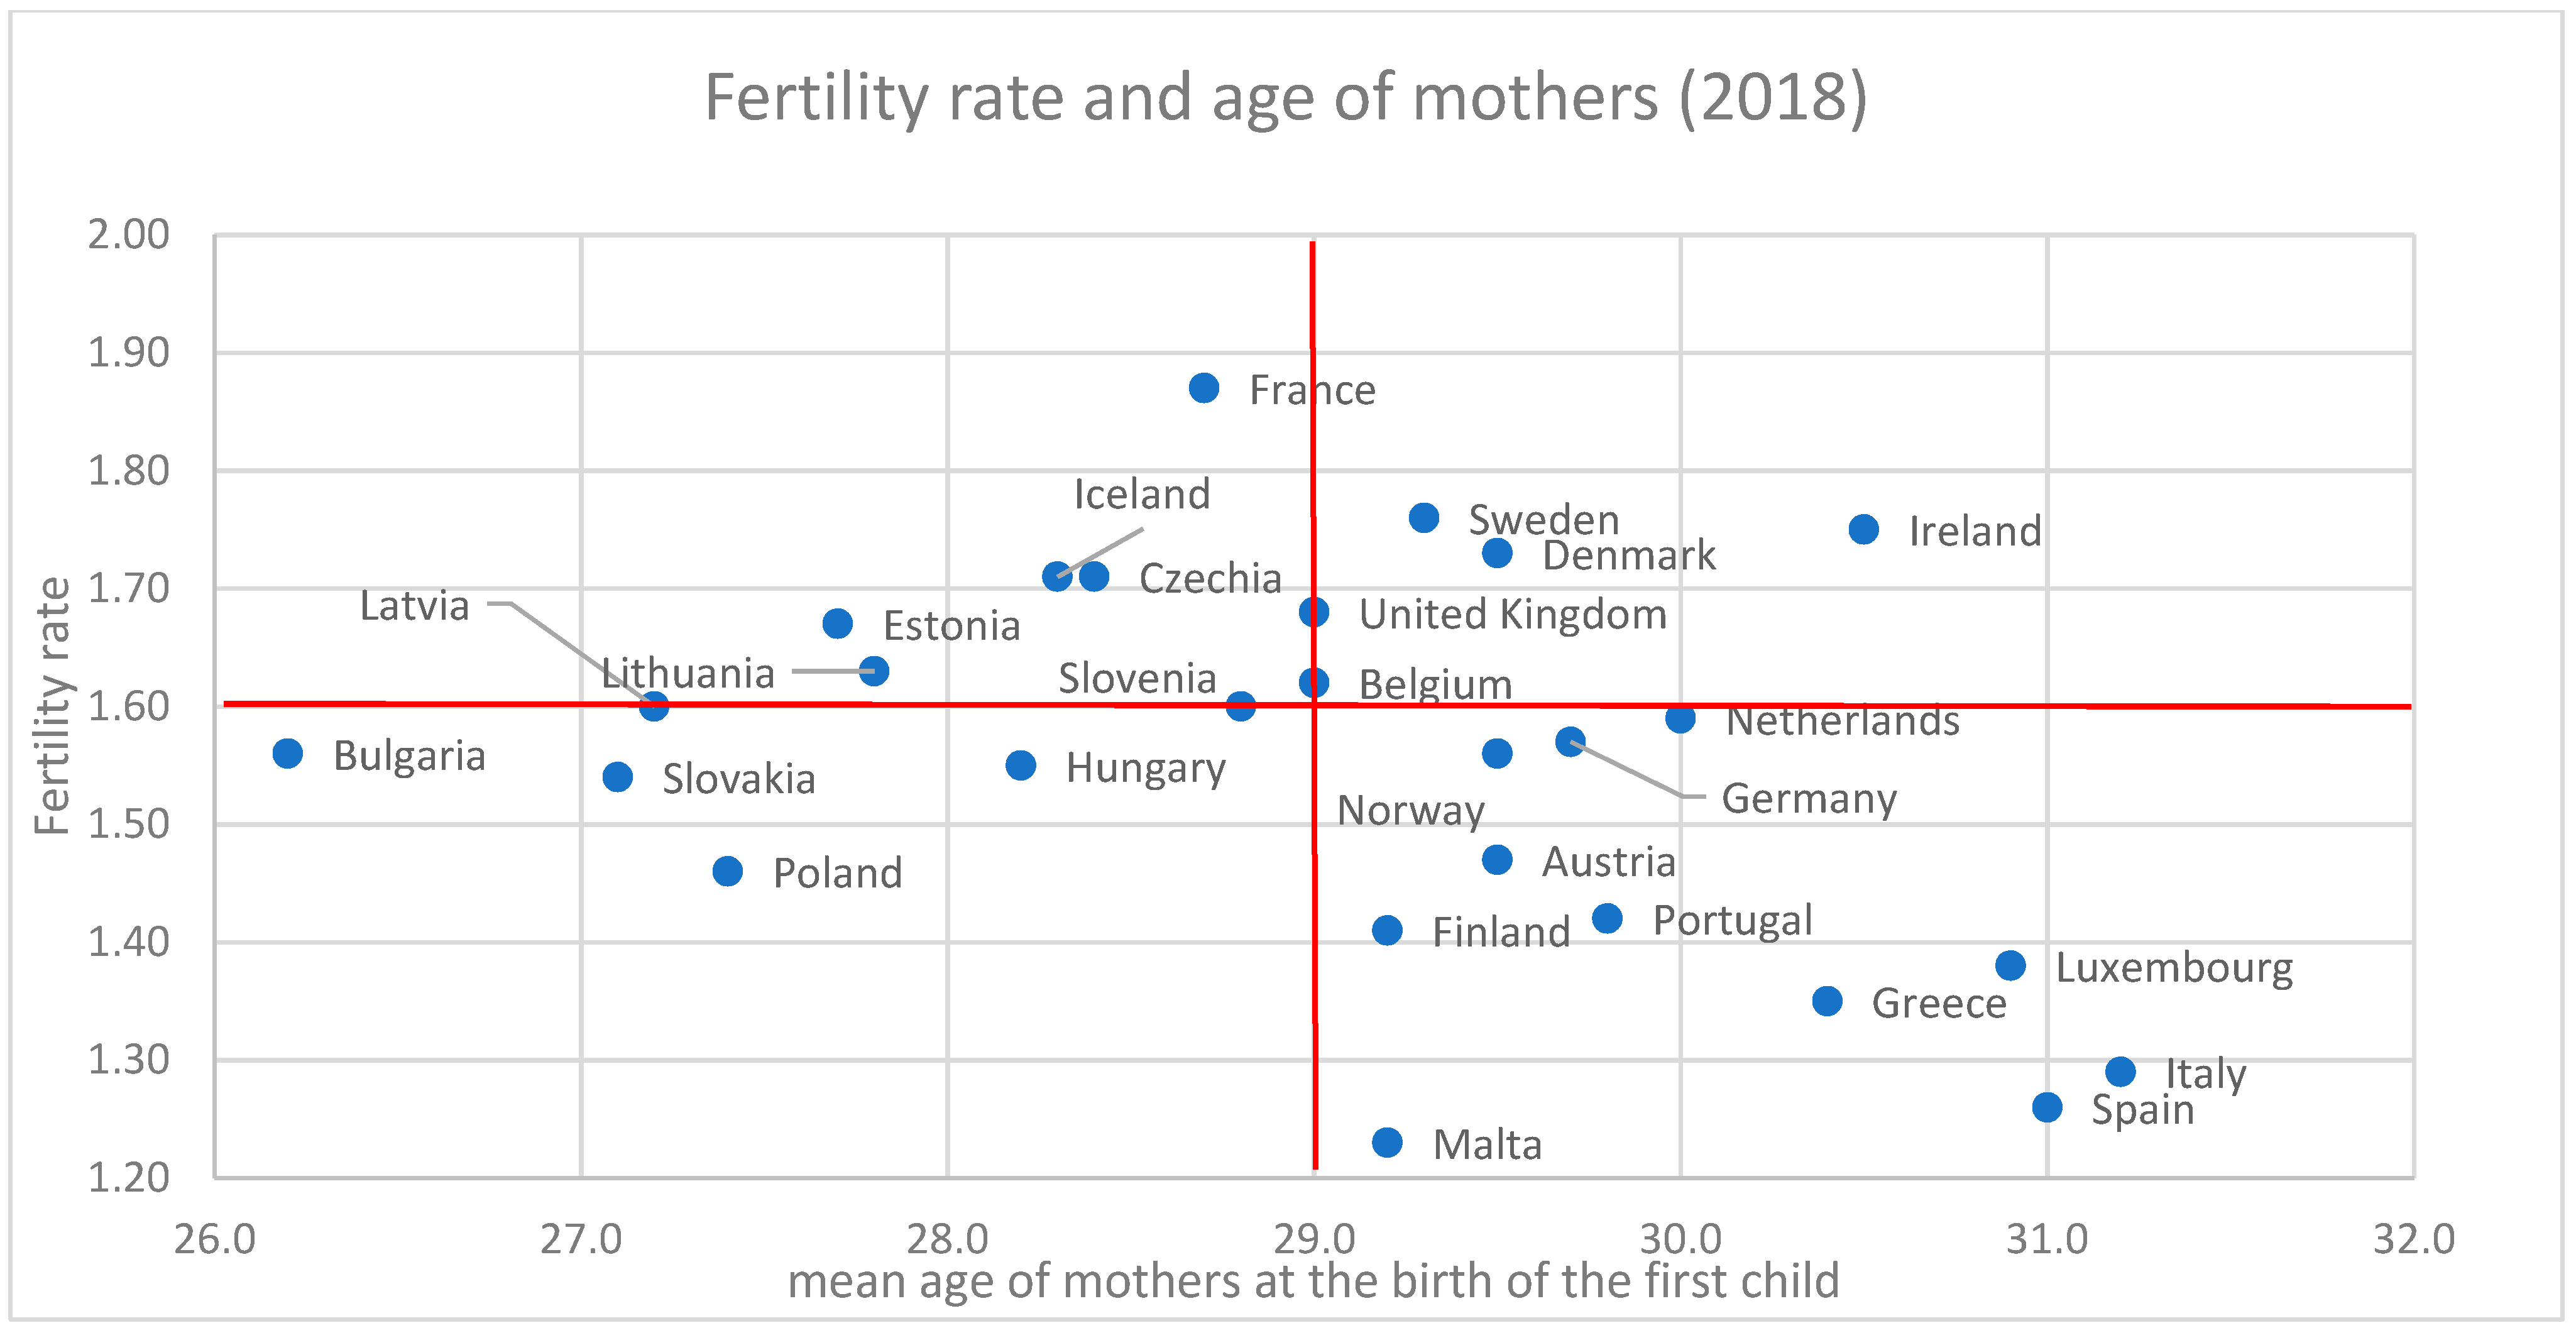
2.1. Social Changes in Europe

Over the last half century, the composition of families1 has varied considerably in European countries because of economic and sociocultural changes affecting individuals’ choices about marriage, childbearing, living arrangements and employment status.
In addition to the traditional family, consisting of two parents with children, that characterized the immediate post-war period and the so-called ‘thirty glorious years’, other family structures have developed.
A first immediate and generalized piece of empirical evidence is a reduction in the size of households. Over the period 2005–2019, household size decreased, on average, by 7% among European countries, with higher reduction rates in Southern and Eastern countries (−17.24% in Bulgaria, −14.28% in Slovenia, −11.54% in Latvia and size’s reduction rates greater than 10% in Portugal, Spain and Cyprus). In 2019, the average number of members of European families was greater than 2.5 only in Ireland (2.6), Greece (2.6), Cyprus (2.7), Poland (2.8) and the Slovak Republic (2.9).
However, the smaller household size only captures the quantitative variation that occurred over time, but not the qualitative variation in the household’s structure. The latter depends on complex socioeconomic interactions that can deliver to different types of households of the same size.
The increased social and economic independence of women has led to an increasing disconnection of the decisions about work, marriage and childbearing (Schoen et al. 2007). As a consequence, a decline in the marriage rate—due to both the choice of cohabitation and the choice of remaining single—has been consolidated over time.
Since 1960, the crude marriage rate (that is, the ratio of the number of marriages during the year to the average population in that year; the value is expressed per 1000 persons) in Europe has fallen, on average, by around 40% (from 8 per 1000 persons in 1960 to 4.9 in 2018). In addition, with the consolidation of the legal institution of divorce, the crude divorce rate (that is, the ratio of the number of divorces during the year to the average population in that year; the value is expressed per 1000 persons) has doubled, increasing from 1 per 1000 persons in 1960 to 2 in 2018, with a peak of 2.3 in 2006–2007 (Figure 1). The time series 1965–2018 only refers to countries with a divorce law in their legal system from 1965. As a consequence, Italy, Ireland and Spain are not included. Note that in the figures involving time series, only the countries with complete time series are considered. Therefore, the average values refer to the countries in the sample.
However, the extent and the trend of these social phenomena are characterized by a certain degree of heterogeneity across European countries. In 2018, the highest crude divorce rates were recorded in Latvia and Lithuania (both 3.1 divorces per 1000 persons), followed by Denmark (2.6) and Sweden (2.5). By contrast, the same indicator was 0.7 (per 1000 persons) for Malta and 1.1 for Slovenia.
Marriage rates also present differences among countries. In 2019 the highest number of marriages relative to the population was in Cyprus (8.9 marriages per 1000 inhabitants), followed by Lithuania (with a marriage rate for 1000 persons equal to 7), Latvia and Hungary (for both countries the marriage rate was 6.7). Looking at the macroarea data (Figure 2), we can note a generalized decrease in marriages with a reduction in the crude marriage rate of over 40% in all areas except the Nordic cluster (−23%).
The divorce trend is less uniform, probably due to the different timing of the introduction of the divorce law in the national legal systems. The largest increase characterizes the Southern countries where—in the period 1975–2018—the divorce rate has increased by more than 600%. This evidence is probably due to the recent introduction of the divorce law in some countries. In Italy, divorce was legally recognized in 1970, while it was introduced in Spain in 1932, then abolished and finally reintroduced in 1981. Over the last 40 years (from 1981 to 2018), the legalization of divorce has led to an increase in the divorce rate of more 500% in Spain and Italy.
In most countries, changes in the marriage rate are also associated with a growing trend towards cohabitation. Both aspects can be elements—though not the only ones—influencing childbearing.
The total fertility rate (that is, the average number of children born per woman) is fallen, on average, by over 40% from 1960 to 2018 (Figure 3) with decreasing rates greater than 50% in Iceland, Ireland, Spain, Portugal and smaller reductions in Eastern countries (Czech Republic, Hungary, Latvia) and Sweden.
The decreasing trend of the fertility rate has been accompanied by an increasing trend of the number of births outside marriage, which accounted for less than 10% (6.6%) of births in 1960 and nearly 50% (46.9%) in 2018. In addition, births data show that in most European countries, the number of first births increased from 1980 to 2018, while the number of births after the first one decreased, with particular reference to the third or higher birth order (Table 1). Exceptions are represented by the Nordic countries and the Eastern European countries, albeit for different reasons. Northern Europe is characterized by a generous welfare system supporting families with children through an extensive service supply, better allowing the reconciliation of work–family. Eastern Europe is characterized by younger mothers on average at first birth, and this may explain the higher or close to average fertility rate (1.6) in that cluster of countries (Figure 4). Only France and Iceland are similar to the Eastern countries, with a mean age of mothers at first birth smaller than average (29 years) and a fertility rate higher than average. Mediterranean countries are all characterized by a low fertility and a high mother’s age at first birth.

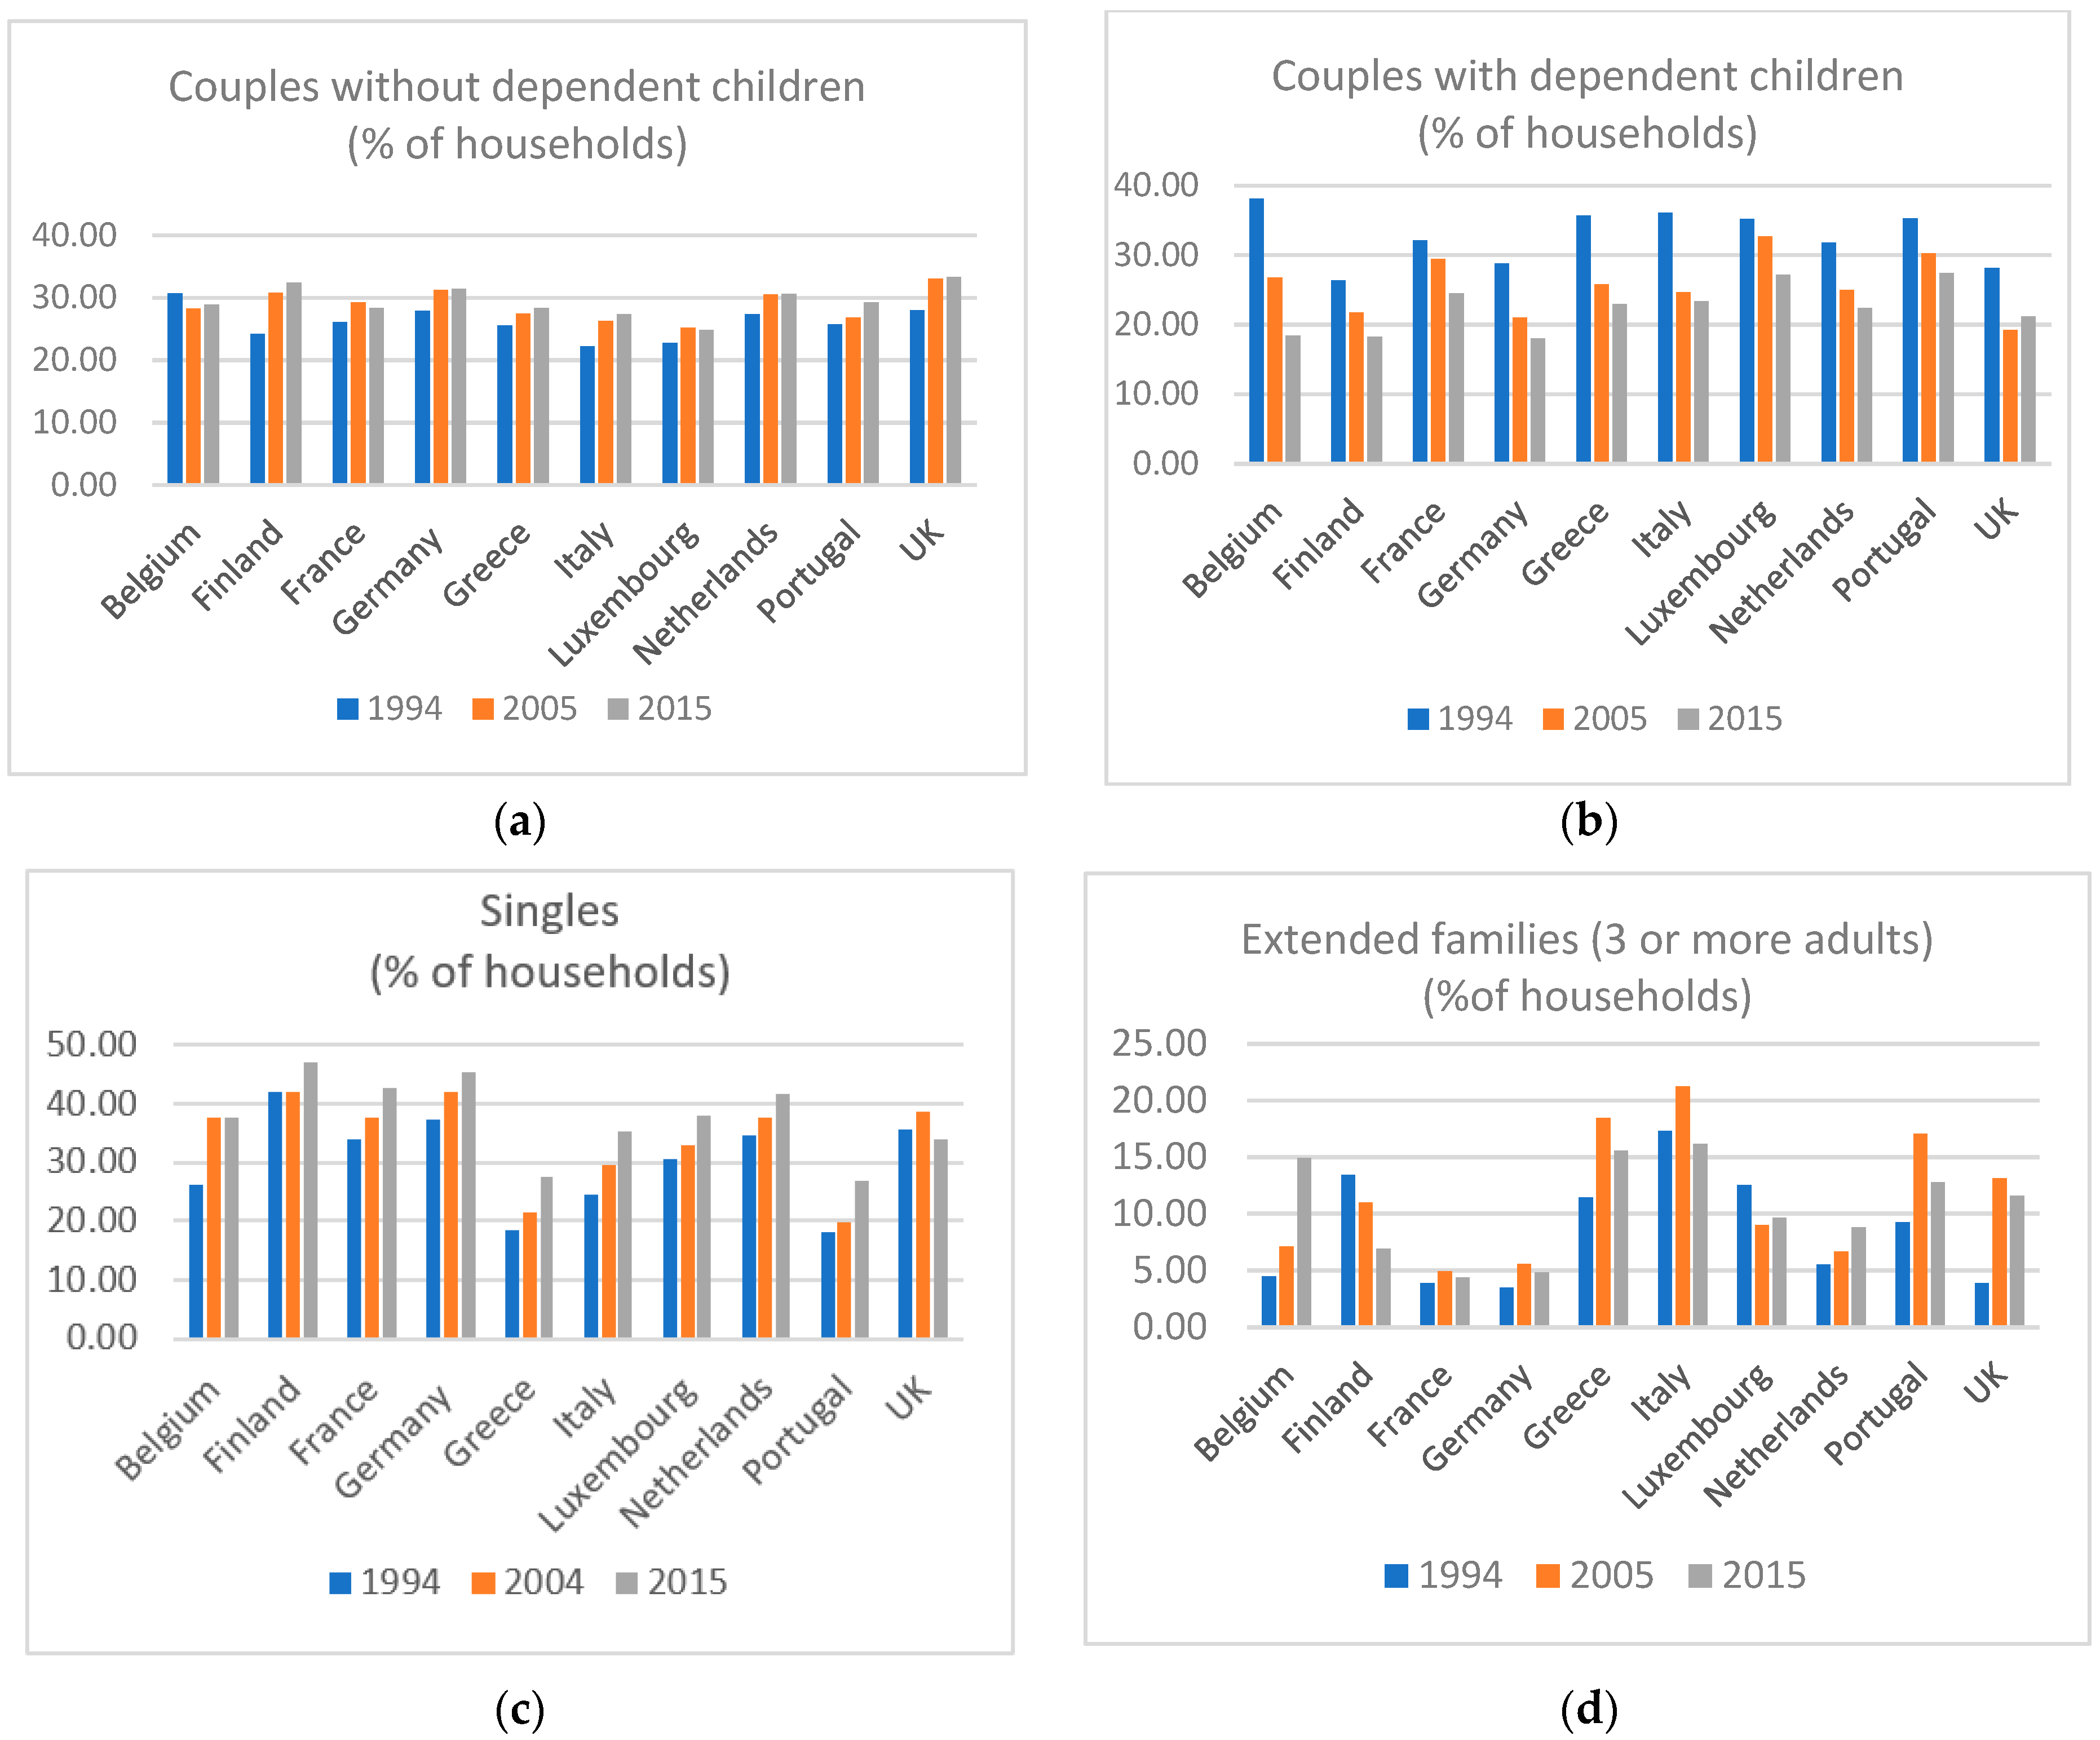
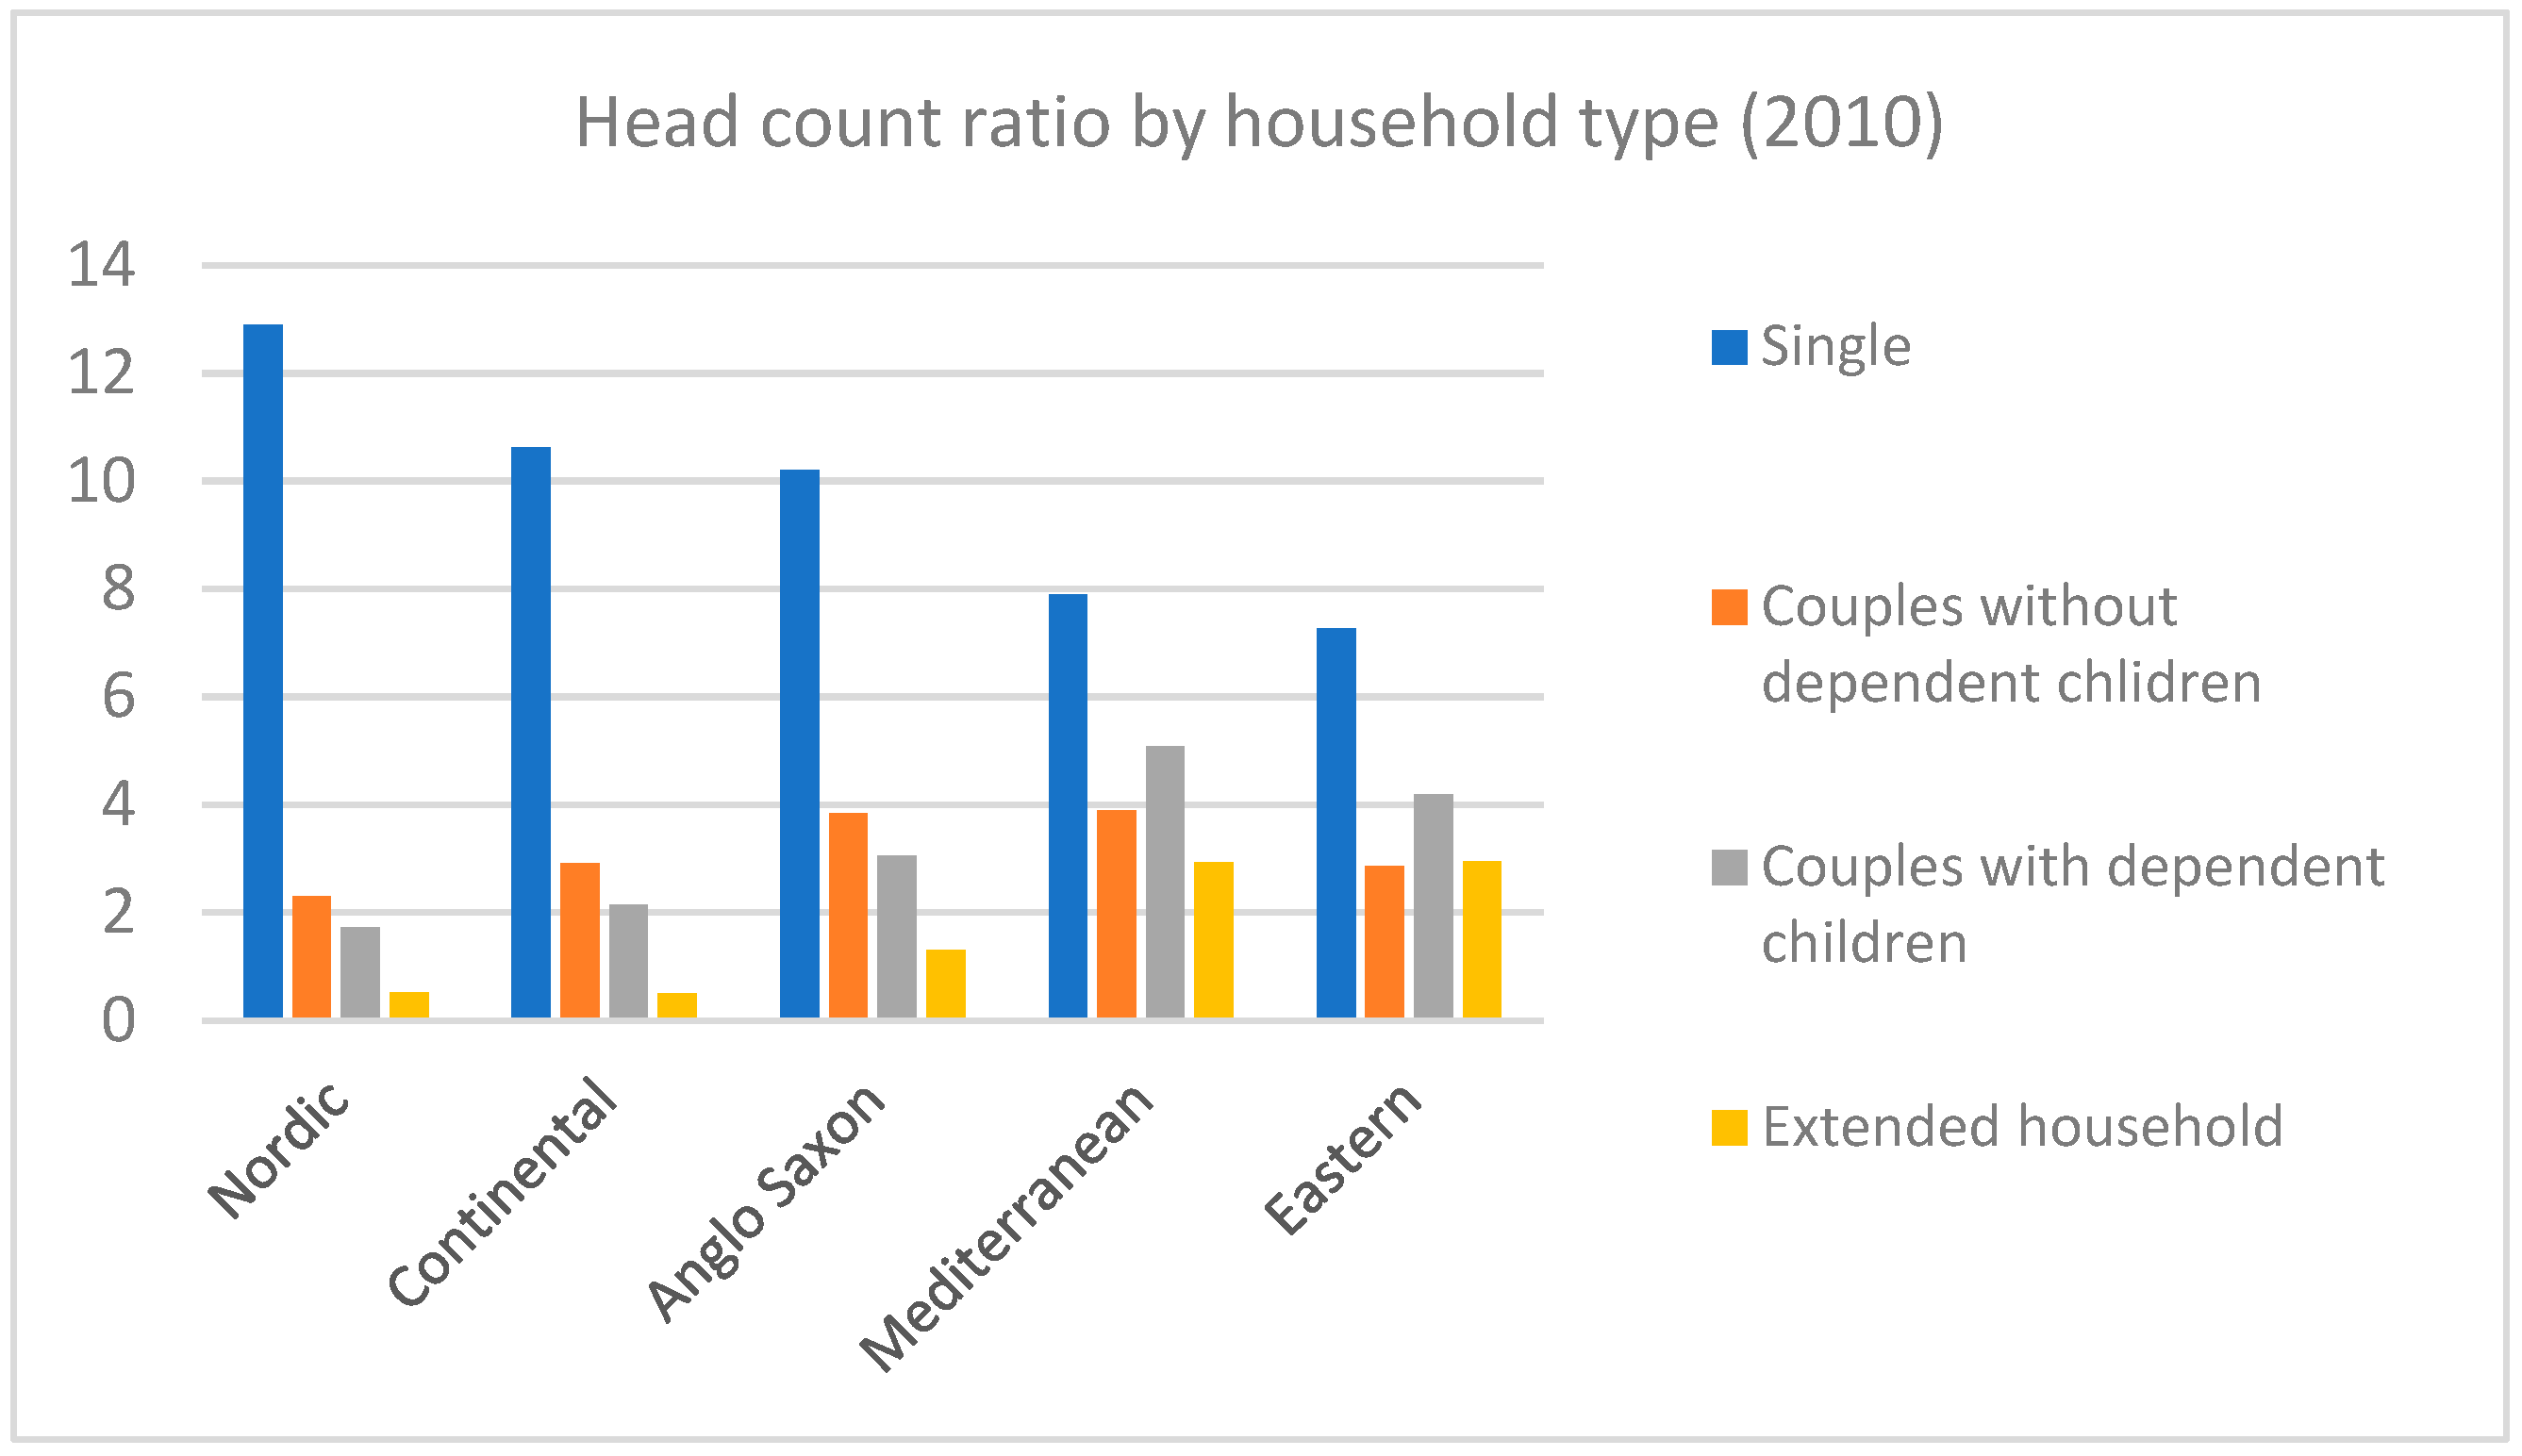
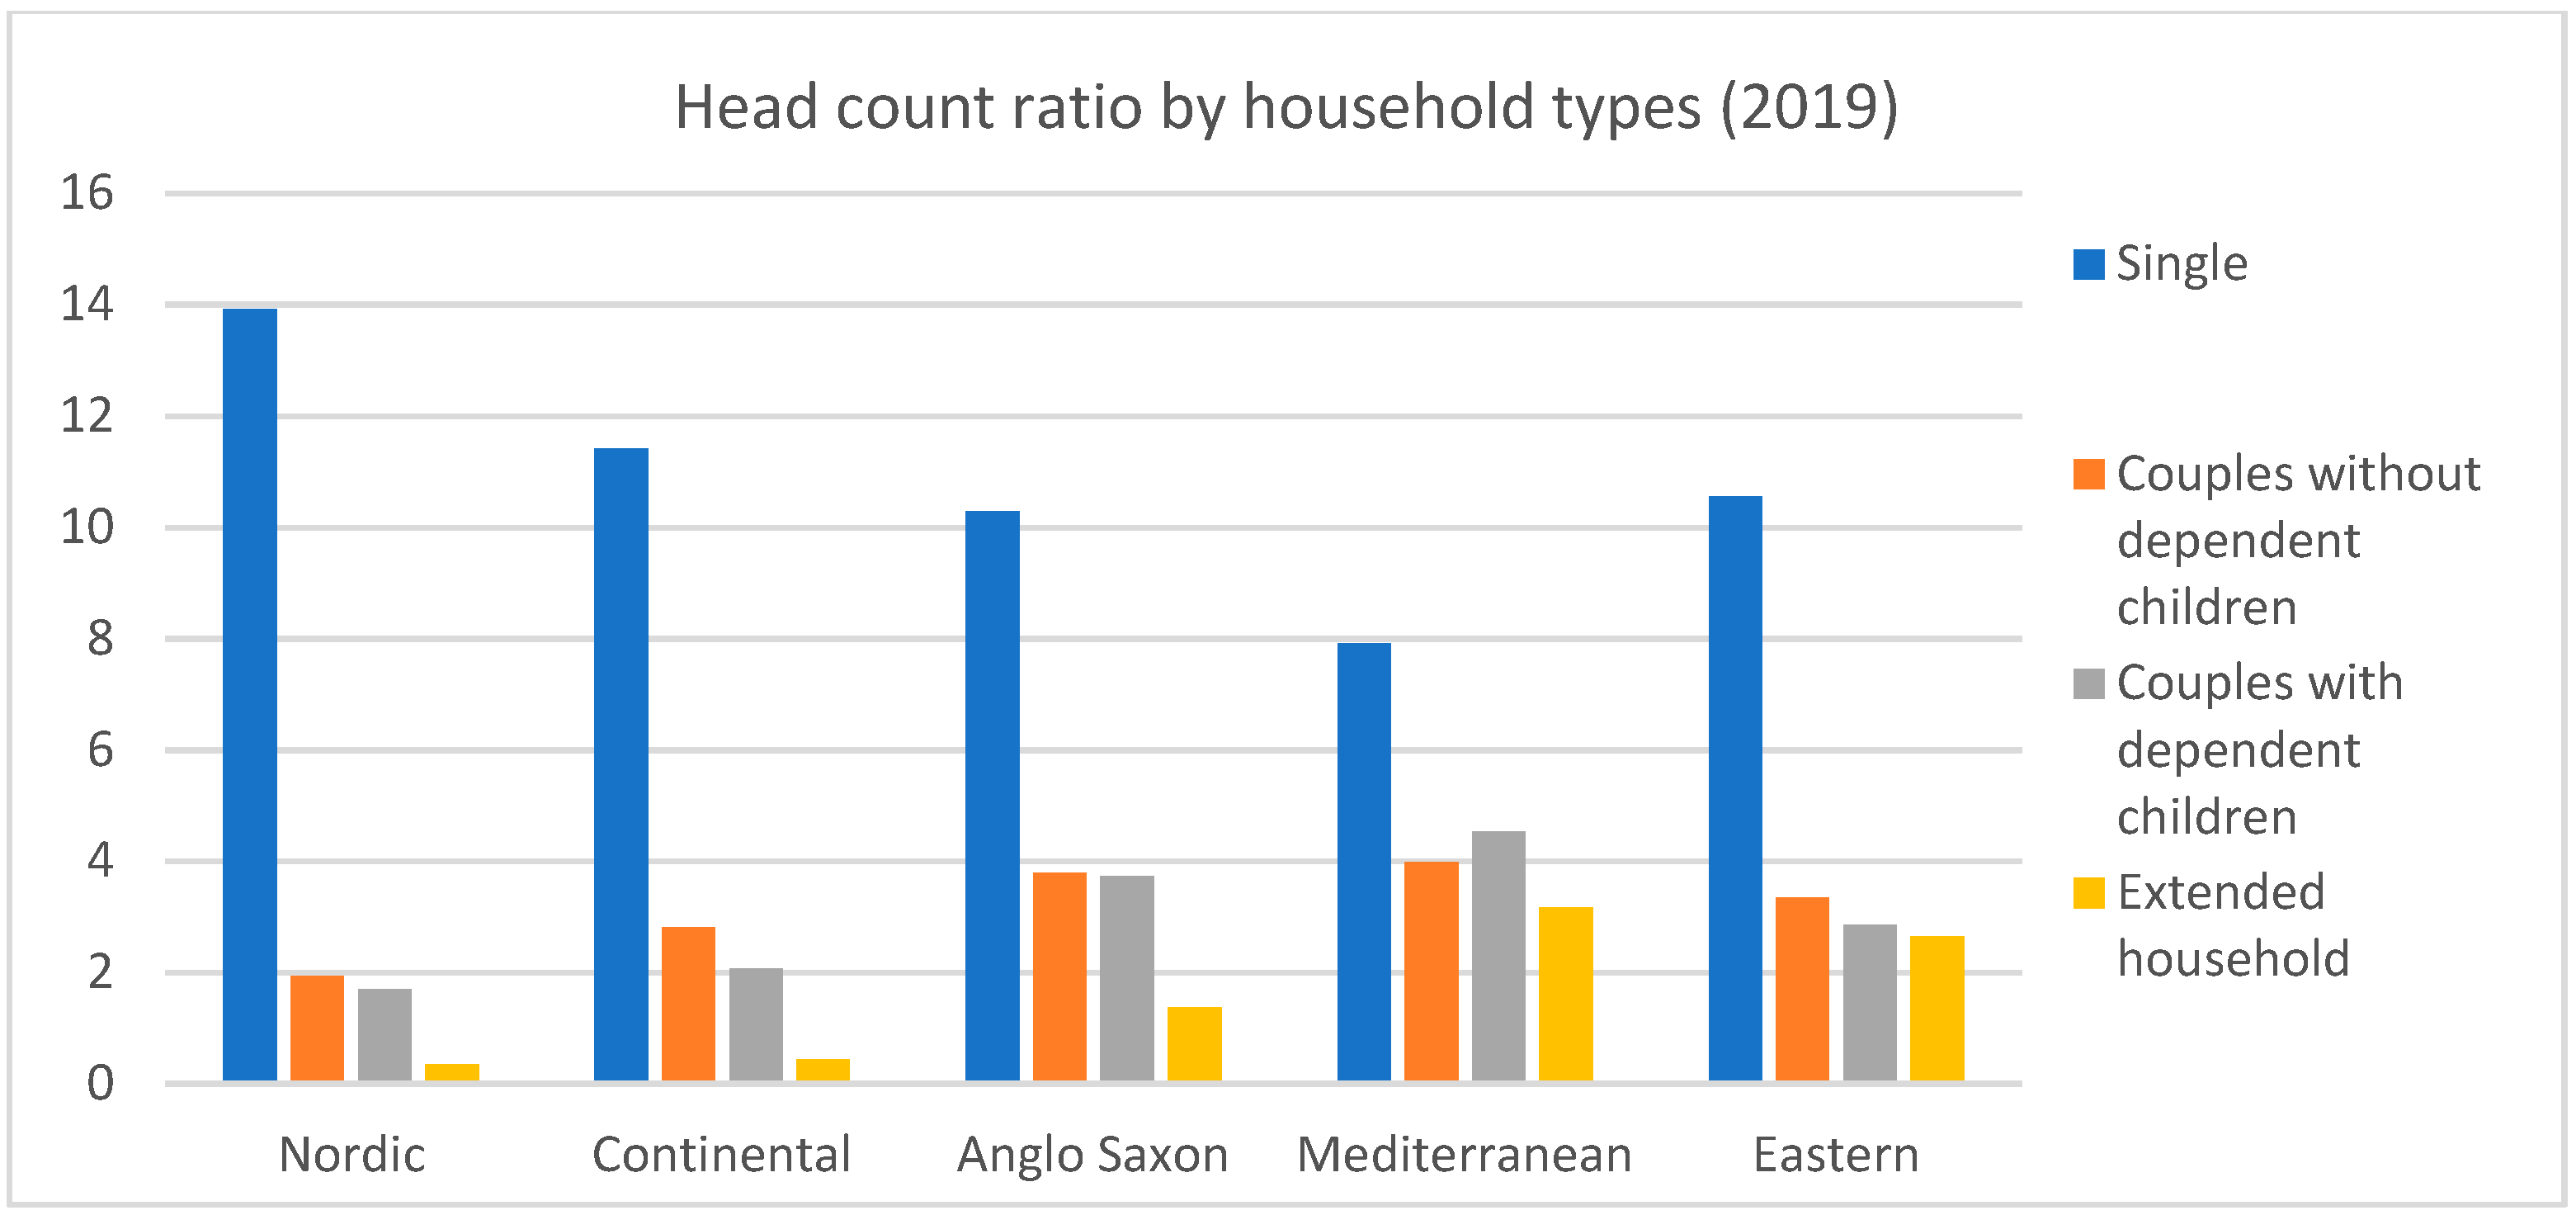
2.2. Trend in Household’s Structure and Poverty

Changes in the sociocultural framework of the last decades have affected the structure of European households2. The effects have been more or less pronounced in the various countries, but there are common trends.
In 2019, the number of childless households is at least twice the number of households with children in most countries, with the exception of Ireland, Portugal and some Eastern European countries (Poland, Slovenia, Slovak Republic). In all countries, the most common type of family is the childless single person—with a greater diffusion in the Nordic countries—followed by the couple with dependent children3; couples with one or two children prevail in all countries over couples with three or more children (Table A1 in Appendix A).
The “extended family model” characterized by the presence of three or more adults—probably including older people—is more common in Mediterranean and Eastern countries, while it accounts for a low percentage of families in Northern Europe. This reflects a lower degree of defamilization of the Southern and Eastern European social systems (Esping Andersen 1990) as well as a stronger weight of parental networks within the family. Esping Andersen defines “defamilization” as the independency degree of an individual to his or her parental support and family life, whatever is the market performance. Therefore, low defamilization means a solid and stable dependency of an individual to his/her parental (family) support.
The framework outlined for 2019 is, however, the result of changes over time (Figure 5a–d). Analyzing the last 20 years and a group of countries for which we have complete data, we note a generalized decrease in the traditional family, composed by a couple with children, and a generalized increase of single families (including single without children and single parents).
Smaller variations occur for childless couples, while a less uniform trend characterizes the evolution of the extended household in aggregate terms, i.e., including households with and without dependent children.
Looking at the correlation between household structure and poverty, the analysis becomes more complex. In general, poverty reflects insufficient resources to needs affecting the wellbeing of individuals. While the economic variables can affect the individual choices about living arrangements, at the same time, living arrangements have an impact on the incomes and the economic wellbeing of individuals. Individuals with fewer resources—such as young people and some elderly categories—are likely to stay in larger households (Aassve et al. 2007). Young adults can choose to delay marriage if their economic position is not stable enough to guarantee autosufficiency, while young couples can decide not to have children for the same reasons.
Changing perspective, we can also point out that the household’s structure affects the income levels of its components. Households that include couples are less likely to be poor because the second adult—on average—adds more to potential income than to consumption, given the economies of scale stemming from cohabitation (Atkinson 1992; Cancian and Reed 2008). Therefore, on the one hand, the reduction in the family size due to the decline in marriages as well as to the increase of divorces may increase the vulnerability of individuals regarding poverty. On the other hand, the reduction of families’ size is also due to a reduction of fertility. In this case, the decreasing number of children can, ceteris paribus, reduce poverty. However, empirical analyses show that, while the total fertility rate decline tends to reduce poverty (all else equal), the growth of children born outside marriage can have the opposite effect (Cancian and Reed 2008; Cancian and Haskins 2014).
Another element to be considered is the role of public policies for families. Welfare benefits generally represent a source of income, and they are typically addressed to households rather than individuals and, in particular, to households with dependent children as in-kind services (for example childcare) supporting work-family reconciliation and cash benefits in the form of tax deductions and allowances for dependent children. In the next section, we illustrate the indicators for household structure, poverty and family policies and sketch the empirical relationship between them.

3. Methods and Results

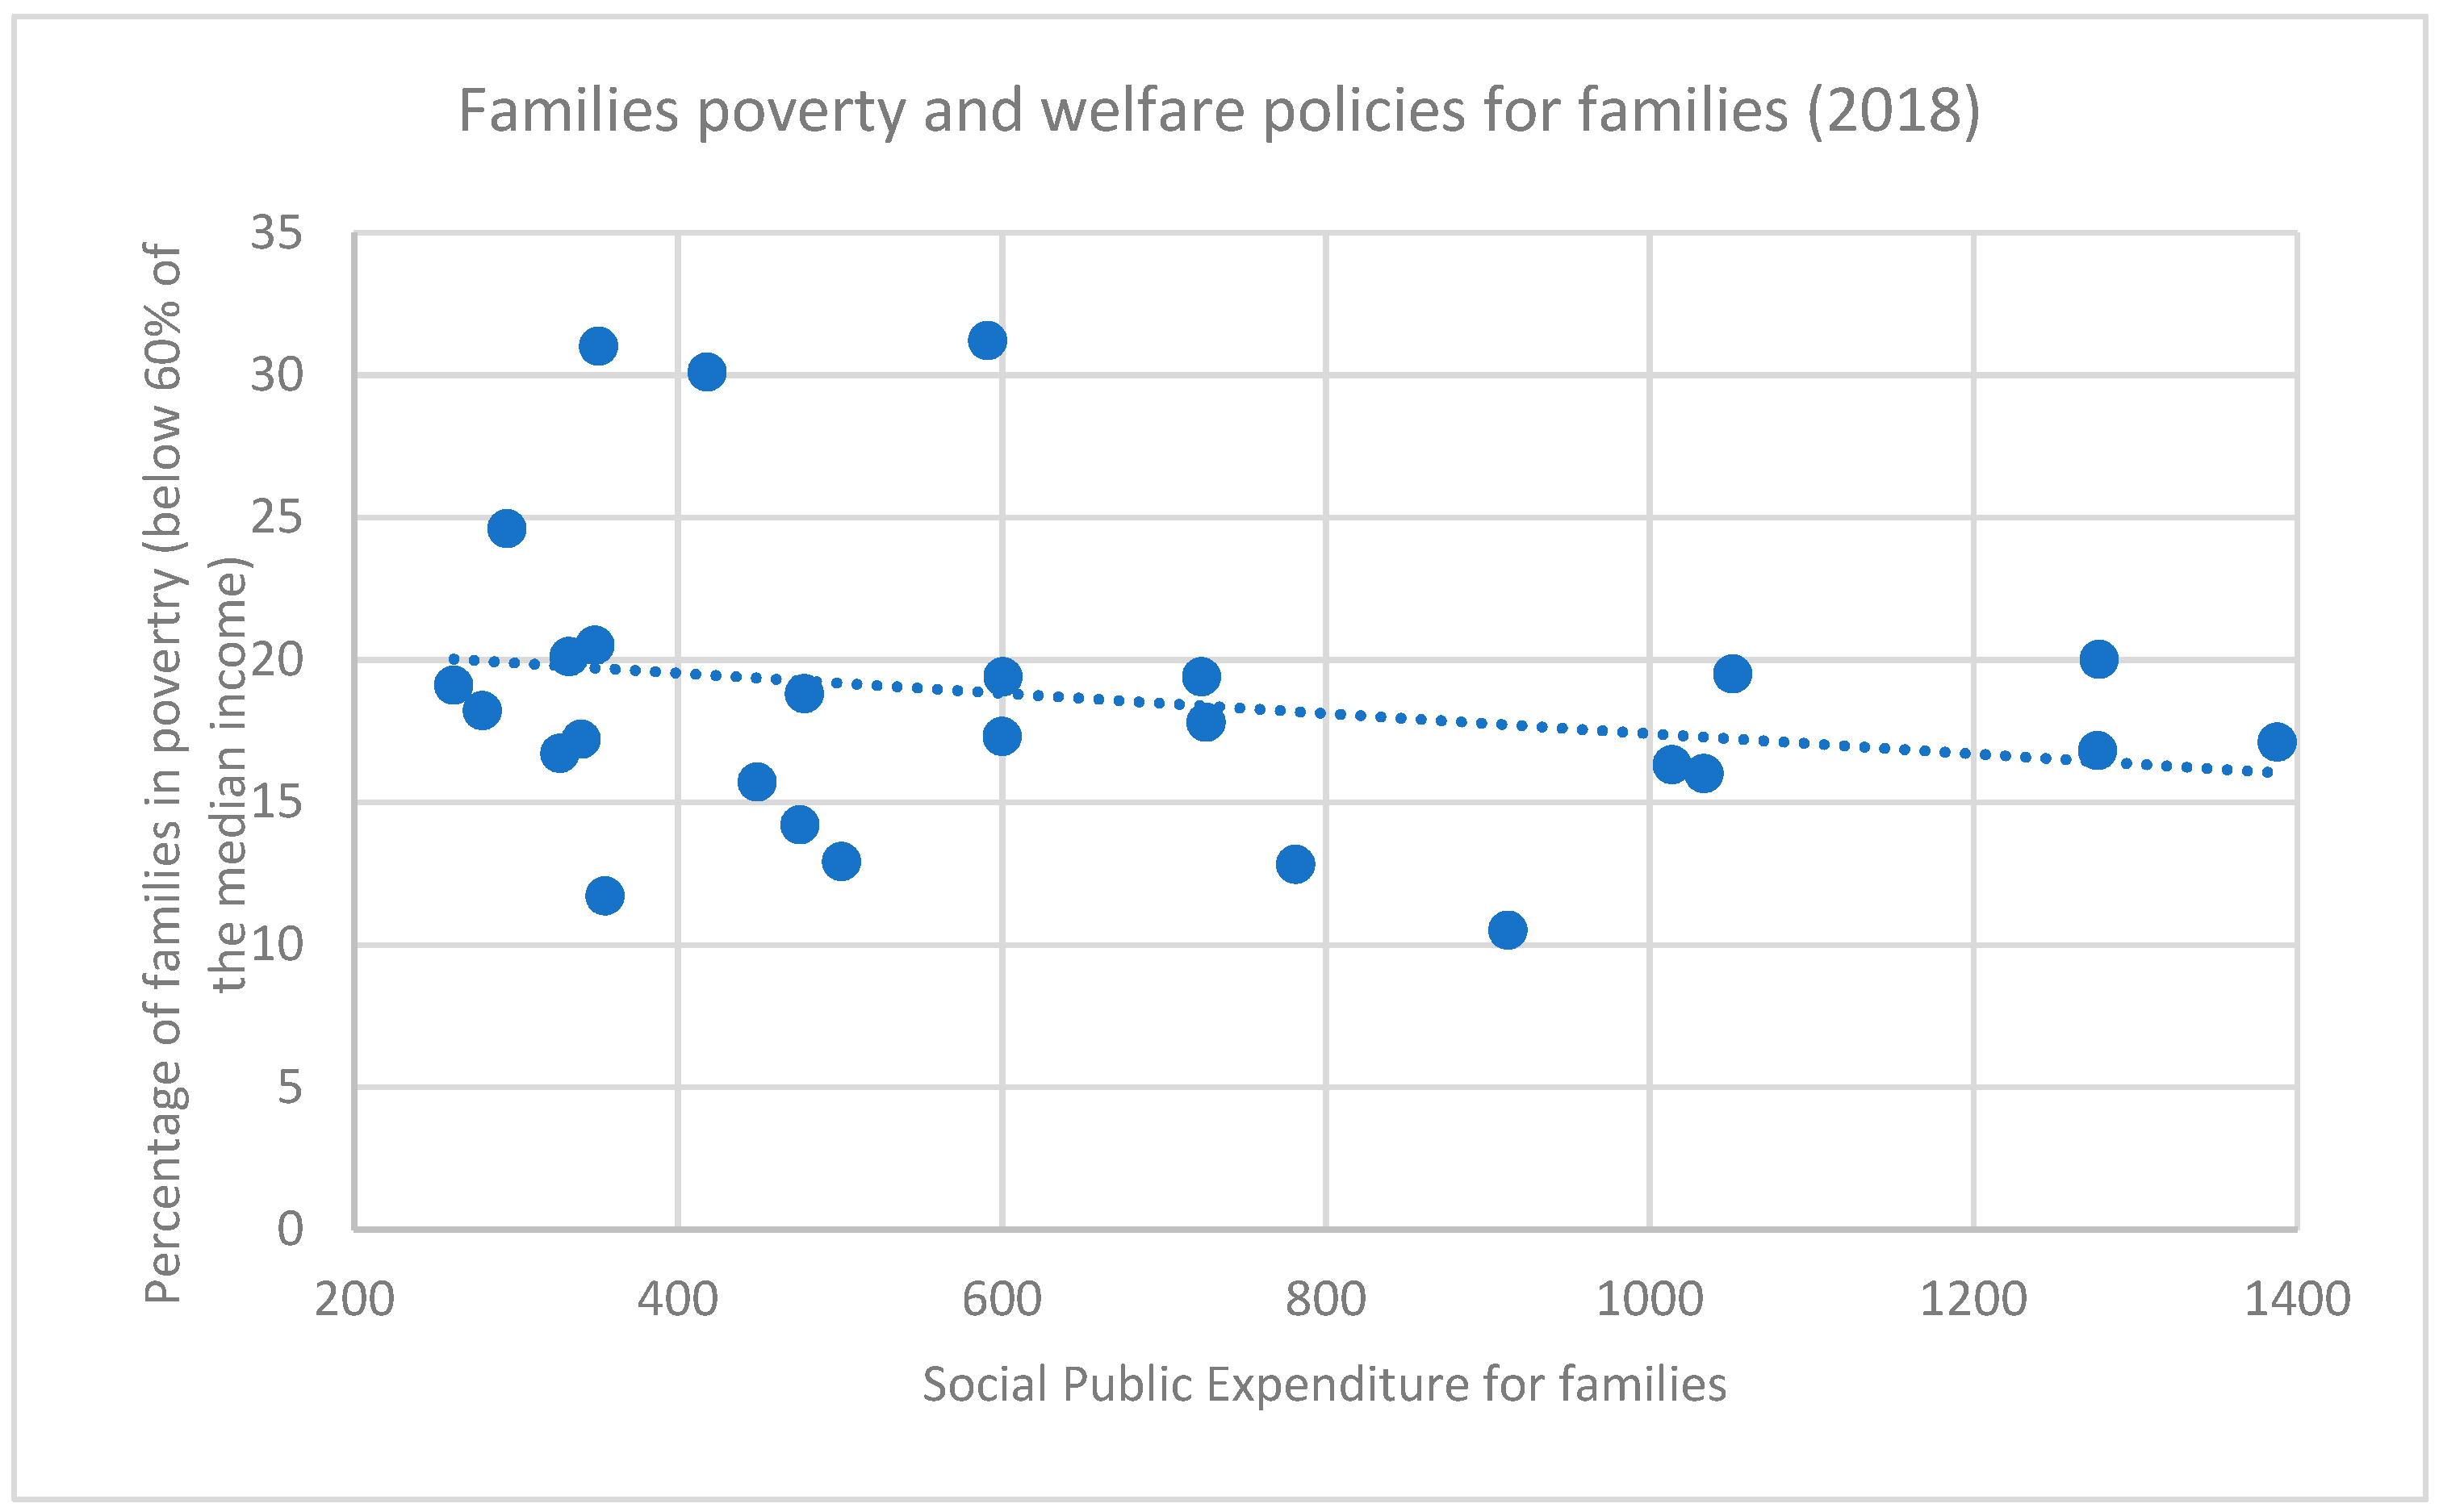
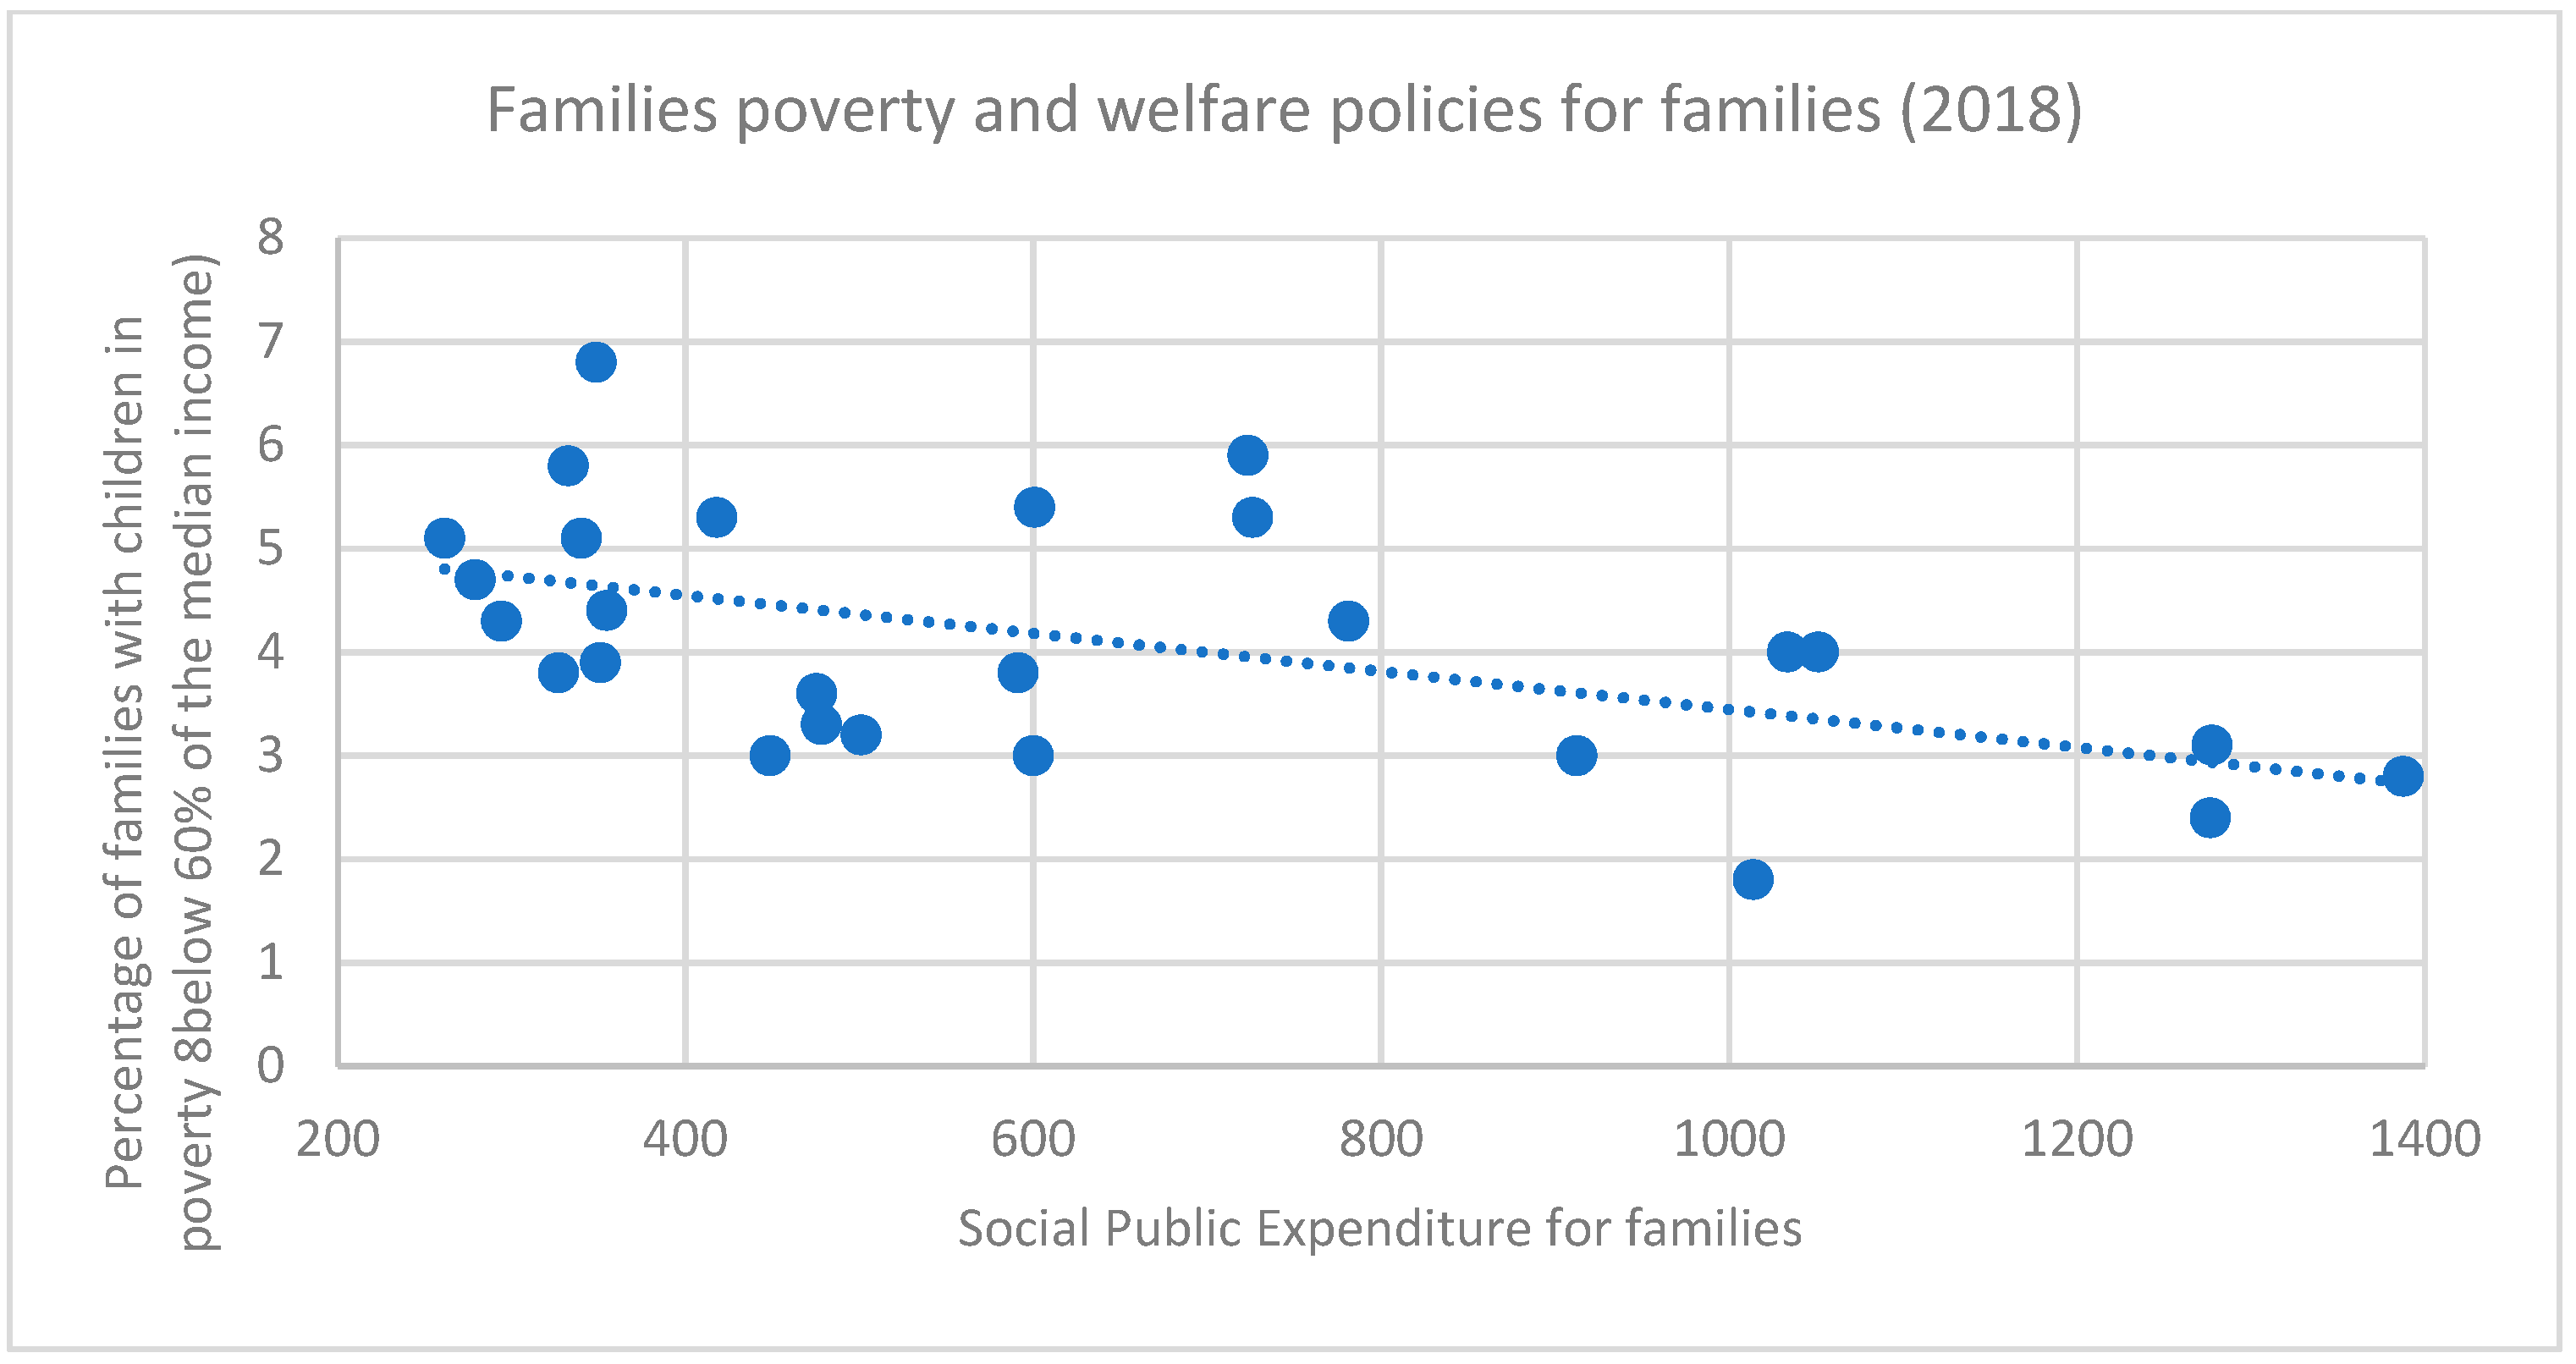
3.1. Poverty and Families

To evaluate the poverty of families we use as indicators the Head Count Ratio defined as
HCR = q N
where N is the population size and q represents the number of poor individuals.
In the Eurostat database such indicator corresponds to the “at-risk-of-poverty-rate” (AROP), defined as the share of persons (or households) with an equivalized disposable income4 below the risk-of-poverty threshold, which is set at 60% of the national median equivalized disposable income (after social transfers).
Other poverty indicators are proposed by the economic literature. The income gap ratio is, for example, a measure of the extent of poverty and it is given by the average percentage difference between the poor’s income and the poverty threshold,
IGR = n = 1 q ( z y n ) / q z
with z equal to the poverty line and yn is the poor’s income.
By combining the previous poverty measures, Sen (1976) proposes a more general indicator of poverty (S) that also considers income inequality among the poor as measured by the Gini index calculated on the poor’ incomes:
S = HCR [IGR + (1 − IGR) GP]
From a strictly empirical point of view, statistical databases (Eurostat) contain other poverty indicators, often used by policy makers, such as “the severe material deprivation” (SMD), representing the percentage of individuals which cannot afford a basket of goods necessary to reach an adequate standard of living, and the “work intensity” (WI) of a household, given by the ratio between the worked months and the workable months in the reference year by the household members aged between 18 and 64 years5.
Following the economic literature on poverty and families, we choose the head count ratio as the poverty indicator for its simple and immediate interpretation and for its policy relevance (Mussida and Parisi 2020). Considering individuals and households as alternative statistical units, the analysis of poverty for the European macroarea (Table 2) shows that the aggregate percentage of individuals in poverty is in almost all cases smaller than the percentage of households in poverty in both 2010 and 2019.
Poverty is basically concentrated in the smallest household type, the single-person household, and, to a lesser extent, in the single-parent household. More traditional households, as couples with and without children, are less vulnerable to the risk of poverty. The disaggregated analysis for household type confirms this phenomenon for all European macroarea even when considering a time interval of about 10 years (Figure 6 and Figure 7).
The higher concentration of poverty among single-person households is also related to the low impact of family-supporting public policies on single-person households. In most European countries, welfare policies for families are mainly addressed to families with children (couple or single-parent) that—ceteris paribus—are more vulnerable to the risk of income needs and material deprivation. Some economic analyses show the positive long run effects of public cash transfers to families with children in terms of children’s longevity, educational attainment, nutritional status, and income in adulthood (Butcher 2017; Aizer et al. 2016).
Single-person households are supported by general public policies to contrast poverty, that in some European welfare state—such as the Mediterranean and Eastern ones—are not very developed yet.
Basically there are three types of public support for families: child-related cash benefits, including child allowances, public payments during the periods of parental leave, and income support for sole parents families; in kind benefits regarding childcare and childhood assistance and education; fiscal support through tax exemptions (such as child cash benefits not included in the tax base), child tax allowances (in the form of deductions of the tax base) and child tax credit (in the form of tax cuts) (Penne et al. 2018). Figure 8 and Figure 9 show the relationship between total social public expenditure for families (cash and in-kind benefits) and the percentage of families in poverty, considering both the group of all families and the group of families with children. The relationships point out a stronger correlation between public policies for families and reduction of poverty for families with children.

3.2. Econometric Analysis: Method and Results

In this section we investigate the empirical relationship between living arrangements and poverty. In particular, we test whether the decline in the traditional family type (couple with children) and its displacement by single parent and extended family households is correlated with an increase in poverty.
We are aware that the relationship between living arrangements and poverty is not straightforward: living arrangements affect income, but income affects the choice of living arrangements; to partially overcome the problem, we use lagged values for family composition variables in the analysis; that is, we regress the 2019 poverty indicator against the 2018 values of the family composition indicators.
Our sample is composed by 28 European countries6. The dependent variable is the share of individuals at risk of poverty (AROP) in 2019 (Head Count Ratio, HCR, in our equation). We look at individual rather than at household poverty because of two main reasons. First, we believe that the individual dimension can provide a clearer picture of the extent of poverty because the share of individuals in poverty can significantly differ from the share of households in poverty, given the variability in the number of family components. The second reason stems from the fact that the decline of the couple is associated with a breaking-up of existing families (e.g., through divorces), which displays ‘external’ effects on the whole societies, especially through the increase in the number of households with nontraditional structure.
As for the independent variables, we consider both the socio-economic variables usually associated with individual poverty and variables related to the household structure:
  • Per capita GDP: several studies show that, as average income rises, the number of people in poverty decreases (for a recent empirical analysis, see Dollar et al. 2016); an alternative variable, highly correlated with GDP, is unemployment (Saunders 2002). We also consider female unemployment because of its role especially for single mother families (Cancian and Haskins 2014). The level of per capita GDP is also highly correlated with social expenditure—social public expenditures for families included—which affects individual poverty through its effects on household poverty.
  • The Gini index, that summarizes the concentration of income: not only the level of average income, but also the concentration of GDP affects poverty (Karagiannaki 2017). The relationship found in the literature is a negative one. In our analysis, we use the Gini index of disposable income.
  • The female unemployment rate.
  • Social cash and in-kind benefits for families.
  • Education attainments are believed and found to be inversely correlated to poverty (Barham et al. 1995; Hofmarcher 2019). We use the share of people with at least a secondary education degree.
  • In addition to the socioeconomic variables used to explain individual poverty, we use variables related to the household structure, as usually implemented when analyzing poverty at the family level (see Table A2).
Our regression equation is the following:
HCRi = β0 + β1Xi + β2Zi + εi, i = 1, …, 28
where Xi is the vector of socioeconomic variables, Zi is the vector of family composition variables and εi is the error term (28 is the number of countries under observation).
We estimate Equation (1) by means of the weighted least squares approach to mitigate the heteroscedasticity problems that usually affect cross-section data. We use the Gretl statistical software.
Table 3 reports the results of our estimates. In Models 1–3, we consider the relationship between individual poverty and some socioeconomic variables; in Models 4–6 we add variables relating to family composition among the regressors.
In Model 1 the regressors are per capita GDP, the Gini index of disposable income and the education level (share of population with secondary school degree). The results show, as expected, a negative correlation with average income and the education level and a positive correlation with inequality in the distribution of income: in particular, an increase of 1 percentage point in the Gini index increases the HCR poverty indicator by 0.72, while an increase of 1 percentage point in the share of people with secondary education decreases the HCR poverty indicator by 0.064.
Analogous results are obtained substituting per capita GDP with social public expenditure for families (Model 2) and female unemployment (Model 3)7.
We then turn to considering the role of family structure on individual poverty. The existing literature agrees on considering families with children more vulnerable to poverty (Bradbury and Jäntti 1999; Iacovou 2013; Butcher 2017; Aizer et al. 2016; Monti et al. 2015). Moreover, the break-up of the “couple” is considered a factor exposing the household to economic vulnerability, the decrease in the marriage rate and the increase in the divorce rate being associated with an increase in poverty (Cancian and Reed 2008; Cancian and Haskins 2014; Mackay 2005). Therefore, we concentrate on families with children, analyzing the impact of the decline of the traditional family type on poverty.
In Model 4, we add to the regressors of Model 1 (a) the share of single families with dependent children and (b) extended families with children (the two alternatives to the traditional couples with children); we also consider (c) the replacement rate of married couples, that is, the difference between the marriage rate and the divorce rate. Besides confirming the results of Model 1, the coefficients of the variables concerning family structure show a significant positive correlation of the share of both single and extended family households with poverty and a significant negative correlation between the replacement rate of married couples. If included separately, the crude marriage rate has a negative coefficient and the divorce rate a positive one, and both are statistically significant.
In Model 5, we add couples without children, that is, the family type that should be the least vulnerable to poverty: the previous results are confirmed, and the coefficient of the new variable is significant and displays the expected negative sign.
In Model 6, we test whether the traditional family structure (couple) is negatively associated with poverty also when children are present; thus, we add couples with dependent children as a regressor; singles are proxied by divorce rates; given the role of female employment in decreasing poverty (Cancian and Haskins 2014), especially in single parent households headed by a woman, we use female employment instead of per capita GDP. The traditional two-parent household appears to be negatively correlated with poverty even when dependent children are present.

4. Discussion and Conclusions

In this paper, we have analyzed the impact of the change in living arrangements on individual poverty in a sample of 28 European countries. A common trend that emerges is the decrease in the share of the “two parents with children” household and the increase in the share of the single-headed one. Moreover, poverty appears to be concentrated in single-person households, which may be related to low family-supporting public policies on single-person households. In particular, single-person households are targeted by general public policy on poverty that is not very developed in some types of European welfare states.
On this basis, we have applied an econometric analysis to test the effects of the decline of the traditional family type on poverty. Our contribution differs from the existing empirical analyses under two respects. First, we adopt an individual poverty indicator rather than a household one. This choice is based on the observation that the decline of the couple-with-children family type is associated with its disaggregation through divorces. As a consequence, the break-up of families exerts effects on society as whole, in particular adding to the number of households with nontraditional structure. Moreover, we think that the individual dimension of poverty can provide a more immediate view of its extent within society. Second, our analysis is more general than the existing ones, in that it considers several types of families and several European countries.
The results of our econometric analysis show that the decline of the traditional family type affects individual poverty: the marriage rate and the share of couples, both with and without children, are inversely related to poverty; the divorce rate, the shares of extended families and singles with children are, instead, positively related to poverty.
The aim of our work is highlighting some general feature in the evolution of family composition and its effects on poverty in Europe and stimulate research on the topic. The analysis itself comes with limitations that can be overcome by further work. In particular, an extension of the database with respect to the number of countries included and to the time span of the variables can allow to conduct an analysis that is at the same time more comprehensive and able to account for country differences. Moreover, the results can constitute the basis for research aimed at reformulating family policies in this new social context. In particular, we have found that the breaking-up of the “traditional” family type is associated with an increase in poverty, given the rise in the shares of “alternative” household structures that are more vulnerable to poverty. Against this, family policies are often tailored to the couple-with-children household, while the higher concentration of poverty is among single-person households, supported by general public policies to contrast poverty that are not equally developed throughout Europe.
This direction of research can benefit from the implementation of an econometric analysis based on an extension of the database along the above-mentioned lines. However, some policy suggestions may already emerge from the analysis.
First of all, a redesign and an improvement of general antipoverty policies seem necessary. In countries where income support policies are already strong, this purpose could be achieved by a reshaping of these policies through a different allocation of family cash benefits among the different types of families without increasing overall public spending in this expenditure sector.
Moreover, the modified framework of household composition may call for special in-kind measures targeting households more vulnerable to the risk of poverty such as single and single parents—either by choice or as a result of a divorce.
Then, public policies should be directed not only at reducing poverty (or preventing it by fostering economic growth and job creation), but also at reducing the consequences of poverty such as material deprivation of basic needs like housing and education, especially for single parents. To this purpose, local welfare policies—more service-oriented—should be redesigned in this sense.
It should also be noted that low-income families tend to live in low-quality housing in areas with lower infrastructures and services. Spatial segregation phenomena are thus possible, requiring inclusion enhancing and urban planning policies as measures for housing, transports and social services.
Moreover, because the risk of poverty is greater for single parents, the extension of traditional childcare services or of alternative childcare arrangements with favorable access criteria for particular vulnerable families improves the reconciliation of work–family responsibilities and mitigates the negative effects of low income on the child outcomes, breaking the intergenerational transmission of advantages.
Finally, in the particular period of the Covid−19 emergency, some additional risk factors affecting single parents should be considered by policy makers. First of all, home schooling represents a greater obstacle for single parents to conciliate work and family. While general measures of parental leave extension and additional cash benefits for working parents have been adopted by most European countries, only few countries (Austria and Cyprus) have paid more attention to single parents.
The greater difficulty of reconciling work and family exposes single parents to a higher risk of unemployment, also considering that part-time employment and temporary contracts are more common for single parents (Blundell et al. 2020; Nieuwenhuis 2020). This implies a poverty risk for single parents in a double sense: workers on temporary contracts are at higher risk of unemployment, and, in some European countries, they might be less likely to meet the eligibility conditions for unemployment benefits. Therefore, an increased income protection for temporary workers could mitigate the poverty risk for single parents.

Author Contributions

Conceptualization, M.A.A. and V.D.B.; methodology, M.A.A. and V.D.B.; software, M.A.A. and V.D.B.; validation, M.A.A. and V.D.B.; formal analysis, M.A.A. and V.D.B.; investigation, M.A.A. and V.D.B.; resources, M.A.A. and V.D.B.; data curation, M.A.A. and V.D.B.; writing—original draft preparation, M.A.A. and V.D.B.; writing—review and editing, M.A.A. and V.D.B. All authors have read and agreed to the published version of the manuscript.

Funding

This research received no external funding.

Institutional Review Board Statement

Not applicable.

Informed Consent Statement

Not applicable.

Data Availability Statement

All links to the data are reported in Table A1.

Conflicts of Interest

The authors declare no conflict of interest.

Appendix A. Data and Materials

Table A1. Data and sources.
Data Description and Reference YearsSources Links
Divorces (crude divorce rate) = ratio of the number of divorces during the year to the average population in that year (data expressed per 1000 persons). 1965–2018Eurostat https://appsso.eurostat.ec.europa.eu/nui/show.do?dataset=demo_ndivind&lang=en (accessed on 9 June 2021).
Marriages (crude marriage rate) = ratio of the number of marriages during the year to the average population in that year (data expressed per 1000 persons). 1965–2018Eurostat https://appsso.eurostat.ec.europa.eu/nui/submitViewTableAction.do (accessed on 9 June 2021).
Fertility rate = average number of children born per woman over a lifetime. 1960–2018OECD- Family Databasehttps://www.oecd.org/els/family/database.htm (accessed on 9 June 2021).
Births outside marriage (percentage value)Eurostat https://appsso.eurostat.ec.europa.eu/nui/submitViewTableAction.do (accessed on 9 June 2021).
Distribution of births by birth order = percentage of births that are first, second, third or higher. 1980 and 2018OECD-Family Databasehttps://www.oecd.org/els/family/database.htm (accessed on 9 June 2021).
Age of mothers = average age of mothers at the birth of the first child. 1980 and 2018OECD-Family Databasehttps://www.oecd.org/els/family/database.htm (accessed on 9 June 2021).
Household composition: percentage of couples with/without children percentage of singles with/without children percentage of households composed by three or more adults (extended households) with/without children. 1994, 2005, 2015, 2018, 2019Eurostat
(years 2018 and 2019)
https://appsso.eurostat.ec.europa.eu/nui/show.do?dataset=ilc_lvph02&lang=en%20(for%20years%201994,%202005%20and%202015) (accessed on 9 June 2021).
Eurostat
(years 1994, 2005 and 2015)
https://appsso.eurostat.ec.europa.eu/nui/show.do?dataset=hbs_car_t313&lang=en (accessed on 9 June 2021).
Head count ratio (AROP) = percentage of persons with equivalised disposable income below the 60% of median income. 2010 and 2019Eurostathttps://appsso.eurostat.ec.europa.eu/nui/show.do?dataset=ilc_li02&lang=en (accessed on 9 June 2021).
Distribution of households by household type and income level (percentage of households with disposable income below 60% of median income = H CR household) 2010, 2018 and 2019Eurostathttps://appsso.eurostat.ec.europa.eu/nui/show.do?dataset=ilc_lvph04&lang=en (accessed on 9 June 2021).
Gross Domestic ProductEurostathttps://appsso.eurostat.ec.europa.eu/nui/show.do?dataset=nama_10_pc&lang=en (accessed on 9 June 2021).
Education = percentage of persons (18–74 years) with secondary and upper secondary (no tertiary) education 2018, 2019Eurostathttps://appsso.eurostat.ec.europa.eu/nui/show.do?dataset=edat_lfs_9903&lang=en (accessed on 9 June 2021).
Social Public Expenditure (cash and in kind) for familiesEurostathttps://appsso.eurostat.ec.europa.eu/nui/show.do?dataset=spr_exp_ffa&lang=en (accessed on 9 June 2021).
Gini Index after tax and transfersEurostathttps://appsso.eurostat.ec.europa.eu/nui/show.do?dataset=ilc_di12&lang=en (accessed on 9 June 2021).
Unemployment rate = percentage of unemployed persons 15–74 years with respect to the 15–74 years active population (labour force)Eurostathttps://appsso.eurostat.ec.europa.eu/nui/show.do?dataset=une_rt_a&lang=en (accessed on 9 June 2021).
Table A2. Family composition in the countries under investigation (2019).
CountriesSingle without Dependent ChildrenSingle with Dependent ChildrenCouples without Dependent ChildrenCouples with 1 Dependent ChildrenCouples with 2 Dependent ChildrenCouples with 3 or More Dependent childrenExtended Family (3 or More Adults) without Dependent ChildrenExtended Family (3 or More Adults) with Dependent ChildrenFamilies without ChildrenFamilies with Children
Belgium34.76.228.88.19.64.54.63.568.131.9
Bulgaria34.32.925.18.98.31.410.19.069.530.5
Czech Republic29.84.229.410.611.62.48.04.067.232.8
Denmark43.95.529.36.37.73.22.51.775.624.4
Germany42.04.330.77.77.22.83.61.876.323.7
Estonia41.84.125.28.88.12.95.34.072.227.8
Ireland25.87.225.68.311.66.88.46.459.840.2
Greece25.71.328.79.19.84.015.16.369.630.4
Spain25.73.328.310.110.92.313.26.367.232.8
France38.65.928.98.210.43.62.91.670.429.6
Italy33.04.025.79.49.41.911.94.770.529.5
Cyprus20.83.232.79.411.15.39.48.162.937.1
Latvia35.44.927.39.57.02.77.65.670.229.8
Lithuania38.36.225.88.68.21.86.74.470.829.2
Luxembourg33.14.429.210.710.52.95.14.167.432.6
Hungary33.04.429.38.97.63.38.15.470.429.6
Malta27.33.629.611.18.41.710.28.267.132.9
Netherlands38.53.531.07.89.74.13.42.072.827.2
Austria37.42.528.87.87.83.47.94.374.125.9
Poland25.21.625.99.78.12.414.312.865.434.6
Portugal22.84.831.113.29.11.411.66.065.534.5
Slovenia29.63.725.69.912.63.310.44.965.734.3
Slovak Republic18.32.027.88.611.52.516.113.062.337.7
Finland44.73.930.27.07.43.62.01.177.023.0
Sweden46.65.725.96.78.13.41.91.774.425.6
Iceland366.124.78.49.55.554.965.934.4
Norway45.65.726.56.88.43.71.81.573.926.1
United Kingdom30.55.631.499.53.473.768.931.1
Source: Eurostat (For Iceland and UK 2018 data).

Notes

1
In this paper we use indifferently the terms household and family overcoming the following technical definitions. A household is defined by Eurostat as a social unit having common arrangements; sharing household expenses or daily needs in a shared common residence. A household includes either one person living alone or a group of people, not necessarily related as in the family.
2
The data only refer to “private households” excluding collective or institutional households” such as: hospitals, old people’s homes, residential homes, prisons, military barracks, religious institutions, boarding houses and workers’ hostels, etc. As specified above (see note 1), we refer to the Eurostat definition using indifferently the terms household and family.
3
In the Eurostat database dependent children are defined as individuals aged 0–17 years and 18–24 years if inactive and living with at least one parent. In this paper we use the term “children” or dependent children indifferently.
4
The equivalized disposable income is the total income of a household, after tax and other deductions, that is available for spending or saving, divided by the number of household members converted into equalized adults; household members are equalized or made equivalent by weighting each according to their age, using the so-called modified OECD equivalence scale giving 1 point to the first adult, 0.5 to the second and each subsequent person aged 14 and over, 0.3 to each child aged under 14.
5
The European Social Protection Committee uses the AROP, the SMD and the WI indicators.
6
Belgium, Bulgaria, Czechia, Denmark, Germany, Estonia, Ireland, Greece, Spain, France, Italy, Cyprus, Latvia, Lithuania, Luxembourg, Hungary, Malta, Netherlands, Austria, Poland, Portugal, Slovenia, Slovakia, Finland, Sweden, Iceland, Norway, United Kingdom.
7
Analogous results are obtained using the overall unemployment rate.

References

  1. Aassve, Arnstein, Franceso C. Billari, Stefano Mazzucco, and Fausta Ongaro. 2002. Leaving home: A comparative analysis of ECHP data. Journal of European Social Policy 12: 259–75. [Google Scholar] [CrossRef]
  2. Aassve, Arnstein, Maria A. Davia, and Maria Iacovou. 2005. Does Leaving Home Make You Poor? Evidence from 13 European Countries. ISER Working Paper Series, No. 2005-24; Colchester: University of Essex, Institute for Social and Economic Research (ISER). [Google Scholar]
  3. Aassve, Arnstein, Maria A. Davia, Maria Iacovou, and Stefano Mazzucco. 2007. Does Leaving Home Make You Poor? Evidence from 13 European Countries. European Journal of Population 23: 315–38. [Google Scholar] [CrossRef] [Green Version]
  4. Aassve, Arnstein, Maria Iacovou, and Letizia Mencarini. 2006. Youth poverty and transition to adulthood in Europe. Demographic Research 15: 21–50. [Google Scholar] [CrossRef] [Green Version]
  5. Aizer, Anna, Shari Eli, Joseph Ferrie, and Adriana Lleras-Muney. 2016. The Long-Run Impact of Cash Transfers to Poor Families. American Economic Review 106: 935–71. [Google Scholar] [CrossRef] [Green Version]
  6. Amarante, Veronica, and Martin Brun. 2018. Cash transfers in Latin America: Effects on poverty and redistribution. Economia 19: 1–31. [Google Scholar]
  7. Åslund, Olof, and Hans Grönqvistet. 2010. Family size and child outcomes: Is there really no trade-off? Labour Economics 17: 130–39. [Google Scholar] [CrossRef] [Green Version]
  8. Atkinson, Anthony B. 1992. Measuring Poverty and Differences in family Composition. Economica 59: 1–16. [Google Scholar] [CrossRef]
  9. Barham, Vicky, Robin Boadway, and Maurice Marchand. 1995. Education and the poverty trap. European Economic Review 39: 1257–75. [Google Scholar] [CrossRef] [Green Version]
  10. Björklund, Anders, Donna K. Ginther, and Marianne Sundström. 2007. Family structure and child outcomes in the USA and Sweden. Journal of Population Economics 20: 183–201. [Google Scholar] [CrossRef]
  11. Blundell, Richard, Monica Costa Dias, Robert Joyce, and Xiaowei Xu. 2020. COVID-19 and Inequalities. Fiscal Studies 41: 291–319. [Google Scholar] [CrossRef] [PubMed]
  12. Bradbury, Bruce, and Markus Jäntti. 1999. Child Poverty Across Industrialized Nations. Innocenti Occasional Papers, Economic and Social Policy Series, No. 71; Florence: UNICEF International Child Development Centre. [Google Scholar]
  13. Burtless, Gary. 1999. Effects of growing wage disparities and changing family composition on the U.S. Income distribution. European Economic Review 43: 853–65. [Google Scholar] [CrossRef]
  14. Butcher, Kristin F. 2017. Assessing the Long-Run Benefits of Transfers to Low-Income Families. Hutchins Center Working Paper, No. 26. Available online: https://www.brookings.edu/wp-content/uploads/2017/01/wp26_butcher_transfers_final.pdf (accessed on 9 June 2021).
  15. Cancian, Maria, and Deborah Reed. 2008. Family Structure, Childbearing, and Parental Employment: Implications for the Level and Trend in Poverty. Institute for Research on Poverty Discussion Paper No. 1346-08. Available online: https://www.irp.wisc.edu/publications/focus/pdfs/foc262d.pdf (accessed on 9 June 2021).
  16. Cancian, Maria, and Ron Haskins. 2014. Changes in Family Composition: Implications for Income, Poverty, and Public Policy. The Annals of the American Academy of Political and Social Science 654: 31–47. [Google Scholar] [CrossRef]
  17. Cappellari, Lorenzo, and Stephen P. Jenkins. 2002. Who Stays Poor? Who Becomes Poor? Evidence from the British Household Panel Survey. The Economic Journal 112: 60–67. [Google Scholar] [CrossRef]
  18. Chen, Stacey, YenChien Chen, and Jin Tan Liu. 2019. The Impact of Family Composition on Educational Achievement. Human Resources 4: 122–70. [Google Scholar] [CrossRef] [Green Version]
  19. Dollar, David, Tatjana Kleineberg, and Aart Kraay. 2016. Growth still is good for the poor. European Economic Review 81: 68–854. [Google Scholar] [CrossRef]
  20. Dwyer, Maire. 2015. Sole Parents in Poverty-it’s time to update the policy paradigm. Policy Quarterly 11: 19–24. [Google Scholar] [CrossRef]
  21. Esping Andersen, G. 1990. The Three Worlds of Welfare Capitalism. Cambridge: Polity Press, Princeton: Princeton University Press. [Google Scholar]
  22. Ferreira, F. H. G., P. G. Leite, and M. Ravallion. 2010. Poverty reduction without economic growth? Explaining Brazil’s poverty dynamics, 1985–2004. Journal of Development Economics 93: 20–36. [Google Scholar] [CrossRef]
  23. Goudie, A., and P. Ladd. 1999. Economic growth, poverty and inequality. Journal of International Development 11: 177–95. [Google Scholar] [CrossRef]
  24. Hofmarcher, T. 2019. The Effect of Education on Poverty: A European Perspective. Working Papers. Lund: Lund University, Department of Economics, Vol. 9. [Google Scholar]
  25. Iacovou, M. 2001. Family Composition and Children’s Educational Outcomes. ISER Working Paper Series, No. 2001-12; Colchester: University of Essex, Institute for Social and Economic Research (ISER), Available online: https://ideas.repec.org/p/ese/iserwp/2001-12.html (accessed on 9 June 2021).
  26. Iacovou, M. 2013. Household Composition, Poverty and Hardship Across Europe. Eurostat Statistical Working Paper. Available online: https://ec.europa.eu/eurostat/web/main/publications/statistical-working-papers (accessed on 9 June 2021).
  27. Iacovou, M., and A. J. Skew. 2011. Household composition across the new Europe: Where do the new Member States fit in? Demographic Research 25: 465–90. [Google Scholar] [CrossRef] [Green Version]
  28. Jędrzejczak, A., and D. Pekasiewicz. 2020. Changes in Income Distribution for Different Family Types in Poland. International Advances in Economic Research 26: 135–46. [Google Scholar] [CrossRef]
  29. Kakwani, Nanak. 1993. Poverty and economic growth with application to Côte d’Ivoire. Review of Income and Wealth 39: 121–227. [Google Scholar] [CrossRef]
  30. Karagiannaki, Eleni. 2017. The Empirical Relationship between Income Poverty and Income Inequality in Rich and Middle-income Countries. LSE Research Online Documents on Economics 86917. London: LSE, Available online: https://sticerd.lse.ac.uk/dps/case/cp/casepaper206.pdf (accessed on 9 June 2021).
  31. LaFave, Daniel, and Duncan Thomas. 2017. Extended families and child well-being. Journal of Development Economics 126: 52–65. [Google Scholar] [CrossRef]
  32. Lee, Dohoon, and Sara McLanahan. 2015. Family Structure Transitions and Child Development: Instability, Selection, and Population Heterogeneity. American Sociological Review 80: 738–63. [Google Scholar] [CrossRef] [Green Version]
  33. Lerman, Robert I. 1996. The impact of the Changing US Family Structure on Child Poverty and Income Inequality. Economica 63: 119–39. [Google Scholar] [CrossRef]
  34. Mackay, Ross. 2005. The impact of family structure and family change on child outcomes: A personal reading of the research literature. Social Policy Journal of New Zealand 24: 111–33. [Google Scholar]
  35. Meenakshi, J. V., and Ranjan Ray. 2002. Impact of household size and family composition on poverty in rural India. Journal of Policy Modeling 24: 539–59. [Google Scholar] [CrossRef] [Green Version]
  36. Menaghan, Elizabeth G. 2009. Family Composition, Family Interaction, and Children’s Academic and Behavior Problems: Interpreting the Data. In Family-School Links. How Do They Affect Educational Outcomes? Edited by Alan Booth and Judith F. Dunn. New York: Routledge. [Google Scholar]
  37. Monti, Maria Giovanna, Simone Pellegrino, and Achille Vernizzi. 2015. On measuring inequity in taxation among groups of income units. Review of Income and Wealth 61: 43–58. [Google Scholar] [CrossRef]
  38. Mussida, Chiara, and Maria Laura Parisi. 2020. Risk of Poverty in Southern Europe. Metroeconomica 71: 294–315. [Google Scholar] [CrossRef]
  39. Nieuwenhuis, Rense. 2020. The Situation of Single Parents in the EU, European Parliament. Available online: http://www.europarl.europa.eu/supporting-analyses (accessed on 9 June 2021).
  40. OECD. 2011. Families Are Changing. Doing Better for Families 1: 17–53. Available online: https://www.oecd.org/social/soc/doingbetterforfamilies.htm (accessed on 9 June 2021).
  41. Penne, Tess, Tine Hufkens, Tim Goedemé, and Bérénice Storms. 2018. To What Extent Do Welfare States Compensate for the Cost of Children? A Hypothetical Household Approach to Policy Evaluations. JRC Working Papers on Taxation and Structural Reforms No 08/2018. Seville: European Commission, Joint Research Centre, JRC114168. [Google Scholar]
  42. Proctor, Bernadette D., and Joseph Dalaker. 2002. Poverty in the United States: 2001; U.S. Census Bureau, Current Population Reports, P60-219. Washington, DC: U.S. Government Printing Office. Available online: https://www.census.gov/library/publications/2003/demo/p60-222.html (accessed on 9 June 2021).
  43. Saunders, Peter. 2002. The direct and indirect effects of unemployment on poverty. Australian Journal of Labour Economics 5: 507–30. [Google Scholar]
  44. Schoen, Robert, Nancy S. Landale, and Kimberly Daniels. 2007. Family transitions in young adulthood. Demography 44: 807–820. [Google Scholar] [CrossRef] [PubMed]
  45. Sen, Abhijit. 1996. Economic reforms, employment and poverty: Trends and options. Economic and Political Weekly 31: 2459–77. [Google Scholar]
  46. Sen, Amartya. 1976. Poverty: An ordinal approach to measurement. Econometrica 44: 219–21. [Google Scholar] [CrossRef]
  47. Smith, James P. 2004. Poverty and the family. EconWPA, Labor and Demography. Available online: https://www.researchgate.net/publication/23746651_Poverty_and_the_Family (accessed on 9 June 2021).
  48. Snyder, Anastasia R., Diane K. McLaughlin, and Jill Findeis. 2006. Household Composition and Poverty among Female Headed Households with Children: Differences by Race and Residence. Rural Sociology 71: 597–624. [Google Scholar] [CrossRef] [Green Version]
  49. Stern, Mark J. 1993. Poverty and Family Composition since 1940. In The "Underclass Debate": Views from History. Edited by Michael B. Katz. Princeton: Princeton University Press, pp. 220–53. [Google Scholar]
  50. Thévenon, Olivier, Thomas Manfredi, Yajina Govind, and Ilya Klauzner. 2018. Child Poverty in the OECD: Trends, Determinants and Policies to Tackle It. OECD Social, Employment and Migration Working Papers, No. 218. Paris: OECD Publishing. [Google Scholar] [CrossRef]
  51. Thomson, Elizabeth, Thomas L. Hanson, and Sara S. McLanahan. 1994. Family Structure and Child Well-Being: Economic Resources vs. Parental Behaviors. Social Forces 73: 221–42. [Google Scholar] [CrossRef]
  52. Thornton, Arland, and Thomas E. Fricke. 1987. Social Change and the Family: Comparative Perspectives from the West, China, and South Asia. Sociological Forum 2: 746–79. [Google Scholar] [CrossRef]
  53. Zill, Nicholas. 2009. Family Change and Student Achievement. In Family-School Links. How Do They Affect Educational Outcomes? Edited by Alan Booth and Judith F. Dunn. New York: Routledge. [Google Scholar]
  54. Zinn, Maxine Baca. 1989. Family, Race and Poverty in the Eighties. Signs: Journal of Women in Culture and Society 14: 856–74. [Google Scholar] [CrossRef]
Figure 1. Source: our elaboration on Eurostat data Countries: Austria, Belgium, Bulgaria, Cyprus, Czech Republic, Denmark, Estonia, Finland, France, Germany, Greece, Hungary, Latvia, Lithuania, Luxembourg, Netherlands, Norway, Poland, Portugal, Slovak Republic, Slovenia, Sweden, United Kingdom.
Socsci 10 00224 g001
Figure 2. Source: our elaboration on Eurostat data. Northern: Denmark, Finland, Norway, Sweden (Iceland is not included for missing data on divorces from 2012). Continental: Austria, Belgium, France, Germany, Luxembourg, Netherlands. Anglo Saxon: United Kingdom (in Ireland the divorce has been introduced in 1996). Southern: Cyprus, Greece, Italy, Portugal, (in Spain the divorce law the law was introduced in 1931, then abolished and reintroduced in 1981). Eastern: Bulgaria. Czech Republic, Estonia, Hungary, Latvia, Lithuania, Poland, Slovak, Slovenia.
Socsci 10 00224 g002
Figure 3. Source: our elaboration on Eurostat data. Countries: Austria, Belgium, Bulgaria, Czech Republic, Denmark, Finland, France, Germany, Greece, Hungary, Iceland, Ireland, Italy, Latvia, Luxembourg, Netherlands, Norway, Portugal, Slovak Republic, Slovenia, Spain, Sweden, United Kingdom.
Socsci 10 00224 g003
Figure 4. Source: our elaboration on Eurostat data.
Socsci 10 00224 g004
Figure 5. Source: our elaboration on Eurostat data. (a) Time changes—Couples without dependent children (% of households); (b) Time changes—Couples with dependent children; (c) Time changes—Single (% of households); (d) Time changes—Extended families (3 or more adults; % of households).
Socsci 10 00224 g005
Figure 6. Source: our elaboration on Eurostat data.
Socsci 10 00224 g006
Figure 7. Source: elaboration on Eurostat data.
Socsci 10 00224 g007
Figure 8. Source: our elaboration on Eurostat data.
Socsci 10 00224 g008
Figure 9. Source: our elaboration on Eurostat data.
Socsci 10 00224 g009
Table 1. Distribution of births by birth order.
CountriesFirst BirthsSecond BirthsThird or HIGHER Births
198020181980201819802018
Austria41.247.135.735.323.117.6
Belgium47.942.932.934.519.222.6
Bulgaria47.850.337.937.214.312.5
Czech Republic42.048.039.837.218.214.7
Denmark45.846.337.136.917.116.8
Finland47.040.735.534.217.525.1
Greece44.947.037.436.617.714.4
Hungary45.546.438.832.915.620.7
Iceland37.344.730.733.232.022.1
Ireland29.238.424.434.846.426.8
Italy46.746.634.338.519.015.0
Latvia52.839.533.437.813.822.6
Netherlands43.144.837.136.619.818.5
Norway50.343.032.338.217.318.9
Slovak Republic40.145.735.335.024.619.3
Slovenia48.545.538.739.212.815.4
Spain42.849.131.138.026.112.9
average44.345.134.836.220.918.6
Source: OECD.
Table 2. Percentage of individuals and households in poverty in 2010 and 2019.
HCR 2019HCR 2010VAR %
NordicHouseholds17.895017.42492.70
Individuals14.368413.80344.09
ContinentalHouseholds16.724016.16063.49
Individuals13.682113.8432−1.16
Anglo-SaxonHouseholds19.190218.37664.43
Individuals18.001416.70307.77
MediterraneanHouseholds19.587819.813−1.14
Individuals19.692719.41951.41
EasternHouseholds19.416117.246012.58
Individuals16.637316.9772−2.00
Source: our elaboration on Eurostat data.
Table 3. Results.
Table 3. Results.
WLS (Weighted Least Squares) Dependent Variable: Head Count Ratio
(the Share of Persons with an Equivalised Disposable Income below the Risk-of-Poverty Threshold, Which Is Set at 60 % of the National Median Equivalised Disposable Income (After Social Transfers
Model 1Model 2Moldel 3Model 4Model 5Model 6
Per capita GDP, PPP Euro, average 2015-2019−8.17229e-05 (2.95157e-05) ** −5.37576e-05 (2.03873e-05) **−3.60961e-05 (0.820246) ***
Social cash benefits and social in kind benefits for families (2019) −1.93272 (0.864591) **
Female unemployment 0.0465247 (0.0231323) * 0.106260 (0.03668) ***
INEQ0.727745 (0.0538034) ***0.648487 (0.0428954) ***0.637258 (0.0411488) ***0.665617 (0.0252386) ***0.770575 (0.0535229) ***0.742492 (0.0600072) ***
Share of persons with secondary education 2018−0.0640751 (0.0246600) **−0.0524619 (0.0212443) **−0.0696824 (0.0241048) ***−0.0675370 (0.00890504) ***−0.0400034 (0.0163647) **−0.0391403 (0.0188492) *
Single with dependent children 0.479674 (0.225447) **0.275074 (0.148516) *
Extended family with children 0.226457 (0.0458668) ***0.174426 (0.0765417) **0.140286 (0.0557374) **
Indicator of replacement for couples calculated as marriages minus divorces (2018) −0.817638 (0.203494) ***−0.730639 (0.138023) ***
Couples without dependent children −0.141050 (0.0724928) *−0.177072 (0.0979028) *
Couples with dependent children −0.143487 (0.0337882) ***
Crude divorce rate (2018) 1.26908 (0.423558) ***
Obs282828282828
Uncentered R squared 0.7721480.8213980.8746190.957290.9950210.974048
Centered R squared 0.7914220.8624580.9954060.9920450.9996240.999043
*, * *, *** stand for significant at the 10%, 5% and 1% level, respectively. Standard errors in brackets.
Publisher’s Note: MDPI stays neutral with regard to jurisdictional claims in published maps and institutional affiliations.

