Article

Gender Equality, Human Development, and PISA Results over Time

by
Janine Anne Campbell
1,*,
Joseph McIntyre
2 and
Natalia Kucirkova
1
1
Norwegian Centre for Learning Environment and Behavioural Research in Education, University of Stavanger, 4021 Stavanger, Norway
2
Harvard Graduate School of Education, Harvard University, Cambridge, MA 02138, USA
*
Author to whom correspondence should be addressed.
Soc. Sci. 2021, 10(12), 480; https://doi.org/10.3390/socsci10120480
Submission received: 14 November 2021 / Revised: 10 December 2021 / Accepted: 14 December 2021 / Published: 15 December 2021
(This article belongs to the Section Gender Studies)

Abstract

:
Gender equality through the empowerment, representation, and provision of equal opportunities for all, regardless of gender, is increasingly recognised as a driver of social outcomes and a fundamental human right. This study explores the longitudinal (2006–2018) relationship between gender equality, human development, and education results as measured by PISA. Gender equality and human development are consistently correlated with PISA scores at each time point; however, when controlling for starting values and country effects only change in gender equality positively predicts change in PISA scores (F = 22.6, p < 0.001, R2 = 0.58). Research and policy implications for the longitudinal interpretation of the relationship of PISA results with system-level factors as well as the relationship between gender equality and education are discussed in this paper. In consideration of the impact of COVID-19 on education and gender equality, the findings from this study support continued political effort towards gender-equal human development in a post-COVID-19 world.

1. Introduction

Gender equality is a development goal, a means of achieving other development goals, and a fundamental human right (Lawson 2008; UNDP 2020; World Bank 2011). In education, the measurement of gender equality is a key objective of the Organisation for Economic Co-operation and Development’s (OECD) Programme for International Student Assessment (PISA). For every PISA cycle, the OECD has disaggregated, reported, and discussed the results by gender (OECD 2015, 2017). However, system-level gender equality as an enabling factor for PISA performance has only been explored in one prior study (Campbell 2021), which found a significant relationship between gender equality, human development, and PISA 2015 results. The stability of this relationship over time and the association between changes in gender equality, human development, and PISA results are the focus of this current study.
Positive change in gender equality is associated with improvement in economic growth (World Bank 2011), health and well-being (Heise et al. 2019), and political response to climate change (McKinney and Fulkerson 2015). Nevertheless, positive changes in student results on international comparative assessments have largely been attributed to changes in educational policies (Barber and Mourshed 2007; Mourshed et al. 2010), with little consideration for changes in social and economic conditions (Rowley et al. 2020). Whether and how positive changes in education outcomes are associated with positive changes in the economic and social structures that contextualise policymaking (Kamens 2013) has not yet been extensively researched. In this study, therefore, we explore the relationship between change in gender equality, human development, and PISA scores over five cycles of PISA (12 years). In particular, we examine whether the relationships are the same for high- and low-performing PISA countries, and for both girls and boys.
Due to the nature of the data used in this study and its non-experimental design, the relationships that are detected and discussed in this article should not be interpreted as causal.

1.1. Gender Equality

Gender equality is equality under the law, equality of opportunity, equality of rewards for work, and equality of political voice, regardless of biological sex or sexual orientation (World Bank 2001). In 1795, Condorcet stated that ‘inequality between the sexes is fatal even to the party in whose favour it works’ (355). However, despite early claims that the legal subordination of women was a significant hindrance to human development (Mill 1869), international organisations have only recently recognised that gender inequality harms everyone. The reduction and eventual elimination of gender inequality is now a core development objective (UNDP 2020; World Bank 2001, 2011).
International measures of gender equality typically measure the degree of its absence, such as the United Nations’ Gender Inequality Index (GII, used in this study). International momentum, focused on the reduction and eventual elimination of gender inequality, has generated diverse studies exploring its link with poverty, economic development, sustainable growth, and effective governance (World Bank 2001, 2011). Gender inequality has been found to damage societies’ social structures and relations, and result in unbalanced perspectives of human value, power, opportunity, and economic distribution (Unterhalter 2005). Within gender-unequal societies, higher levels of corruption and lower levels of democracy and freedom have been observed (Djerf-Pierre 2011), as well as higher rates of depression, divorce, and violent homicide for both men and women (Holter 2014; Ratele 2014).
Furthermore, gender inequality negatively impacts women’s health, with serious implications for women, girls, and babies of both genders (Heise et al. 2019), and is both a cause and an effect of environmental crises (McKinney and Fulkerson 2015). On the other hand, gender equality is positively associated with dialogue, cooperation, and collaborative decision making in the workplace (European Institute for Gender Equality 2021), scientific and academic progress (Husu et al. 2013), and sustainable economic development (World Bank 2011). It has also been shown to reduce environmental impacts, improve health and climate outcomes, and support happiness and wellbeing for men and women alike (Audette 2019; Ergas et al. 2021; McKinney and Fulkerson 2015). Due to the nature of the available data and the design of previous studies, it is difficult to disentangle to what degree these features of society are a cause or a consequence of gender equality, and whether such bidirectional relationships are symmetrical. However, given the documented impact of gender equality on societies, it is essential to understand its interdependence with other factors such as human development.

1.1.1. Human Development and Gender Equality

Gender equality is intricately linked to human development, which until the late 1980s was narrowly defined as wealth and measured by gross domestic product (GDP). However, pressure from international agencies and social researchers to measure other areas of the richness of human life caused the United Nations (UN) to adopt a more holistic approach and develop the Human Development Index (UNDP 2015, 2020). This broadened the concept of human development to include employment, education, health, participation, sustainability, and human security and rights. In 2010, the United Nations expanded the dimensions of human development to include factors that create conditions for development, and included gender equality. These dimensions are depicted in Figure 1, showing the categories and items measured in the Human Development Index (HDI) and the Gender Inequality Index (GII); this figure is a combination of the models provided in UNDP 2015 and UNDP 2020. The United Nations data were selected for this study due to their broad scope of the dimensions, the large number of countries for which data are available, and the number of years of published data (the HDI has been published annually since 1990, and the GII since 2010, with retroactive calculations provided for 1995, 2000, and 2005).
In this study we follow in the footsteps of international researchers who have explored the importance of gender equality for social development. Motivated by improvements in gender equality prior to 2020 and the negative impact of COVID-19 on those improvements, we seek to gain a fresh perspective on the relationship between education, gender equality, and human development in order to better understand the dynamics between these factors and to support positive momentum towards gender-equal human development (Bandiera and Natraj 2013).

1.1.2. Gender Equality and COVID-19

Over the past twenty years, gender equality has become integral to policy analysis, design and implementation (World Bank 2001), and substantial reductions in gender gaps in health and education have occurred. However, despite a steady increase in women in the workplace, the anticipated improvement in labour force participation and political representation has been more moderate than expected (Bandiera and Natraj 2013). Prior to 2020, women in every country were still less likely than men to engage in paid work, more likely to work part-time, more likely to assume unpaid care work, and less likely to be represented in formal politics (OECD 2017; World Bank 2011). It was estimated in 2019 that it would still take between 100 and 200 years to close the global gender gap in economic participation, opportunity, and political empowerment (World Economic Forum 2019, 2021), and it can now be seen that COVID-19 has widened that gap further.
It is important to recognise positive trends in gender equality and social outcomes, as ‘the traces that the past leaves on the present are an important resource for trying to make sense of confusing times’ (Unterhalter 2014b, p. 855). However, at the time of writing, over a year into the global COVID-19 pandemic, gender equality has suffered setbacks. Reports indicate that although women previously made up 39% of global employment, they have accounted for more than 54% of overall job losses (Madgavkar et al. 2020). South African women have experienced two-thirds of net job losses (Casale and Posel 2021), and mothers in London have been 50% more likely to have lost their jobs than fathers (Khan 2021). In Norway, for the first time since 2015, the wage gap between men and women has increased (Capar 2021), and globally, women are suffering through rising domestic violence, lower earnings, and a reduction in paid work to take on a disproportionate share of unpaid care (European Parliament 2021; Madgavkar et al. 2020; Morse and Gupta 2020). It has been estimated that 30 years of progress towards gender equality has been undone by COVID-19 (Trudeau 2021) as the gains that had been made have not proven to be resilient nor enshrined within robust systems (Clark 2021).
Although PISA data that reflect the impact of COVID-19 are not yet available, in this study, we investigate the longitudinal relationship between gender equality, human development, and educational achievement as measured by PISA up to 2018. Our study is nested within the broader aim of supporting political efforts towards gender equal human development in a post-COVID-19 world.

1.2. Programme for International Student Assessment (PISA)

PISA is a triennial assessment of the reading, mathematics, and science literacy and skills of 15-year-olds in compulsory education, launched by the OECD in 1997. Through PISA, the OECD aims to provide valid, comparable, cross-national evidence of education outcomes for informing policy decisions (OECD 1999). PISA initially assessed education outcomes in only OECD countries; however, more than half of the 88 nations that will participate in PISA 2022 are non-OECD countries. The organisation aims to expand the reach of PISA and PISA-D (PISA for development) to 170 participating nations by 2030 and consolidate educational assessment and basic education standards as global objectives aligned with the Sustainable Development Goals (Xiaomin and Auld 2020). PISA data are an accessible, politically acknowledged and respected source of comparative information on policies, practices, and education outcomes (Xiaomin and Auld 2020; Kamens 2013), and have become an influential tool for educational governance (Breakspear 2014).
Some researchers question the political and ideological neutrality of the OECD and PISA, and have challenged the legitimacy, motives, and financing of the assessments, claiming that the purpose of education, the mission of schools, and the well-being of children have been harmed (Meyer and Zahedi 2014; Roberts-Holmes and Moss 2021). In response, the OECD has legitimized its mandate through the strategic support of its member countries, high number of reported learning outcomes and contexts, and facilitation of collaborative and strategic policy initiatives (OECD 2014). As intended by the OECD, PISA data have been widely applied to the assessment of effective education policies and have contributed to the ‘What Works’ industry of education reform (Barber and Mourshed 2007; Mourshed et al. 2010). In this model of reform, successful countries, with educational policies worthy of replication are those that score well on PISA (Kamens 2013). However, caution should be taken in the selection and transfer of policies from one context to another, as the support those policies receive from robust economic and social systems may be the reason for their success (Campbell 2021; Kamens 2013). Assuming that high achievement is due solely to effective educational policies and practices may miss the impact of these outcome-enabling conditions (Rowley et al. 2020).
PISA data do not include 15-year-olds not in formal education, and are not disaggregated by the proportion or gender of international students within countries. Such variables may be relevant for secondary analyses such as the current study. In addition, debate continues around using the simplified PISA rankings for determining educational success and identifying policy priorities (Elliot et al. 2019; Grey and Morris 2018; Komatsu and Rappleye 2017; Rowley et al. 2020), and changes in scores and rankings across PISA cycles have rarely been empirically evaluated. However, despite these challenges, longitudinal analyses that explore change over time in PISA outcomes and enabling factors have the potential to add to the knowledge base in comparative education. Similar longitudinal studies have been conducted in other fields (see, for example, Ergas et al. 2021; Heise et al. 2019; McKinney and Fulkerson 2015); however, there is little research of this type in education (see, for example, Rowley et al. 2019). This is the gap in the literature that this article seeks to address. Our longitudinal exploration of the relationships between gender equality, human development, and PISA responds to the call for studying the complexity of academic achievement within unequal societies (Elliot et al. 2019).

1.3. Gender Equality and PISA

The measurement of gender equality is a key objective of PISA, and results have been disaggregated, reported, and discussed by gender in every PISA cycle (OECD 2019). The OECD has recognized that significant progress has been made in narrowing or closing long-standing gender gaps (OECD 2015), but has been criticised for stereotypically defining its approach to gender equality in education (Meier and Diefenbach 2020). Gender gaps in educational outcomes are an important variable in the context of gender equality and education, and have been explored in all PISA reports. The reduction of these gaps remains an important focus of national politics and comparative research. However, past work in this area has paid less attention to the complex history of inequality, the relationships of power, and the enabling effects of gender equality on education (Unterhalter 2014a, 2014b). We foreground these issues in our study, which seeks to broaden the conceptualisation of gender equality in education and complement ongoing research into reducing gaps. Along with other system-level factors, gender equality has been shown to moderate the relationship between educational policies and practices and student results (Campbell 2021), and in this study, we make use of the multiple years of available data on PISA scores, gender equality and human development to explore this relationship over time (Figure 2).

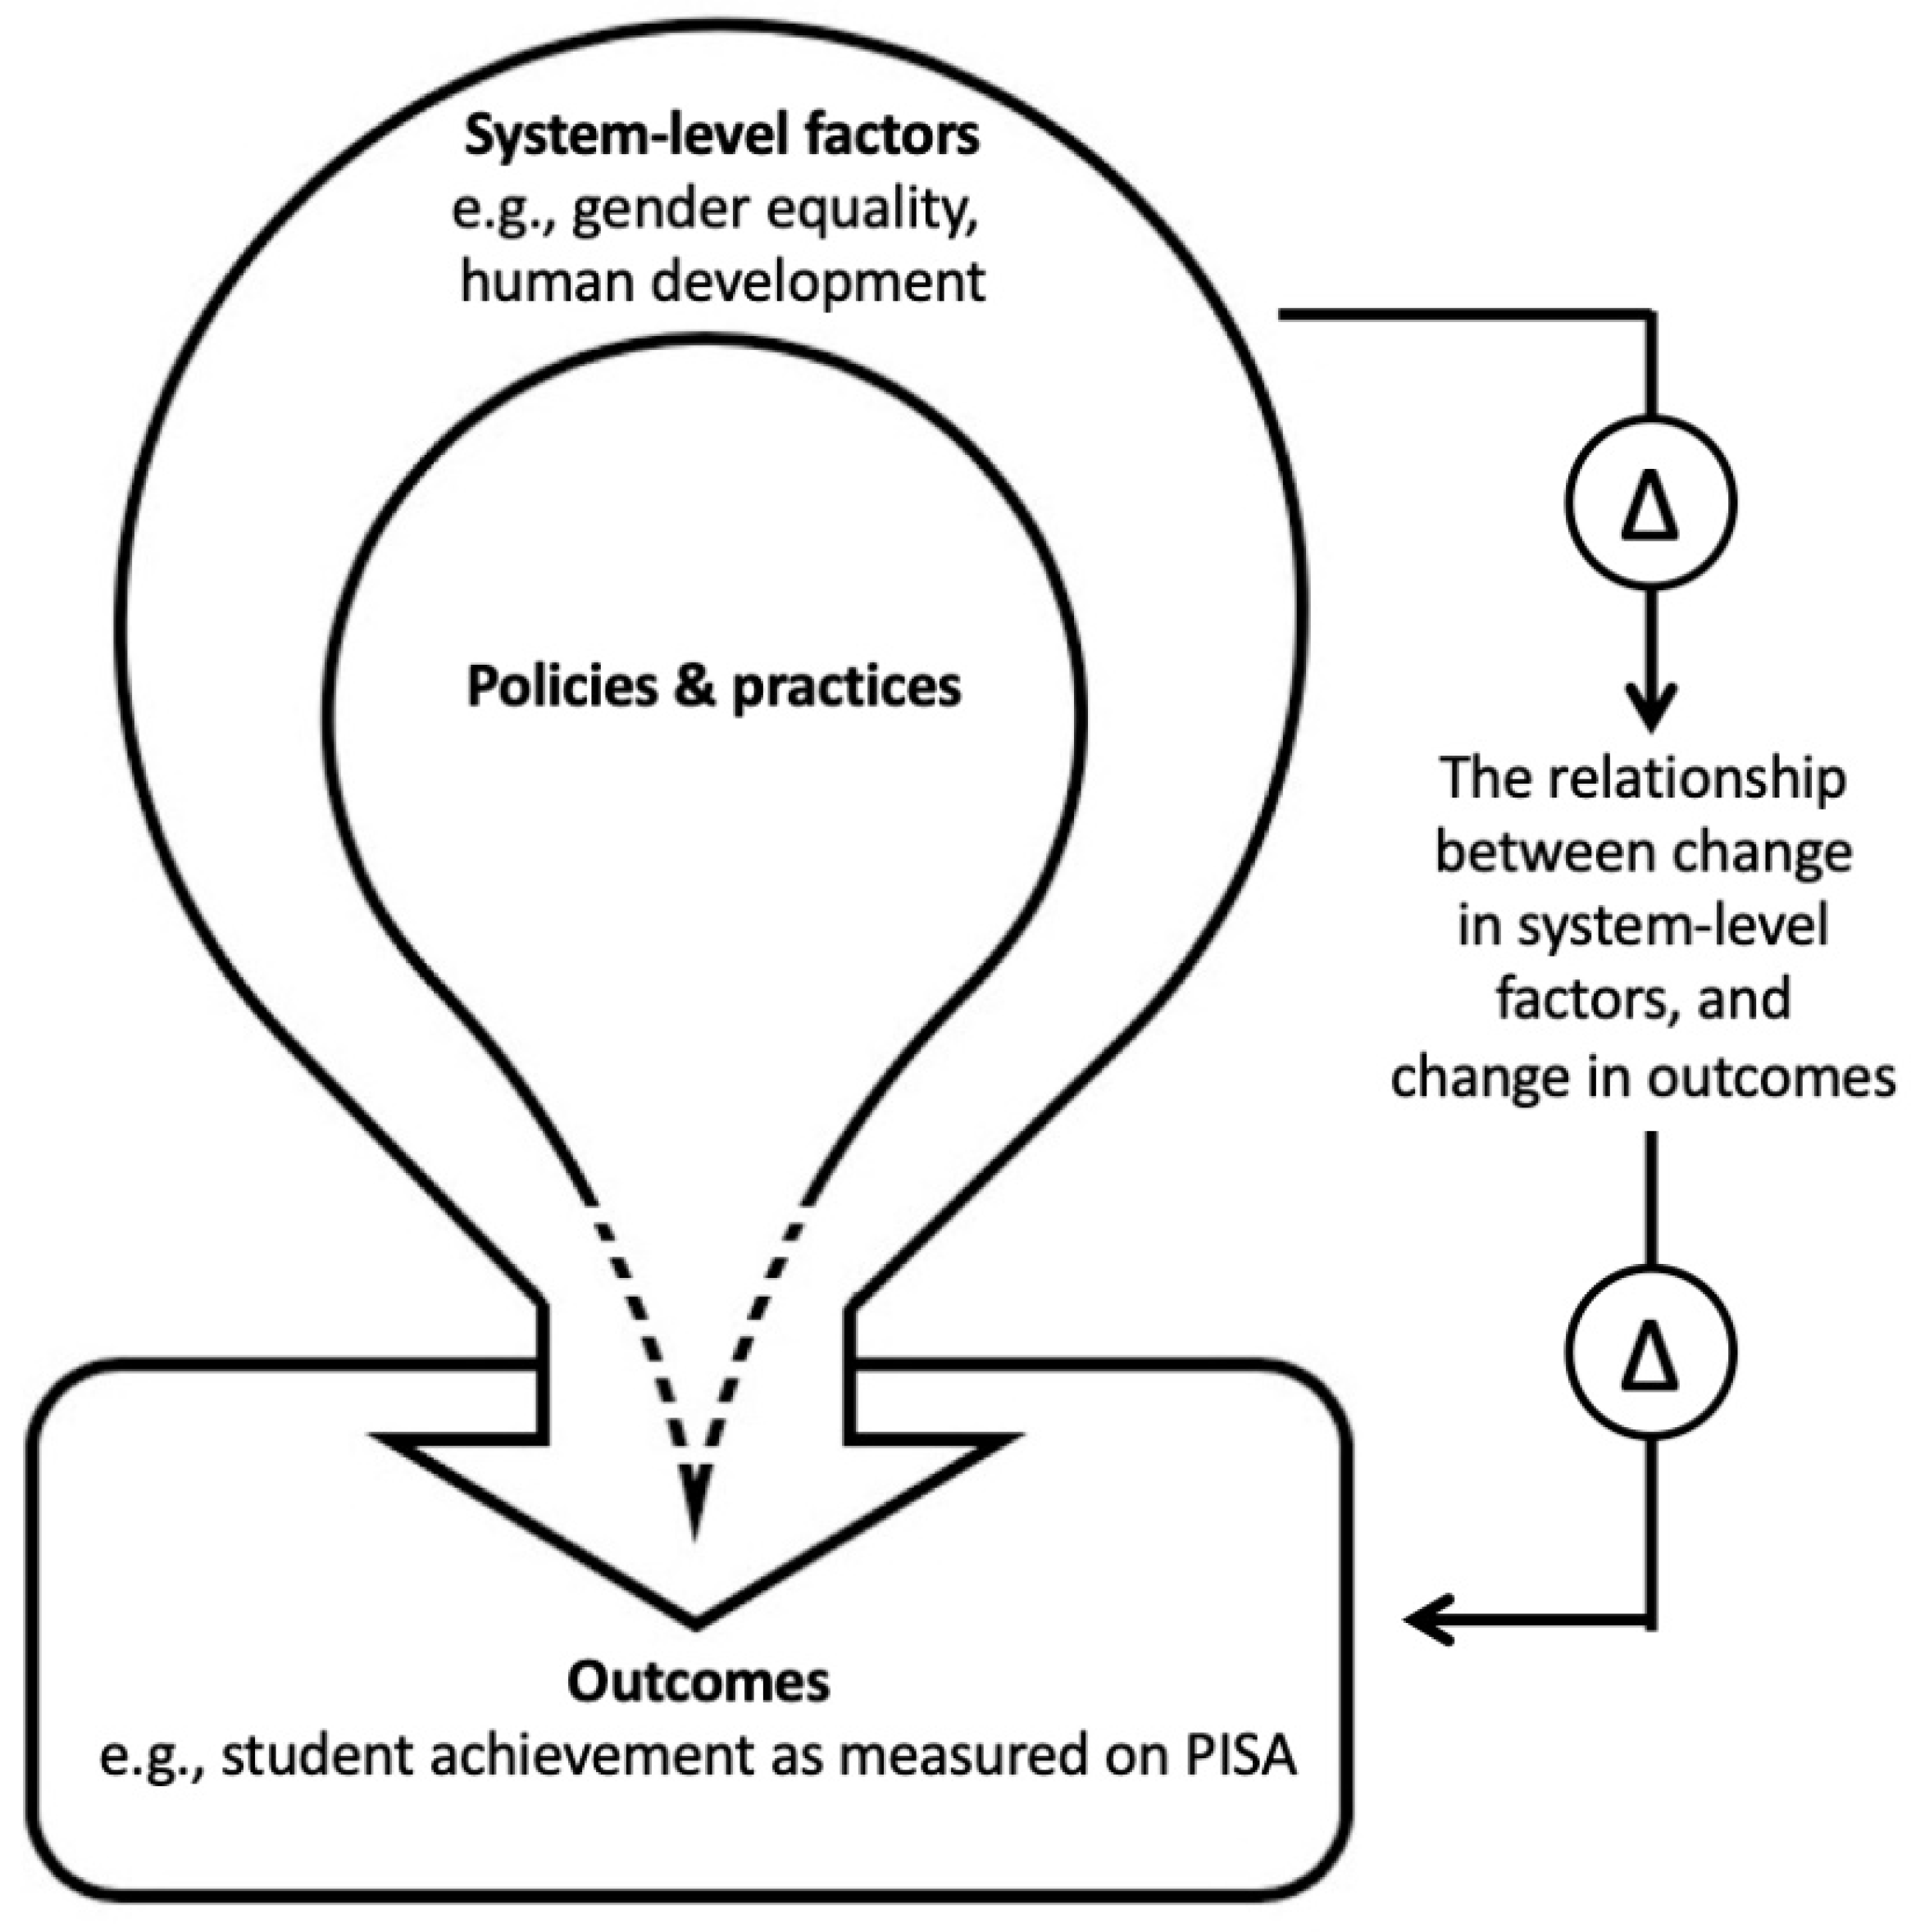
1.4. Gender Equality as Both a Predictor and an Outcome in Education

Despite advances in gender research in many fields, gender in education has not yet been integrated into the full social justice agenda. It has been added to the existing frame of education, instead of reconsidering that frame in the light of gender and inequality (Unterhalter 2014a). Focus has been on gender as a descriptive category, gender disadvantage as a girls’ education problem, and the elimination of that disadvantage as necessary to promote development. Although there has been remarkable worldwide progress in girls’ educational attainment (‘perhaps the greatest gender equality success story of the past half-century’, OECD 2017, p. 22), the expected macro-level gains in economic growth and higher wages and labour force participation for women have been disappointingly slow to occur (Bandiera and Natraj 2013). Equal educational opportunities for girls and boys are important and necessary, but have not resulted in and are not equal to gender equality in society. In fact, equally plausible but mostly understudied is the possibility that gender equality in the wider society is responsible for equality within schools, and systematically moderates the educational attainment of all students.
Possible explanations for a relationship between gender equality and educational results are still only theoretical. Prior research showing that improvement in women’s representation in parliament is associated with more socially-minded policymaking, which in turn results in better climate outcomes for all (Ergas et al. 2021; McKinney and Fulkerson 2015), and that closing gender disparities in healthcare improves lifelong outcomes for families and children, men and women, boys and girls (Heise et al. 2019), provide examples of plausible pathways.
By taking a more generative and expansive view of gender equality as both a predictor and an outcome in education, in this study we aim to provide a mechanism for making socially and educationally important comparisons within complex and unequal societies. Rather than being limited to the current definitions of gender equality as an outcome, this study builds on a ‘criss-crossing comparative education’ that ‘travels back and forth along intersecting lines’ (Sobe 2018, p. 325), thus expanding the research that focuses knowledge and resources on correction of the injustice of gender inequality in both education and society (Unterhalter 2005).

1.5. Study Aims

This study explores whether gender equality and human development are consistently associated with education outcomes as measured by PISA scores. Given that countries high in gender equality also tend to be high in human development (UNDP 2021), we also explore whether the relationship that these factors have with PISA scores are the same or discernibly different in different groups of countries. The study’s main aim is to establish the longitudinal relationship between gender equality, human development, and PISA scores. Our research questions are:
  • Have gender equality and human development been consistently associated with PISA results over the last five testing cycles (2006–2018)?
  • Is a change in gender equality and/or human development associated with a change in PISA scores, and is this relationship the same for high- and low-performing PISA countries, and for girls and boys?
  • Are any specific items within the composite gender and human development indices more strongly associated with PISA results, or with change in PISA results over time?

2. Materials and Methods

The data used in this study are freely available online from the OECD and the UN (OECD 2021; UNDP 2021). All analyses were conducted in R version 4.0.3 (R Core Team 2021) and RStudio version 1.1.463 (RStudio Team 2021), and graphs were produced using ggplot2 (Wickham 2016). Alpha was set at 0.05, and p-values are represented with the standard notation of *** p < 0.001, ** p < 0.01, and * p < 0.05. The compiled datasets and R code files are available in the supplemental material.

2.1. Data

2.1.1. PISA Scores

For each cycle of PISA since 2006, reading, math and science have simultaneously been assessed. Data are available for download from the OECD online data repository (OECD 2021). PISA scores are set in relation to the variation in achievement across countries without a theoretical maximum or minimum, although in practice they have ranged between 325 and 575. The scores are scaled to have a mean across OECD countries of about 500, and a standard deviation of 100 (OECD 2019). The analyses in this study were conducted on each assessed subject independently (reported in the Appendix A, Appendix B and Appendix C), on the average score across the three subjects (reported in the text), and separately for girls and boys (reported both in text and in the Appendix A, Appendix B and Appendix C). Descriptive statistics for PISA scores are displayed in Table 1 at the end of this section.

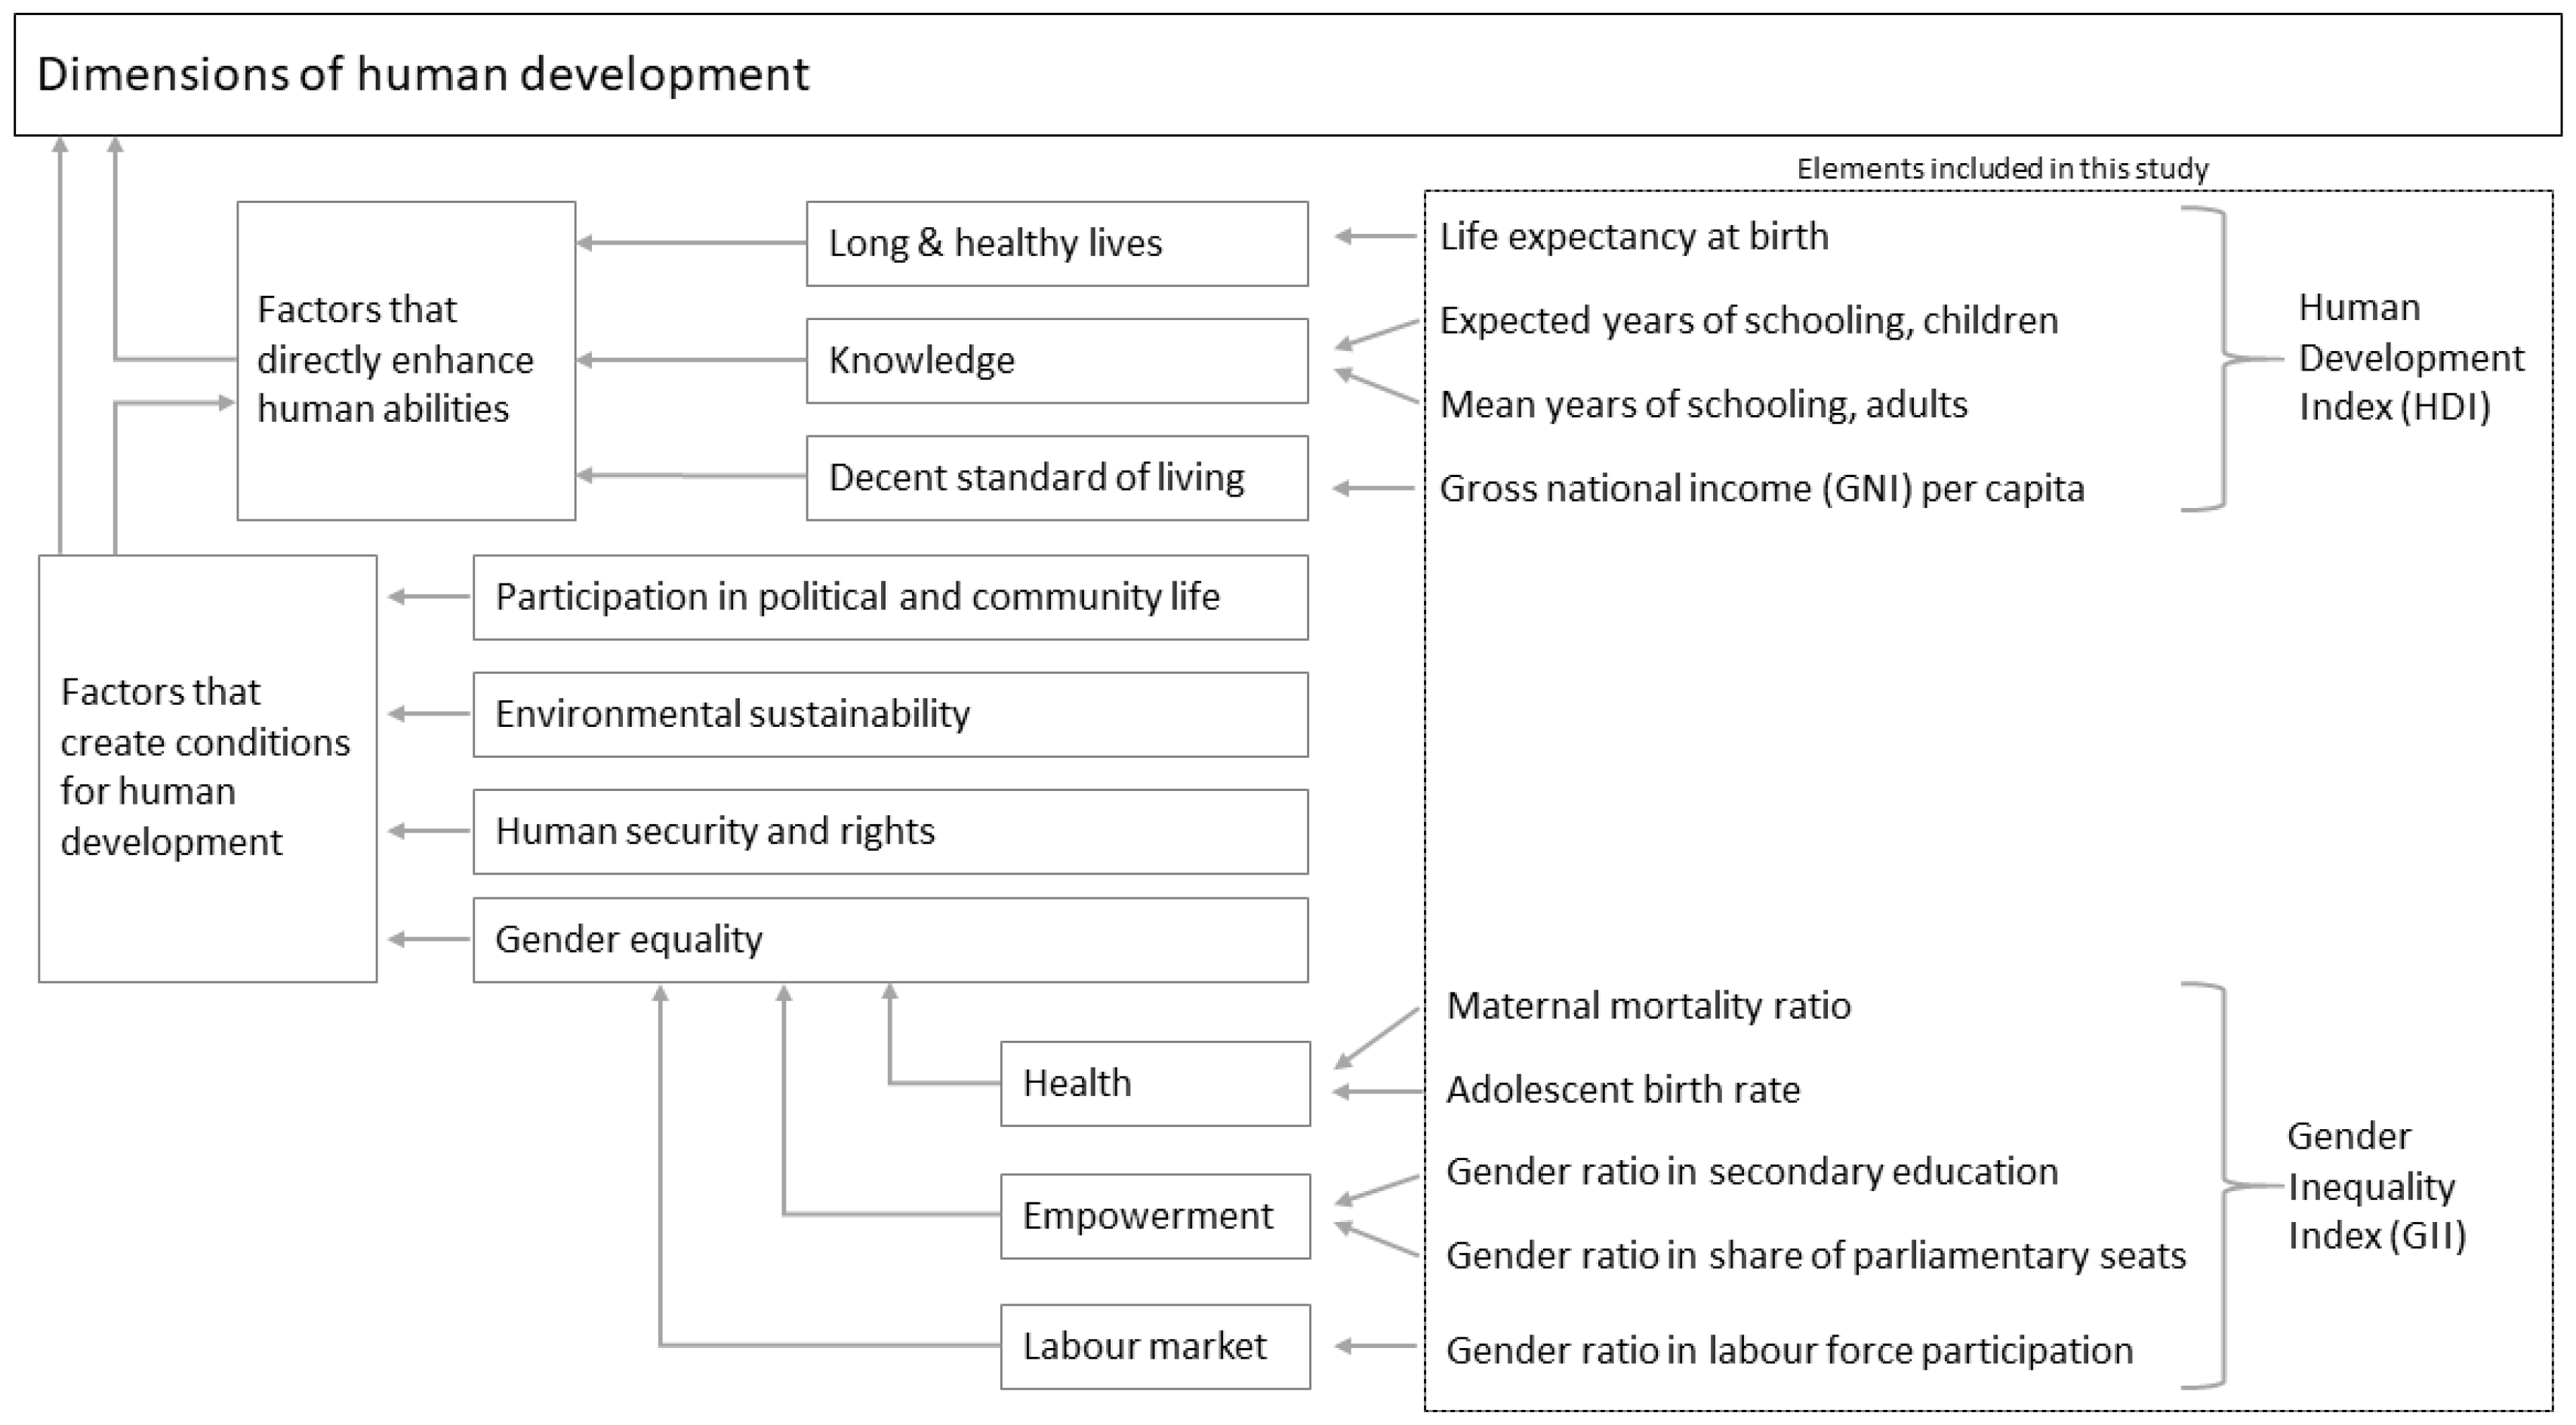
2.1.2. Gender Inequality Index

The Gender Inequality Index (GII) represents the loss in potential human development due to gender inequalities in health, empowerment, and labour market participation. It has been published annually since 2010 and retroactively for every five years between 1995 and 2010, and is available for download from the United Nations Development Programme data centre (UNDP 2021). The values of the GII range from 0 to 1, with higher values representing higher inequality. However, so as to avoid confusion in directionality and make the index comparable to the Human Development Index, the inverse of the GII (representing gender equality) is used in this study. The index is a weighted composite of the following five items:
  • Maternal mortality per 100,000 live births
  • Adolescent births per 1000 women aged 15–19 years
  • The percentage of parliament seats held by women
  • The difference between men and women in secondary education
  • The difference between men and women in labour force participation.
Due to limited data availability, the index does not capture inequalities in unpaid caregiving, asset ownership, childcare support, violence, or participation in community decision making; still, it is the gender index with data on the most countries over the longest period of time. Descriptive statistics for gender equality (the inverse of the GII) are displayed in Table 1 at the end of this section.

2.1.3. Human Development Index

The Human Development Index (HDI) measures the position of countries in several key dimensions of human development. It has been published annually since 1990 and is available for download from the United Nations Development Programme data centre (UNDP 2021). The values of the HDI range from 0 to 1, with higher values representing higher development. The index is a weighted composite of the following four items:
  • Life expectancy at birth
  • Expected years of schooling for a child entering school
  • Mean years of schooling for adults over 25 years
  • Gross national income per capita
The UN publishes a version of the HDI that is adjusted for inequality in distribution of each dimension across the population (IHDI). Data for this index is limited to 2010 onwards, and is therefore not used in this study. However, a preliminary exploration found that the correlations of IHDI with PISA scores in 2012, 2015, and 2018 were very similar to those of HDI. Descriptive statistics for the HDI are displayed in Table 1.

2.1.4. Other Control Variables

To evaluate the possibility that any observed effects were the result of unobserved country effects, additional control variables were included in the analyses (only retained when significant). These were the World Bank classification by income (low, lower-middle, upper-middle, and high-income economies) and the United Nations classification by region (Africa, Asia and Pacific, Eastern Europe, Latin America and Caribbean, Western Europe and other high income).

2.2. Methods

To analyse the association of gender equality and human development with PISA results for the PISA testing cycles 2006–2018 (RQ1), Pearson product–moment correlations between gender equality, human development, and PISA scores (average score, reading score, math score, and science score) were calculated. The independence of the distribution of cases with high gender equality (and high human development) and high (or low) PISA scores was assessed using contingency tables and Pearson’s Chi-squared test with Yates’ continuity correction. Yates’ continuity correction should be used when some groups are small (below 10), and generally results in more conservative Chi-squared statistics. The current analyses were conducted both with and without this correction, and no discrepancies occurred. To evaluate the relationship between change in gender equality, change in human development, and change in PISA scores (RQ2), variables for change were calculated for all cases with PISA assessments in 2006 and 2018 (n = 48), and linear regression analyses were conducted. The PISA change variable is a relative measure and not a measure of absolute growth, due to the rescaling of scores to the OECD average (see PISA technical notes, OECD 2019). To explore the individual items in the composite gender and development indices (RQ3), correlations were calculated for all cases with 2018 data (n = 62), and the relationship of change was regressed for all cases with data in 2006 and 2018 (n = 48).

3. Results

The results presented in the following sections pertain to the analysis of average PISA scores. Analyses were also conducted separately for PISA reading, math, and science, and are reported in the Appendix A, Appendix B and Appendix C.

3.1. The Relationship of Gender Equality and Human Development with PISA Scores

The number of PISA countries with data on gender equality and human development has risen steadily, from 48 in 2006 to 62 in 2018. Over that period, there has been a consistent observed relationship between gender equality, human development, and average PISA scores (Table 2). The correlation between gender equality and average PISA scores has ranged from 0.78 to 0.85, and between human development and average PISA scores from 0.76 to 0.87 (p < 0.001 in all scenarios). The majority of countries that scored above 500 on PISA (the mean score across OECD countries) were, in that same year, above the OECD average in gender equality (between 68% and 81%) and/or human development (between 74% and 88%). In every PISA cycle, 100% of the countries that scored below 420 on PISA (approximately 1 standard deviation below the mean of all countries) were also below the OECD average in both gender equality and human development. The Chi-squared statistics for these contingency tables (although not included here, these can be reproduced from the supplemental material) ranged from 4.7 to 22.5 (p < 0.05) with Yates’ continuity correction, and from 6.0 to 25.5 (p < 0.01) without correction. This indicates that high gender equality and high human development are not independent of the different levels of PISA scores.

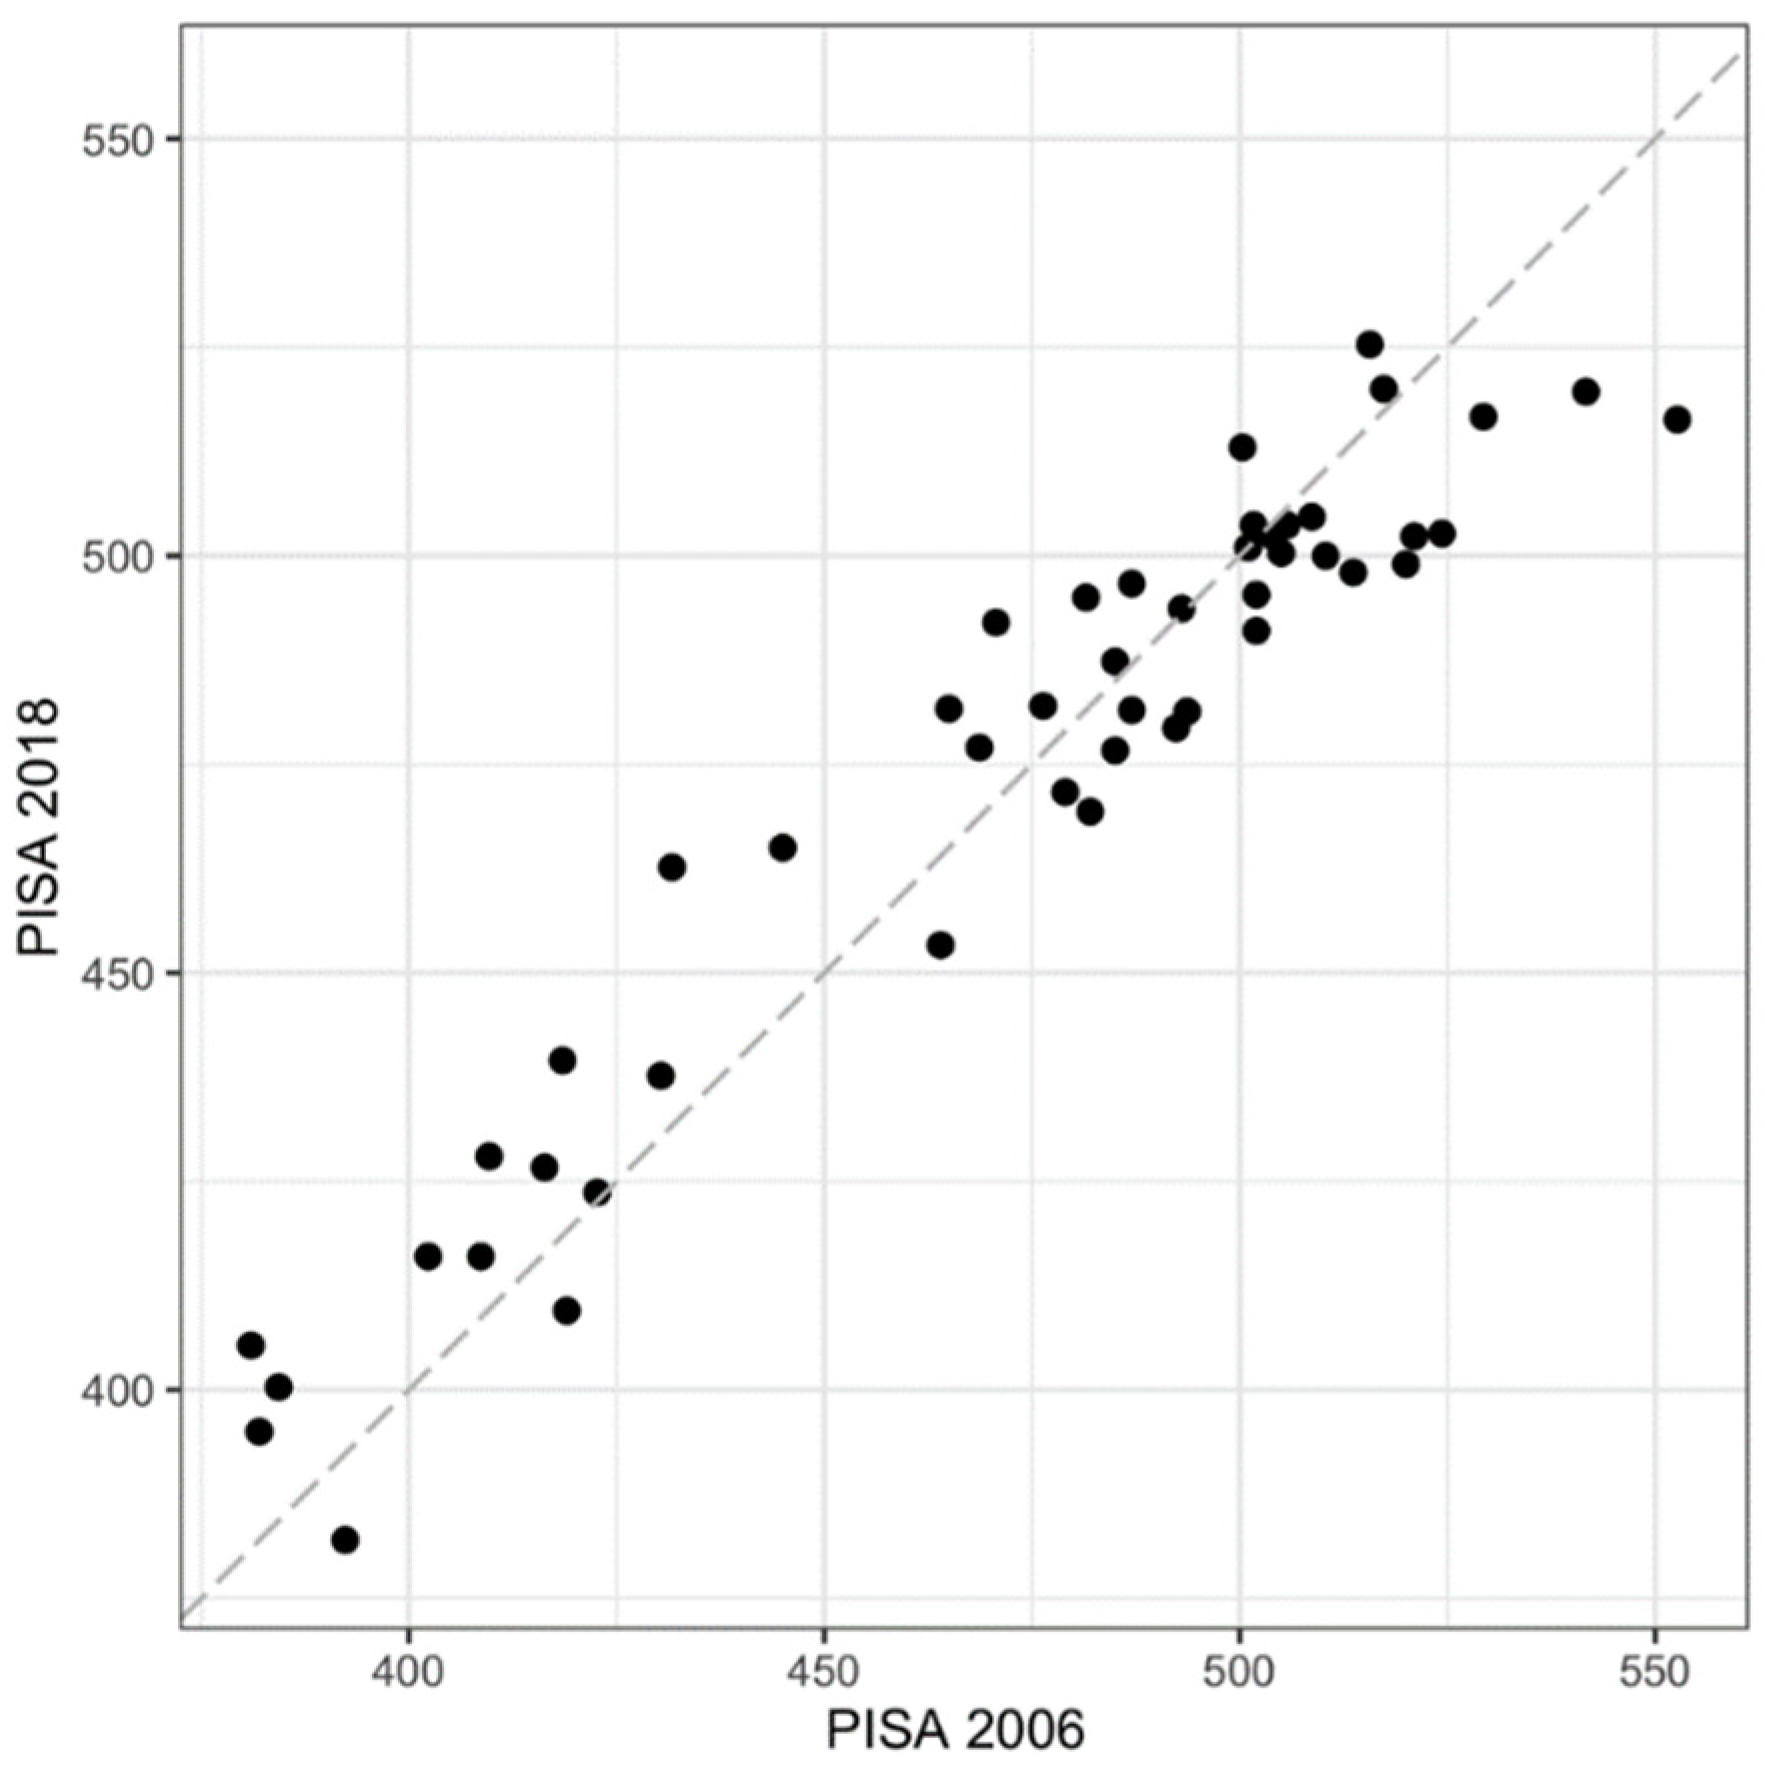
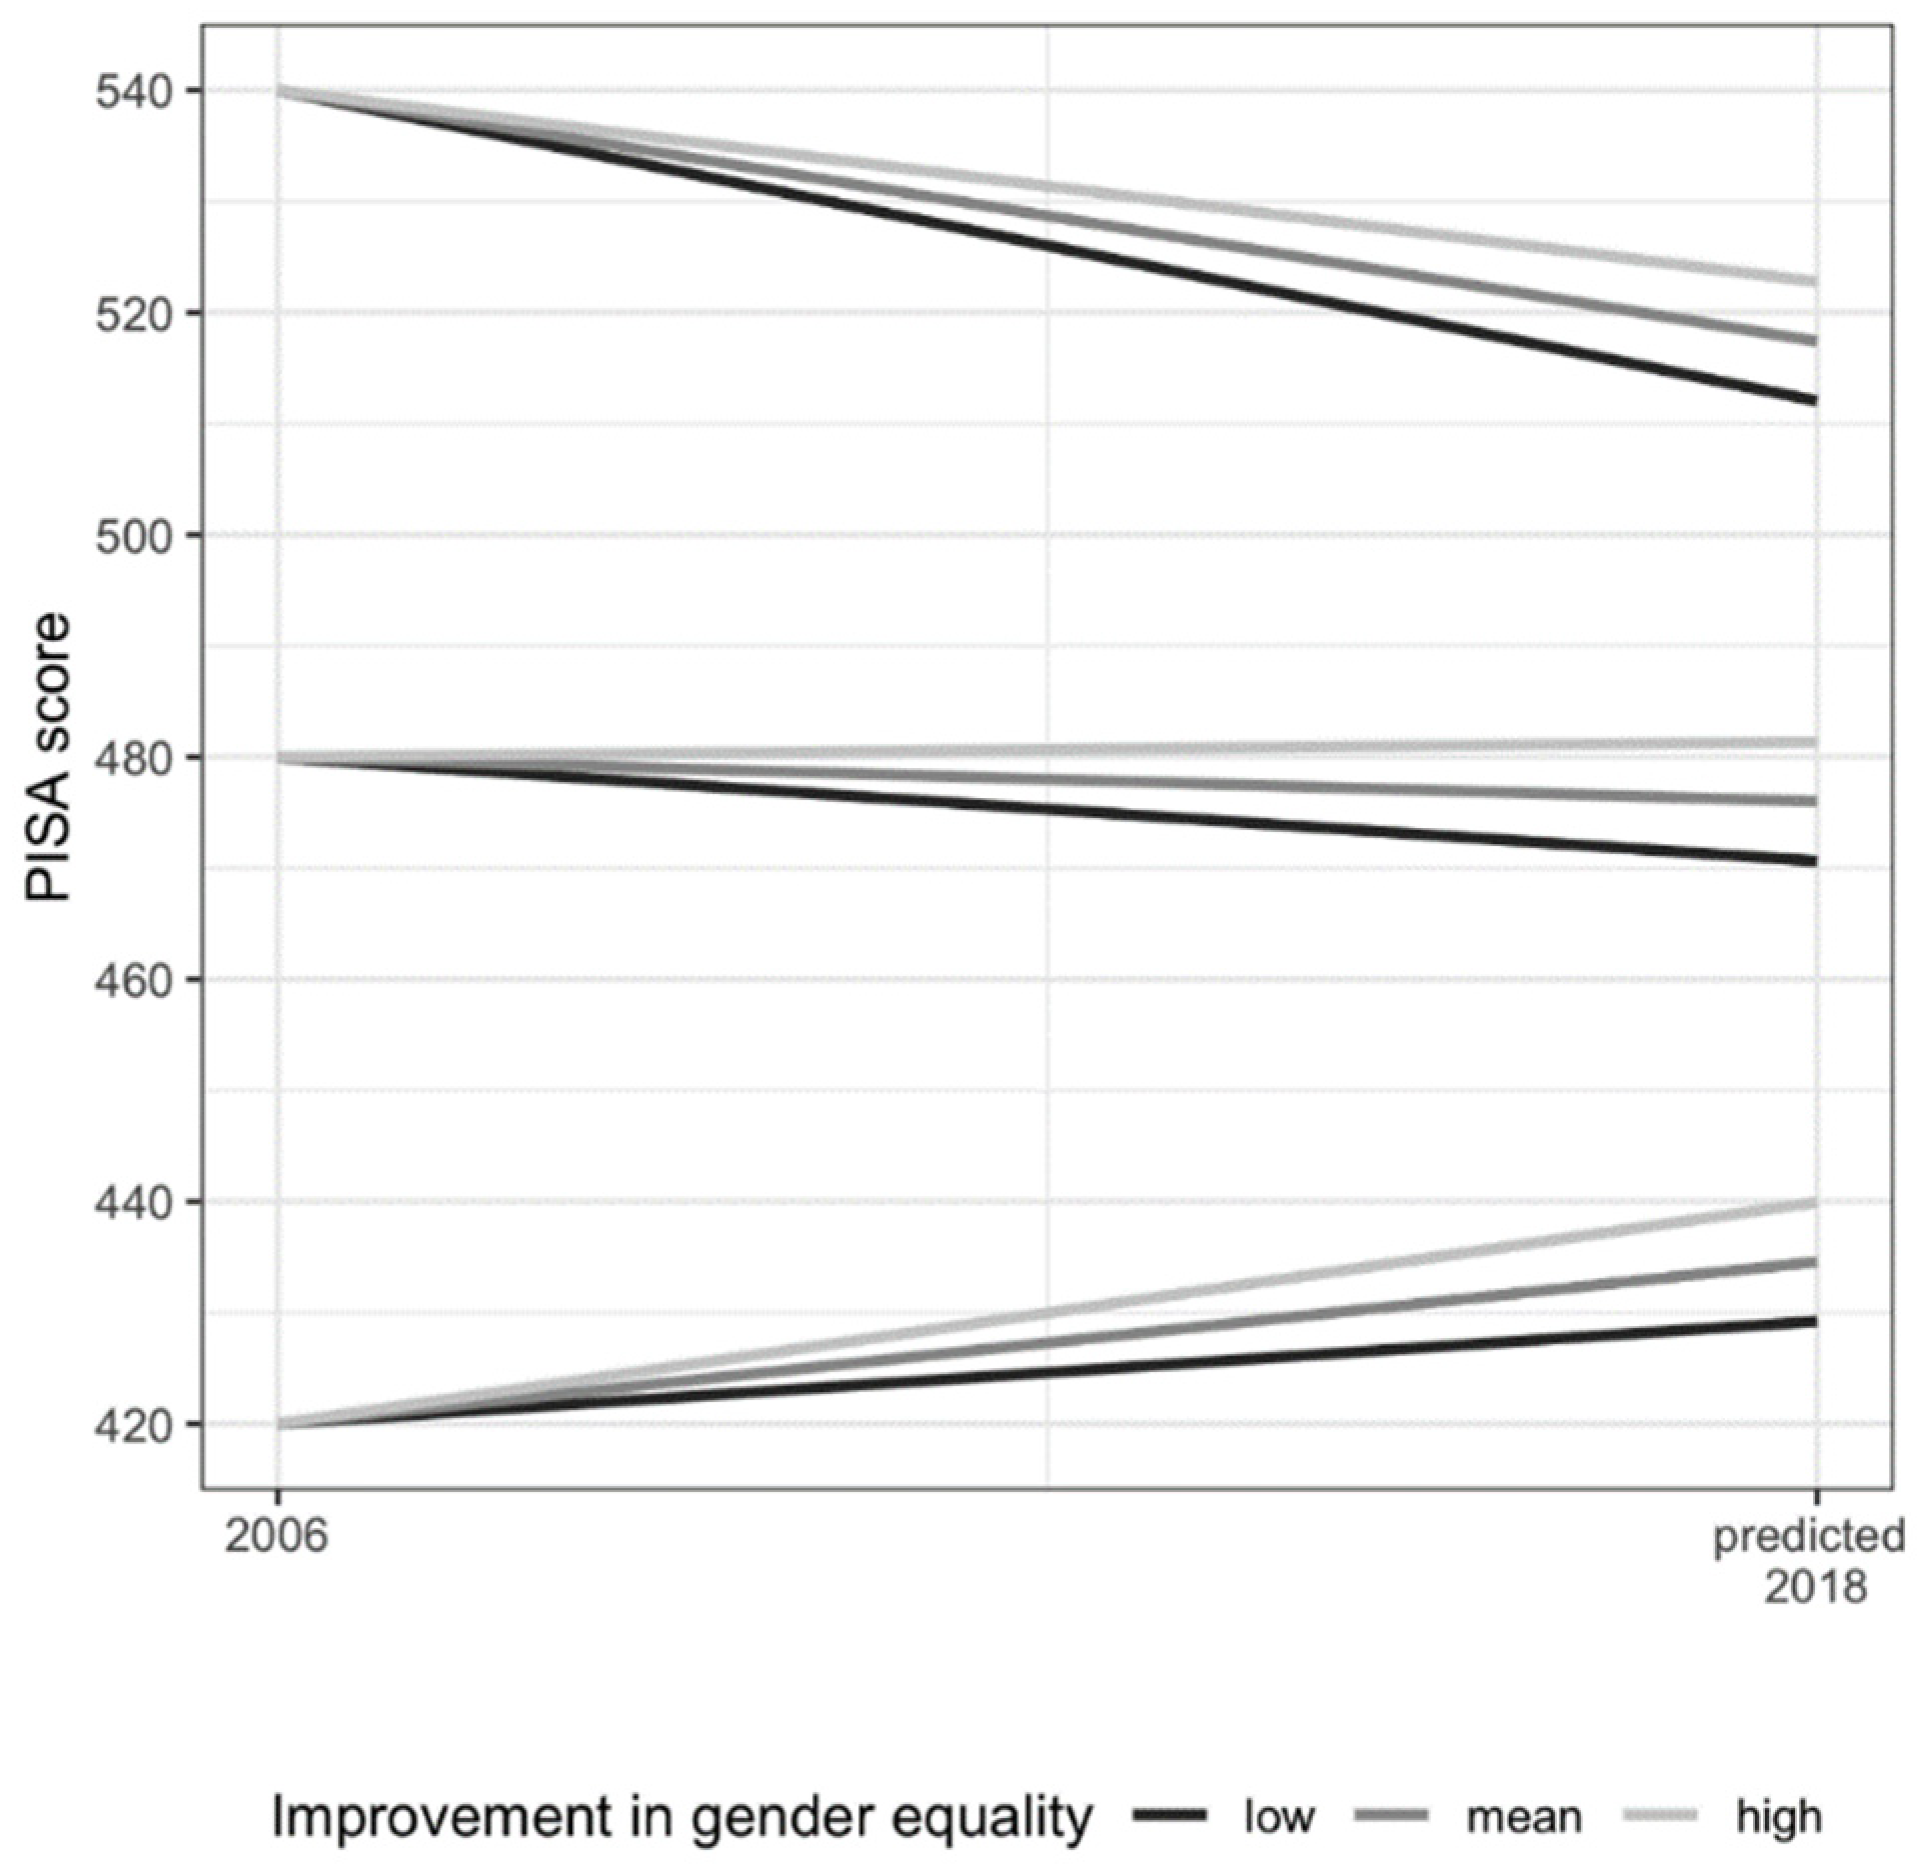
3.2. Change in Gender Equality, Human Development and PISA Scores

Before conducting the statistical analyses, the observed changes in PISA scores were graphed and visually assessed for apparent patterns. Figure 3 plots the relative relationship between PISA 2006 and PISA 2018 scores, with the countries lying above the diagonal line having higher 2018 scores than 2006 scores (which does not necessarily represent absolute growth, due to the scaling of the scores). As can be observed, countries that scored below 500 in PISA 2006 appear to have more frequently increased their score than countries that scored above 500.
To evaluate these patterns of change and to assess the relationship between change in gender equality and human development and change in PISA scores, change variables were created by subtracting the 2006 values from the 2018 values. Table 3 displays the summary statistics and correlation matrices for these variables.
The very high positive correlation between the PISA 2006 and PISA 2018 scores (0.96) indicates that PISA 2006 scores reliably predict PISA 2018 scores; however, the negative correlation between change in PISA scores and PISA 2006 scores (−0.64) indicates that higher PISA 2006 scores are significantly associated with lower growth. Change in both gender equality and human development are significantly correlated with change in PISA scores, and the correlation is stronger for gender equality (0.49 compared with 0.29). We therefore regressed change in PISA scores on change in gender equality and human development (independently and together), controlling for starting values for PISA and country effects (using ‘western Europe and others’ and ‘high income countries’ as dummy variables), to estimate the relationship between these variables.
In all of the tested scenarios (average, reading, math, and science PISA scores, for all students, just girls, and just boys), change in human development was not a significant predictor of change in PISA scores, either independently or when controlling for gender equality, PISA 2006 scores, or country effects. However, in all of the tested scenarios, change in gender equality was statistically significant, even when controlling for PISA 2006 scores, gender equality in 2005, and country effects. These results are displayed in Table 4 and modelled in Figure 4.
These models show that 40% of the variance of change in PISA scores can be accounted for by PISA 2006 score alone, and that there is evidence of possible regression toward the mean. Countries that scored over 475 in PISA 2006 had, on average, a negative change in PISA scores, while countries that scored under 475 in 2006 on average had a positive change in PISA scores, with both effects being greater at the extremes. Including gender equality 2005 and the change in gender equality between 2005 and 2018 increased the explained variance of the model to 58%. An average change in gender equality (at the mean of +0.06) predicted a 10.7-point increase in average PISA scores, and this was similar when scores were disaggregated by gender. In higher scoring countries, the effect of improved gender equality was not sufficient to offset the observed PISA regression toward the mean, while in lower scoring countries these effects compounded to make a doubly positive result.
Controls for country effects are not included in the final models, as the relationships between change in gender equality and change in PISA scores for each group were not significantly different from the largest group in each categorisation (‘western Europe and others’, and ‘high income’, both set as dummy variables). However, using these classifications highlighted the fact that this study does not include any low-income or African countries, and only one country from the lower-middle income group (Indonesia, which has since been reclassified as upper-middle income).

3.3. Items from the Composite Gender and Human Development Indices

Finally, the individual items that make up the composite Gender Inequality Index and Human Development Index were investigated for their relationship with PISA results. The methodological steps in the two preceding sections were applied to each item, and results are summarised in Table 5. All items except the percentage of parliamentary seats held by women were significantly correlated with PISA 2018 scores. However, only positive change in parliamentary seats held by women and positive change in the adolescent birth rate (a reduction in births) were significantly associated with change in PISA scores when controlling for PISA 2006 scores. The items typically considered to be robust predictors of academic performance, (such as wealth or quantity of education), although correlated with PISA results in 2018, did not change substantially between 2006 and 2018 and therefore did not evidence a significant relationship with change in PISA scores.

4. Discussion

The main aims of this study were to explore the longitudinal relationship between gender equality, human development, and PISA scores in order to contribute to political efforts for gender equal human development in a post-COVID-19 world. We found that gender equality was significantly associated with educational results at set time points, and that positive change in gender equality was also associated with positive change in educational results. These findings are important considering the setbacks to gender equality and the interruptions to education provision that have been caused by the COVID-19 pandemic.

4.1. Human Development and PISA

Prior studies have shown that system-level factors are correlated with PISA results, both independently and in combination (Campbell 2021; Meyer and Schiller 2013; Rowley et al. 2020). Correlations in the same direction and of a similar strength were found in this study. Namely, human development and gender equality had significant positive correlations with PISA results at every time point, from 2006 to 2018. However, although having a strong correlation with PISA scores at every time point and displaying consistent positive change over the 12 years of this study, change in the composite human development index was not found to be a statistically significant predictor of change in PISA scores, either independently or when controlling for country effects.
This is counter to the prevailing belief (Meyer and Schiller 2013; Rowley et al. 2019) that economic factors are the most important enabling conditions in education, and that an improvement in human development is the most consistent predictor of improved PISA scores. Our findings indicate that change in gender equality is empirically more important than economic factors.
Future research could consider alternative measures for educational outcomes (for example, other international assessments such as TIMSS or PIRLS, or other educational outcomes such as the OECD’s measures of social and emotional skills), different gender equality indices (such as the World Economic Forum’s Global Gender Gap Index, The OECD’s Social Institutions and Gender Index, or the Economist Intelligence Unit’s Women’s Economic Opportunity Index) and, as data become available, longer trajectories of time, to further explore this relationship.

4.2. Gender Equality and PISA

Observed changes in PISA scores between 2006 and 2018 were consistently predicted by change in gender equality and starting PISA 2006 scores. A total of 58% of the variance in the change in PISA scores was explained by these variables together (18% more than by PISA 2006 scores alone). Not only was the societal level of gender equality a significant predictor of PISA scores at standalone time points; positive changes in gender equality were predictive of positive changes in scores. An average improvement in gender equality between 2006 and 2018 was associated with almost 11 additional PISA points. Some countries such as Portugal had almost twice the average improvement in gender equality over that time, which may explain some of their large improvement in PISA scores.
Of the individual items on the gender inequality index, maternal mortality and adolescent birth rate (2018) displayed strong and significant correlations with PISA 2018 scores, and a reduction in adolescent birth rate (2006–2018) and an increase in the percentage of parliamentary seats held by women (2006–2018) were significantly associated with positive change in PISA scores (2006–2018). There are, therefore, three significant policy implications from the findings in this study: lower maternal mortality rates, fewer adolescent births, and steadily increasing representation of women in parliament have the greatest potential to positively impact PISA scores. However, these independent effects were not as large as the composite effect of gender equality over multiple measures. This suggests that policies for improving gender equality, and subsequently other social outcomes such as education, might be most effective when political efforts focus on the combined effects of multiple intersecting inequalities, rather than any one dimension.
Although the theory that inequality between the sexes is fatal for all was proposed over 200 years ago (de Condorcet 1795), possible explanations for why gender equality is so positive for educational results still remain to be identified. It is conceivable that the implicit messages that girls, boys, and whole communities receive about the potential, respect, and empowerment of women and girls through the educational practices, policies and laws within gender-equal societies have a combined positive effect on educational outcomes for all students. In the absence of additional research, we simply conclude that sustained improvements in women’s health, opportunity, empowerment, and representation are consistently associated with improvements in educational outcomes, as measured by PISA, to the benefit of both boys and girls.
Our findings add to a growing body of work that shows that improving gender equality improves social outcomes for women, men, boys and girls. Despite not focussing on gender gaps in education, the evidence that improving outcomes for women and girls also improves outcomes for boys and men indicates that this is not a zero-sum effort. Future research should explore the impact of improved societal gender equality on gender gaps in education, however, the evidence from this study—that everyone benefits—is encouraging. Policies and initiatives that target societal levels of gender equality, therefore, have the potential to impact positively on diverse social outcomes to everyone’s benefit. In the future, innovative research designs could explore mechanisms that explain why gender equality is important for educational outcomes, and specifically why the indices and items studied here are predictive of PISA scores. Researchers and policymakers should continue to study these positive effects and seek to understand why recent gains in gender equality have not withstood the onslaught of the COVID-19 pandemic.
Previous studies have shown a relationship between income inequality and various social outcomes (Wilkinson and Pickett 2010), and it is important for researchers and policymakers to study whether the effects of multiple inequalities are similar, different, or compounding. Our methodology could be followed by researchers in different disciplines in order to evaluate the relationship between gender equality and other social outcomes such as, depression, delinquency, violence, happiness, social mobility, and peace.

4.3. Interpreting PISA Results over Time

Although not a specific focus of this study, our findings have implications for the future longitudinal study of PISA results. Policymakers have been encouraged to interpret the change over time in PISA scores as primarily the product of change in the quality of education. However, this study has shown that much of that change is explained by the statistical impact of time and scaling. Up to 40% of the variance in PISA score changes is explained by starting PISA scores (in the case of this study, PISA 2006 scores), and that change is, on average, positive for lower scoring countries and negative for higher scoring countries.
Due to the scaling of PISA scores, change over time is relative and not representative of absolute change in scores. It cannot, therefore, be assumed that high-scoring countries that have seen a steady drop in their PISA scores, such as New Zealand, Australia and Finland are suffering from a worsening quality of education, nor can low-scoring countries attribute a steady increase in scores solely to an improved education system. Further disentangling this is beyond the scope of the current study, and could be a topic for future research. Comparative researchers should inform policymakers and other end users of PISA results of the statistical effect of scaling over time, and provide examples for evaluating country level changes through comparison with similar countries and similar starting PISA scores so as to facilitate meaningful interpretation of change, both within countries and across groups of countries.

4.4. Limitations

The cases in this study were restricted to PISA countries with available data on gender equality and human development. Not included, for example, are China and its dependencies, countries from Africa, and almost all low and lower-middle income countries. Findings from this study should not, therefore, be generalised to all countries. In addition, only one measure of academic achievement (PISA scores) was used, and without similar studies with different measures of educational outcomes the findings should not be generalised to all educational outcomes.
The aspects of gender equality and human development that are considered in this study are restrained by the definitions and data that are collected by the UN in their elaboration of the GII and HDI indices. Future research with other indices and different indicators of inequality and development could usefully deepen and broaden the findings of this study.
Finally, we caution against interpreting the associations detected in this study as causal, due to the nature of the data and the non-experimental design of the study. As it is impossible to experiment with or randomly assign levels of gender equality, human development, or educational outcomes to population groups, we are unlikely to ever be able to prove causality. However, if future research confirms that positive change in gender equality is consistently associated with positive change in a broad range of social outcomes, causal relationships may, although not proven, eventually be implied.

5. Conclusions

This study has established that gender equality is a significant predictor of educational outcomes. Researchers should consider gender equality and other system-level factors when evaluating results on international assessments, and policymakers should sustain efforts to improve gender equality in post-COVID-19 societies due to evidence that positive changes in other social areas will follow. Finally, educationalists should continue to promote gender equality both inside and outside their classrooms, confident in evidence that improving gender equality improves educational outcomes for all, boys and girls alike.

Supplementary Materials

The following are available online at https://www.mdpi.com/article/10.3390/socsci10120480/s1.

Author Contributions

Conceptualization, J.A.C. and N.K.; methodology, J.A.C. and J.M.; formal analysis, J.A.C. and J.M.; writing—original draft preparation, J.A.C.; writing—review and editing, J.A.C., J.M. and N.K. All authors have read and agreed to the published version of the manuscript.

Funding

This research received no external funding.

Institutional Review Board Statement

Not applicable.

Informed Consent Statement

Not applicable.

Data Availability Statement

Data is contained within the supplementary material.

Conflicts of Interest

The authors declare no conflict of interest.

Appendix A

Table A1. Characteristics of PISA READING scores, by cycle.
PISA CyclenMean Score (sd)Relationship with Gender EqualityRelationship with Human Development
CorrelationHigh PISA, High Gender Equal (1),(3)Low PISA, High Gender Equal (2),(3)CorrelationHigh PISA, High Human Develop (1),(3)Low PISA, High Human Develop (2),(3)
200646468
(46.1)
0.78 ***73%0%0.81 ***73%0%
200955465
(46.9)
0.83 ***73%0%0.85 ***80%0%
201255473
(43.8)
0.76 ***71%0%0.75 ***77%0%
201558466
(47.5)
0.78 ***75%0%0.82 ***81%0%
201860458
(49.0)
0.80 ***71%0%0.86 ***86%0%
Notes: (1) High PISA: PISA score over 500. (2) Low PISA: PISA score under 420. (3) High gender equality and high human development: score over the OECD average for that year. *** p < 0.001.
Table A2. Change in gender equality as a predictor of change in PISA reading scores, 2006–2018.
PISA Only ModelModels Including Gender Equality
All StudentsGirlsBoys
Intercept111.73 ***116.15 ***122.81 ***116.91 ***
PISA 2006 score−0.23 ***−0.41 ***−0.44 ***−0.41 ***
Gender equality 2005 86.99 ***103.12 ***80.00 ***
Change in gender equality 206.54 ***207.22 ***209.41 **
n45454545
F24.4216.6617.0215.93
p<0.001<0.001<0.001<0.001
Adj. R20.360.520.520.50
Note: *** p < 0.001, ** p < 0.01.

Appendix B

Table A3. Characteristics of PISA MATH scores, by cycle.
PISA CyclenMean Score (sd)Relationship with Gender EqualityRelationship with Human Development
CorrelationHigh PISA, High Gender Equal (1),(3)Low PISA, High Gender Equal (2),(3)CorrelationHigh PISA, High Human Develop (1),(3) Low PISA, High Human Develop (2),(3)
200647473
(51.2)
0.85 ***83%0%0.83 ***78%0%
200955465
(53.8)
0.86 ***87%0%0.87 ***87%0%
201255470
(50.5)
0.81 ***72%0%0.76 ***78%0%
201560462
(51.6)
0.82 ***80%0%0.82 ***80%0%
201859464
(50.1)
0.85 ***88%0%0.86 ***88%0%
Notes: (1) High PISA: PISA score over 500. (2) Low PISA: PISA score under 420. (3) High gender equality and high human development: score over the OECD average for that year. *** p < 0.001.
Table A4. Change in gender equality as a predictor of change in PISA math scores, 2006–2018.
PISA Only ModelModels Including Gender Equality
All StudentsGirlsBoys
Intercept83.86 ***78.26 ***77.78 ***77.96 ***
PISA 2006 score−0.18 ***−0.33 ***−0.32 ***−0.33 ***
Gender equality 2005 84.90 ***85.21 ***86.71 **
Change in gender equality 194.26 ***184.60 ***203.46 ***
n46464646
F20.4314.6314.7013.31
p<0.001<0.001<0.001<0.001
Adj. R20.300.480.480.45
Note: *** p < 0.001, ** p < 0.01.

Appendix C

Table A5. Characteristics of PISA SCIENCE scores, by cycle.
PISA CyclenMean Score (sd)Relationship with Gender EqualityRelationship with Human Development
CorrelationHigh PISA, High Gender Equal (1),(3)Low PISA, High Gender Equal (2),(3)CorrelationHigh PISA, High Human Develop (1),(3)Low PISA, High Human Develop (2),(3)
200648479
(45.0)
0.83 ***72%0%0.82 ***72%0%
200956471
(50.6)
0.85 ***65%0%0.85 ***75%0%
201256478
(47.3)
0.76 ***65%0%0.72 ***70%0%
201559468
(47.4)
0.79 ***68%0%0.81 ***74%0%
201862461
(46.8)
0.80 ***71%0%0.83 ***86%0%
Notes: (1) High PISA: PISA score over 500. (2) Low PISA: PISA score under 420. (3) High gender equality and high human development: score over the OECD average for that year. *** p < 0.001.
Table A6. Change in gender equality as a predictor of change in PISA science scores, 2006–2018.
PISA Only ModelModels Including Gender Equality
All StudentsGirlsBoys
Intercept106.63 ***87.73 ***85.42 ***93.21 ***
PISA 2006 score−0.23 ***−0.24 ***−0.24 ***−0.26 ***
Gender equality 2005 18.1320.0619.37
Change in gender equality 156.04 ***149.93 ***161.14 ***
n48484848
F41.1224.7521.6421.25
p<0.001<0.001<0.001<0.001
Adj. R20.460.600.570.56
Note: *** p < 0.001.

References

  1. Audette, Andre. 2019. Gender Equality Supports Happiness and Wellbeing. The Gender Policy Report. September 13. Available online: https://genderpolicyreport.umn.edu/gender-equality-supports-happiness/ (accessed on 10 December 2021).
  2. Bandiera, Oriana, and Ashwini Natraj. 2013. Does gender inequality hinder development and economic growth? Evidence and policy implications. The World Bank Research Observer 28: 2–21. [Google Scholar] [CrossRef] [Green Version]
  3. Barber, Michael, and Mona Mourshed. 2007. How the World’s Best-Performing School Systems Come out on Top. London: McKinsey, Available online: https://www.mckinsey.com/industries/public-and-social-sector/our-insights/how-the-worlds-best-performing-school-systems-come-out-on-top (accessed on 10 December 2021).
  4. Breakspear, Simon. 2014. How Does PISA Shape Education Policymaking? Why How We Measure Learning Determines What Counts in Education. Melbourne: Center for Strategic Education. [Google Scholar]
  5. Campbell, Janine A. 2021. The moderating effect of gender equality and other factors on PISA and education policy. Education Sciences 11: 10. [Google Scholar] [CrossRef]
  6. Capar, Robin-Ivan. 2021. Wage Gap between Women and Men in Norway Increased for the First Time in Five Years. Norway Today. March 8. Available online: https://norwaytoday.info/finance/the-wage-gap-between-women-and-men-in-norway-increased-for-the-first-time-in-five-years/ (accessed on 10 December 2021).
  7. Casale, Daniela, and Dorrit Posel. 2021. Gender inequality and the COVID-19 crisis: Evidence from a large national survey during South Africa’s lockdown. Research in Social Stratification and Mobility 71: 1–5. [Google Scholar] [CrossRef]
  8. Clark, Helen. 2021. The Global Perspective of Equality: Leading for all. Key Note Speaker at SHE Conference, Oslo, Norway, March 5–19. Available online: https://www.sheconference.no (accessed on 5 March 2021).
  9. de Condorcet, Marquis. 1795. Outlines of an Historical View of the Progress of the Human Mind. London: J. Johnson. [Google Scholar]
  10. Djerf-Pierre, Monika. 2011. The difference engine: Gender equality, journalism and the good society. Feminist Media Studies 11: 43–51. [Google Scholar] [CrossRef]
  11. Elliot, Julian, Lazar Stankov, Jihyun Lee, and Jens F. Beckmann. 2019. What did PISA and TIMSS ever do for us? The potential of large-scale datasets for understanding and improving educational practice. Comparative Education 55: 133–55. [Google Scholar] [CrossRef]
  12. Ergas, Christina, Patrick Trent Greiner, Julius Alexander McGee, and Matthew Thomas Clement. 2021. Does gender climate influence climate change? The multi-dimensionality of gender equality. Sustainability 13: 3956. [Google Scholar] [CrossRef]
  13. European Institute for Gender Equality. 2021. Gender Equality in Academia and Research: Rationale for Gender Equality Change in Research and Higher Education Institutions. Available online: https://eige.europa.eu/gender-mainstreaming/toolkits/gear/advocacy (accessed on 10 December 2021).
  14. European Parliament. 2021. Improving Gender Equality during and after the COVID-19 Crisis. European Parliament Press Release. January 21. Available online: https://www.europarl.europa.eu/news/en/press-room/20210115IPR95718/improving-gender-equality-during-and-after-the-covid-19-crisis (accessed on 10 December 2021).
  15. Grey, Sue, and Paul Morris. 2018. PISA: Multiple ‘truths’ and mediatised global governance. Comparative Education 54: 109–31. [Google Scholar] [CrossRef] [Green Version]
  16. Heise, Lori, Margaret E. Greene, Neisha Opper, Maria Stavropoulou, Caroline Harper, Marcos Nascimento, and Debrework Zewdie. 2019. Gender inequality and restrictive gender norms: Framing the challenges to health. Lancet 393: 2440–54. [Google Scholar] [CrossRef]
  17. Holter, Øystein. 2014. What’s in it for men? Old question, new data. Men and Masculinities 17: 515–48. [Google Scholar] [CrossRef]
  18. Husu, Liisa, Lihadh Al-Gazali, Virginia Valian, Ben Barres, Ling-An Wu, Eva Y. Andrei, Jo Handelsman, and Corinne Moss-Racusin. 2013. Scientists of the world speak up for equality. Nature 495: 35–38. [Google Scholar] [CrossRef] [Green Version]
  19. Kamens, David. 2013. Globalization and the emergence of an audit culture: PISA and the search for ‘best practices’ and magic bullets. In PISA, Power, and Policy: The Emergence of Global Educational Governance. Edited by Heinz-Dieter Meyer and Aaron Benavot. Oxford: Symposium Books Ltd, Chapter 6. pp. 117–39. [Google Scholar]
  20. Khan, Sadiq. 2021. The Global Perspective of Equality: Leading for all. Key Note Speaker at SHE Conference, Oslo, Norway, March 5–19. Available online: https://www.sheconference.no (accessed on 5 March 2021).
  21. Komatsu, Hikaru, and Jeremy Rappleye. 2017. A new global policy regime founded on invalid statistics? Hanushek, Woessmann, PISA, and economic growth. Comparative Education 53: 166–91. [Google Scholar] [CrossRef]
  22. Lawson, Sandra. 2008. Women Hold up Half the Sky. Goldman Sachs Economic Research 164: 1–16. Available online: https://www.goldmansachs.com/insights/investing-in-women/bios-pdfs/women-half-sky-pdf.pdf (accessed on 10 December 2021).
  23. Madgavkar, Anu, Olivia White, Mekala Krishnan, Deepa Mahajan, and Xavier Azcue. 2020. COVID-19 and Gender Equality: Countering the Regressive Effects. McKinsey Global Institute. July 15. Available online: https://www.mckinsey.com/featured-insights/future-of-work/covid-19-and-gender-equality-countering-the-regressive-effects (accessed on 10 December 2021).
  24. McKinney, Laura A., and Gregory M. Fulkerson. 2015. Gender equality and climate justice: A cross-national analysis. Social Justice Research 28: 293–317. [Google Scholar] [CrossRef]
  25. Meier, Markus, and Heike Diefenbach. 2020. The OECD between political and scientific agendas—A critique of the 2015 PISA gender report. Gender and Education 32: 626–45. [Google Scholar] [CrossRef]
  26. Meyer, Heinz-Dieter, and Kathryn Schiller. 2013. Gauging the role of non-educational effects in large-scale assessments: Socio-economics, culture and PISA outcomes. In PISA, Power, and Policy: The Emergence of Global Educational Governance. Edited by Heinz-Dieter Meyer and Aaron Benavot. Oxford: Symposium Books Ltd, Chapter 10. pp. 207–24. [Google Scholar]
  27. Meyer, Heinz-Dieter, and Katie Zahedi. 2014. Open letter to Andreas Schleicher. Policy Futures in Education 12: 872–77. [Google Scholar] [CrossRef]
  28. Mill, John. 1869. The Subjection of Women. London: Longmans, Green, Reader, and Dyer. [Google Scholar]
  29. Morse, Michelle, and Geeta Gupta. 2020. Taking Stock of 2020: Glaring Inequality for Girls’ and Women’s Rights, and a Pivotal Year Ahead. United Nations Foundation. December 15. Available online: https://unfoundation.org/blog/post/taking-stock-2020-glaring-inequality-girls-womens-rights-pivotal-year-ahead/ (accessed on 15 December 2020).
  30. Mourshed, Mona, Chinezi Chijioke, and Michael Barber. 2010. How the World’s Most Improved School Systems Keep Getting Better. London: McKinsey, Available online: https://www.mckinsey.com/industries/public-and-social-sector/our-insights/how-the-worlds-most-improved-school-systems-keep-getting-better (accessed on 10 December 2021).
  31. OECD. 1999. Measuring Student Knowledge and Skills: A New Framework for Assessment. Paris: OECD Publishing, Available online: http://www.oecd.org/education/school/programmeforinternationalstudentassessmentpisa/33693997.pdf (accessed on 10 December 2021).
  32. OECD. 2014. Response of OECD to points raised in Heinz-Dieter Meyer and Katie Zahedi, ‘Open Letter’. Policy Futures in Education 12: 878–79. [Google Scholar] [CrossRef] [Green Version]
  33. OECD. 2015. The ABC of Gender Equality in Education: Aptitude, Behaviour, Confidence. Paris: OECD Publishing. [Google Scholar] [CrossRef] [Green Version]
  34. OECD. 2017. The Pursuit of Gender Equality: An Uphill Battle. Paris: OECD Publishing. [Google Scholar] [CrossRef]
  35. OECD. 2019. PISA 2018 Results (Volume I): What Students Know and Can Do. Paris: OECD Publishing. [Google Scholar] [CrossRef]
  36. OECD. 2021. PISA: Programme for International Student Assessment. Available online: https://www.oecd.org/pisa/data/ (accessed on 10 December 2021).
  37. R Core Team. 2021. R: A Language and Environment for Statistical Computing. Vienna: R Foundation for Statistical Computing, Available online: https://www.R-project.org (accessed on 10 December 2021).
  38. Ratele, Kopano. 2014. Gender equality in the abstract and practice. Men and Masculinities 17: 510–14. [Google Scholar] [CrossRef]
  39. Roberts-Holmes, Guy, and Peter Moss. 2021. Neoliberalism and Early Childhood Education: Markets, Imaginaries and Governance. New York: Routledge. [Google Scholar]
  40. Rowley, Kristie J., Shelby M. McNeill, Mikaela J. Dufur, Chrisse Edmunds, and Jonathan A. Jarvis. 2019. Trends in international PISA scores over time: Which countries are actually improving? Social Sciences 8: 231. [Google Scholar] [CrossRef] [Green Version]
  41. Rowley, Kristie J., Chrisse C. Edmunds, Mikaela J. Dufur, Jonathan A. Jarvis, and Florencia Silveira. 2020. Contextualising the achievement gap: Assessing educational achievement, inequality, and disadvantage in high-income countries. Comparative Education 56: 459–83. [Google Scholar] [CrossRef]
  42. RStudio Team. 2021. RStudio: Integrated Development for R. Boston: RStudio, PBC, Available online: http://www.rstudio.com/ (accessed on 10 December 2021).
  43. Sobe, Noah. 2018. Problematizing comparison in a post-exploration age: Big data, educational knowledge, and the art of criss-crossing. Comparative Education Review 62: 325–43. [Google Scholar] [CrossRef]
  44. Trudeau, Justin. 2021. The Global Perspective of Equality: Leading for all. Key Note Speaker at SHE Conference, Oslo, Norway, March 5–19. Available online: https://www.sheconference.no (accessed on 5 March 2021).
  45. UNDP (United Nations Development Programme). 2015. What Is Human Development. Human Development Reports. Available online: http://hdr.undp.org/en/content/what-human-development (accessed on 10 December 2021).
  46. UNDP (United Nations Development Programme). 2020. The Next Frontier: Human Development and the Anthropocene. Human Development Report 2020. New York: United Nations Development Programme, ISBN 978-9-21-126442-5. [Google Scholar]
  47. UNDP (United Nations Development Programme). 2021. Human Development Data Center. Available online: http://hdr.undp.org/en/data (accessed on 10 December 2021).
  48. Unterhalter, Elaine. 2005. Global inequality, capabilities, social justice: The millennium development goal for gender equality in education. International Journal of Educational Development 25: 111–22. [Google Scholar] [CrossRef]
  49. Unterhalter, Elaine. 2014a. Thinking about gender in comparative education. Comparative Education 50: 112–26. [Google Scholar] [CrossRef]
  50. Unterhalter, Elaine. 2014b. Walking backwards into the future: A comparative perspective on education and a post-2015 framework. Compare: A Journal of Comparative and International Education 44: 852–73. [Google Scholar] [CrossRef]
  51. Wickham, Hadley. 2016. ggplot2: Elegant Graphics for Data Analysis. New York: Springer. [Google Scholar]
  52. Wilkinson, Richard, and Kate Pickett. 2010. The Spirit Level: Why Equality Is Better for Everyone. London: Penguin Books. [Google Scholar]
  53. World Bank. 2001. Engendering Development through Gender Equality in Rights, Resources, and Voice. A World Bank Policy Research Report. Oxford: Oxford University Press. [Google Scholar]
  54. World Bank. 2011. Gender Equality and Development. World Bank Report 2012. Washington, DC: The World Bank. [Google Scholar] [CrossRef]
  55. World Economic Forum. 2019. Global Gender Gap Report, 2020. World Economic Forum Insight Report. Geneva: World Economic Forum, ISBN-13 978-2-940631-03-2. [Google Scholar]
  56. World Economic Forum. 2021. Mind the 100-Year Gap. Available online: https://www.weforum.org/reports/gender-gap-2020-report-100-years-pay-equality (accessed on 10 December 2021).
  57. Xiaomin, Li, and Euan Auld. 2020. A historical perspective on the OECD’s ‘humanitarian turn’: PISA for development and the learning framework 2030. Comparative Education 56: 503–21. [Google Scholar] [CrossRef]
Figure 1. Dimensions of human development.
Socsci 10 00480 g001
Figure 2. Conceptual model.
Socsci 10 00480 g002
Figure 3. Observed relationship between PISA 2006 and PISA 2018 scores.
Socsci 10 00480 g003
Figure 4. Relationship between change in gender equality and change in PISA scores, controlling for PISA 2006 and gender equality 2005.
Socsci 10 00480 g004
Table 1. Descriptive statistics PISA (average score), gender equality, and human development.
PISA
Cycle
nPISA Average ScoreGender EqualityHuman Development
Mean (All)sdMean (OECD)Mean (All)sdMean (OECD)Mean (All)sdMean (OECD)
20064847445.94960.7750.1380.8340.8290.0720.865
20095846550.85000.7730.1310.8520.8220.0750.872
20125747247.14970.7990.1230.8590.8390.0710.880
20156146448.94920.7990.1310.8740.8440.0750.892
20186246048.04910.8160.1300.8880.8540.0690.898
Table 2. Relationship of PISA (average) with gender equality and human development.
PISA CyclenRelationship with Gender EqualityRelationship with Human Development
CorrelationHigh PISA, High Gender Equal (1),(3)Low PISA, High Gender Equal (2),(3)CorrelationHigh PISA, High Human Develop (1),(3)Low PISA, High Human Develop (2),(3)
2006480.83 ***79%0%0.83 ***74%0%
2009580.85 ***75%0%0.87 ***81%0%
2012570.78 ***68%0%0.76 ***74%0%
2015610.80 ***68%0%0.82 ***79%0%
2018620.83 ***81%0%0.86 ***88%0%
Notes: (1) High PISA: PISA score over 500. (2) Low PISA: PISA score under 420. (3) High gender equality and high human development: score over the OECD average for that year. *** p < 0.001.
Table 3. Summary statistics for change variables (PISA average score).
Correlations
VariablenMeansd12345
1 PISA 20184847438.31
2 PISA 20064847445.90.96 ***1
3 Change in PISA 2006–201848014.3−0.39 **−0.64 ***1
4 Change in gen. equal. 2005–2018480.0620.043−0.08−0.220.49 ***1
5 Change in human dev. 2006–2018480.0410.018−0.26−0.30 *0.29 *0.31 *1
Note: *** p < 0.001, ** p < 0.01, and * p < 0.05.
Table 4. Change in gender equality as a predictor of average change in PISA scores, 2006–2018.
PISA Only ModelModels Including Gender Equality
All StudentsGirlsBoys
Intercept94.97 ***90.09 ***92.83 ***88.89 ***
PISA 2006 score−0.20 ***−0.31 ***−0.32 ***−0.29 ***
Gender equality 2005 56.76 *63.86 ***49.07 *
Change in gender equality 178.71 ***173.11 ***178.61 ***
n48484848
F31.9722.6022.3720.24
p<0.001<0.001<0.001<0.001
Adj. R20.400.580.580.55
Note: *** p < 0.001, and * p < 0.05.
Table 5. Characteristics of items on Human Development and Gender Inequality Indices for 48 countries, with PISA scores for 2006 and 2018.
ItemMean 2018 (sd)Correlation with PISA 2018Mean Change 2005(6)–2018Correlation of Change with Change in PISA Significant in Regression Controlling for PISA 2006
Human Development:
Life expectancy at birth79.7 (3.1)0.63 ***2.670.16-
Expected years of schooling, child16.4 (1.8)0.50 ***1.050.09-
Mean years of schooling, adults11.6 (1.6)0.74 ***0.890.08-
Gross National Income$34,260 (14,287)0.79 ***$1640.24-
Gender Equality:
Maternal mortality per 100,000 births14.1 (14.6)−0.77 ***−4.09−0.33 *-
Adolescent births per 1000 women 15–1918.3 (18.5)−0.87 ***−6.76−0.47 **yes
Percentage of parliament seats (women)27% (9.9)0.276.75%0.42 *yes
Percentage of women with secondary ed.85% (16.2)0.63 ***8.83%0.30 *-
Gender difference in labour force particip.15% (8.4)0.57 ***−3.30%0.05-
Note: *** p < 0.001, ** p < 0.01, and * p < 0.05.
Publisher’s Note: MDPI stays neutral with regard to jurisdictional claims in published maps and institutional affiliations.

