Article

Observation to Building Thermal Characteristic of Green Façade Model Based on Various Leaves Covered Area

1
Department of Architectural Design, Vocational School, Diponegoro University, Semarang 50275, Indonesia
2
Department of Mechanical Engineering, Faculty of Engineering, Diponegoro University, Semarang 50275, Indonesia
3
Faculty of Integrated Technologies, Universiti Brunei Darussalam, Jalan Tungku Link, Gadong BE1410, Brunei Darussalam
*
Author to whom correspondence should be addressed.
Buildings 2019, 9(3), 75; https://doi.org/10.3390/buildings9030075
Submission received: 26 February 2019 / Revised: 12 March 2019 / Accepted: 20 March 2019 / Published: 26 March 2019

Abstract

:
This project is part of research series to observe the thermal characteristic of green facade to minimize the cooling load inside building. The aim is to analyze the building thermal characteristic on the green facade installed on a building model. Various kinds of leaves covered area (experiment I: 0%, experiment II: 50%, and experiment III: 90%) were used as the main parameter. Calculation in decrement factor and time lag were also done in order to support the analysis of heat flows calculations. Data measurement showed that ambient and facade surface of green facade with the greatest leaves covered area (experiment III) had lower temperature profiles. Data calculation also showed the highest of average heat flows were found out in the bare wall model. Results for heat flow in the wall surface were 4.69 W/m2 (experiment I), 3.88 W/m2 (experiment II), and 1.61 W/m2 (experiment III). While for heat flows through indoor air space, they were 27.75 W/m2 (experiment I), −5.10 W/m2 (experiment II), and 8.99 W/m2 (experiment III). As shown from data analysis, the quantities of leaves covered area effected the cooling down on the building envelope by reducing the quantity of heat flows from exterior to interior side.

1. Introduction

Walls covered by vegetation can potentially reduce the cooling load due to solar radiation. Research conducted by Krushe et al. [1] proved that the biological function of vegetation acted as a solar barrier both for external and internal environments. The same points were also revealed by Eggenberger [2], where biological functions of vegetation, convection due to energy absorbed, and evaporation from foliage influenced the thermal load from long wave solar radiation. Compared to bare wall sections, the value of the absorption coefficient of walls covered by plants was reduced about one third [3]. Furthermore, Eumorfopoulou and Kontoleon [3] found that the vegetation that covered up the building façade surface significantly restricted the effect of outdoor thermal conditions, include changes in the direction of air flow. Thus, the development of plant covered walls has become an alternative method to minimize solar radiation effects and maintain properly the microclimate around the built area.
In tropical areas, façades and roofs are parts of the building that receive the greatest impact of solar radiation. As a result, the temperature inside buildings will increase rapidly. Previous studies proved that façades covered by plants and roof gardens can reduce thermal loads and prevent overheating conditions inside buildings, especially during the summer period when solar radiation is very strong [4,5,6,7]. Particularly, in the microclimate around buildings, the greenery applications contribute in decreasing the urban heat island (UHI) effects that cause increasing temperatures around urban areas [8,9]. Similar to other green infrastructures, green façades are considered as a future design to increase energy savings.
Applying a vertical greenery system in a building means the vertical greenery system is part of the building’s insulation element, where the impact of insulation materials in building components is determined by the low conductivity value [10]. Possibility, temperature decreases in buildings with vertical greenery systems indicate that this greenery system has lower thermal conductivity.
Previously, series of thermal analyses of green façades were done to study the thermal effects of greenery systems not only on the building but also on the environment. In 1982, Minke and Witter [11] proved that reducing wind speed by green façades can also reduce the coefficient of heat transfer on the exterior surface from 25.0 Wm−2K−1 to 7.8 Wm−2K−1, which is comparable to the coefficient of heat transfer on the heat convection coefficient. This research was then improved by Perini et al. [12] using foliage densities as one of the variables. Results showed that high density foliage could improve the performance of the insulation system on the vertical greenery system by reducing wind velocity that caused a static air layer in the foliage; therefore, the profile of air velocity between the indoor and outdoor sides was the same: Routdoor = Rindoor, where R is thermal resistance. In this study, building thermal resistance was improved by 0.09 m2KW−1. Nevertheless, in these studies, there was no detailed information related to quantity of the foliage densities.
Field measurement and computer modelling using DEROB (dynamic energy response of buildings) was also done by Holm to show that leaf covered walls had the potential to improve building thermal performance [13]. In this study, Holm [13] used a model that utilized the outer surface of the building with a spectrum of absorptance that resembled a greenery layer building with the entire leaves covered area equipped with multiple air spaces, inlet and outlet, thermal resistances, and thermal mass.
Holm [13] also found that the foliage of the green layer made walls covered by climbing plants have different heat transfer mechanisms compared to bare walls, where outer layers of leaves act as filters, while the inner layers worked as insulation. When the covering ratio of the green layer increased, the insulation characteristic (thermal resistance) of the building envelope also increased [14,15,16].
Another study using a modelling approach was also done by Suklje et al. [17] about the thermal response of a vertical greenery system on the building envelope. Modelling of a vertical greenery system was presented as a homogenous layer of the building envelope. In this study, the green layer was substituted with a homogenous layer that had apparent thermo–physical properties. Results showed that the predicted temperature of the vertical greenery system deviated by less than ±1.3 °C, while heat flux on the inner side of the building envelope deviated by less than ±0.3 W/m2 compared to measured values.
Furthermore, based on a large experiment was using eight standing walls of a vertical greenery system conducted by Wong et al. [18] concluded that average temperature reductions up to 4.36 °C occurred during the afternoon. Referring to these research studies, the amount of temperature decreases affected by the interaction among leaf areas, geometry, color of vegetation, and microclimatic parameters that resulting in the efficiency of cooling effect was different between these research studies.
Widiastuti et al. [15] also found that the lowest difference up to 0.30 °C between exterior and interior surfaces temperature occurred on the green façade with higher leaves densities. Using the Newton cooling law calculation, the authors also found that during day time, heat flux on the green façades with higher leaves densities was negative.
Based on these previous works, it can be observed that foliage densities or leaves covered area are important parameters that influence the effectiveness of temperature decreases on building surfaces. However, research studying the effects of leaves densities or covering ratio in greenery layer is rare. Lack of experiments referring to the total energy savings related to these parameter make it possible to develop this research.
This is part of a research series where leaves densities (percentage of leaves covered area) was used as the main parameter for observation [15]. The present study aimed to observe the thermal characteristics of the model with green façade under various kinds of leaves covered areas. Calculation of the time lag and decrement factor were done as important characteristics to determine the heat storage capabilities of the green façade model. Research on the heat flow then became the main objective to investigate thermal characteristics between the bare wall model and green façade models.
The initial hypothesis was that the model with the greatest leaves covered area will have the longest time lag and the lowest decrement factor. Furthermore, the model with the greatest leaves covered area will also have less heat flow due to the protection provided by plant foliage from solar radiation. In order to achieve the research objective, comparison of data measurements from three experiments of green façade models with different leaves covered areas were conducted in December 2013.

2. Research Method

2.1. Object Study

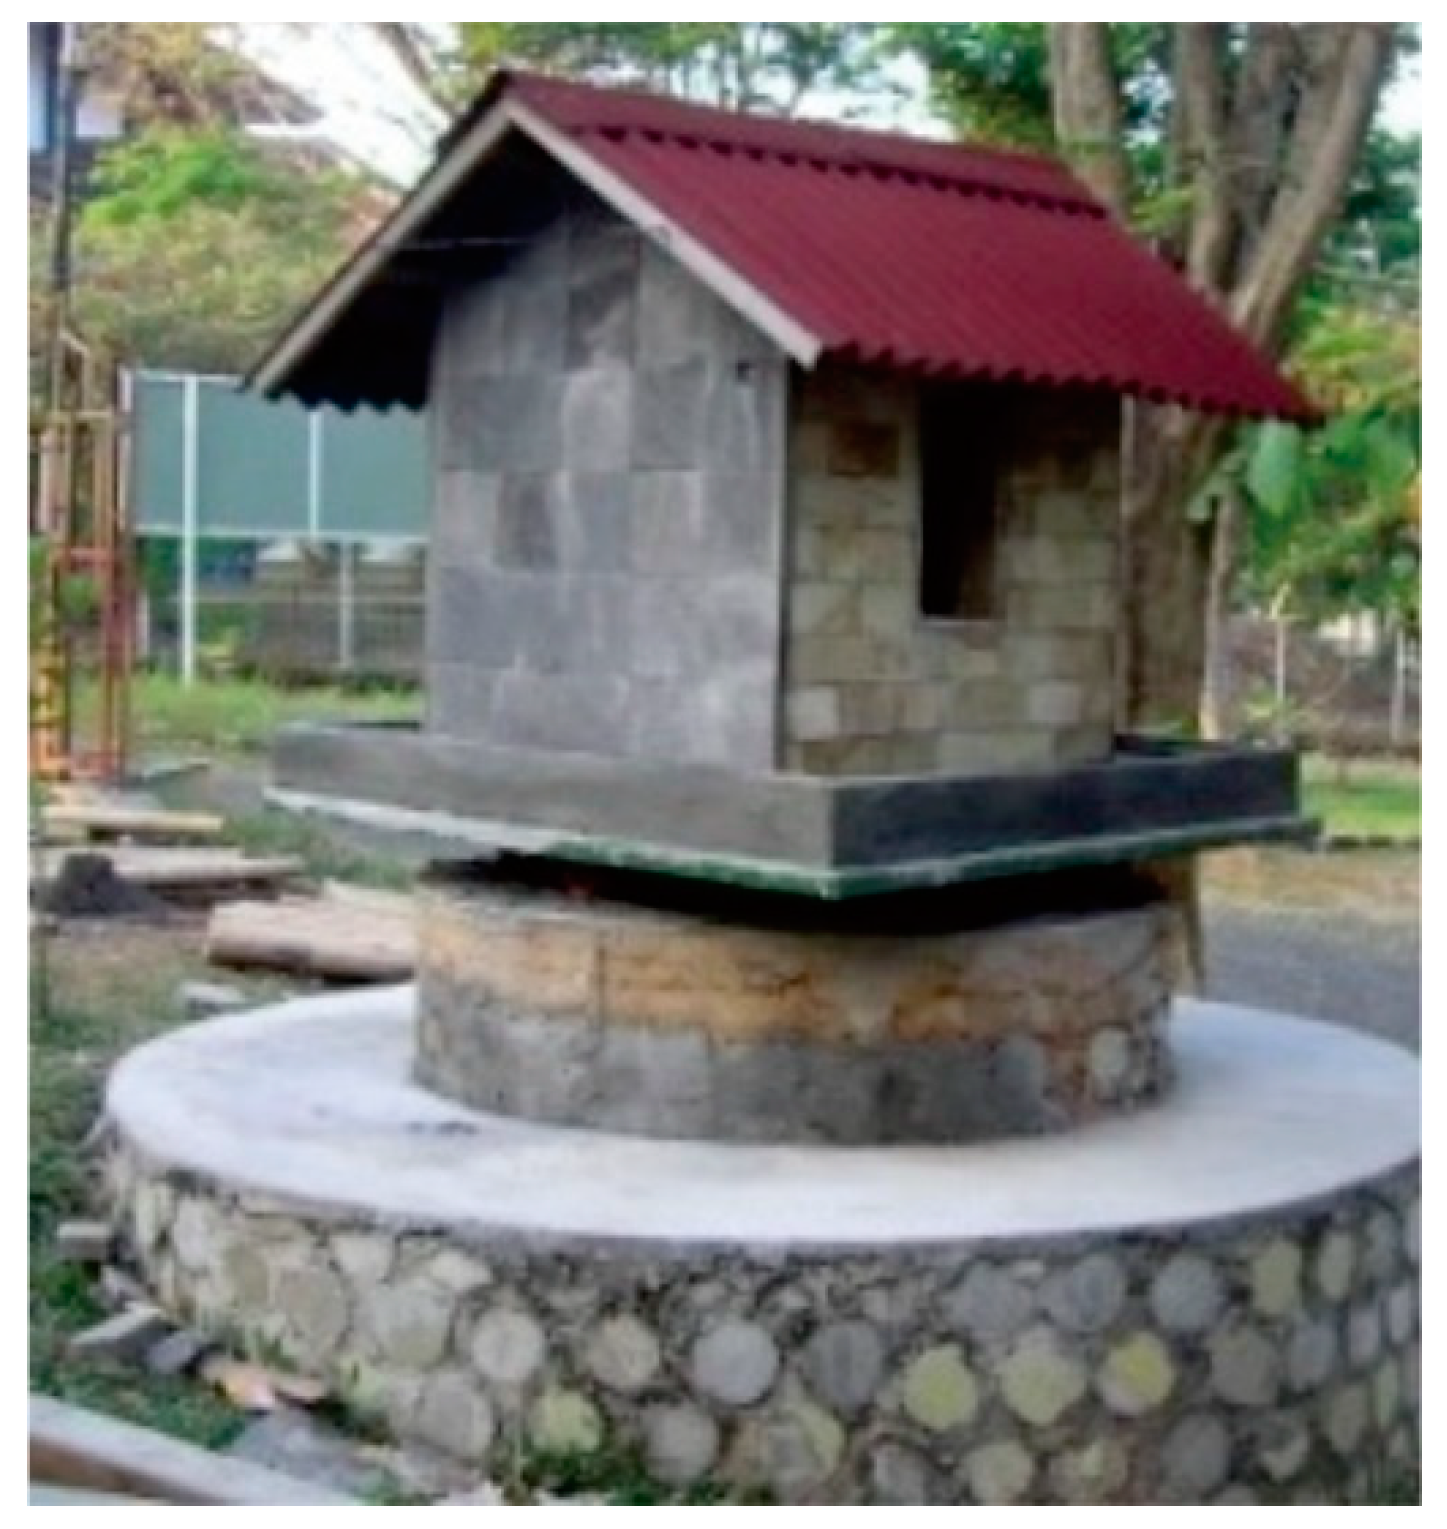
As mentioned in the introduction, to study the effect of the greenery layer on building thermal characteristics, three kinds of green façades were installed with different leaves covered areas in Semarang City, around Architecture Department at Diponegoro University. They included a non planted wall (experiment I), green façade with 50% leaves covered area (experiment II), and green façade with 90% leaves covered area (experiment III) [15]. At that moment, the building model placed behind other buildings and surrounded by large trees can be seen in 
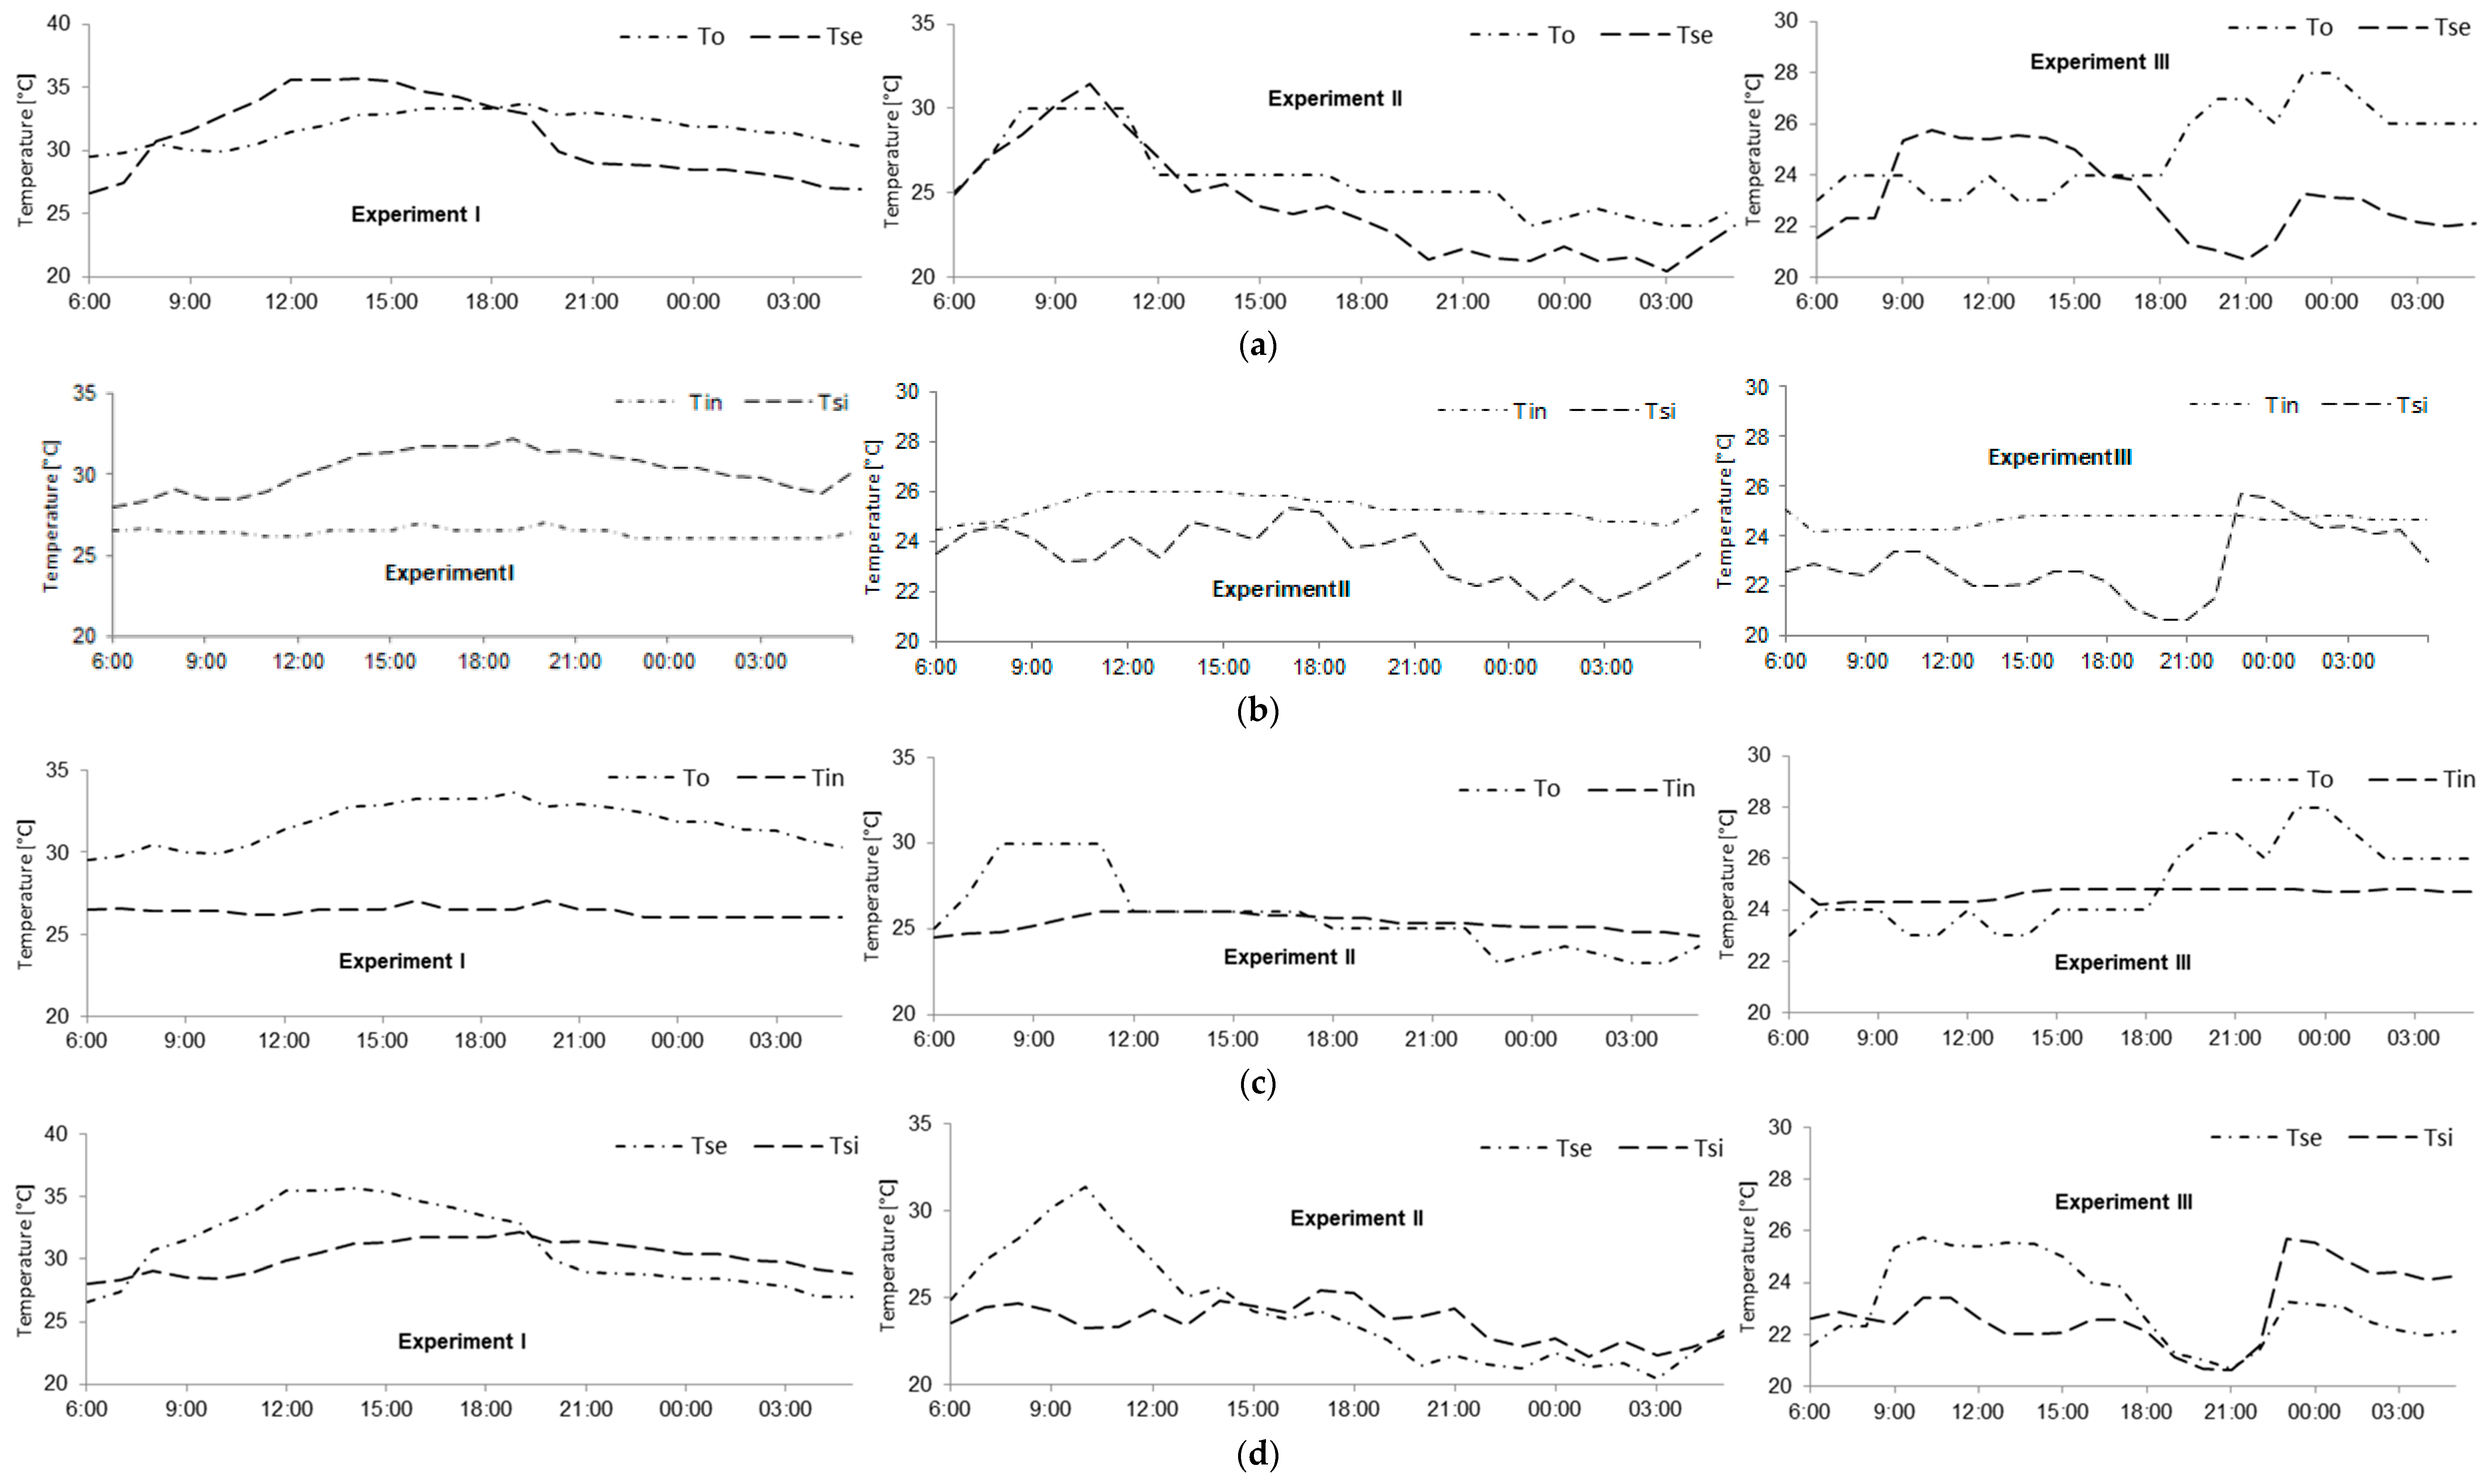
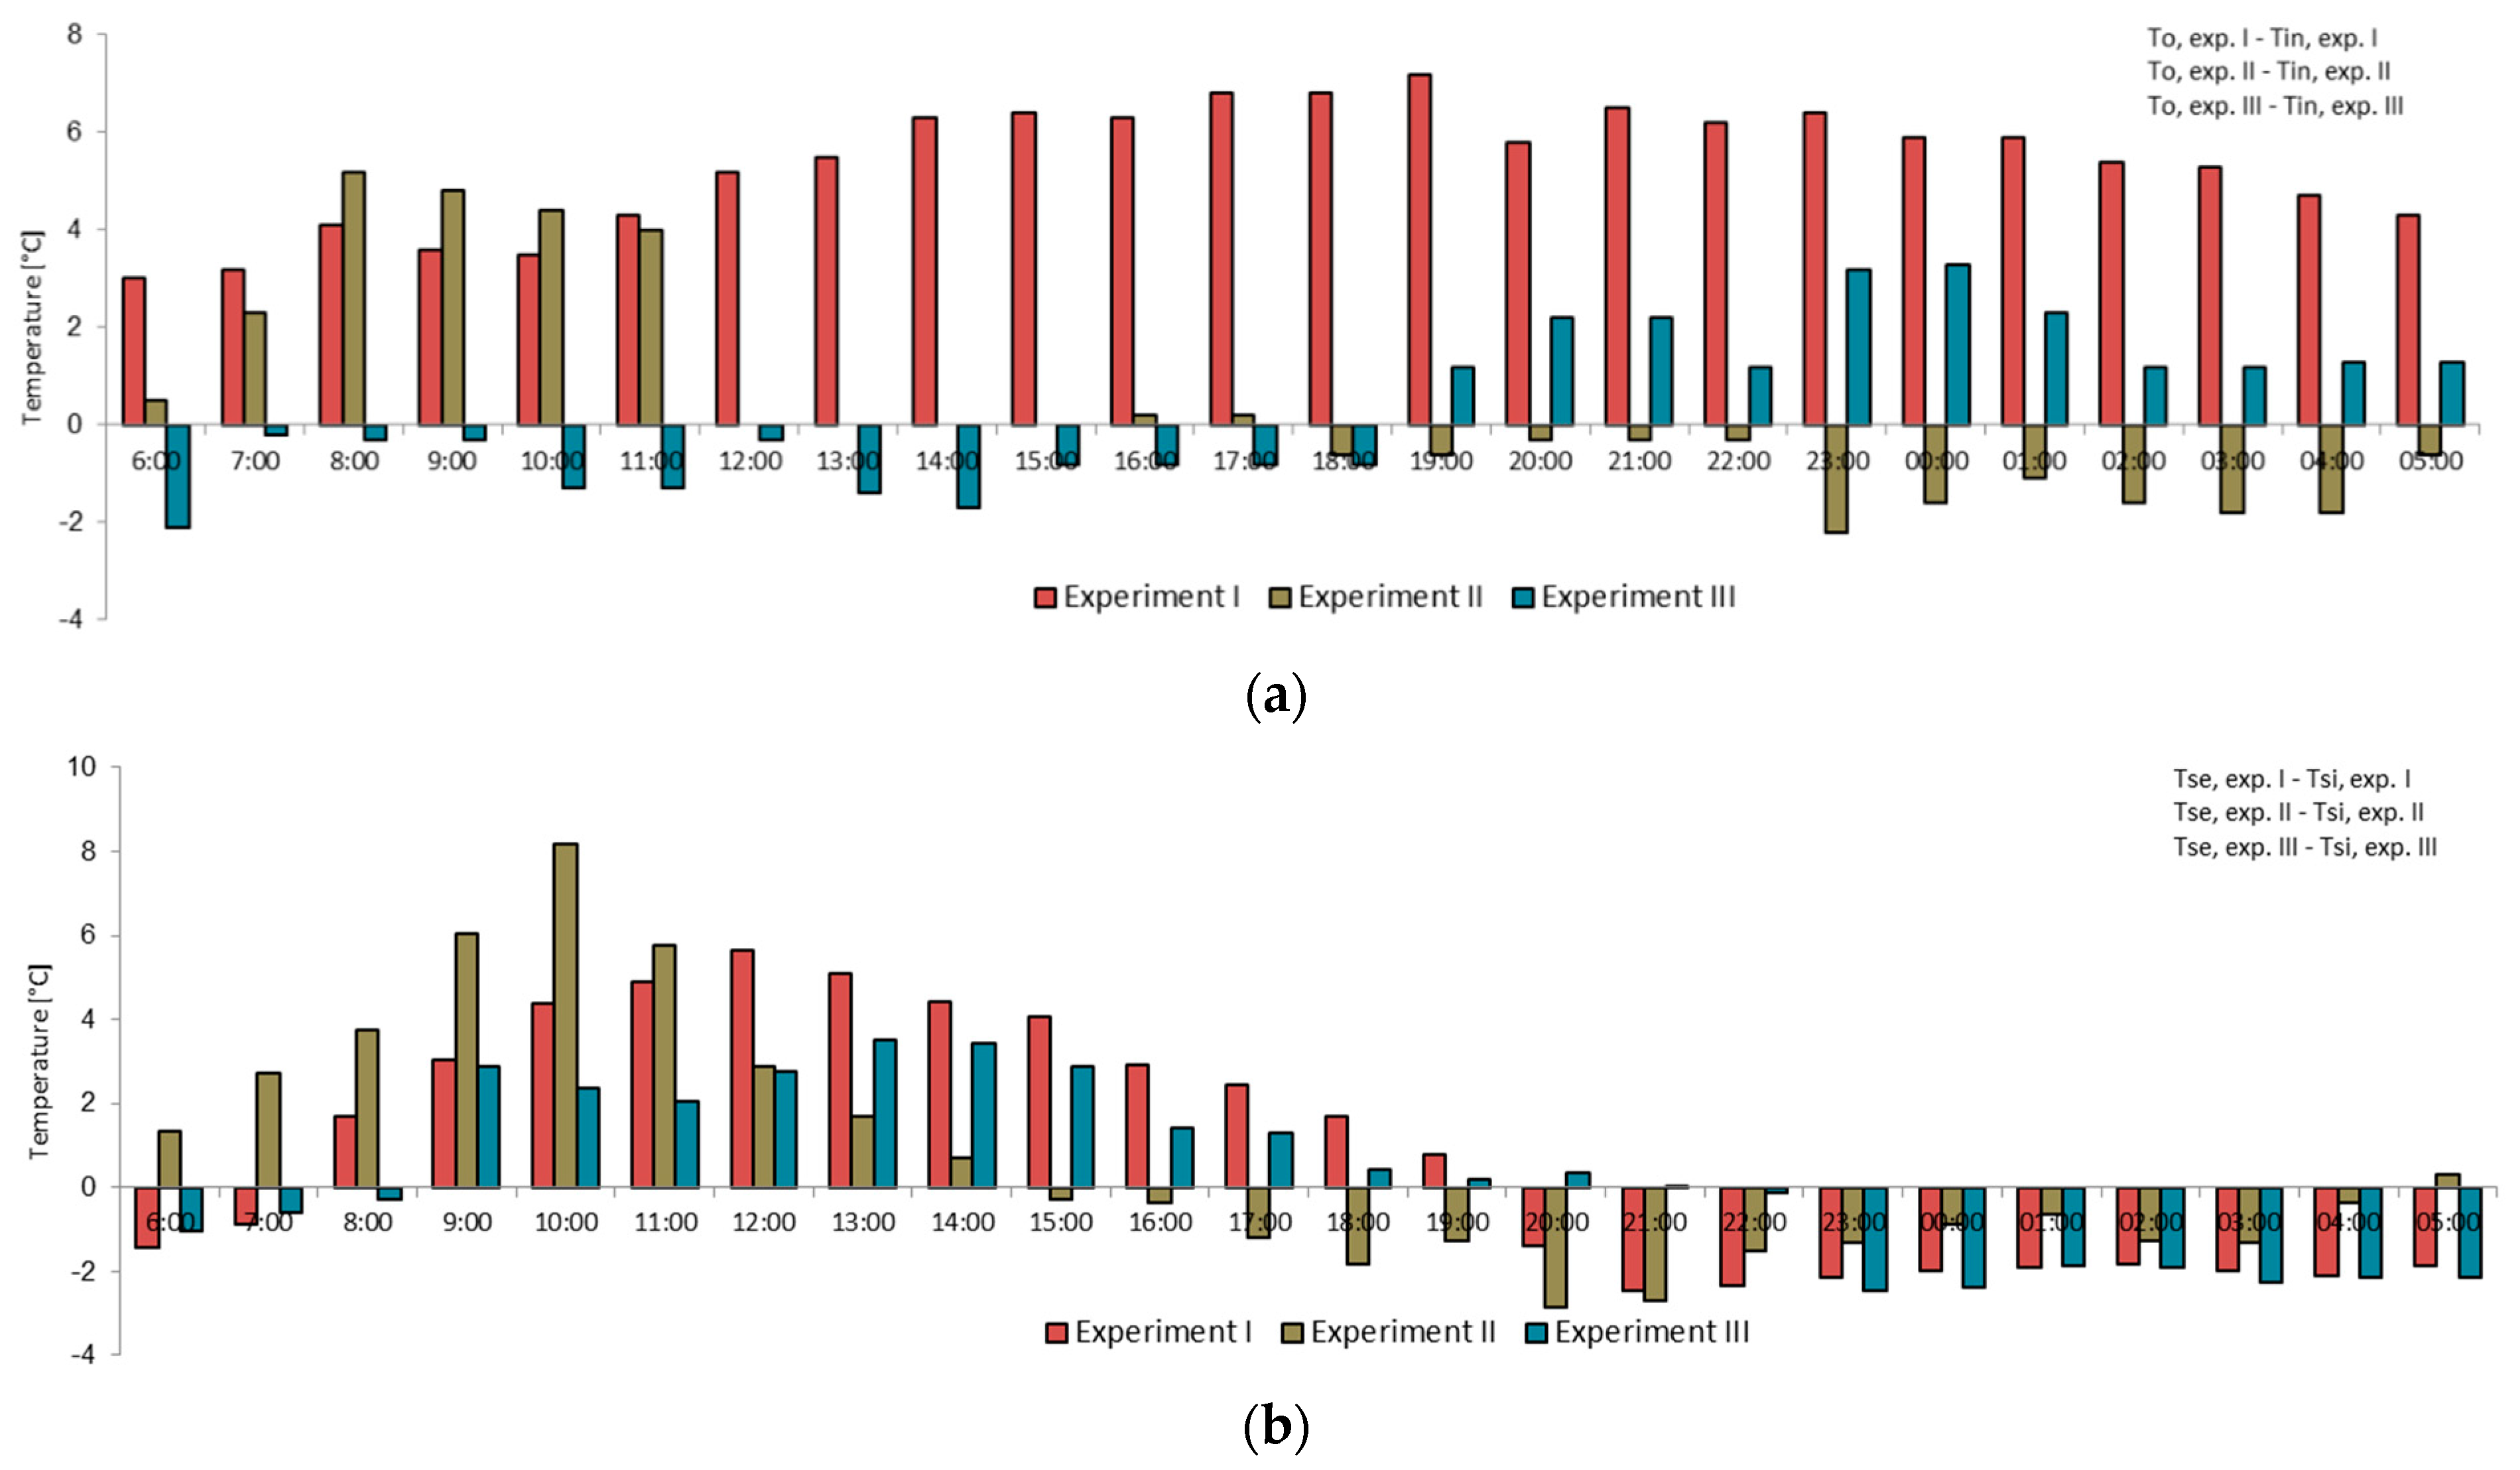
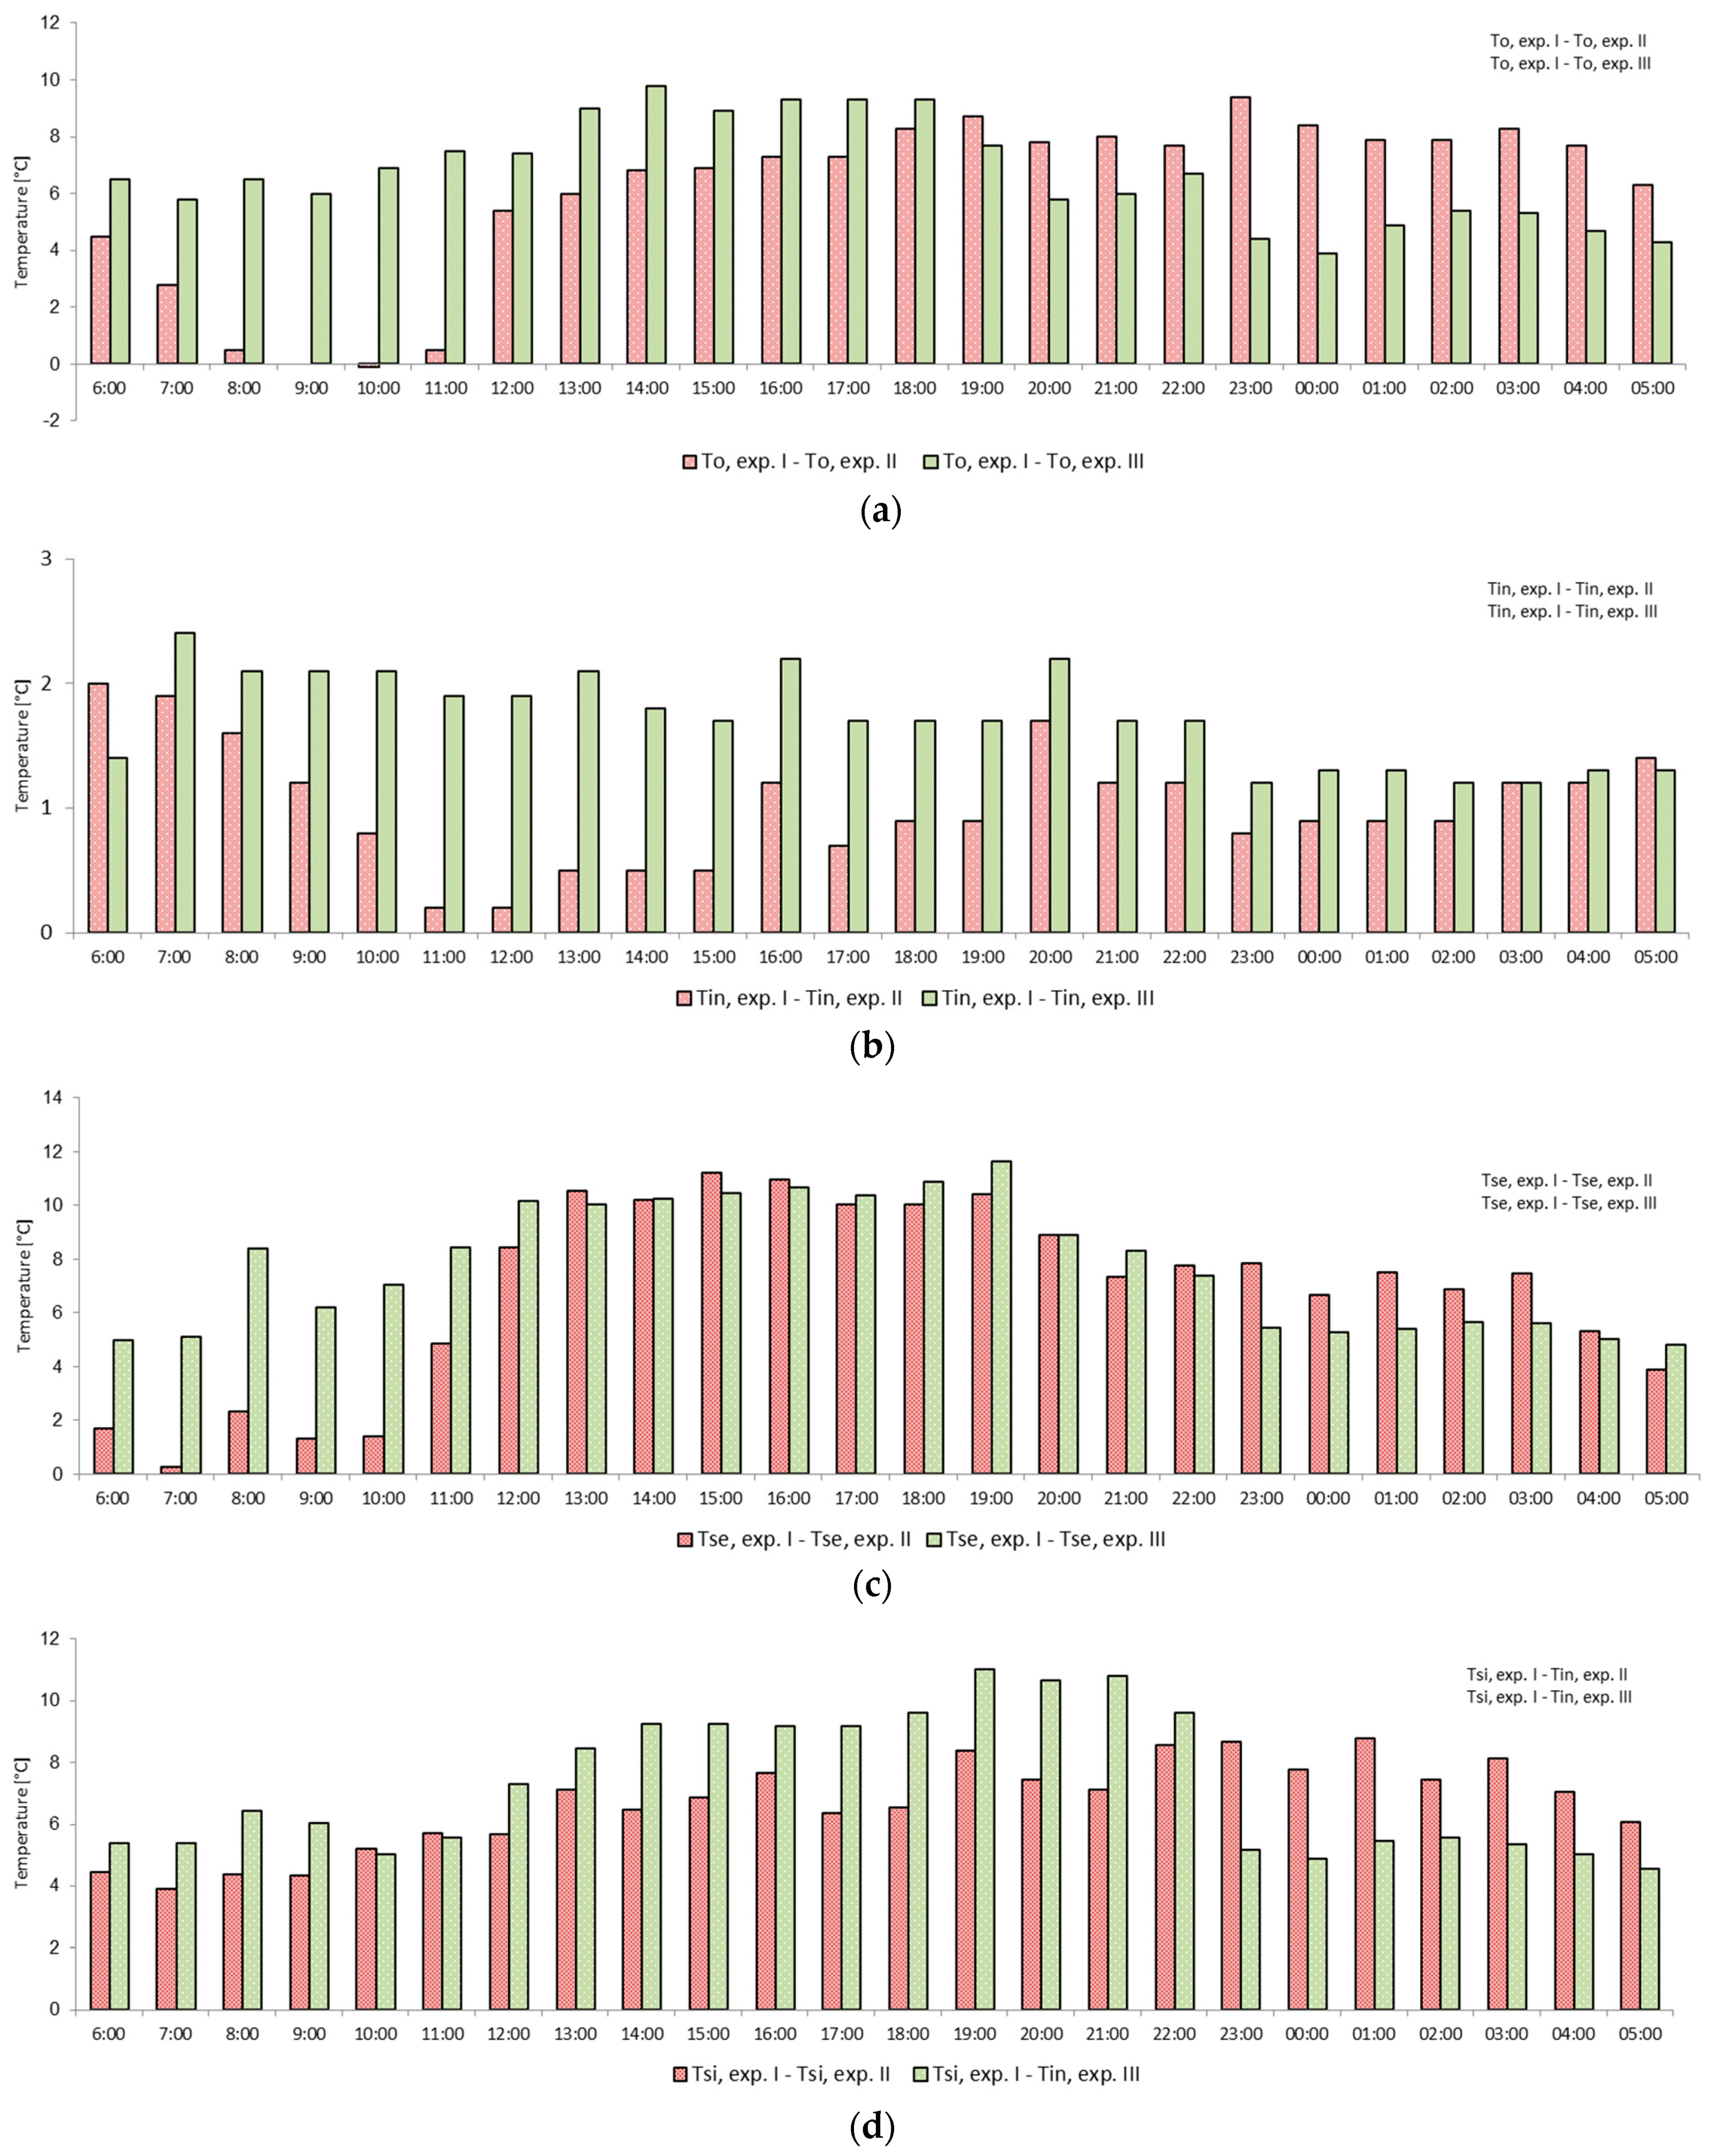
Figure 1. Later in the data measurement, it would affect wind velocity, causing insignificant data. Comparisons were done of the three data measurements by analyzing the temperatures characteristics, decrement factors, and heat flows.
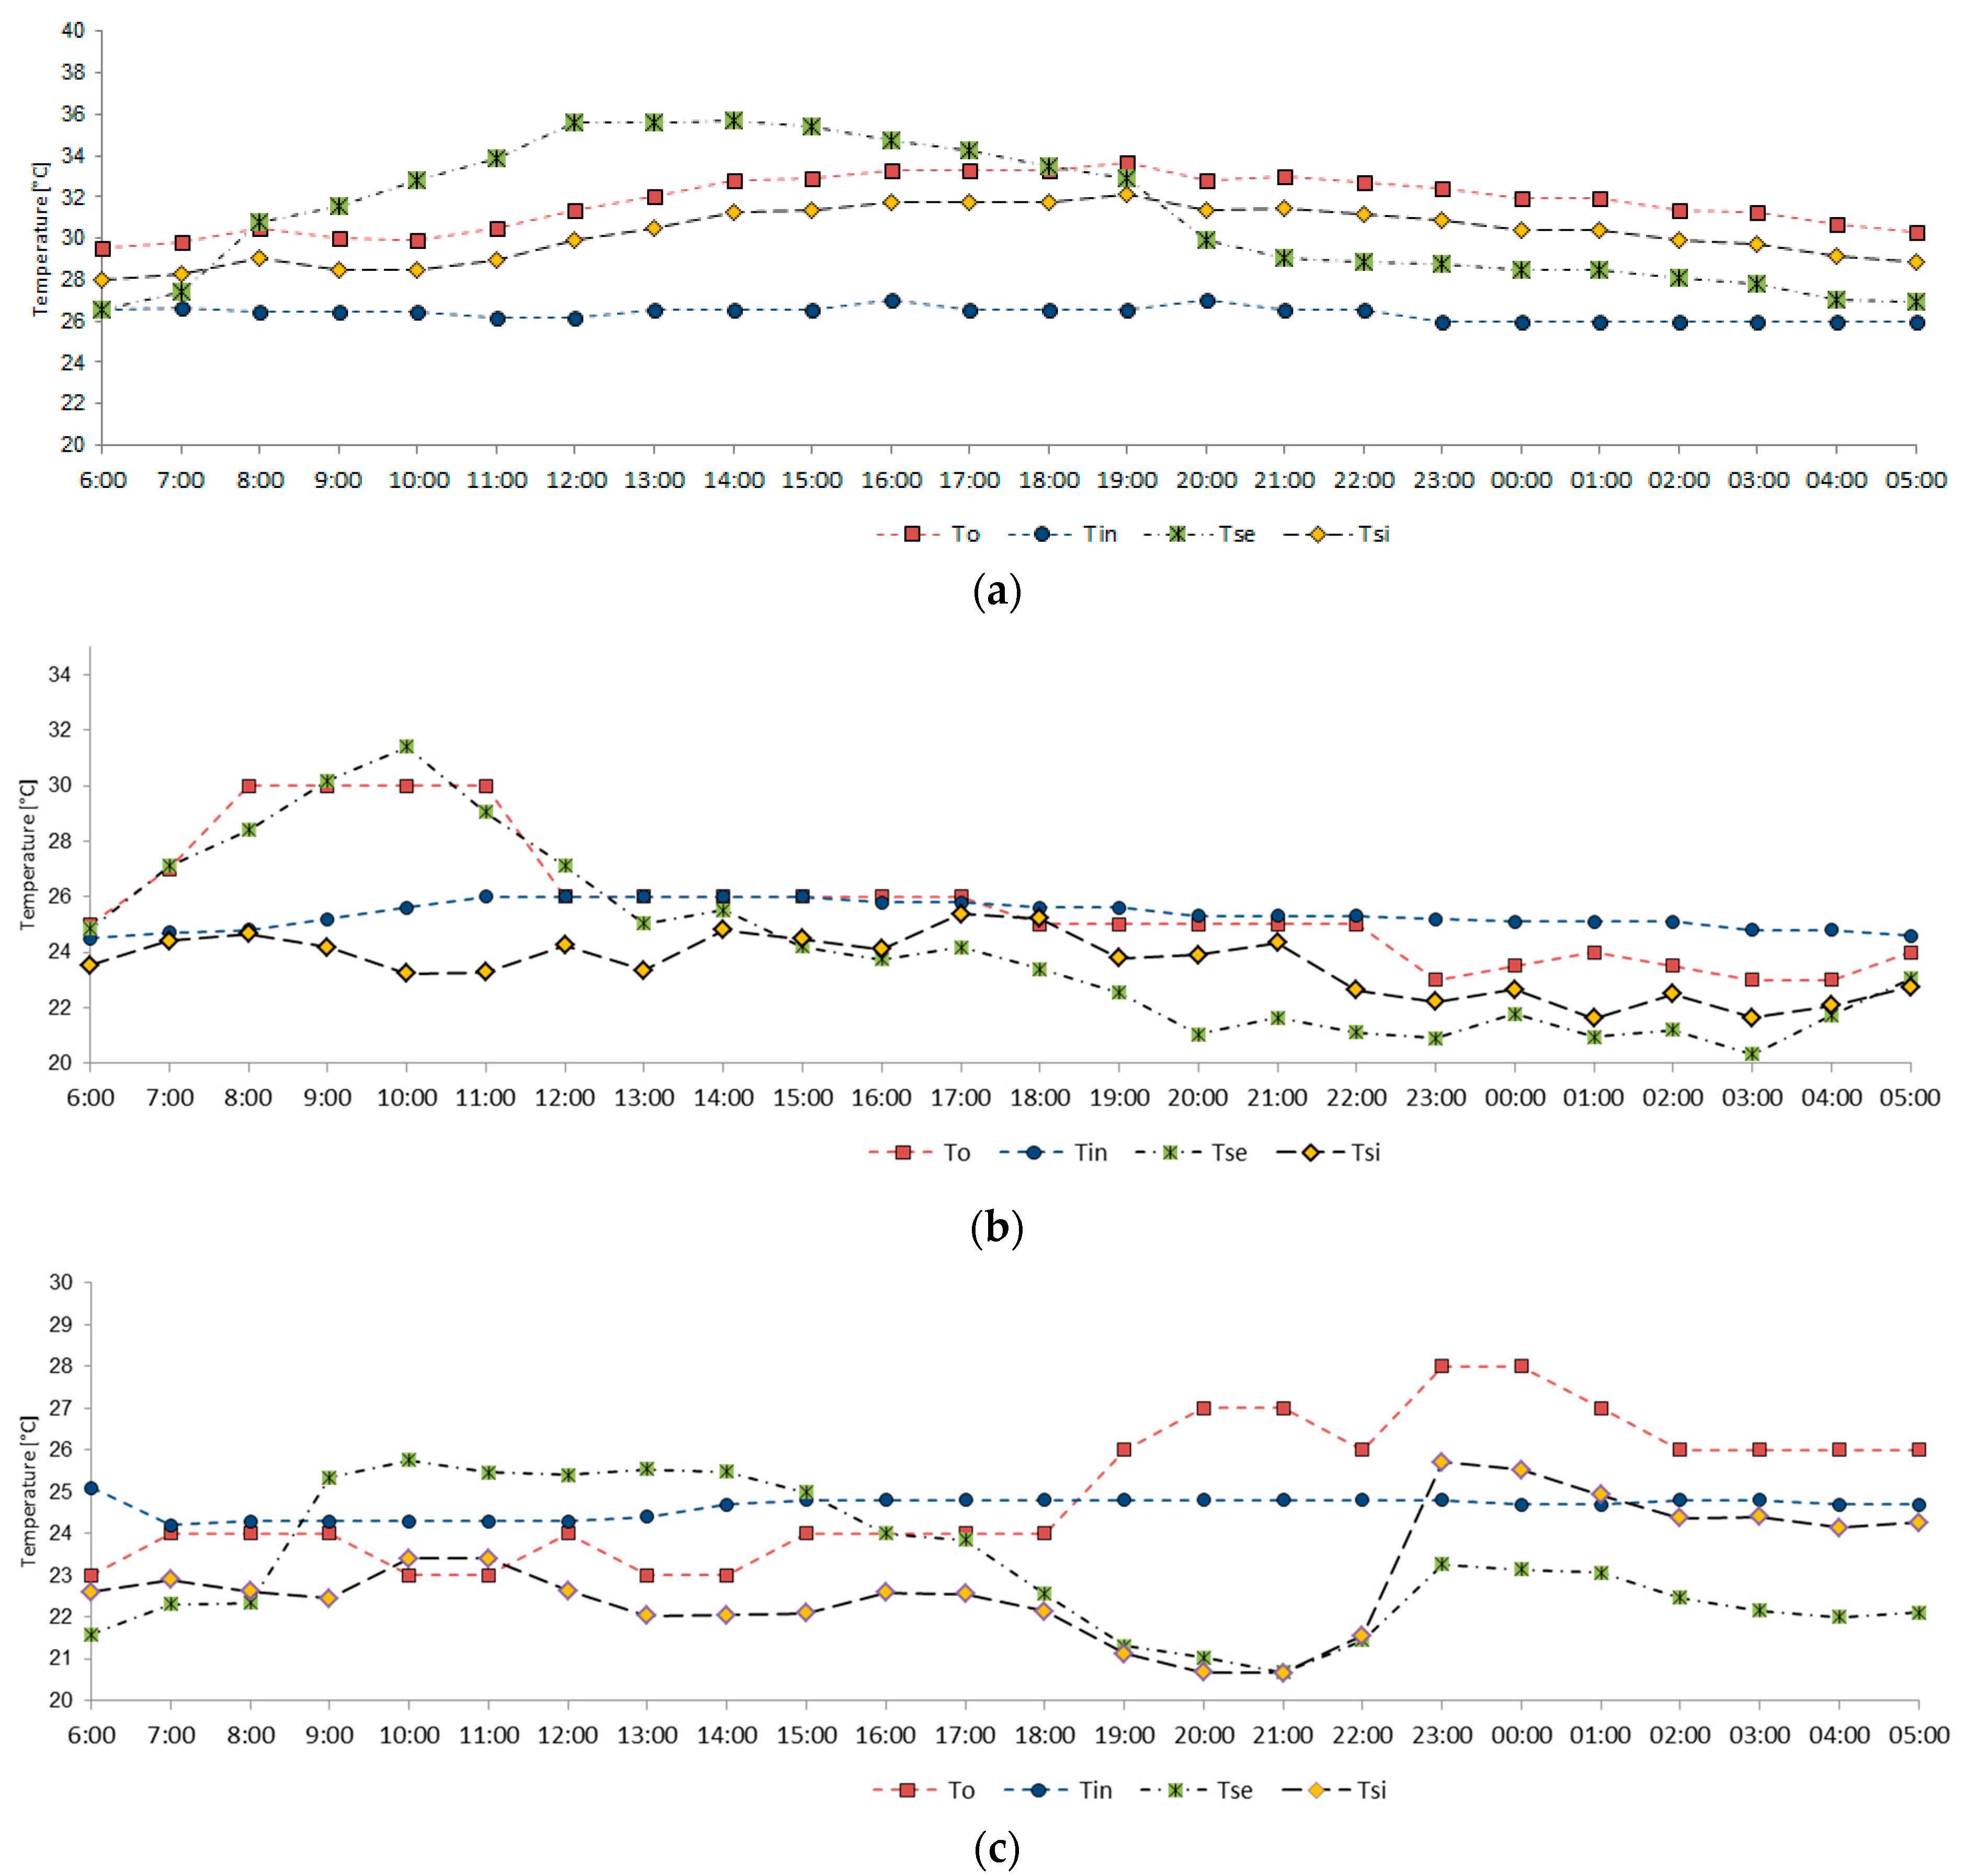
The field measurements were done at rainy season on December 10th, 2013 for experiment I; December 13th, 2013 for experiment II, and December 16th for experiment III. This is different with previous studies that carried out during summer time [3,14].
Due to the limited number of models, the data measurements for each experiment were done on different days. However, during data measurement, local weather conditions were relatively similar, as can be seen in Table 1. Data of environmental conditions were adopted from Maritime Meteorology Station of Semarang City. The different in each data measurement are 2% for humidity, 0.52 °C–1.4 °C for air temperature and 0.2 m/s–0.5 m/s for air velocity.

2.2. Model of Green Façades

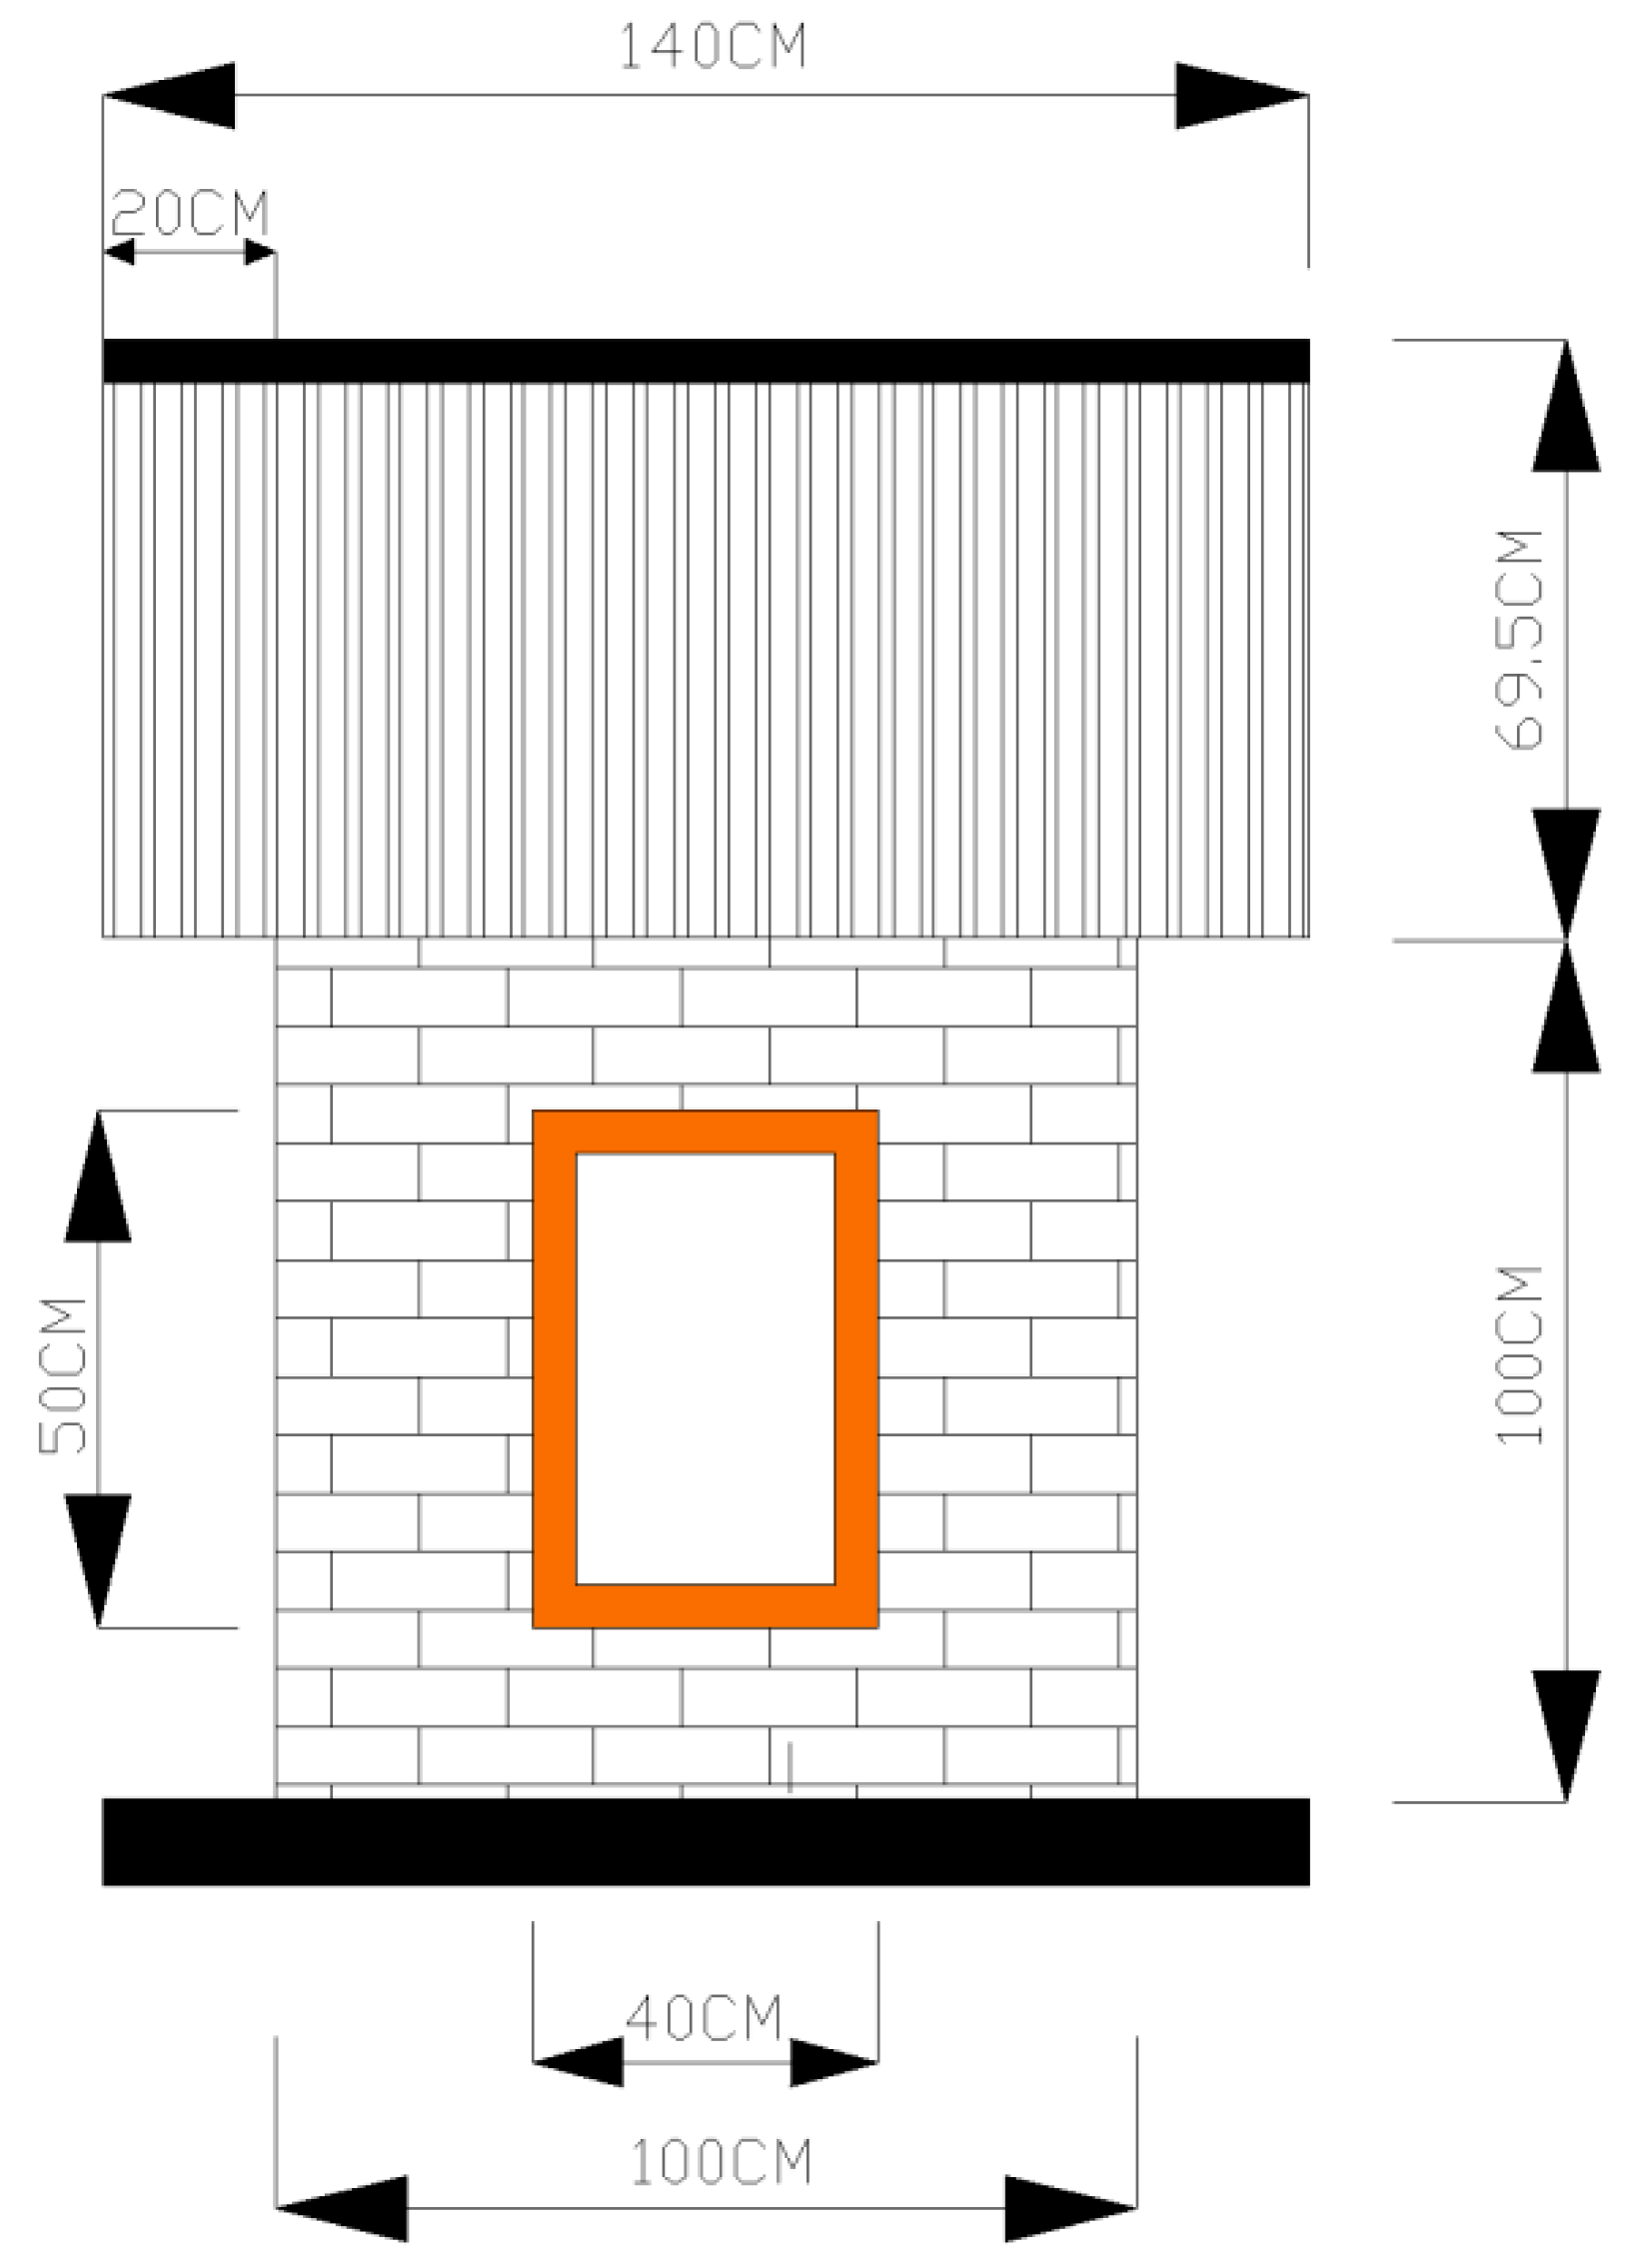
As previously already mentioned, in this study, three field measurements with different leaves covered area were done on the building model, which was like a house miniature with a scale of 1:4 compared to an original building [15,19,20]. Details of the dimensions of the building model can be seen in Figure 2. Walls as measurement objects had dimensions of 1 m × 1 m. The east façade was chosen as the object for measurement, because in tropical areas it gains more direct solar radiation, especially during morning until evening [21].
The thickness of the wall constructions were 12 cm bricks, without layer materials (plasters). Table 2 shows details of the building material.
Table 3 shows data of the geometrical and thermo–physical properties of the walls structure. 
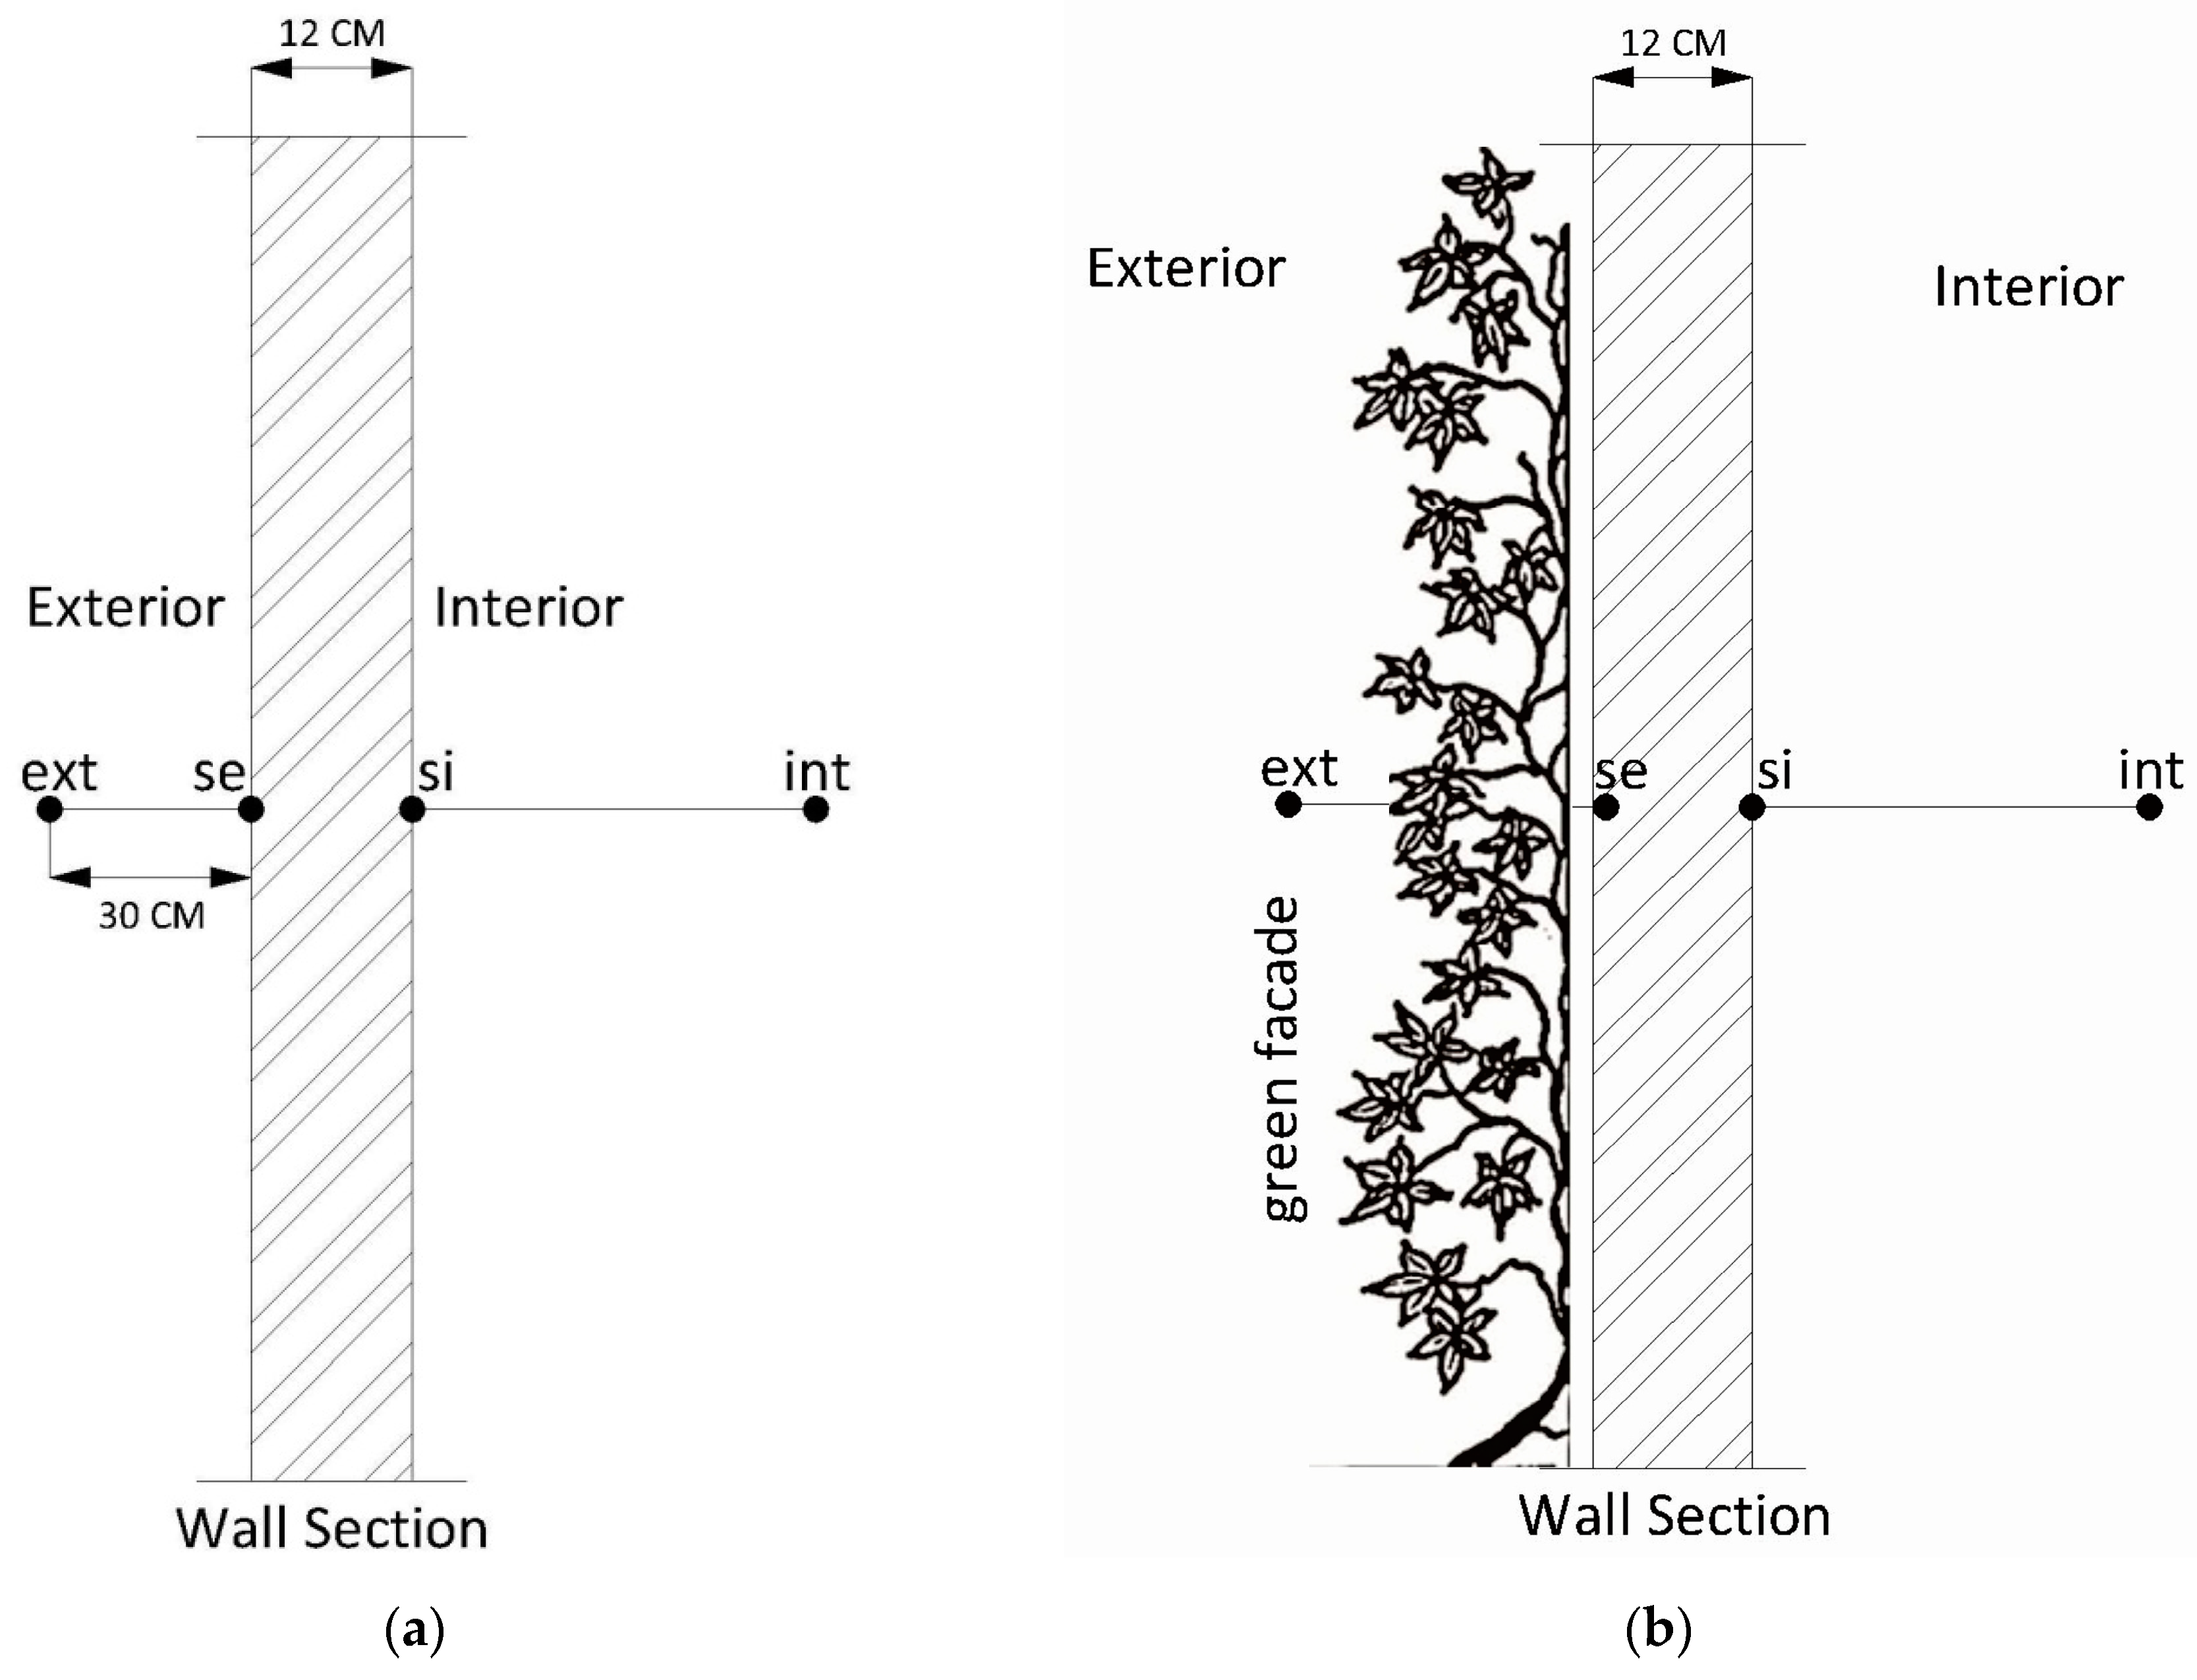
Figure 3 illustrates the configuration of the measured wall with or without a green façade.
In this study, exterior and interior temperatures, as well as wall surface temperatures, were measured as dependent variable that were affected by the green façade, while data measurement related to environmental factors, such as the averages of wind velocity, air humidity, and air temperature, were obtained from a nearby observation station, the Maritime Meteorology Station of Semarang City.
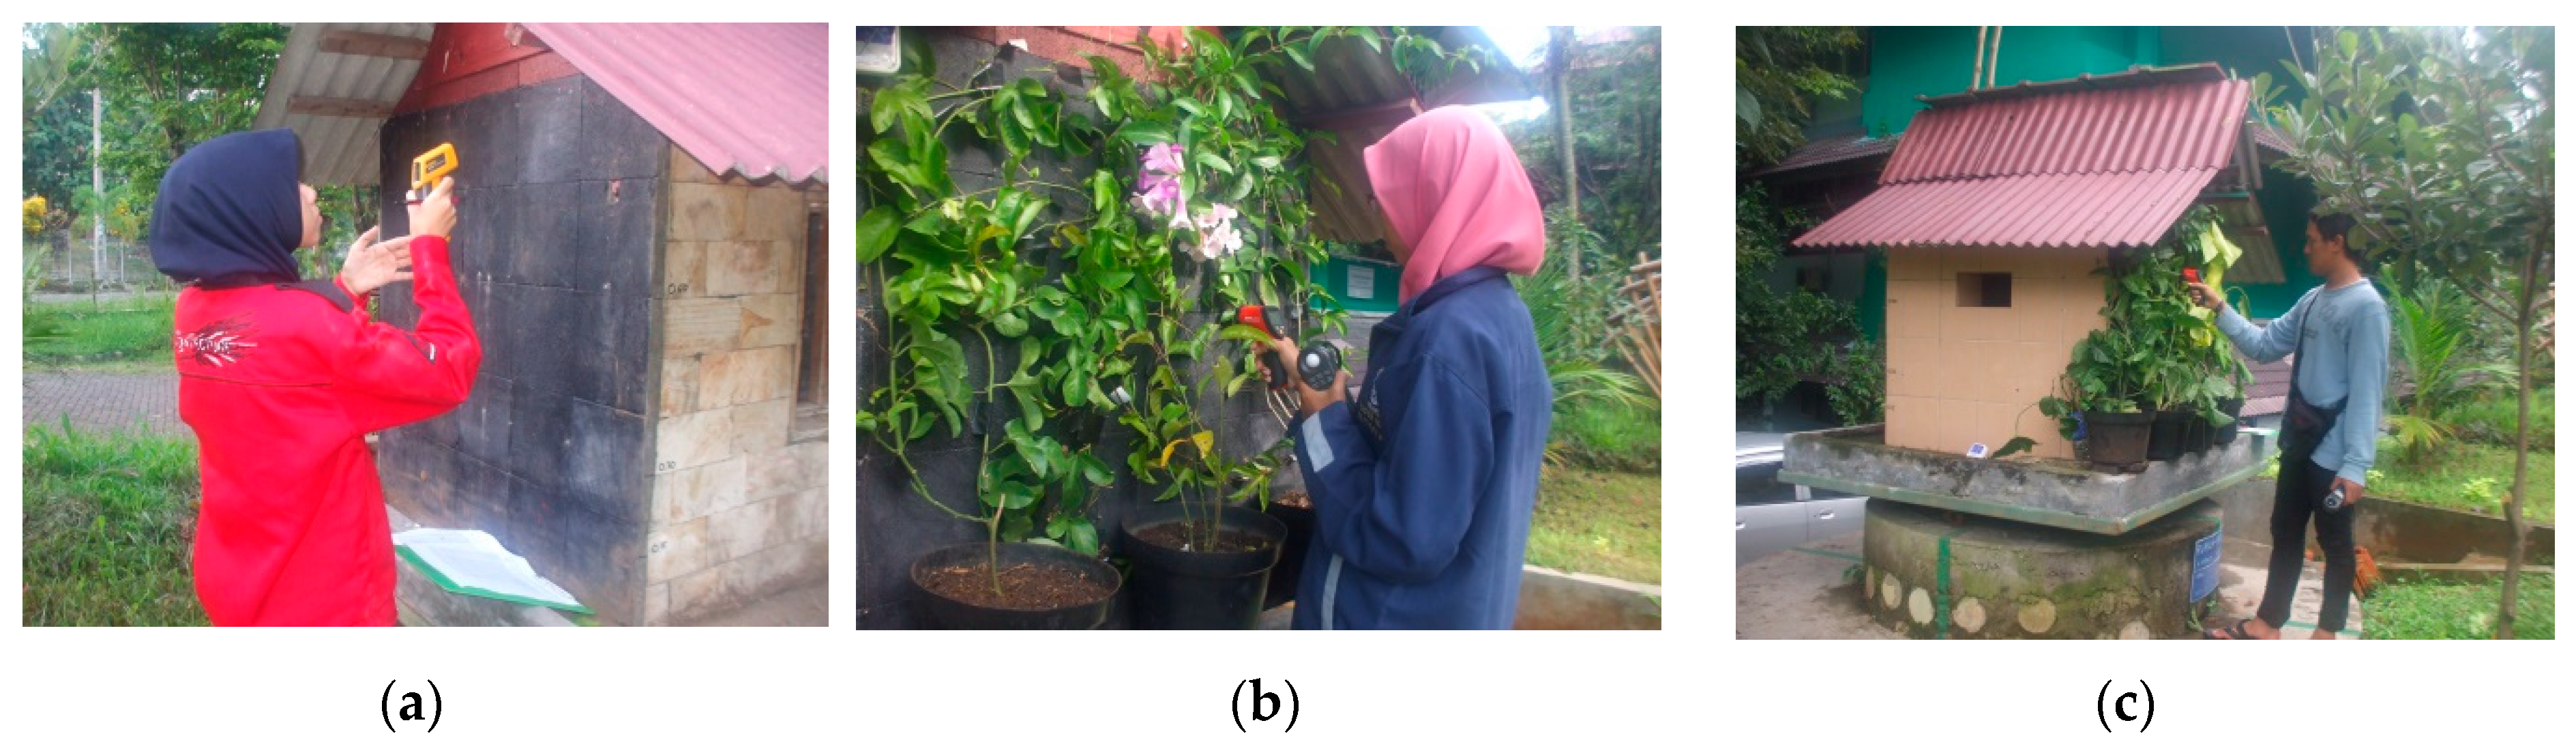
In order to collect data measurements, a number of measurement tools were employed. A surface thermometer was used for surface temperature measurement. An infrared thermometer was used as a measurement tool that was directed on a specific measurement point of the façade surface. The temperature range was −50 °C to 280 °C and measuring accuracy was ±2%.
Since one specific measurement point could not cover all surface data measurements, the authors divided façade surfaces into fifteen measurement points [15]. There were three rows, where each row contained five measurement points. The range of differences in each measurement point was 0–0.1 °C. The average temperature on the fifteen measurement points was used as data for surface temperature and also for data analysis.
While space thermometers were used for space temperature measurement. Data measurement were carried out using a hygro thermometer placed at a distance 30 cm from the façade for the exterior space and in the middle of the building model for the interior space. The temperature range of this measurement tool was −10 °C to 60 °C and the measuring accuracy was ±1 °C.
Wind velocity measurement was also conducted using a 4 in 1 environment tester LM-8000. The specific range of this measurement tool was 0.4 m/s to 30.0 m/s. As for the measuring accuracy, it was ±0.1 m/s. However, the results were too weak around 0.4 m/s to 0.6 m/s due to surrounding buildings acting as wind barriers that reduced air flow around measurement objects. This condition was similar with the study conducted by Eumorfopoulou and Kontoleon [3], where winds often did not blow since the built environment around measurement object acted as wind barrier and generated the insignificant data of air velocities around object measurement. Due to these factors, the wind velocity through leaves foliage was negligible.
All data measurements were collected in one hour interval. Selected data for analysis were chosen from data measurement on clear days. Figure 4 shows documentation of data measurement.
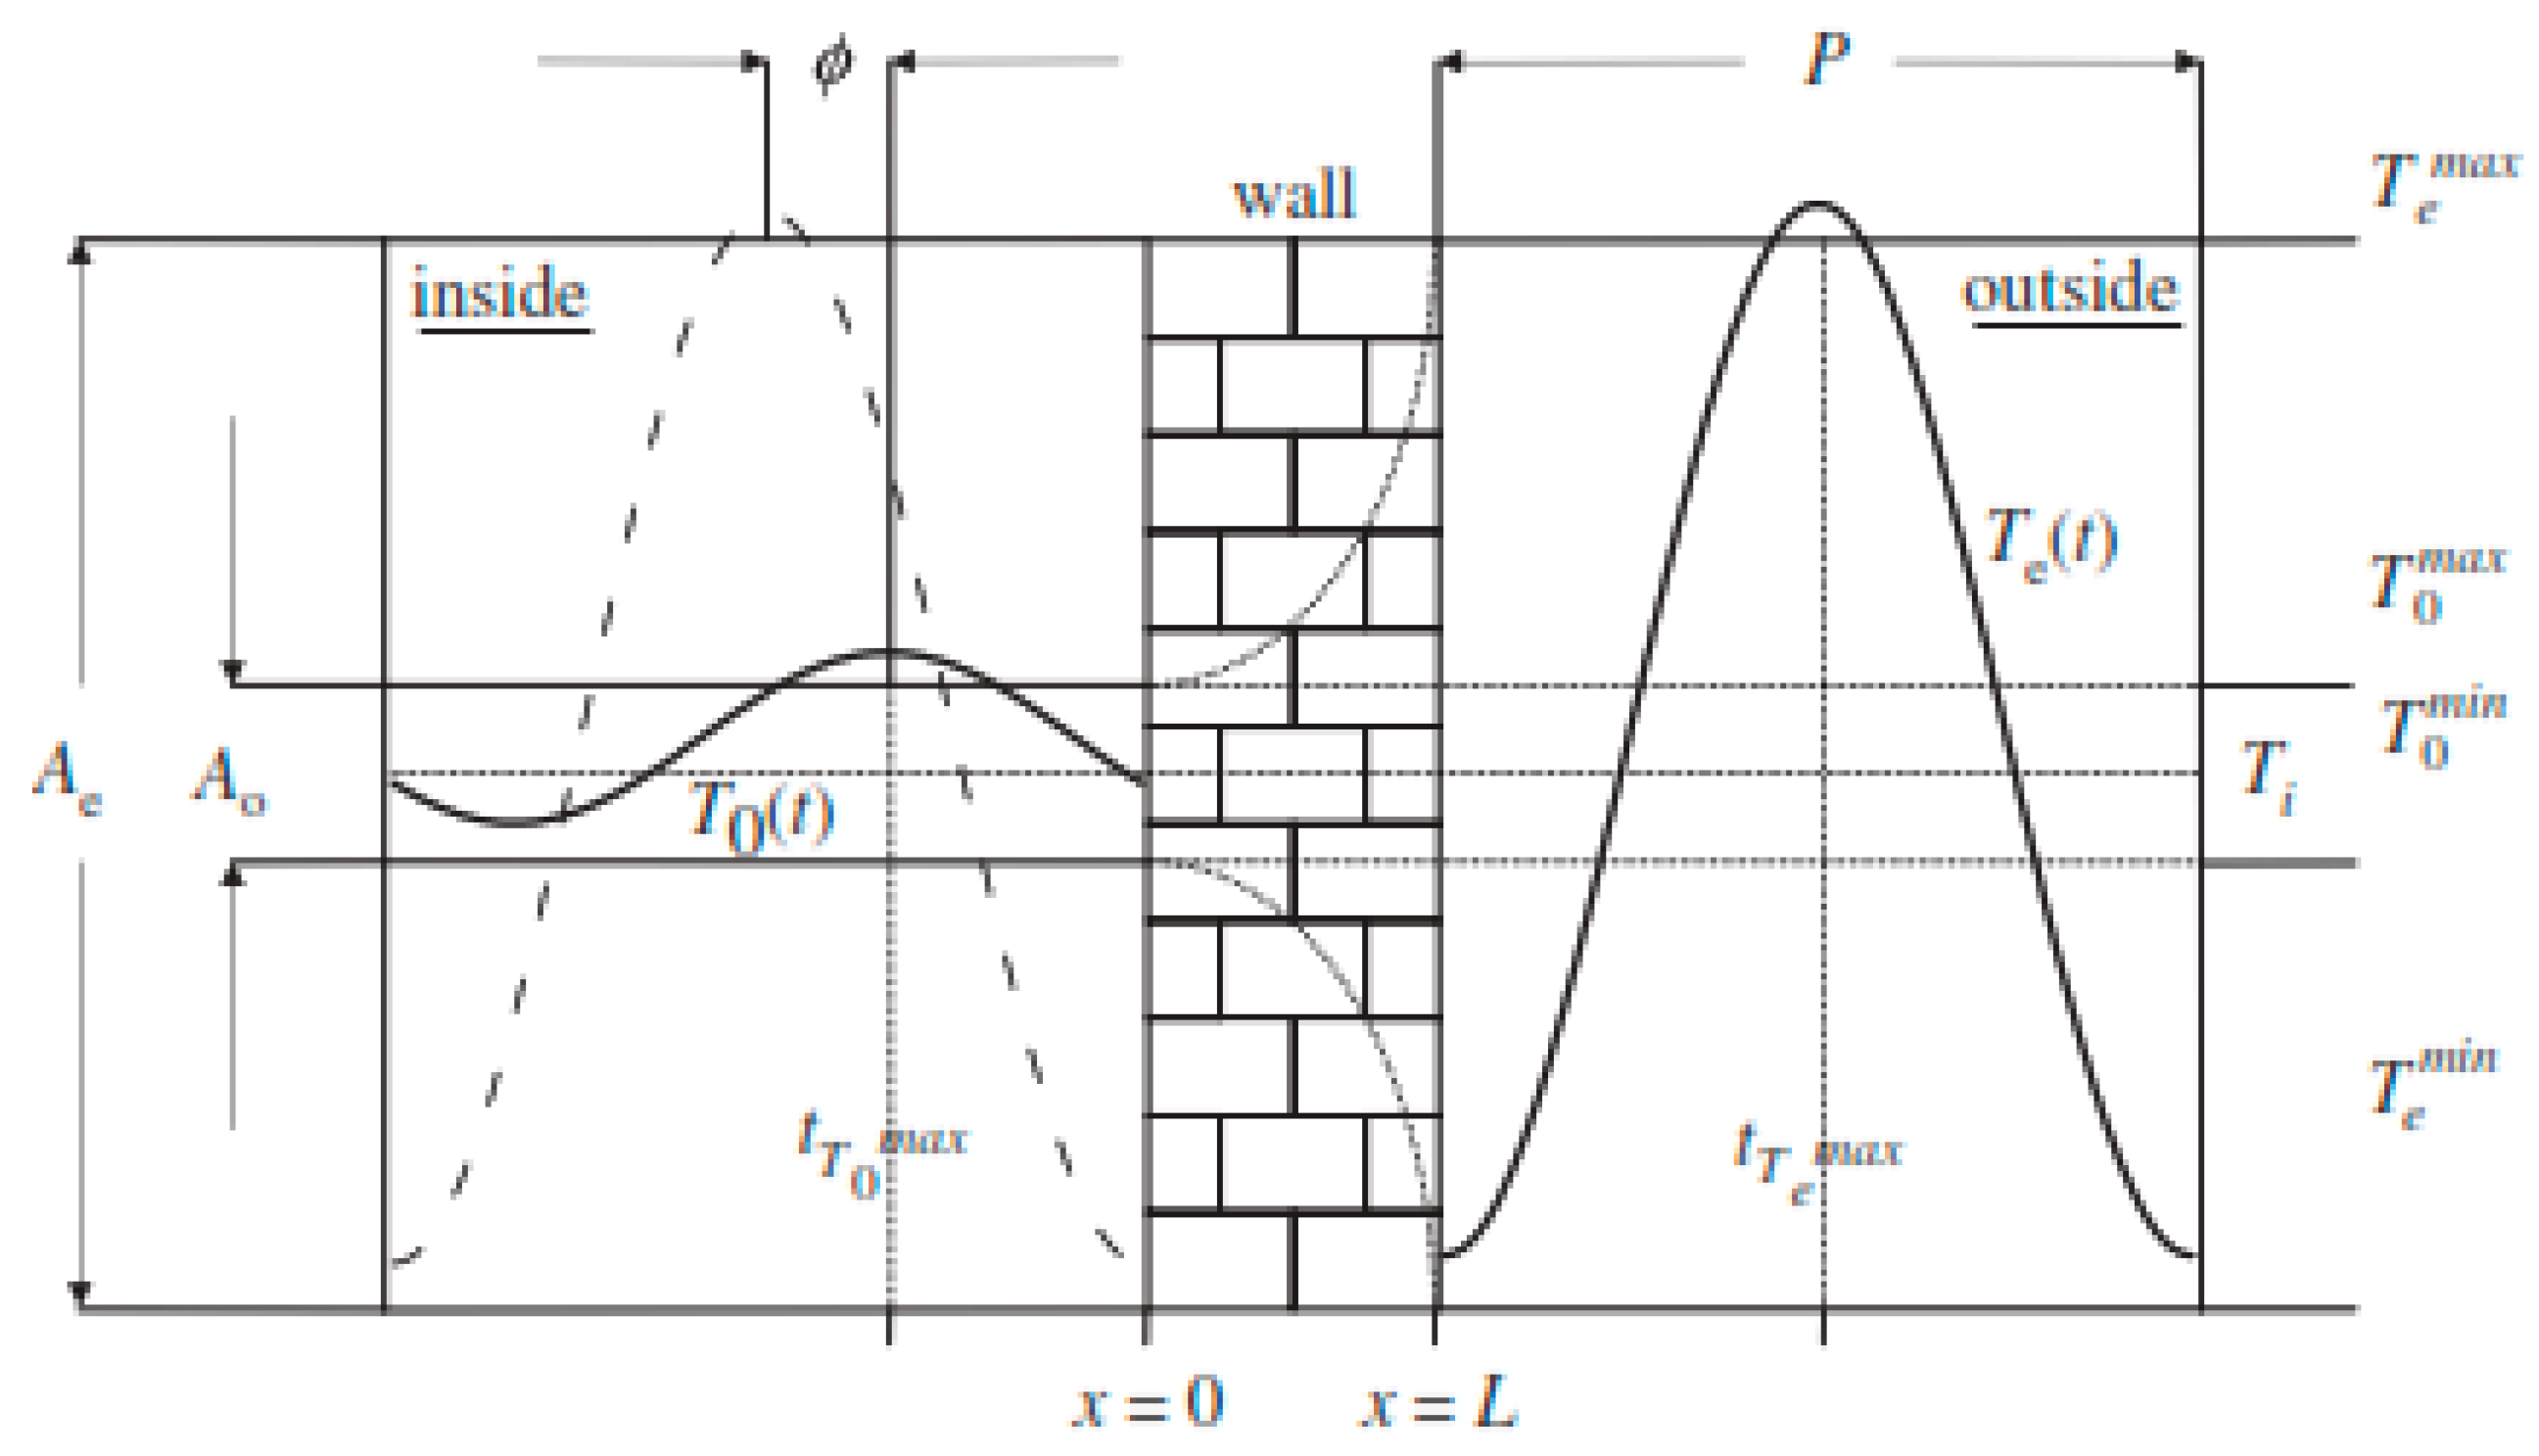
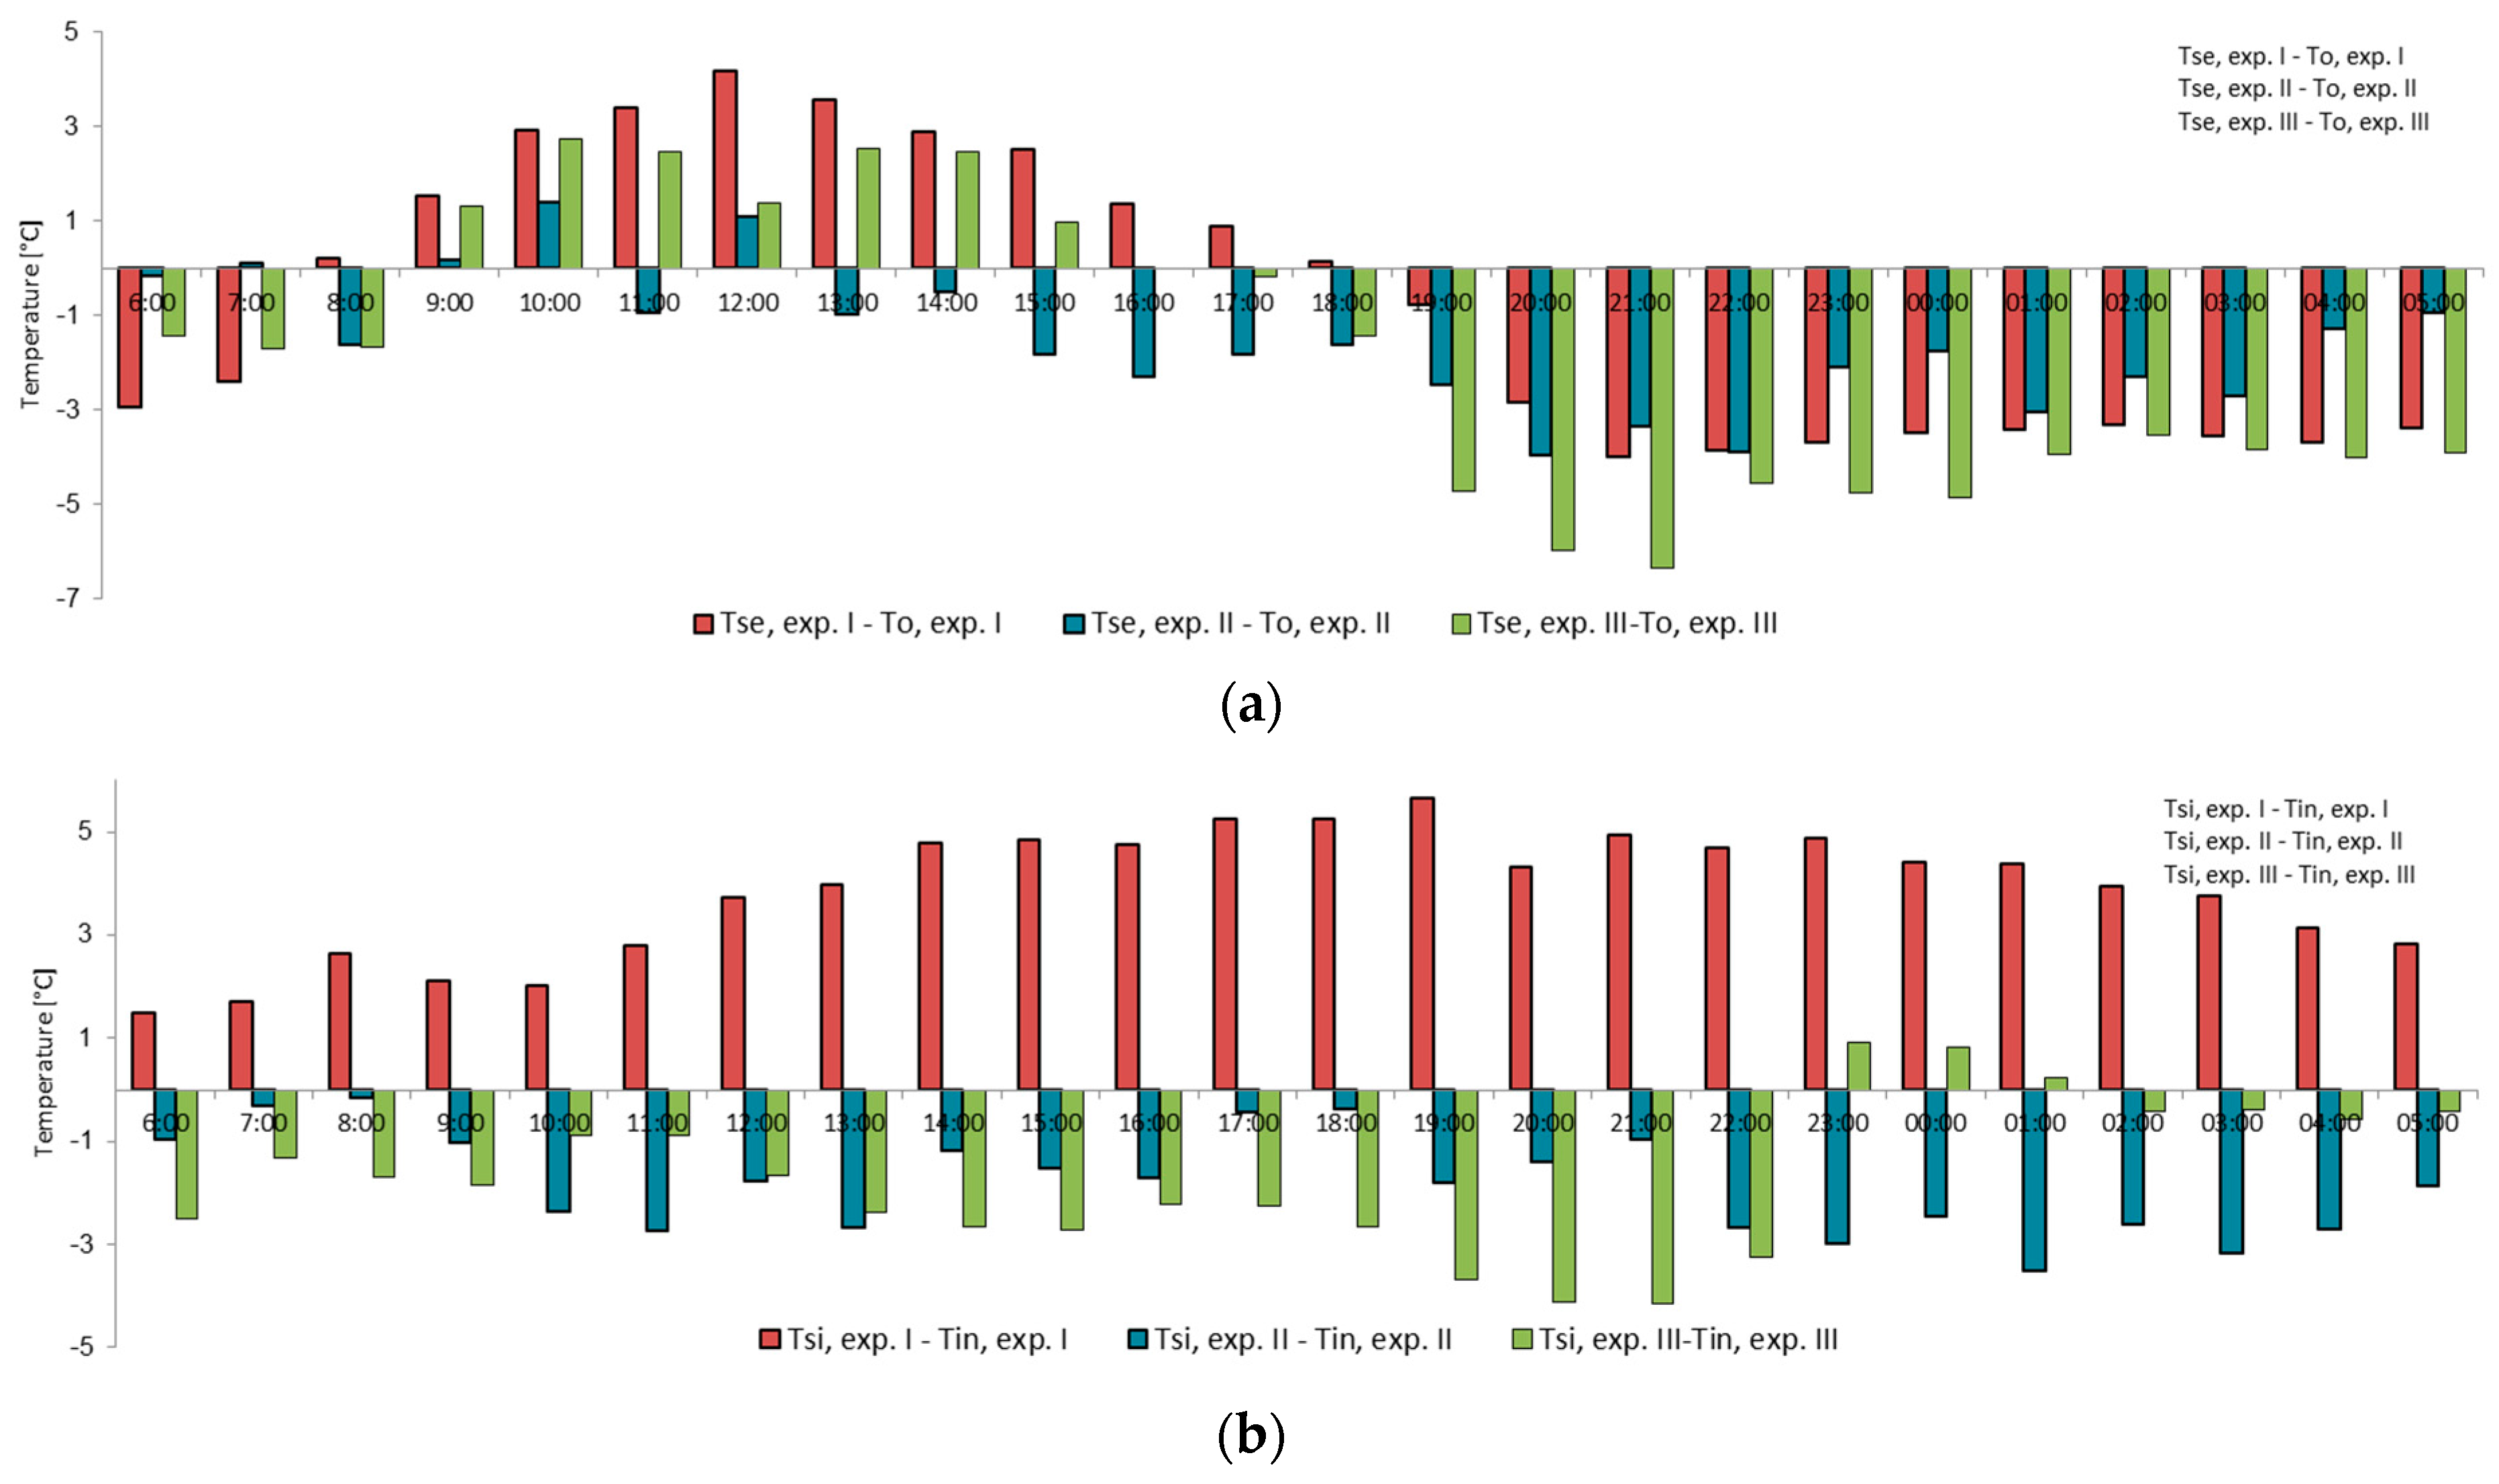
Based on previous studies, decrement factor, f, can be defined as the ratio of the amplitude of the temperature on the inner surface of the multi-layer material to the outer surface temperature [22,23,24]. The decrement factor on each experiment was calculated by the following formula [24], which was also used in the study conducted by Eumorfopoulou and Kontoleon [3].
f = T si , max T si , min T se , max T si , min
where f is achieved by the difference between maximum and minimum interior surface temperature (Tsi,max − Tsi,min) divided by the difference between maximum and minimum exterior surface temperature (Tse,max − Tse,min).
Decrement factor calculation was also followed by time lag, (in hours), which refers to the time delay due to the thermal mass [22,23,25,26], where the difference is obtained from the time occurrence of maximum temperature on the exterior surface (Tse,max) and interior surface (Tsi,max); P is the period of the wave, which can be seen in Figure 5.
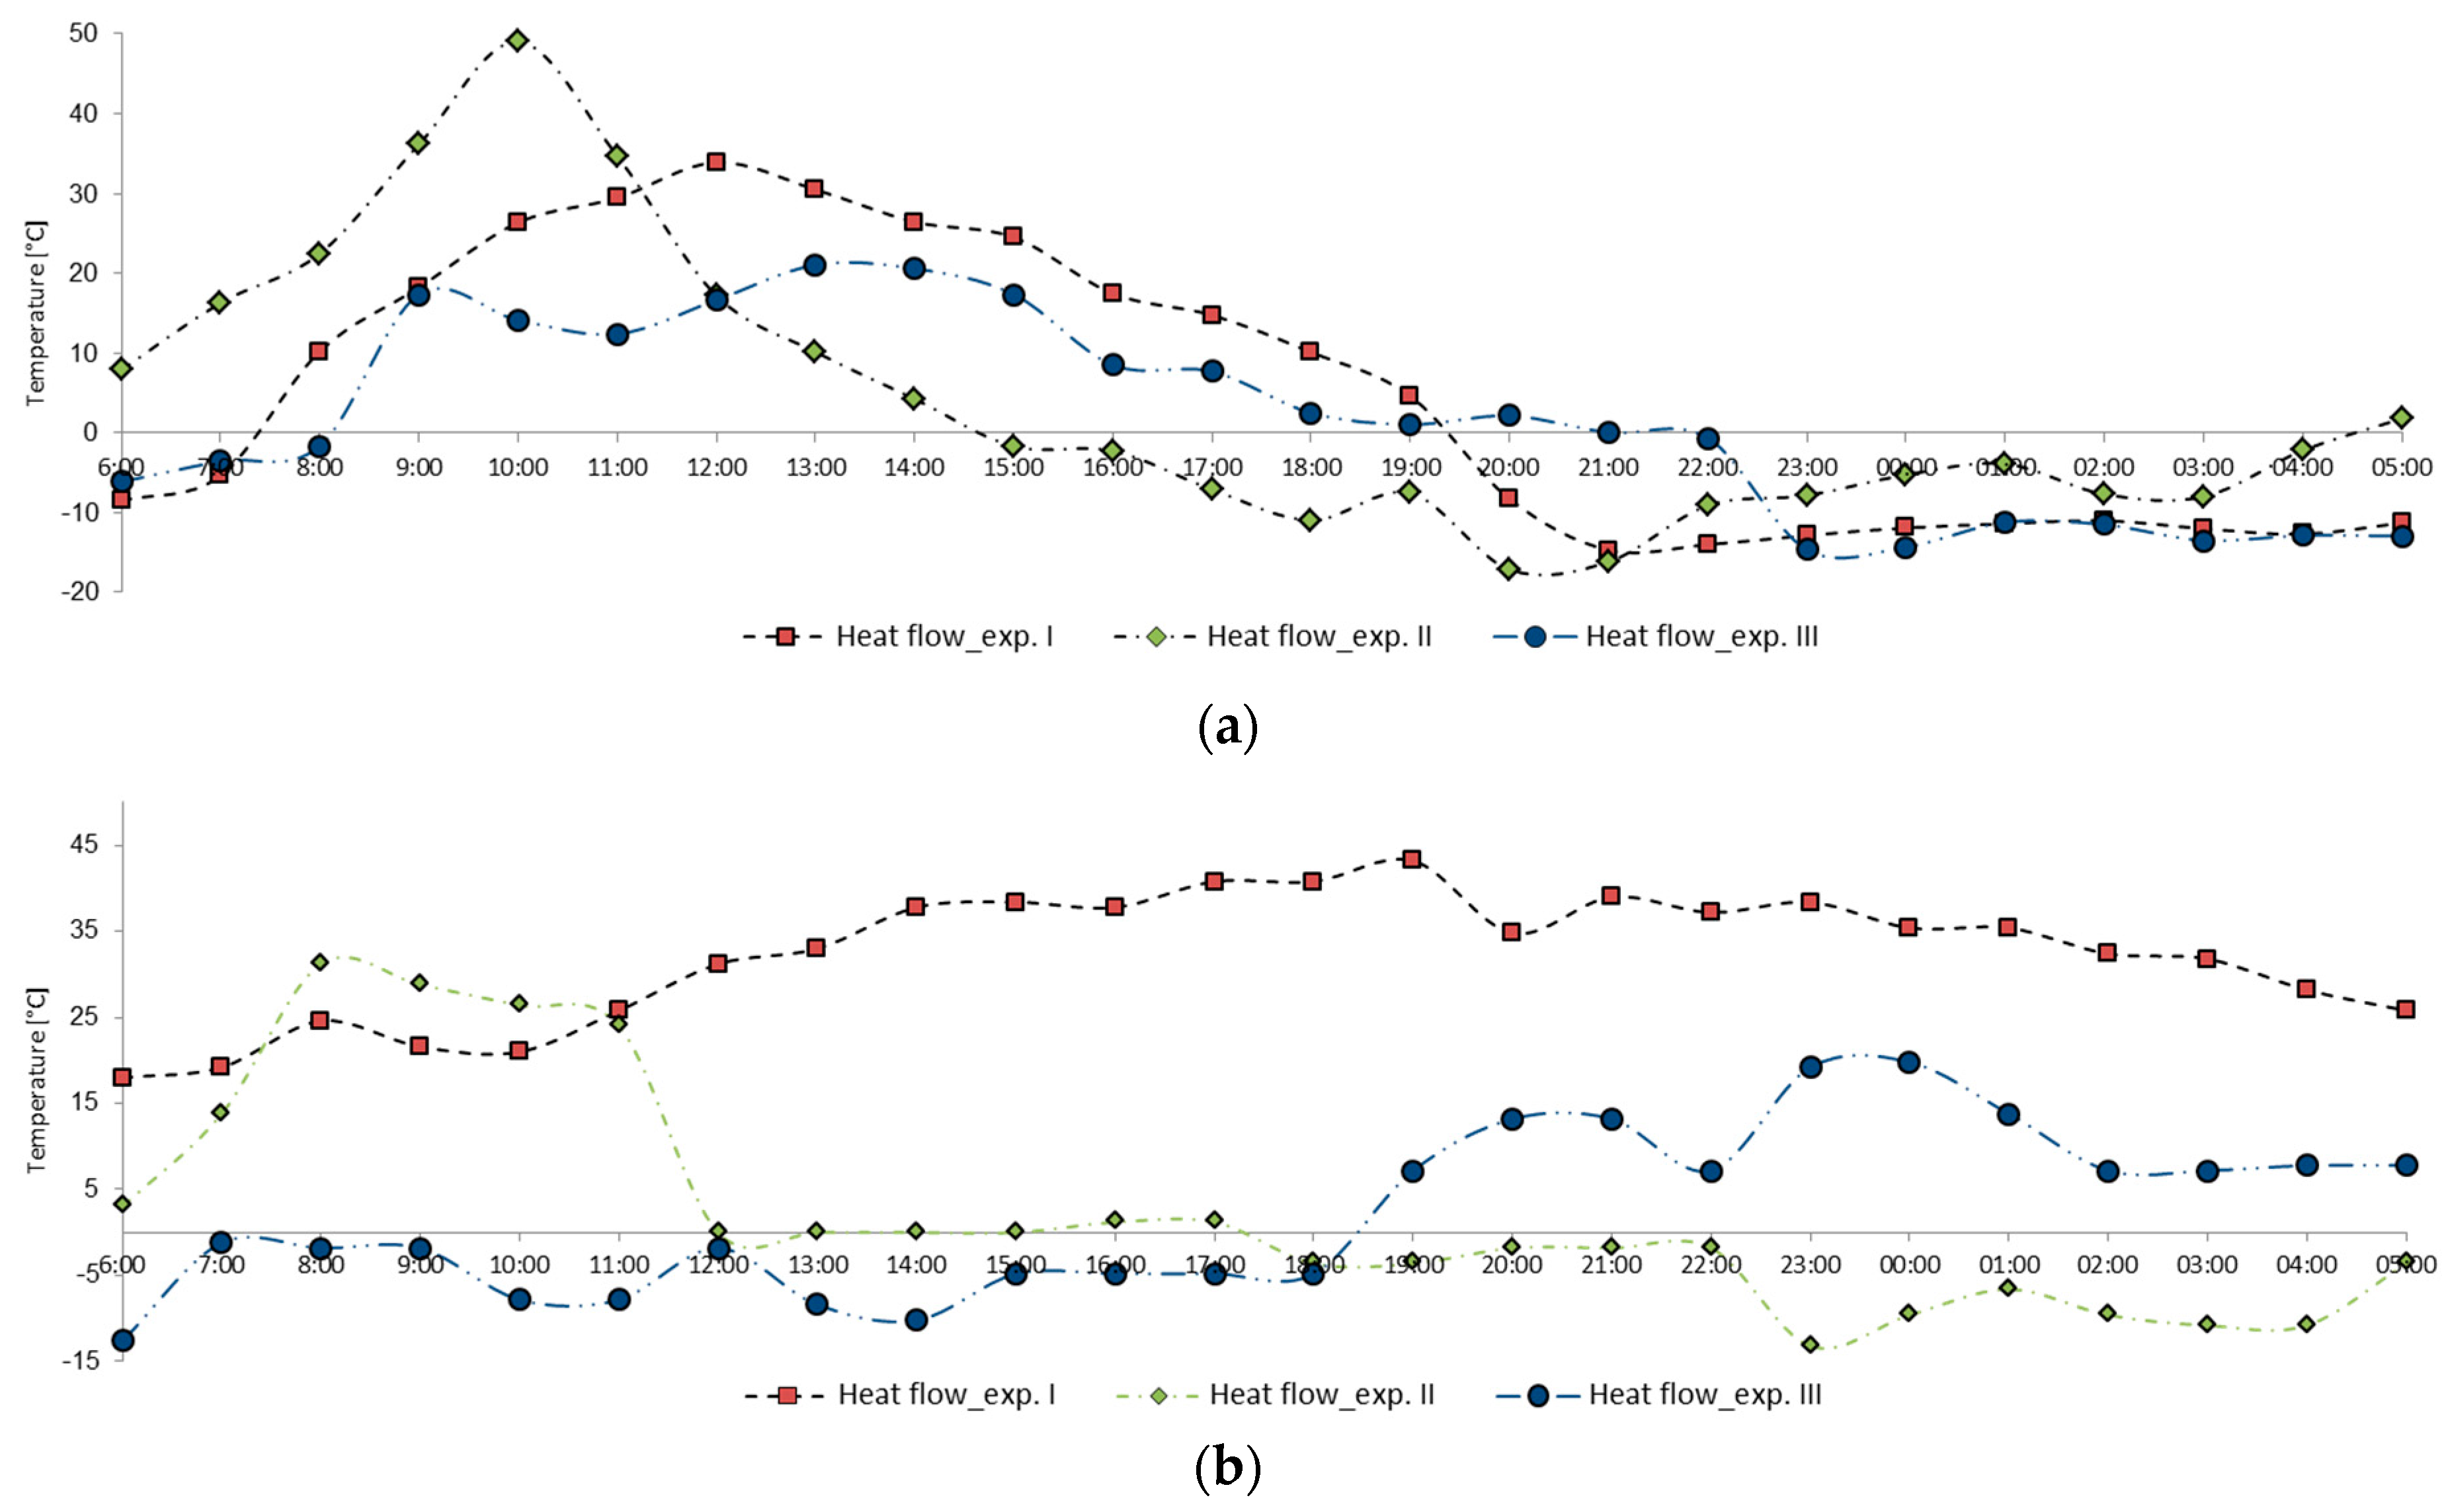
The analysis of dynamic thermal characteristics was calculated based on the value of heat flow, Q (W/m2) [3] that passed the entire wall section of the measured façade during the day period, as follows:
Q = Δ T R Wall = T se , mean T si , mean R Wall = Σ n = 1 24 ( T se , n T si , n ) R Wall
where, Δ T is calculated from the difference between the average of surface temperature, Tse,mean − Tsi,mean, °C. Rwall (K m2/W) is the sum of thermal resistance based on the geometrical and thermophysical properties of the material layers that comprise the configuration, and finally n denotes the measured time intervals (n = 24 hourly intervals during measurement time).
In this regard, a simple way to characteristic the leaves covered area was adopted based on Odum theory [27]. Traditionally, profile of leaves covered area on the plants was already employed in farming area to measure the growth of crops, including their irrigation schedule [28]. As opposed to previous studies that mostly used homogeneous species [3,12,14,18,29,30,31,32,33,34], in this study Passiflora flavicarva and Pseudocalymma alliaceum were used as greenery elements [15,19]. They are evergreen species and based on the observations, the proportion of each vegetation had balanced distribution of leaves covered area.
To determine the proportion of leaves covered area, in every week, documentation of the green façade was taken as an initial simulation to determine the leaves densities. From the simulation, there were 10 variations of leaves densities, from 0–100%. Since previous studies [14,29] already used 37%, 64%, 87.5% and 100% as their quantity of leaves covered area, the chosen leaves covered area in this study are 0%, 50% and 90%.

3. Discussion

3.1. Temperature Profiles

Figure 6a–c shows the temperature profiles both in the environment and wall surfaces of each experiment during the data measurement per hour, respectively. The graphs prove quantity of leaves covered area influenced the temperature profile of model and there were four important results that could be obtained from the graphs, as follow:
  • Tmin and Tmax from experiment I was highest compared with Tmin and Tmax of all other experiments.
  • The daily temperature differences from experiment I, II, and III created decreasing ratios among the peak temperatures between exterior and interior surface. It is possible that the results of decrement factors would be different.
  • Decreasing temperature on the exterior façade of experiment II and III was faster than experiment I. Resulting longer cooling period, while on the interior surface temperature, experiment III has the slowest temperature decrease, yet generally still has the lowest temperature profiles.
  • Both outdoor and indoor space temperature of experiment III have lower profile than experiment I and II. For outdoor space temperature was 1–7 °C lower than experiment II and 3.9–9.8 °C, while for indoor space temperature was 0–1.7 °C lower than experiment II and 1.2–2.4 °C lower than experiment I. Results from previous study conducted by Laopanitchakul et al. [29] also showed performance on the indoor space temperature of green façade with 87.5% leaves covered area was 3.5 °C and 2 °C lower than green façade with 37% and 64% covered area.
Furthermore, based on the Table 4, in bare wall and green façade sections, the average temperatures on the exterior surface were lower than the outdoor environment, Tse < To, while, Laopanitchakul et al. [29] had opposite result where exterior surfaces temperature of all green façade experiments were higher than outdoor temperature, Tsurface,gr > Toutdoor. However, it should be noted that the outdoor temperature in this research were not outdoor temperatures near measurement facades as in present study. It was ambient temperature around building model.
Moreover, concerning in the experiment I, the average of interior surface temperature was higher than indoor space temperature, Tin > Tsi. The difference was negative (−3.85 °C), which means the interior surface received higher heat transfer from the exterior surface and outdoor environment, then released it to the indoor environment, while experiment II and III show different result where the average of interior surface temperature was lower than the average of indoor space temperature, Tin < Tsi. Clearly, the temperature difference, Tin − Tsi, in experiment II (1.81 °C) was higher than experiment III (1.70 °C).
Thus, it can be obtained that experiment I had a greater potential for increased temperature through the building façade. It proved the positive effects of greater quantity of leaves covered area by prevented direct solar radiation and resulting in decreasing temperature on the building. The data reveal that the difference between the average of space and surface temperature for exterior and interior in experiment I were higher compared to the those in experiment II and III, Texp3 < Texp2 < Texp1. The greater the green covered area, the more the temperature decreased.

3.2. Maximum and Minimum Daily Temperature Differences

As described in Table 5, mostly maximum temperature in experiment III were lower than experiment I and II, Texp3,max < Texp2,max < Texp1,max. At this point, the experiments proved quantity of leaves covered area effected in reducing the temperature. The greater leaves covered area, the lower value of maximum temperature.
Further result can be seen in the Figure 7a–d. It shows maximum of exterior surface temperature in experiment I and experiment II was higher than those at outdoor temperature, Tse,max > To,max. It seems bare wall gained more direct solar radiation and led to increase of temperature [3]. Refers to experiment III, the result was different, where maximum of exterior surface temperature was lower than outdoor temperature, Tse,max > To,max.
Experimental study conducted in the past also showed similar result where the maximum of the exterior surface temperature on the green façade model was 40 °C (37%), 37 °C (64%) and 35 °C (87.5%) [29]. Another experiment conducted by Eumorfopoulou and Kontoleon [3] also showed maximum temperature on the exterior surface of bare wall model notably higher than those at outdoor environment, Tse,max > To,max, with the value swing was about 6.8–10.8 °C. It was similar with the results in experiment I and II, yet with higher differences, can be seen in Table 6. However, according to Eumorfopoulou and Kontoleon [3], the effect of leaves covered area depends primarily on the outdoor absorption coefficient of the wall layer, thermal resistance and capacity of wall surface.
Moreover, the maximum temperature on the interior surface of bare wall was higher than its indoor space temperature, Tsi,max > Tin,max. Bare wall section in the study of Eumorfopoulou and Kontoleon [3] also showed similar result, Tin,max < Tsi,mas, while maximum value in the case of green façade was Tin,max > Tsi,max for experiment II and Tin,max < Tsi,max for experiment III. Even though, experiment III has higher maximum interior surface, yet the difference was less than 1 °C. Whereas, in the previous study, the corresponding values in the case of green covered wall do not differ significantly, Tin,max ≈ Tsi,max [3]. Although the results from present study was different with previous study, yet both revealed that maximum temperature on the exterior and interior side of bare wall were higher than green façade. Furthermore, in experiment III with greater leaves covered area, the maximum temperature was the lowest among other experiments. It showed the greater layer of vegetation will more prevent the overheating on the façade.
While for the minimum temperature profile, all experiments showed similar results, the exterior surface temperatures were significantly lower than outdoor temperatures, Tse,min < To,min. Even though result of minimum surface temperature in experiment III was higher compared to experiment II, Tse,expIII,min > Tse,expII,min, yet the results also showed green facades had lower temperature profiles than bare wall. Furthermore, regarding the interior sections, concerning the bare wall model, Tsi,min > Tin,min, the result was similar with Eumorfopoulou and Kontoleon, Tin,min > Tsi,min [3]. In addition, the negative result (−2.0 °C) in section Tin − Tsi in the experiment I due to the minimum of indoor temperature was lower than the interior surface temperature. It can be obtained that bare wall section more potential to transfer heat flow due to exposed directly to solar radiation. While, the minimum of indoor temperatures in experiment II and III were higher than the minimum of their outdoor temperatures, Tin,min > To,min. The difference of minimum temperatures in both experiments were lower than experiment I. Respectively, from the greatest differences were experiment I, experiment II and experiment III. The results proved that quantity of leaves covered area in green façade effected in reducing heat transfer and improved interior surface temperature [3].

3.3. Daily Temperature Differences Between Space and Surface Temperature

Figure 8 shows the daily temperature differences between outdoor temperatures–indoor temperatures, To − Tin, and exterior–interior surface temperatures, Tse − Tsi during data measurement.
In Figure 8a, during data measurement, experiment I had higher temperature differences between outdoor and indoor temperatures than the other experiments. The fluctuation of temperature differences was 3.0 °C to 7.2 °C due to outdoor temperatures being higher than indoor temperature. On the other hand, fluctuations of temperature differences in experiments II and III were, respectively, −2.2 °C to 5.8 °C and −2.1 °C to 3.3 °C. Compare to previous study, these fluctuation of temperature differences were lower. In the study of Eumorfopoulou and Kontoleon [3] these values vary from 1.9 °C to 8.3 °C for the time period of the field measurement. The negative results show at the moment indoor temperature was lower than outdoor temperature due to the amount of solar energy that entered the building being reduced by plants foliage.
More specifically, compared to experiment II, results in experiment III showed negative values during day time and positive values during night period. Possibility, greater leaves covered area could generate lower temperatures due to increased transfer of heat flow from interior to exterior, especially during the day time when solar radiation intensities were high, and stored heat within the surface element during night period [3].
Figure 8b shows the differences between exterior and interior surface temperatures. It seems that during night period, interior surface temperatures of all experiments were lower than exterior surface temperatures. However, during the night period, experiment III had greater temperature differences up to 2.44 °C. As for during day time, experiment II had greater temperature differences up to 8.15 °C. This was due to the maximum temperature of the exterior surface being very high, up to 31.4 °C, while the interior side was very low, up to 23.2 °C.
Finally, it can be concluded that the bare wall section that was directly exposed to solar radiation led to positive values in temperature differences.

3.4. Air and Surface Temperature Reduction Between Bare Wall and Green Façades

Thermal analysis was also done as temperature behavior of experiment I was higher than experiment II and experiment III, as can be seen in Figure 9a–d. The value of To,exp I − To,exp III > To,exp I − To,exp II as well as Tin,exp I − Tin,exp III > Tin,exp I − Tin,exp II, as illustrated in Figure 9a,b, possibility due to space temperature in the experiment III being lower than experiment II.
The extensive temperature variation was found in To,exp I − To,exp III, mostly from morning to evening. It showed that experiment III with greater leaves covered area provided cooler ambient temperatures than experiment II, while in the night, To,exp I − To,exp III was lower. This means that during the night period, the temperature around the green façade was warmer due to growth activities and biological roles of vegetation [14]. As for indoor temperature, during data measurement, Tin,exp I − Tin,exp III was always greater than Tin,exp I − Tin,exp II. Lower indoor temperature in experiment III resulted in greater temperature reduction.
The average of temperature variation To,exp I − To,exp III was 3.9 °C and reaching up to 9.8 °C. As for the average of To,exp I − To,exp II it was −0.1 °C and reaching up to 9.4 °C. Negative results showed that at that time, the outdoor temperature of experiment II was higher than experiment I, To,exp II > To,exp I, while for indoor ambient temperature, the average of temperature variation Tin,exp I − Tin,exp III was 1.2 °C and reaching out to 2.4 °C. As for the average of Tin,exp I − Tin,exp, it was 0.2 °C and reaching up to 2.0 °C.
Concerning experiment II, as illustrated in Figure 9a, at 9:00 a.m. data showed a 0 °C reduction. This means that at that time, outdoor temperatures between experiment II and I were equivalent, To,expI ≈ To,expII. Furthermore, the time around 8:00 a.m. to 10 a.m. also showed an extreme temperature reduction, respectively, of 0.5 °C, 0.0 °C, −0.1 °C, and 0.5 °C. Possibility, this was due to weather conditions or data collection error at that time. However, drawing conclusions only based on these results is very unsafe.
Further data analysis also revealed that lack of shading from the greenery layer created faster heating on the façade surface, especially in the day time. The clear result illustrated during data measurement the difference between surface temperature of experiment I and III was higher than the result from experiment I and II, both for exterior and interior surfaces, Tse,exp I − Tse,exp III > Tse,exp I − Tse,exp II, and Tsi,exp I − Tsi,exp III > Tsi,exp I − Tsi,exp II, as illustrated in Figure 9c,d.
The average of temperature variation Tse,exp I − Tse,exp III was 4.8 °C and reaching out to 11.6 °C. As for the average of Tse,exp I − Tse,exp II was 0.3 °C and reaching out to 11.0 °C, while on the interior surface, the average of temperature differences Tsi,exp I − Tsi,exp III was 4.6 °C and reaching out to 11.0 °C. In other hand the average of Tsi,exp I − Tsi,exp II was 3.9 °C and reaching out to 8.8 °C. On average the differences were 6.8 °C (Tse,exp I − Tse,exp II), 7.8 °C (Tse,exp I − Tse,exp III), 6.7 °C (Tsi,exp I − Tsi,exp II), and 7.3 °C (Tsi,exp I − Tsi,exp III).
In general, the above measurements was similar with those of Eumorfopoulou and Kontoleon [3] where indoor temperature range was reduced from 27.9 °C to 29.5 °C in the green façade section and 27.0 °C to 28.6 °C in the bare wall section. The greater reduction occurred since exterior façade was covered fully by vegetation. Even though it showed greater temperature reduction, yet results in the present study showed more detail based on specific of leaves covered area.

3.5. Temperature Reduction Between Surface Temperature and Space Temperature

As presented earlier in Figure 7, the peaks of surface temperature on the bare wall model were higher than the green façades model. Thus, the temperature deviations in the green façade model, both for experiment II and III, were improved during day time. However, the temperature in experiment III tended to be cooler than experiment II, showing that the quantity of leaves covered area had great impact on overheating protection.
The graphs in Figure 10a,b illustrate the reduction between surface and space temperature, both for exterior–interior façade surfaces and outdoor–indoor environments of the models. In Figure 10a, all of the three data measurements showed similar profiles, where experiment III, Tse, exp III − To, exp III, had greater temperature differences, on average −6.3 °C and reaching up to 2.8 °C, while for experiment I and II, respectively, they were −4.0 °C to 4.2 °C, and −4.0 °C to 1.6 °C. Furthermore, on the exterior side, negative temperature variations occurred in the morning and night periods. Possibility, heat transfer was affected by stored heat inside the thermal mass of the building envelope and at that time the exterior surface lost heat due to transfer of the heat flow from exterior to interior.
As opposed to the results shown in Figure 10a, data analysis in Figure 10b illustrated positive temperature reduction of experiment I, indicating the indoor temperatures were higher than temperatures in the interior surface: the average of Tin > Tsi was 1.5 °C and reaching out to 5.7 °C. Thus, warmer conditions occurred inside the building, while experiments II and III illustrated negative temperature reduction. This means that interior surface temperatures were lower than the indoor environment, Tsi < Tin, and generated cooler ambient temperatures inside the building, respectively, from experiment II to experiment III was −3.2 °C to −0.3 °C and −4.1 °C to 0.2 °C.
Furthermore, it should be noted that, as seen in Figure 10b, the average of Tsi,exp III − Tin,exp III was greater than Tsi,exp II − Tin,exp II; however, at 11:00 p.m. to 1:00 a.m., reduction of positive temperatures occurred in experiment III. This means that at that time, interior surface temperatures were higher than the indoor environment, Tsi > Tin. Moreover, from midnight to morning, temperature reduction in experiment III was lower than experiment II, Tsi,exp III − Tin,exp III < Tsi,exp II − Tin,exp II, thus creating warmer ambient temperatures inside in experiment III. Accordingly, in the cooling period there was a possibility to minimize the energy for heat load.

3.6. Time Lag and Decrement Factor

As mentioned in the research method, the decrement factor f is the decreasing ratio of the temperature amplitudes, concerning the propagation of heat flows with diurnal period P from the exterior and interior façade. Time lag is the time delay due to the thermal mass [25,26]. The results of the calculations of decrement factor and time lag in each experiment can be seen in Table 7.
Time lag of experiment III was nearly two times of the result from experiment II and three times from experiment I. The longer the time lag, the longer it takes for heat to pass through the walls. It seems that green façades improved wall thickness and resulted in the increase in the time lag. Moreover, the covered area of the green façade also acted as an additional layer on the wall and prevented direct solar radiation from hitting the façade surface. As expected in the hypothesis, the greater the covered area, the longer the time lag.
A previous study conducted by Widiastuti et al. [35] also proved that a chamber equipped with a green façade had a longer time lag (one hour) compared to a chamber with a bare wall. However, due to the timing of data measurement, the authors could not provide profile temperatures and time lags during the night.
Furthermore, in this study, referring to the previous discussion in Section 3.1., experiment II, which had 50% green façade covered area, showed faster maximum interior surface temperature occurrence than experiment I (experiment II at 5:00 p.m.; experiment I at 7:00 p.m.). This result was surprising. At that time, the weather conditions had potential influence in postponing the heat transfer, although to prove this requires further study.
On the other hand, as seen in Table 7, experiment III had the highest value of decrement factor. The result was opposite to time lag theory, where the longer time delay should be followed by a smaller decrement factor [22]. Expected results were shown in experiment II, where the decrement factor value was lower than experiment I. This means that experiment II had lower heat storage capability than experiment I, resulting in lower heat fluctuation from exterior to interior.
As for experiment III, it had the highest value of decrement factor compared with those in experiment I and II. The result was opposite in terms of time lag. Based on the data analysis, this occurred since maximum and minimum temperatures in the interior surface were higher and lower compared to experiment II and experiment I, respectively, as can be seen in Figure 7. Similar result also pointed out where decrement factor on the section of bare wall was lower than wall covered by plant section due to improved thermal performance on the indoor and outdoor environment [3]. Moreover, Eumorfopoulou and Kontoleon [3] explained that in their study, the interior surface temperature swings on the green façade were not proportionally smoothed compared with those at bare wall. Minimum and maximum on the temperature limit on the interior surface of green façade appeared in lower value compared to bare wall resulting in increasing of decrement factor.
However, in general, experiment III had the lowest average temperature and the longest time lag. Also results from time lag and decrement factor calculations in this study given new findings. When the surface temperature improved, the value of the decrement factor increased. This can be seen from the strong values of decrement factors that were more obvious in experiment III.

3.7. Heat Flow Characteristics of Surface Temperature and Air Temperature

Heat flows analysis was divided into examination of wall sections and indoor air spaces, as illustrated in Figure 11a,b. The results show the contribution of the green façade to reduce cooling load demand. Both Figure 11a,b show the positive and negative indication as direction of heat transfer.
As explained by Eumorfopoulou and Kontoleon [3], a positive value expresses heat transfer from the exterior to the interior of a building, which was an unwanted condition, while heat transfer from the interior to exterior indicated a negative value and created a cooler environment.
It can be seen in Figure 11a, heat flows through experiment II with 50% leaves covered area had a faster cooling period. Negative values of heat flows started at 3:00 p.m. In experiment I and III, heat flow started at 8:00 p.m. and 11:00 p.m., respectively. However, experiment III had the lowest average of heat flow (1.61 W/m2), followed by experiment II (3.88 W/m2), and experiment I (4.69 W/m2). Moreover, during the day time, experiment III had the longest cooling period from 9:00 a.m. to 12:00 a.m. (4 h), while for experiment II it occurred from 1:00 p.m. to 2.00 p.m. (2 h). It is clear that percentage of leaves covered area effected the cooling down of the building envelope by reducing the quantity of heat flow from the exterior to the interior façade.
Concerning experiment II, at 9:00 a.m. to 11:00 a.m., the results of heat flow calculation were very extreme, respectively, 28.9 W/m2, 39.2 W/m2, and 27.8 W/m2.These results related to the results in Figure 8b, where the differences between exterior and interior surface temperatures in experiment II were higher than the other experiments. As mentioned before, this was possibly due to weather condition or errors in data collection at that time.
Figure 11b illustrates heat flow through indoor air spaces, where in experiment I, all heat flow calculation showed positive values. This means that unwanted conditions occurred inside the building due to heat transfer from outdoor to indoor environments. From experiment I to experiment III, the average heat flows were 25.72 W/m2, 1.76 W/m2, and 1.70 W/m2, respectively.
Similar to results shown in Figure 11a, it seems that from 8:00 a.m. to 11:00 a.m., experiment II also had extreme heat flows inside the indoor air space. Respectively, heat flow calculations were 25.00 W/m2, 23.00 W/m2, 21.10 W/m2, and 19.20 W/m2. After that, heat flow showed 0.00 W/m2 until 3:00 p.m. due to balanced temperatures of indoor and outdoor spaces.
More specifically, compared to experiment III, during the day time from 6:00 a.m. to 6:00 p.m., heat flows show negative values with an average of −4.47 W/m2. In the same period, this result was 12.22 W/m2 lower than experiment II and 28.47 W/m2 lower than experiment III, while during the night period, heat flows in experiment III showed positive values due to heat transfer from outdoor to indoor. However, the value of heat flow in experiment III was still far below experiment I. Respectively, the average was 8.99 W/m2 (experiment III) and 27.75 W/m2 (experiment I), while in the same period, experiment II also had negative values of heat flow (the average −5.10 W/m2), similar with the experiment conducted by Eumorfopoulou and Kontoleon [3]. Compared to experiment III, results from experiment II were far different. The results were also not compatible with the hypothesis. Further observations are definitely needed to obtain more detailed results.

4. Conclusions

The present study investigates the dynamic thermal characteristic of a 1 m × 1 m × 1 m building model with a green façade under various kinds of leaves covered areas. Three kinds of green façades were used with different quantities of leaves covered areas, including a non-planted wall (experiment I), a green façade with 50% leaves covered area (experiment II), and a green façade with 90% leaves covered area (experiment III). Detailed thermal calculations were done to find out the temperature characteristics, decrement factors, and heat fluxes.
Based on the observation, all experiment sections had average exterior surface temperatures lower than the outdoor environment, Tse < To. As for the average of interior surface, it was higher than the indoor environment for experiment I, Tse < To, where the interior surface received higher heat transfer from the exterior surface and outdoor environment, then released it into the indoor environment. In experiment II and experiment III, the average interior surface temperatures were lower than indoor environment temperatures, Tsi < Tin.
Furthermore, in experiment I and experiment II, the maximum exterior surface temperature was higher than the outdoor space temperature, Tse,max > To,max, while experiment III had the opposite result where maximum of outdoor temperature is higher than maximum of exterior surface temperature, To,max > Tse,max. This means that exterior surfaces of bare walls and façades with less leaves covered area received more direct solar radiation and had more potential to transfer heat flow due to exposure to direct solar radiation. As for minimum temperature profiles, results in experiment II and experiment III were lower than experiment I. At this section, even though too weak, the effect of air movement in the building may have contributed to decreasing the temperature.
Experiment I had the highest temperature differences between outdoor and indoor temperatures. Specific results indicated by experiment III with greater temperature differences reduced the unwanted maximum temperature, especially during the day time, when maximum solar radiation occurred. Lack of shading from a greenery layer created faster heating on the façade surface, especially in the day time. The clear result shown during data measurement was that the difference between surface temperature of experiment I and III was higher than the result from experiment I and II, both for the exterior and interior side. However, during midnight to morning, the temperature reduction in experiment III was lower than experiment II, Tsi,exp III − Tin,exp III < Tsi,exp II − Tin,exp II, due to biological functions provided by greater leaves covered area in the night, which created warmer ambient temperatures.
Moreover, as expected in the hypothesis, the greater the covered area, the longer the time lag. Results from time lag calculations showed that the time lag of experiment III was longer than experiment II and experiment I. This means that in experiment III, heat flows needed the longest time to pass through the wall. On the other hand, experiment III had the highest value of decrement factor. This occurred due to the maximum and minimum temperatures in the interior surface were higher and lower compared to experiment II and experiment I. This result is opposed to time lag theory, which suggests that a longer time delay should be followed by a smaller decrement factor. In the present study, the greater leaves covered area resulted in the decrease of surface temperature and an increase in the value of decrement factor.
As for heat flow characteristics, heat flows through the wall surface in experiment II with 50% leaves covered area had a faster cooling period. However, experiment III had the lowest of average of heat flows in the façade surface (1.61 W/m2), followed by experiment II (3.88 W/m2), and experiment I (4.69 W/m2). For indoor air space, all heat flows calculation in experiment I showed positive values. This means the unwanted condition occurred inside building due to heat transfer from the outdoor to indoor environment. From experiment I to experiment III, the averages of heat flows were 25.72 W/m2, 1.76 W/m2, and 1.70 W/m2. It is clear that the green façade affected the cooling down of the building envelope by reducing the quantity of heat flow from the exterior to interior façade.
However, at certain times in experiment II, some extreme conditions occurred due to outdoor temperatures being too high or balanced with indoor temperatures. As result in experiment II were far different than experiment III and not compatible with the hypothesis.
In the end, the results from this study provide evidence that certain quantities of leaves covered area on green façades can improve the indoor thermal conditions of a building, such that it can be warmer or cooler. However, further study needs to be conducted in order to find out more detailed results regarding the influence of leaves covered area to the thermal characteristics of buildings.

Author Contributions

Conceptualization, R.W.; Methodology, R.W.; Formal Analysis, R.W.; Investigation, R.W.; Data Curation, R.W.; Writing—Original Draft Preparation, R.W.; Writing—Review and Editing, J.Z. and W.C.; Visualization, R.W.; Supervision, J.Z. and W.C.; Project Administration, R.W.; Funding Acquisition, R.W. and W.C.

Funding

This project was completely funded by an LPDP scholarship (Indonesia Endowment Fund for Education), in the batch program V in 2014, under the register number 0038543/TK/T/3/lpdp2014. The authors fully acknowledge the Indonesian Ministry of Finance for the funding that makes this important research work possible.

Acknowledgments

We gratefully thank the Department of Architecture, Diponegoro University, for giving us the license to conduct this research using the miniature house as a model.

Conflicts of Interest

The authors declare no conflict of interest.

References

  1. Krushe, P.; Krushe, M.; Althaus, D.; Gabriel, I. Okologisches Bauen Herausgegeben vom Umweltbundesamt; Bauverlag: Wiesbaden, Germany; Berlin, Germany, 1982. [Google Scholar]
  2. Eggenberger, A. Bauphysikalische Vorga¨nge im begru¨ nten Warmdach. Das Gartenamt 1983, 6, 32. [Google Scholar]
  3. Eumorfopoulou, E.A.; Kontoleon, K.J. Experimental approach to the contribution of plant-covered walls to the thermal behaviour of building envelopes. Build. Environ. 2009, 44, 1024–1038. [Google Scholar] [CrossRef]
  4. Wilmers, F. Effects of vegetation on urban climate and buildings. Energy Build. 1990, 15, 507–514. [Google Scholar] [CrossRef]
  5. Bass, B.; Baskaran, B. Evaluating Rooftop and Vertical Gardens as an Adaptation Strategy for Urban Areas; NRCC-46737, Project number A020, CCAF Report B1046; Institute for Research and Construction, National Research Council: Ottawa, ON, Canada, 2003. [Google Scholar]
  6. Eumorfopoulou, E.; Aravantinos, D. The contribution of a planted roof to the thermal protection of buildings in Greece. Energy Build. 1998, 27, 29–36. [Google Scholar] [CrossRef]
  7. Kontoleon, K.J.; Bikas, D.K. The effect of south wall’s outdoor absorption coefficient on time lag, decrement factor and temperature variations. Energy Build. 2007, 39, 1011–1018. [Google Scholar] [CrossRef]
  8. McPherson, E.G. Preserving and restoring urban biodiversity: Cooling urban heat islands with sustainable landscapes. In The Ecological City; Platt, R.H., Rowntree, R.A., Muick, P.C., Eds.; University of Massachusetts Press: Amherst, MA, USA, 1994; pp. 151–172. [Google Scholar]
  9. Mazzali, U.; Peron, F.; Romagnoni, P.; Pulselli, R.M.; Bastianoni, S. Experimental investigation on the energy performance of living walls in a temperate climate. Build. Environ. 2013, 64, 57–66. [Google Scholar] [CrossRef]
  10. Berardi, U.; Tronchin, L.; Manfren, M.; Nastasi, B. On the effects of variation of thermal conductivity in buildings in the Italian construction sector. Energies 2018, 11, 872. [Google Scholar] [CrossRef]
  11. Minke, G.; Witter, G. Häuser mit Grünen pelz: Ein Handbuch zur Hausbegrünung; Fricke: Frankfurt/Main, Germany, 1982. [Google Scholar]
  12. Perini, K.; Ottelé, M.; Fraaij, A.L.A.; Haas, E.M.; Raiteri, R. Vertical greening systems and the effect on air flow and temperature on the building envelope. Build. Environ. 2011, 46, 2287–2294. [Google Scholar] [CrossRef]
  13. Holm, D. Thermal improvement by means of leaf cover on external walls-a simulation model. Energy Build. 1989, 14, 19–30. [Google Scholar] [CrossRef]
  14. Kontoleon, K.J.; Eumorfopoulou, E.A. The effect of the orientation and proportion of a plant-covered wall layer on the thermal performance of a building zone. Build. Environ. 2010, 45, 1287–1303. [Google Scholar] [CrossRef]
  15. Widiastuti, R.; Caesarendra, W.; Prianto, E.; Budi, W.S. Study on the leaves densities as parameter for effectiveness of energy transfer on the green facade. Buildings 2018, 8, 138. [Google Scholar] [CrossRef]
  16. Pérez, G.; Coma, J.; Sol, S.; Cabeza, L.S. Green facade for energy savings in buildings: The influence of leaf area index and facade orientation on the shadow effect. Appl. Energy 2017, 187, 424–437. [Google Scholar] [CrossRef]
  17. Šuklje, T.; Mohamed Hamdy, M.; Arkar, C.; Hensen, J.L.M.; Medved, S. An inverse modeling approach for the thermal response modeling of green façades. Appl. Energy 2019, 235, 1447–1456. [Google Scholar] [CrossRef]
  18. Wong, N.H.; Tan, A.Y.K.; Chen, Y.; Sekar, K.; Tan, P.Y.; Chan, D.; Chiang, K.; Wong, N.C. Thermal evaluation of vertical greenery systems for building walls. Build. Environ. 2010, 45, 663–672. [Google Scholar] [CrossRef]
  19. Widiastuti, R.; Prianto, E.; Budi, W.S. Investigation on the thermal performance of green facade in tropical climate based on the modelling experiment. Int. J. Archit. Eng. Constr. 2018, 7, 26–33. [Google Scholar] [CrossRef]
  20. Widiastuti, R.; Bramiana, C.N.; Harsritanto, B.I.R.; Prabowo, B.N.; Ramandhika, M. Vertical greenery system as the passive design strategy for mitigating urban heat island in tropical area: A comparative field measurement between green facade and green wall. IOP Conf. Ser. Earth Environ. Sci. 2018, 213, 012037. [Google Scholar] [CrossRef]
  21. Lippsmeier, G. Tropenbau Building in the Tropics (in Bahasa: Bangunan Tropis by Syahmir Nasution), 2nd ed.; Indarto, P.W., Ed.; Erlangga: Jakarta, Indonesia, 1994. [Google Scholar]
  22. Asan, H. Numerical computation of time lags and decrement factors for different building materials. Build. Environ. 2006, 41, 615–620. [Google Scholar] [CrossRef]
  23. Luo, C.; Moghtaderi, B.; Sugo, H.; Page, A. Time lags and decrement factors under air-conditioned and free-floating conditions for multi-layer materials. In Proceedings of the Building Simulation 2007 Conference, Beijing, China, 3–6 September 2007. [Google Scholar]
  24. Asan, H.; Sancaktar, Y.S. Effects of wall’s thermophysical properties on time lag and decrement factor. Energy Build. 1998, 28, 159–166. [Google Scholar] [CrossRef]
  25. Asan, H. Investigation of wall’s optimum insulation position from maximum time lag and minimum decrement factor point of view. Energy Build. 2000, 32, 197–203. [Google Scholar] [CrossRef]
  26. Lakatos, A. A theoretical approach to estimate the time lag of building envelopes. In Proceedings of the 16th International Multidisciplinary Scientific Geo Conference SGEM, Albena, Bulgaria, 30 June–6 July 2016. [Google Scholar]
  27. Odum, E.P. Dasar-Dasar Ekologi; Universitas Gajah Mada Press: Yogyakarta, Indonesia, 1993. (In Bahasa) [Google Scholar]
  28. Lang, A.R.G.; Yueqin, X.; Norman, J.M. Crop structure and the penetration of direct sunlight. Agric. For. Meteorol. 1985, 35, 83–101. [Google Scholar] [CrossRef]
  29. Laopanitchakul, V.; Sunarkorn, P.; Srisutapat, A. Climbing-plant on solid wall for reducing energy in tropical climate. In Proceedings of the Sustainable Building Conference 08, Soul, Korea, 21–25 September 2008. [Google Scholar]
  30. Hoyano, A. Climatological uses of plants for solar control and the effects on the thermal environment of a building. Energy Build. 1988, 11, 181–199. [Google Scholar] [CrossRef]
  31. Köhler, M. Green facades-a view back and some visions. Urban Ecosyst. 2008, 11, 423–436. [Google Scholar] [CrossRef]
  32. Sternberg, T.; Viles, H.; Cathersides, A. Evaluating the role of ivy (Hedera helix) in moderating wall surface microclimates and contributing to the bio protection of historic buildings. Build. Environ. 2011, 46, 293–297. [Google Scholar] [CrossRef]
  33. Ottelé, M.; Katia Perini, K. Comparative experimental approach to investigate the thermal behaviour of vertical greened façades of buildings. Ecol. Eng. 2017, 108, 152–161. [Google Scholar] [CrossRef]
  34. Susorova, I.; Azimi, P.; Stephens, B. The effects of climbing vegetation on the local microclimate, thermal performance, and air infiltration of four building facade orientations. Build. Environ. 2014, 76, 113–124. [Google Scholar] [CrossRef]
  35. Widiastuti, R.; Prianto, E.; Budi, W.S. Performance Evaluation of Vertical Gardens. Int. J. Archit. Eng. Constr. 2016, 5, 13–20. [Google Scholar]
Figure 1. Condition of building model [15].
Buildings 09 00075 g001
Figure 2. Details of building model [15].
Buildings 09 00075 g002
Figure 3. Illustration of the wall elements with or without a green façade: (a). Bare wall section; (b). Green façade section.
Buildings 09 00075 g003
Figure 4. Data measurement: (a). experiment I; (b). experiment II; and (c). experiment III.
Buildings 09 00075 g004
Figure 5. The schematic representation of time lag and decrement factor [22].
Buildings 09 00075 g005
Figure 6. Temperature at characteristic sections: (a) Experiment I; (b) Experiment II; (c) Experiment III.
Buildings 09 00075 g006
Figure 7. The different temperature characteristic profiles in each experiment among outdoor temperature, indoor temperature, exterior surface temperature, and interior surface temperature: (a) To and Tse; (b) Tin and Tsi; (c) To and Tin; (d) Tse and Tsi.
Buildings 09 00075 g007
Figure 8. Daily temperature reduction: (a) Space temperature reduction; (b) Surface temperature reduction.
Buildings 09 00075 g008
Figure 9. Air and surface temperature reduction: (a) Outdoor temperature reduction; (b) Indoor temperature reduction; (c) Exterior surface temperature reduction; (d) Interior temperature reduction
Buildings 09 00075 g009
Figure 10. Temperature reduction between surface temperature and space temperature: (a) Exterior temperature and outdoor temperature; (b) Interior temperature and indoor temperature.
Buildings 09 00075 g010
Figure 11. Heat flow characteristics: (a) Heat flow of building surface; (b) Heat flow of air temperature.
Buildings 09 00075 g011
Table 1. Details of local climate conditions during data measurement [15].
Type of ExperimentsDateDetails of ExperimentAverage of Local Climate Condition
HumidityTemperatureAir Velocity
Experiment 1December 10Model without green façade (0%)78%26.0 °C4.7 m/s
Experiment 2December 13Green façade 50%80%25.48 °C5.0 m/s
Experiment 3December 16Green façade 90%80%24.6 °C5.2 m/s
Table 2. Details of building model [15].
Details of Building ModelSpecifications
Model size1 m × 1 m × 1 m
Roof materialAsbestos
Roof shapeGable roof
Wall materialBrick
Inlet outletPorosity 30%
Floor materialWhite ceramic
Ceiling materialAsbestos
Position of openingInlet in the front and outlet in the back
Table 3. Details of wall material in house miniature.
Type of Materiald (cm)k (W/m2 K)ρ (kg/m3)Cp (J/kg K)
Brick 120.721900900
Table 4. Difference between the average of space and surface temperature.
Type of ExperimentsThe Average of Temperature (°C)Differences of the Average Temperature (°C)
ToTinTseTsiTo − TseTin − Tsi
Experiment 131.7226.3630.9930.210.73−3.85
Experiment 225.7125.3424.1823.531.531.81
Experiment 325.0024.6523.2222.951.781.70
To: Outdoor temperature; Tin: indoor temperature; Tse: exterior surface temperature; Tsi: interior surface temperature.
Table 5. Maximum and minimum temperature characteristic in each experiment.
Type of ExperimentMaximum Temperature (°C)Minimum Temperature (°C)
OutdoorIndoorExterior SurfaceInterior SurfaceOutdoorIndoorExterior SurfaceInterior Surface
Experiment 133.727.035.732.229.526.026.628.0
Experiment 230.026.031.425.423.024.520.321.6
Experiment 328.025.125.825.723.024.221.020.7
Table 6. Difference between maximum and minimum of space and surface temperature in each experiment.
Type of ExperimentMaximum Temperature (°C)Minimum Temperature (°C)
To − TseTin − TsiTse − TsiTo − TinTo − TseTin − TsiTse − TsiTo − Tin
Experiment 1−2.0−5.23.56.72.9−2.0−1.43.5
Experiment 2−1.40.66.04.02.72.9−1.3−1.5
Experiment 32.2−0.60.12.92.03.50.3−1.2
To: Outdoor temperature; Tin: indoor temperature; Tse: exterior surface temperature; Tsi: interior surface temperature.
Table 7. Time lag and decrement factor in each experiment.
Type of ExperimentExperiment 1Experiment 2Experiment 3
Time2:00 p.m.–7:00 p.m.10:00 a.m.–5:00 p.m.10:00 a.m.–11:00 p.m.
Decrement factor0.460.341.07
Time lag (hours)5712

