Thermal Performance of Hollow-Core Slab Ventilation System with Macro-Encapsulated Phase-Change Materials in Supply Air Duct


Abstract
:1. Introduction
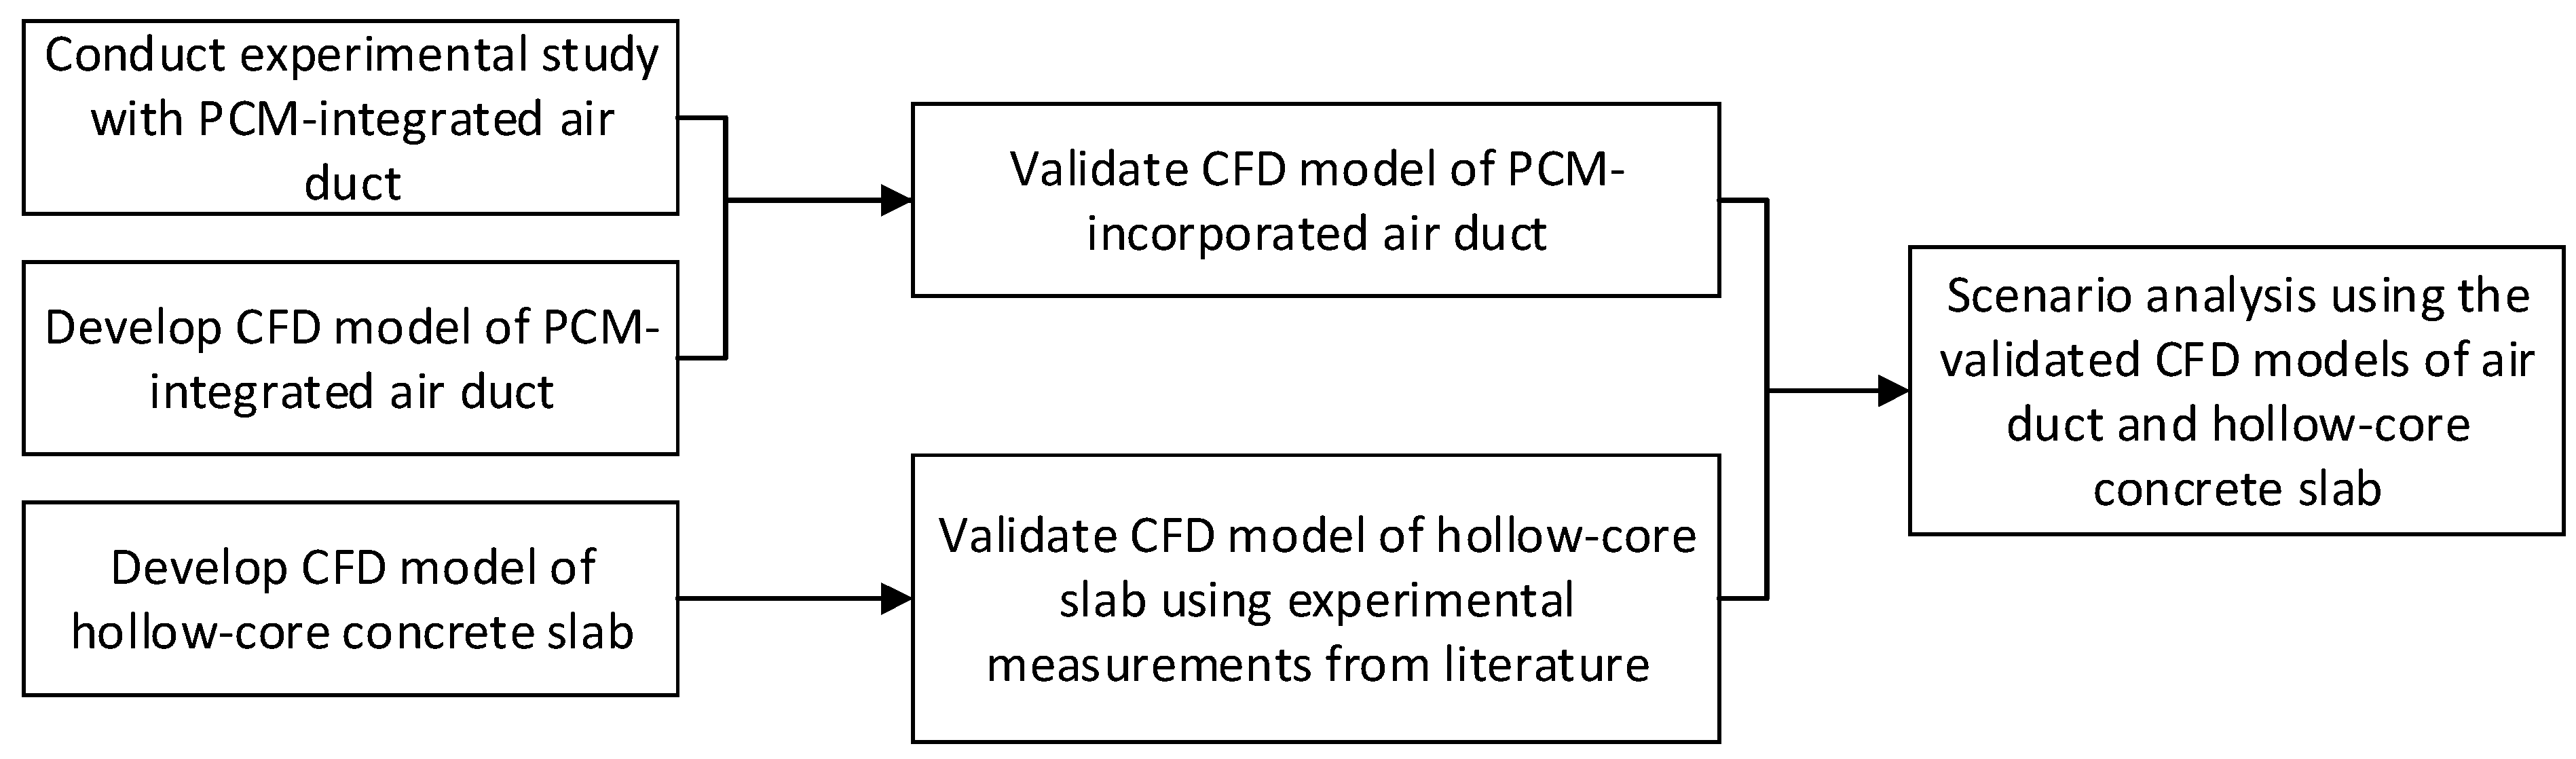
2. Methodology
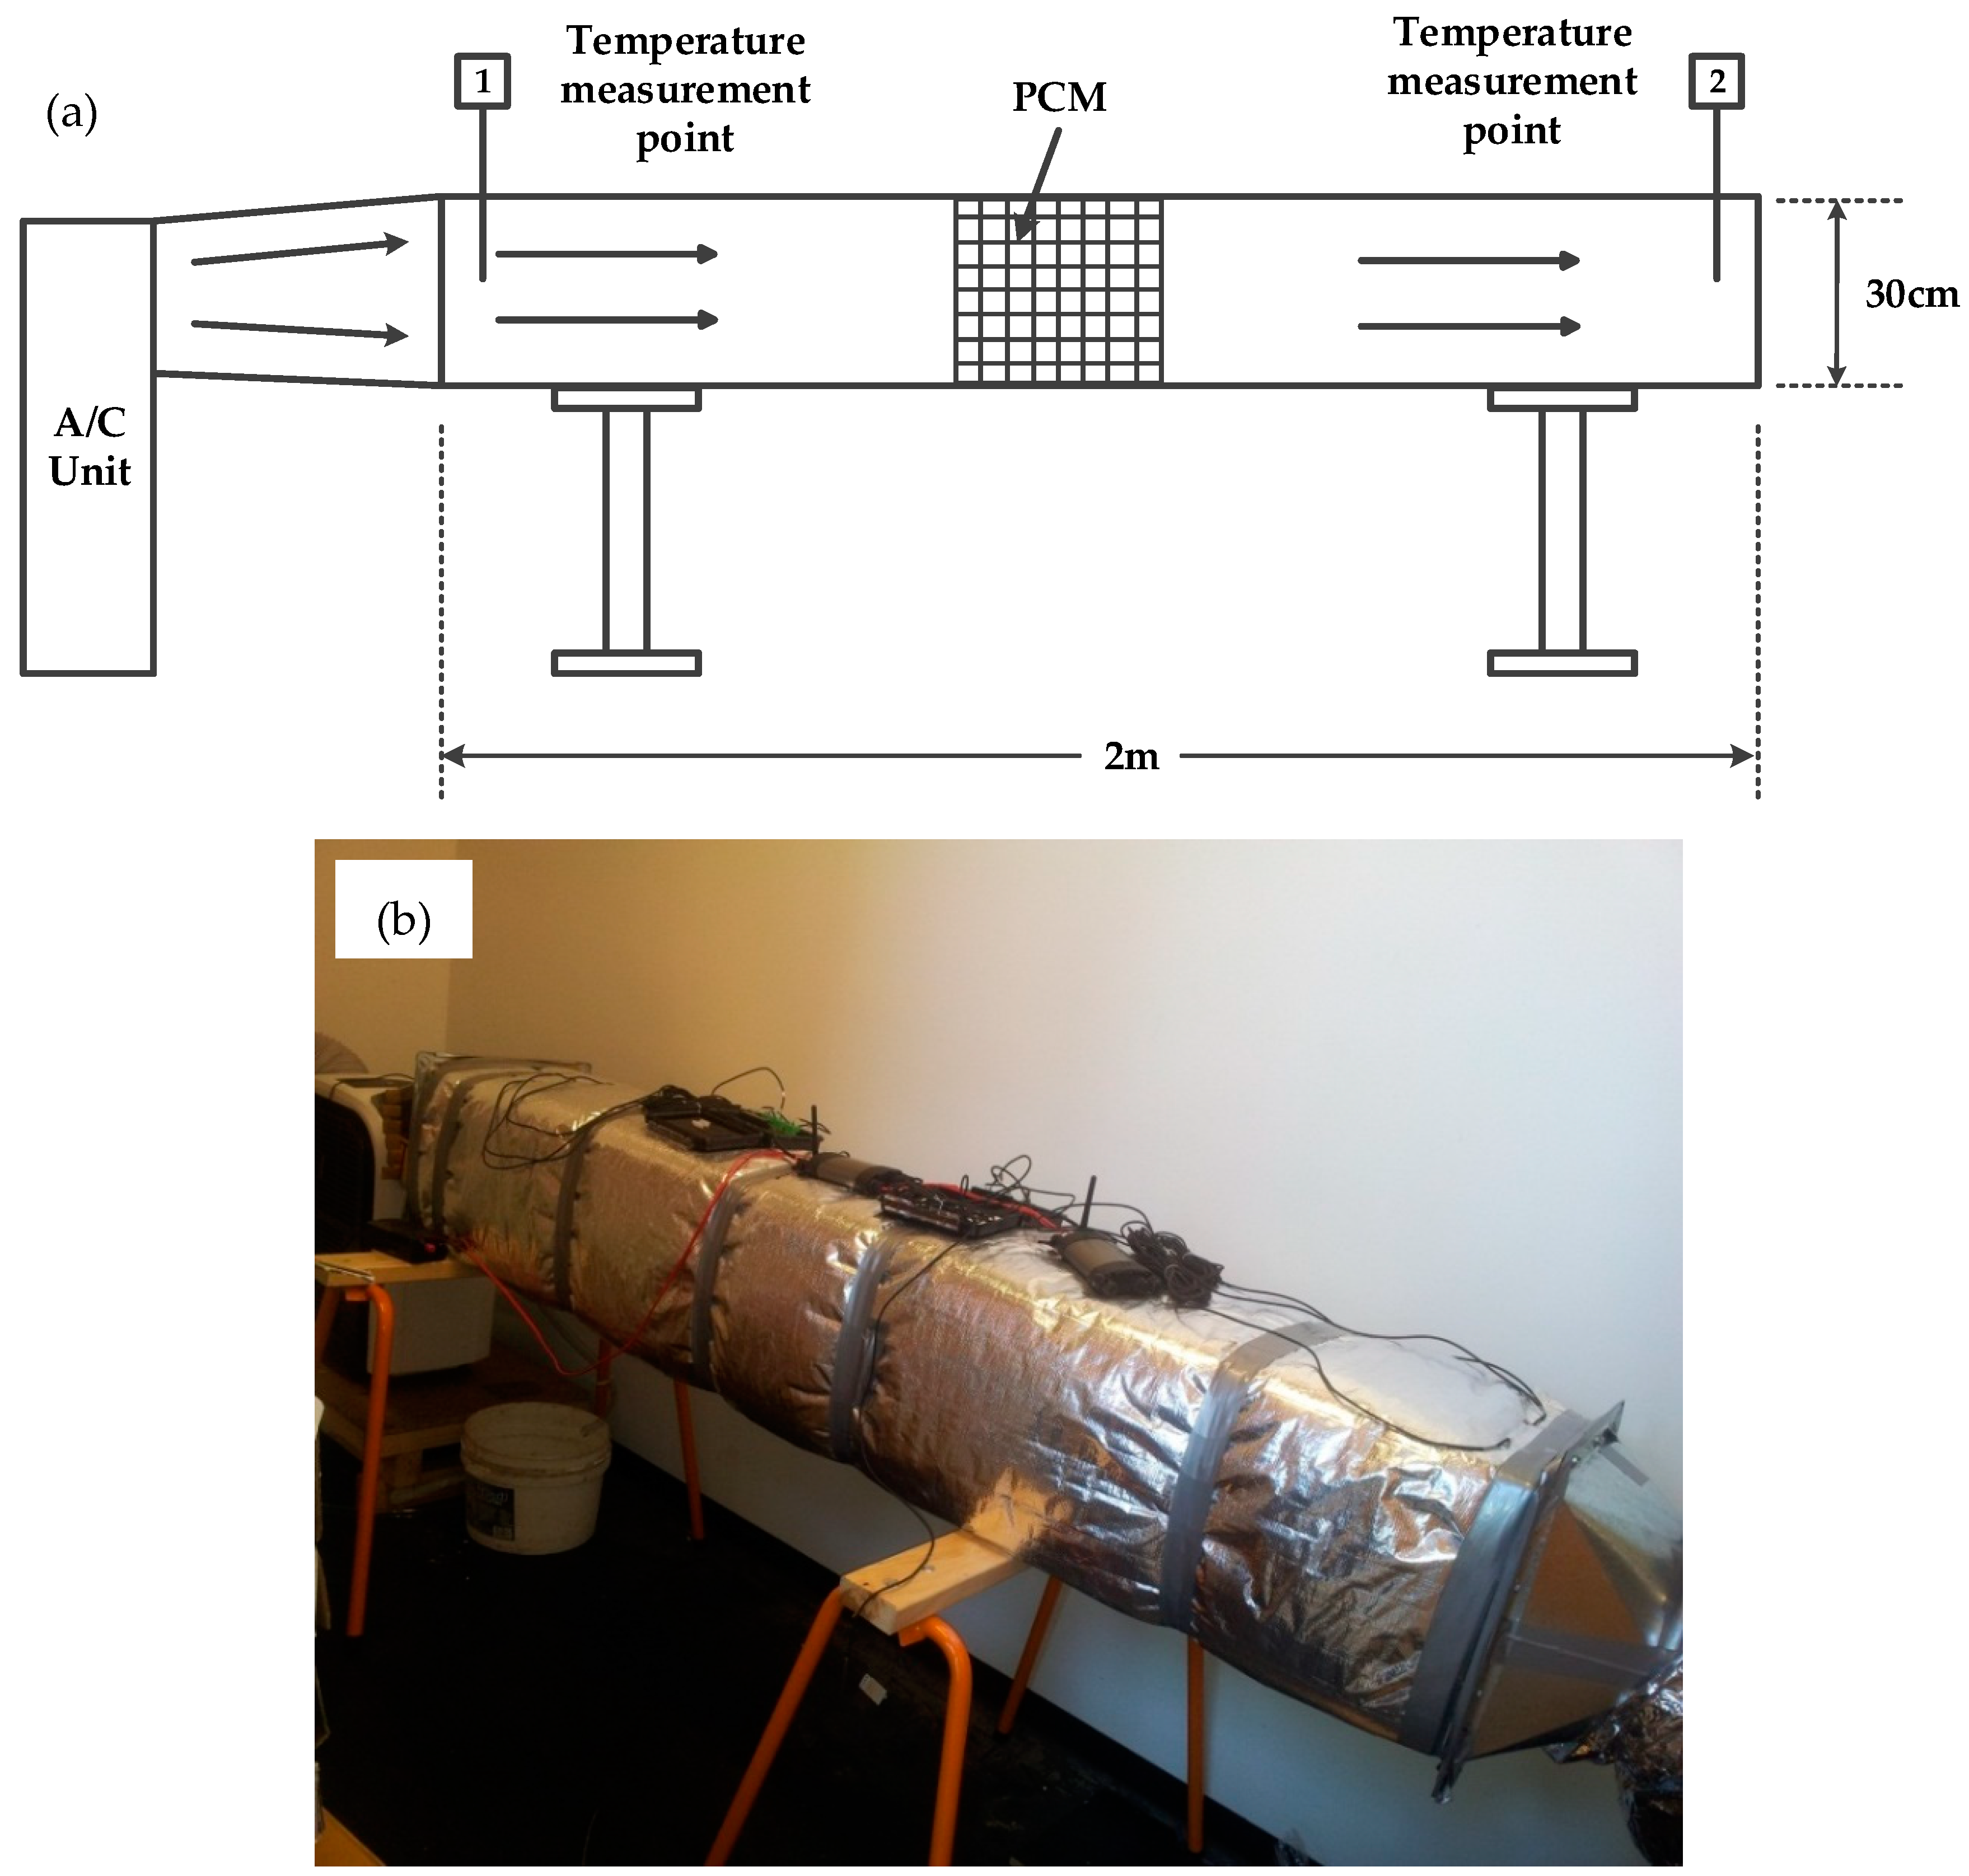
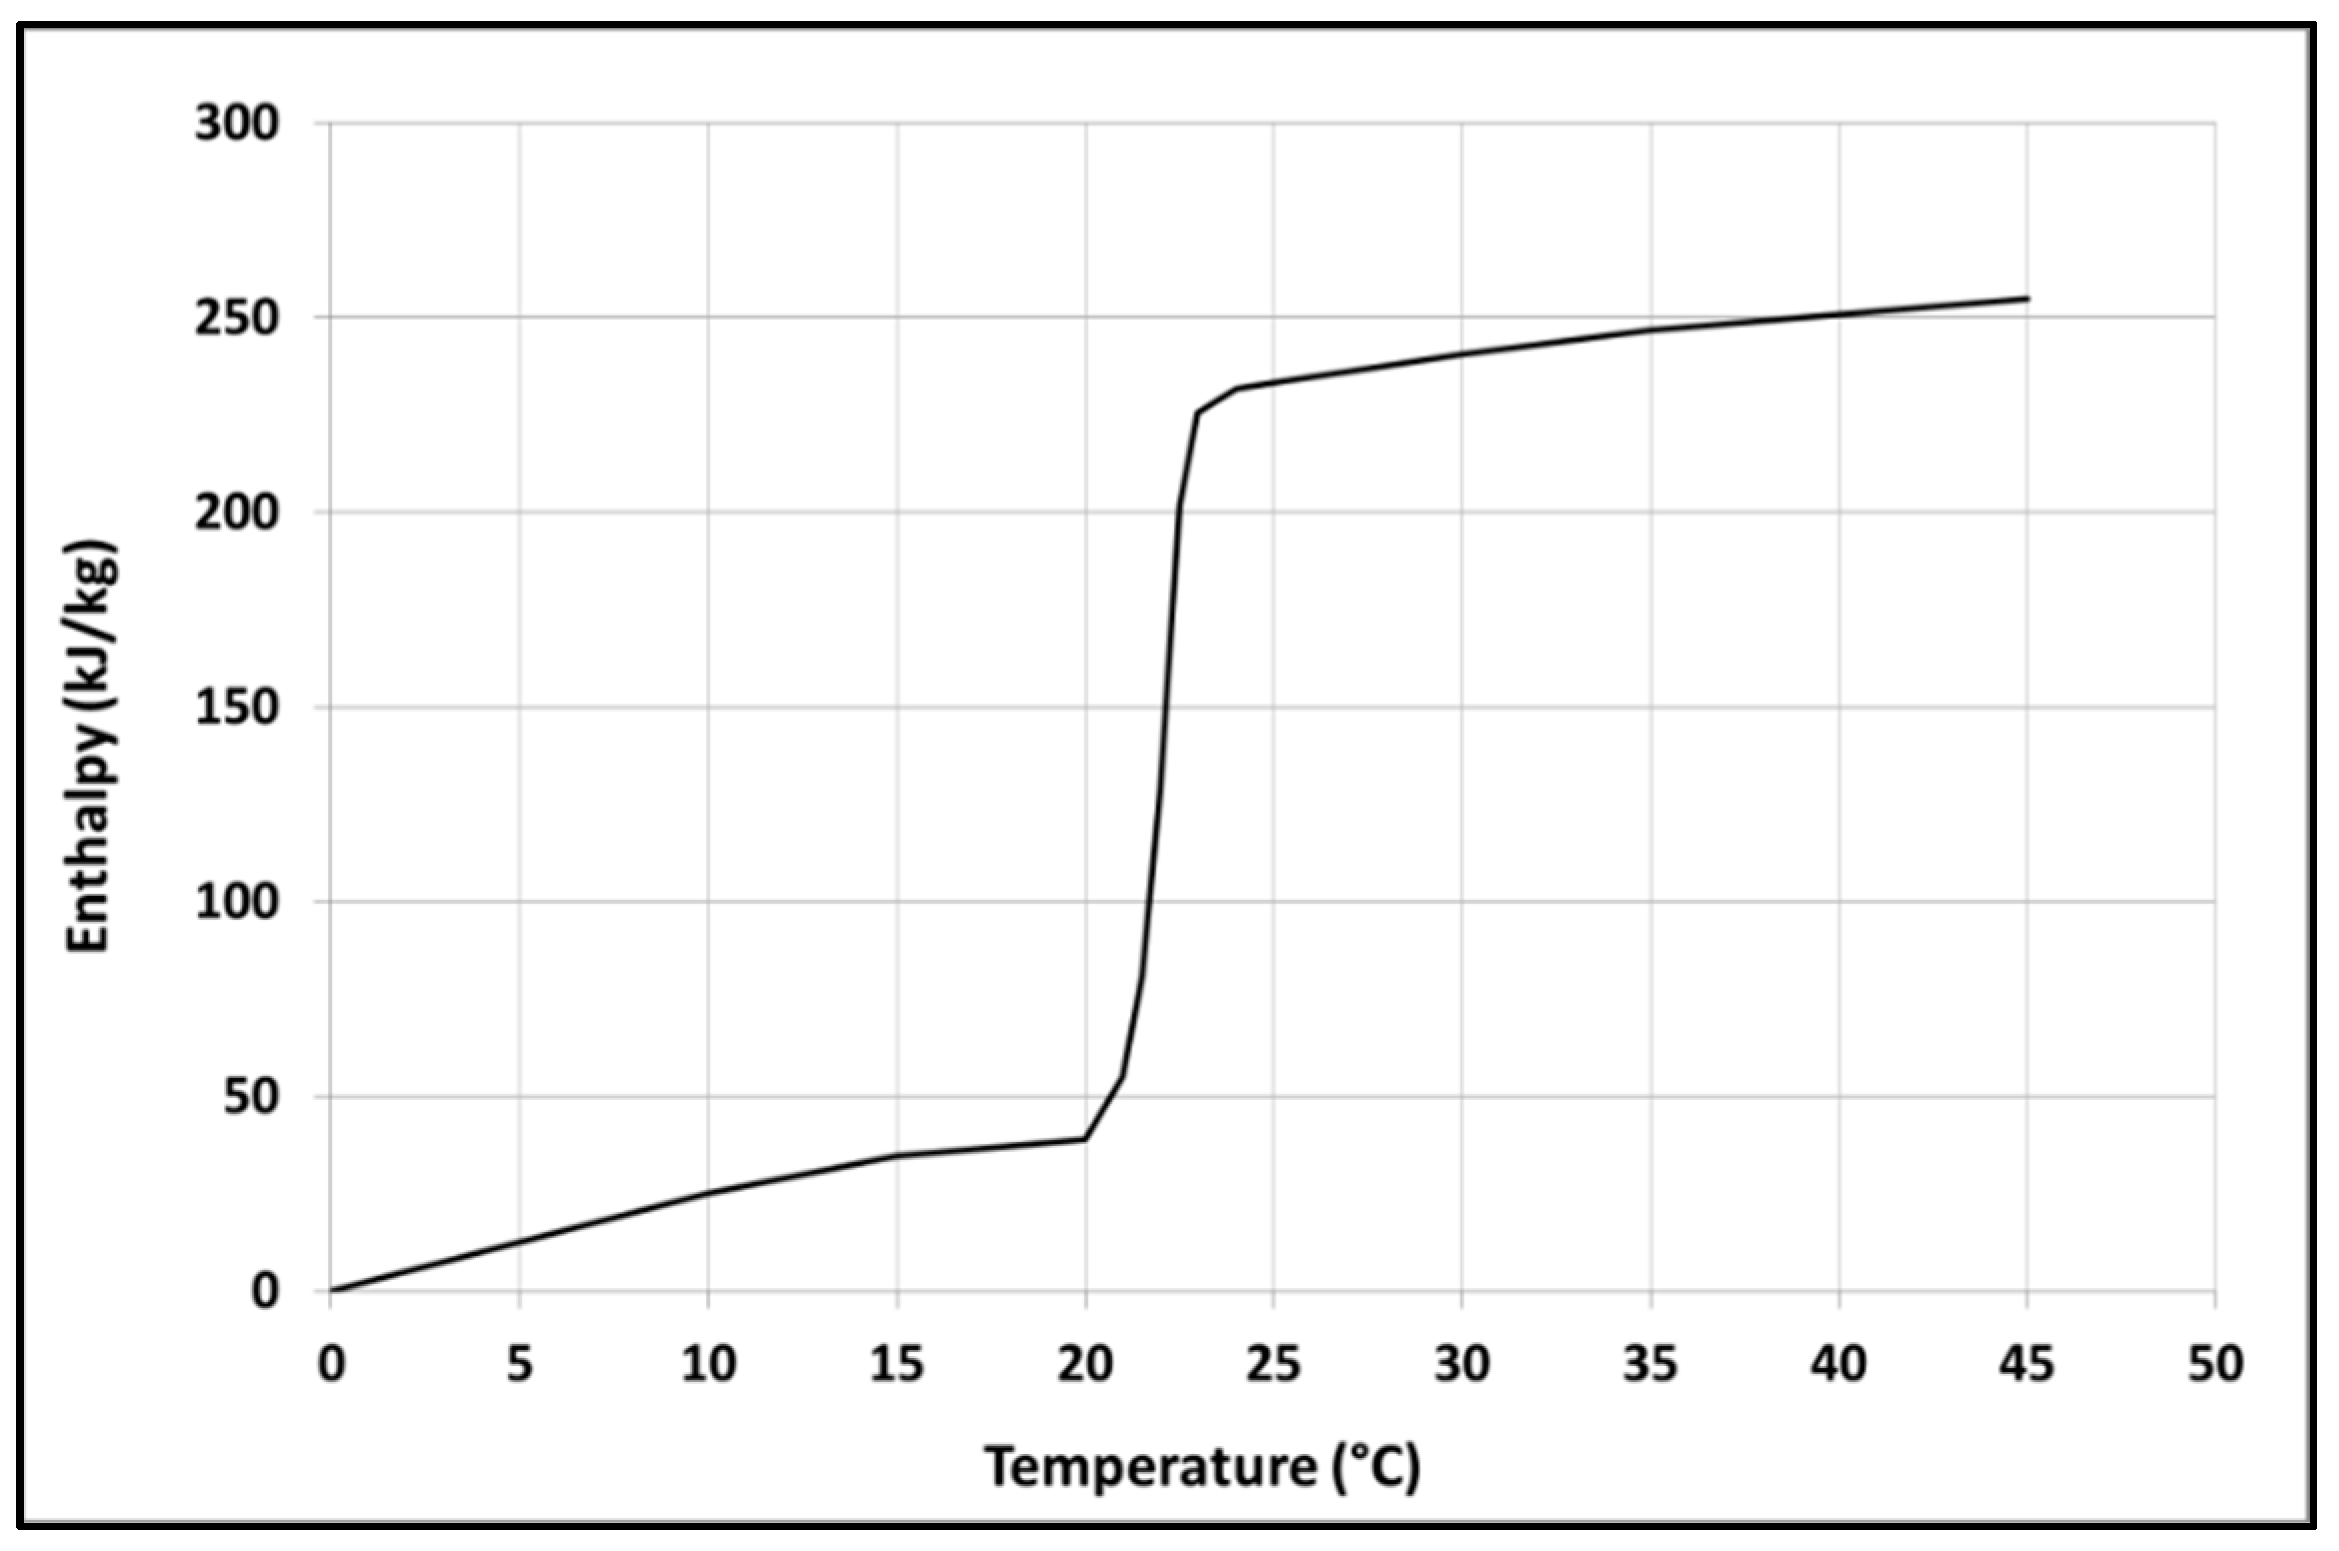
2.1. Experimental Study with PCM-Incorporated Supply Air Duct
2.2. Development of Computational Fluid Dynamics Model
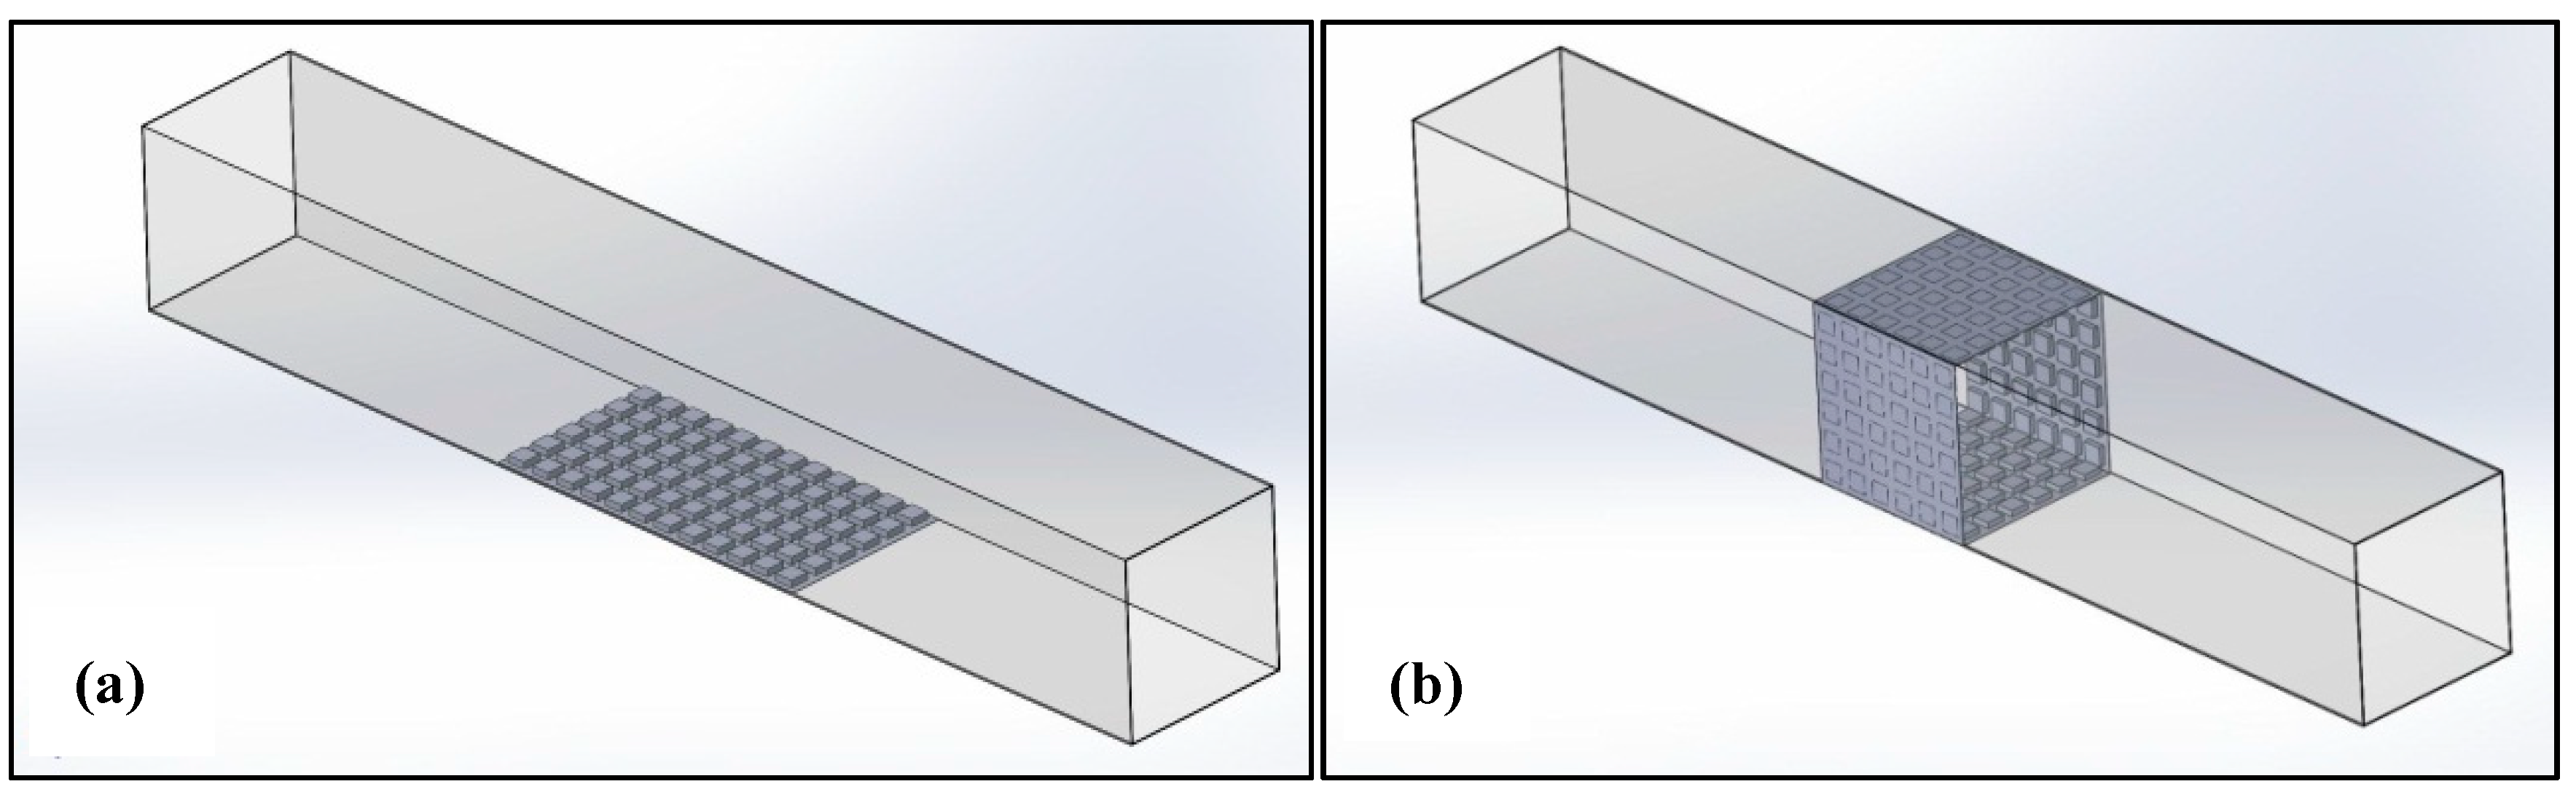
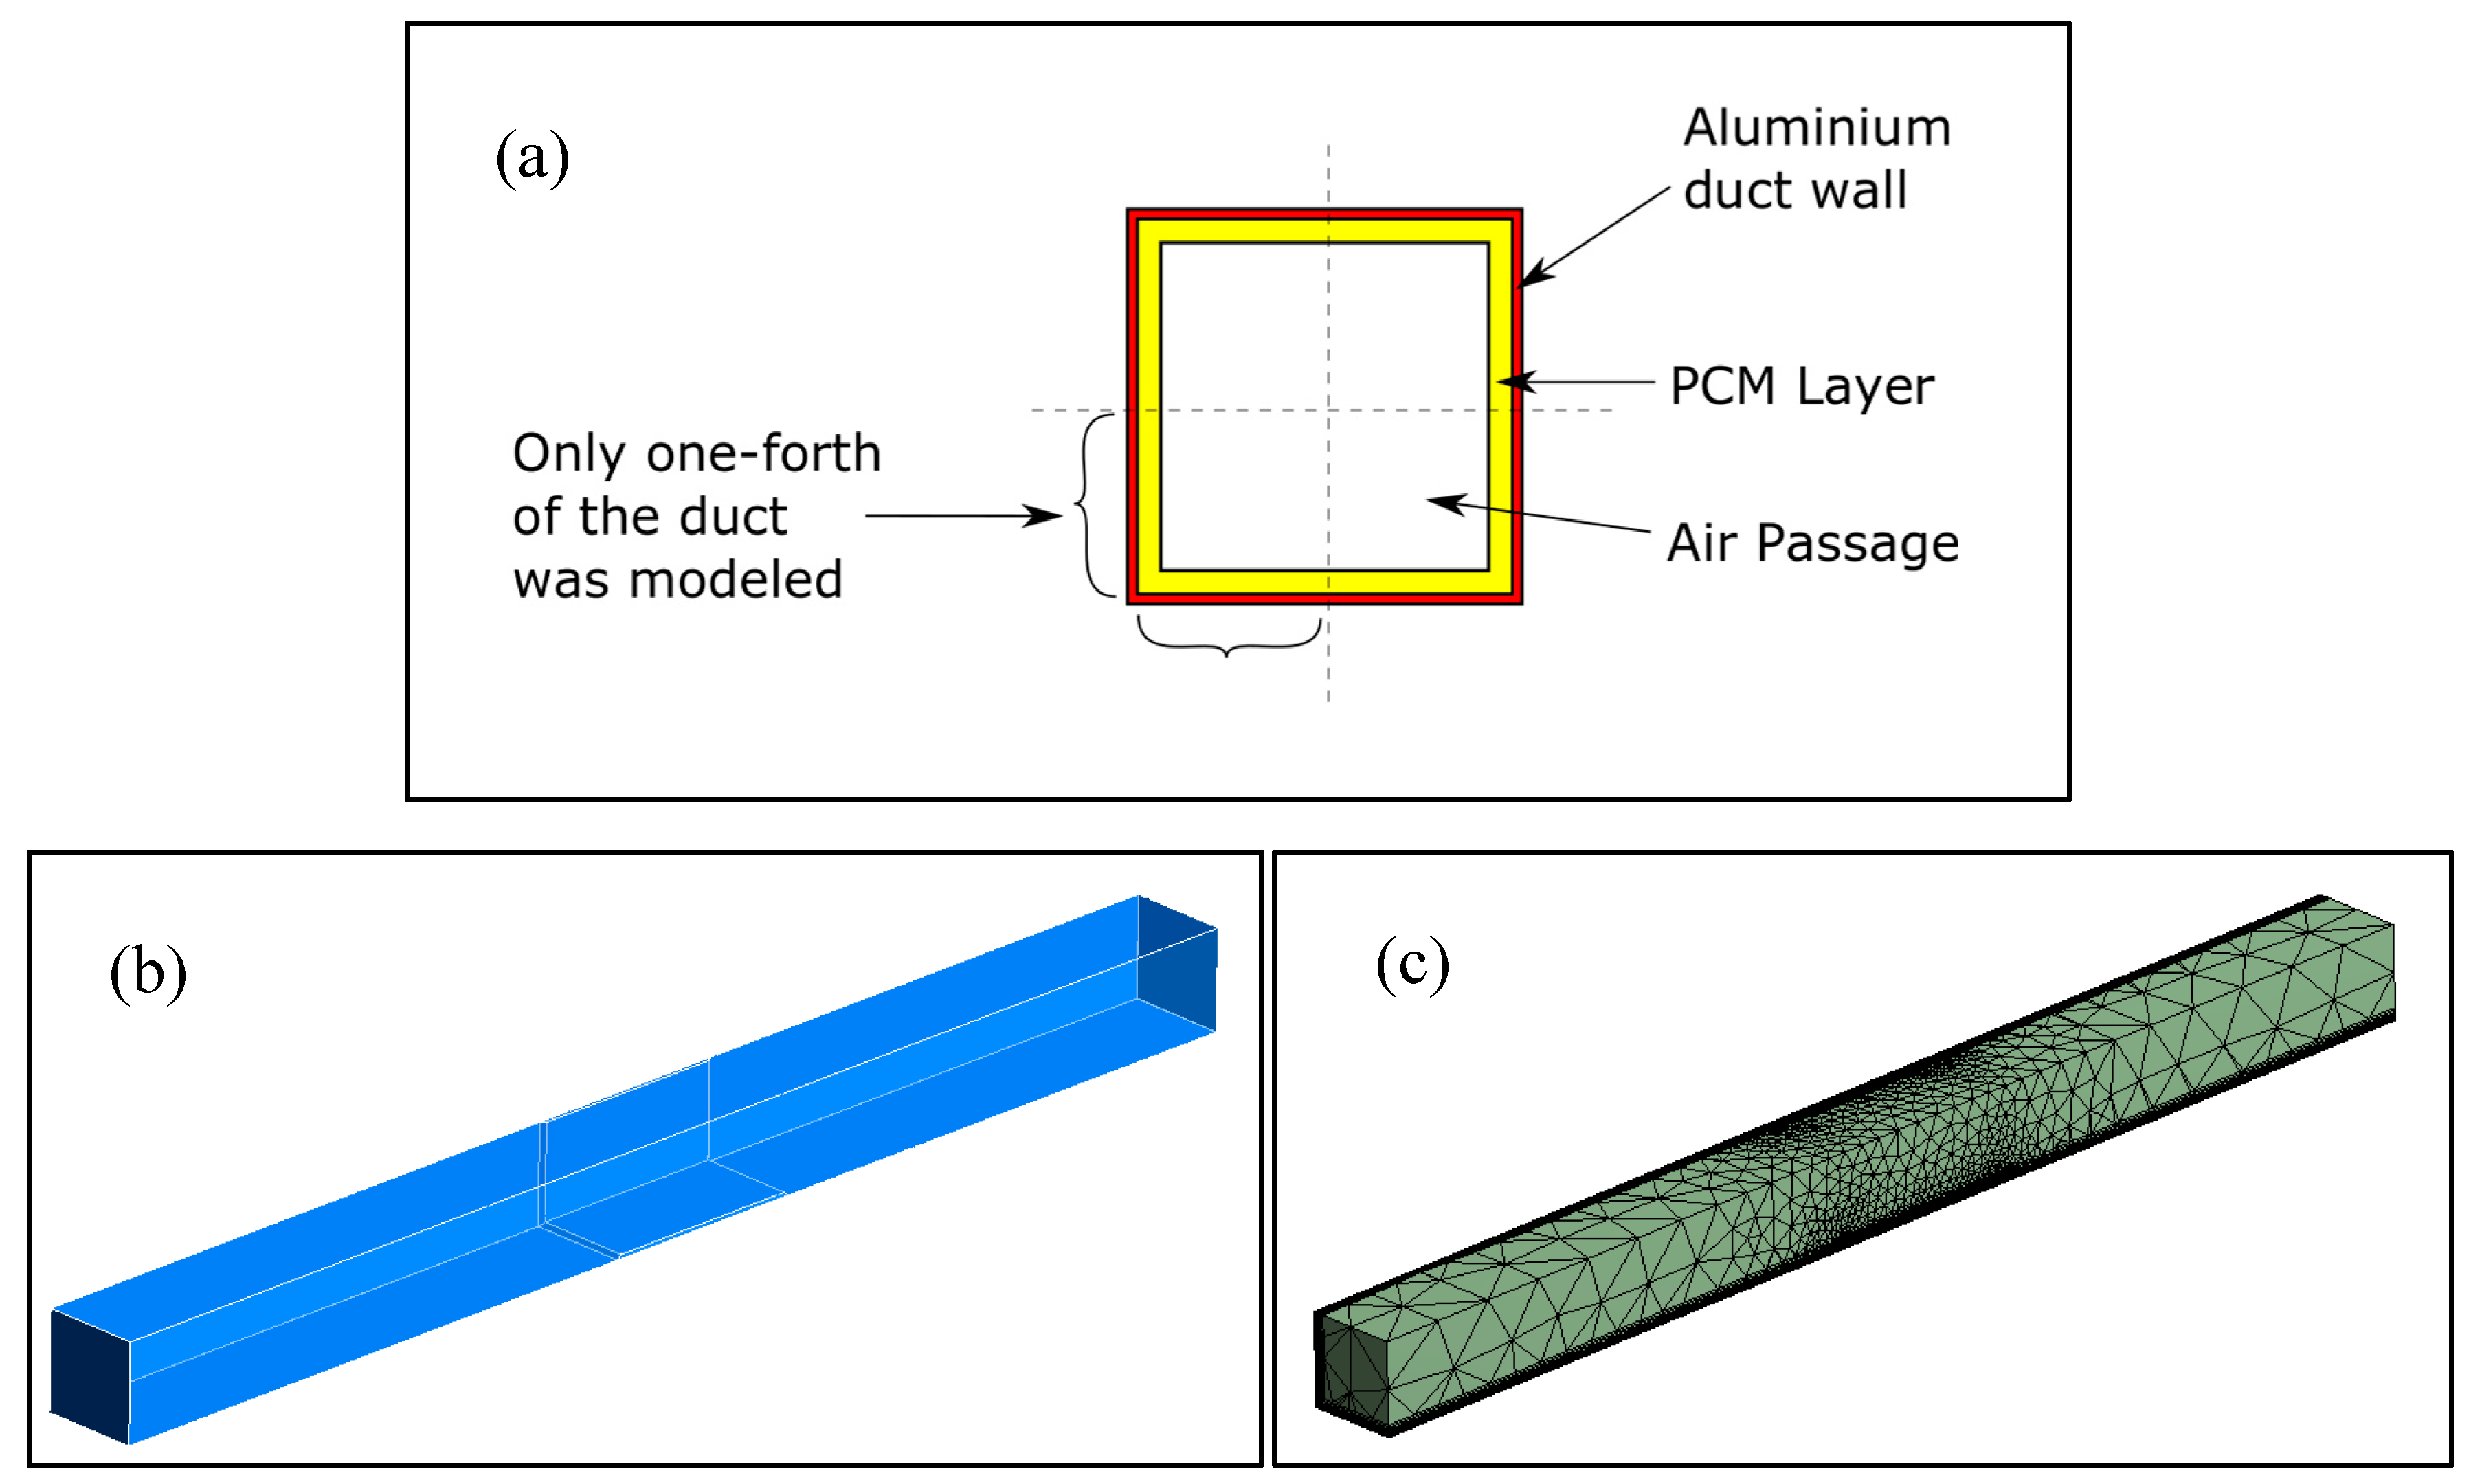
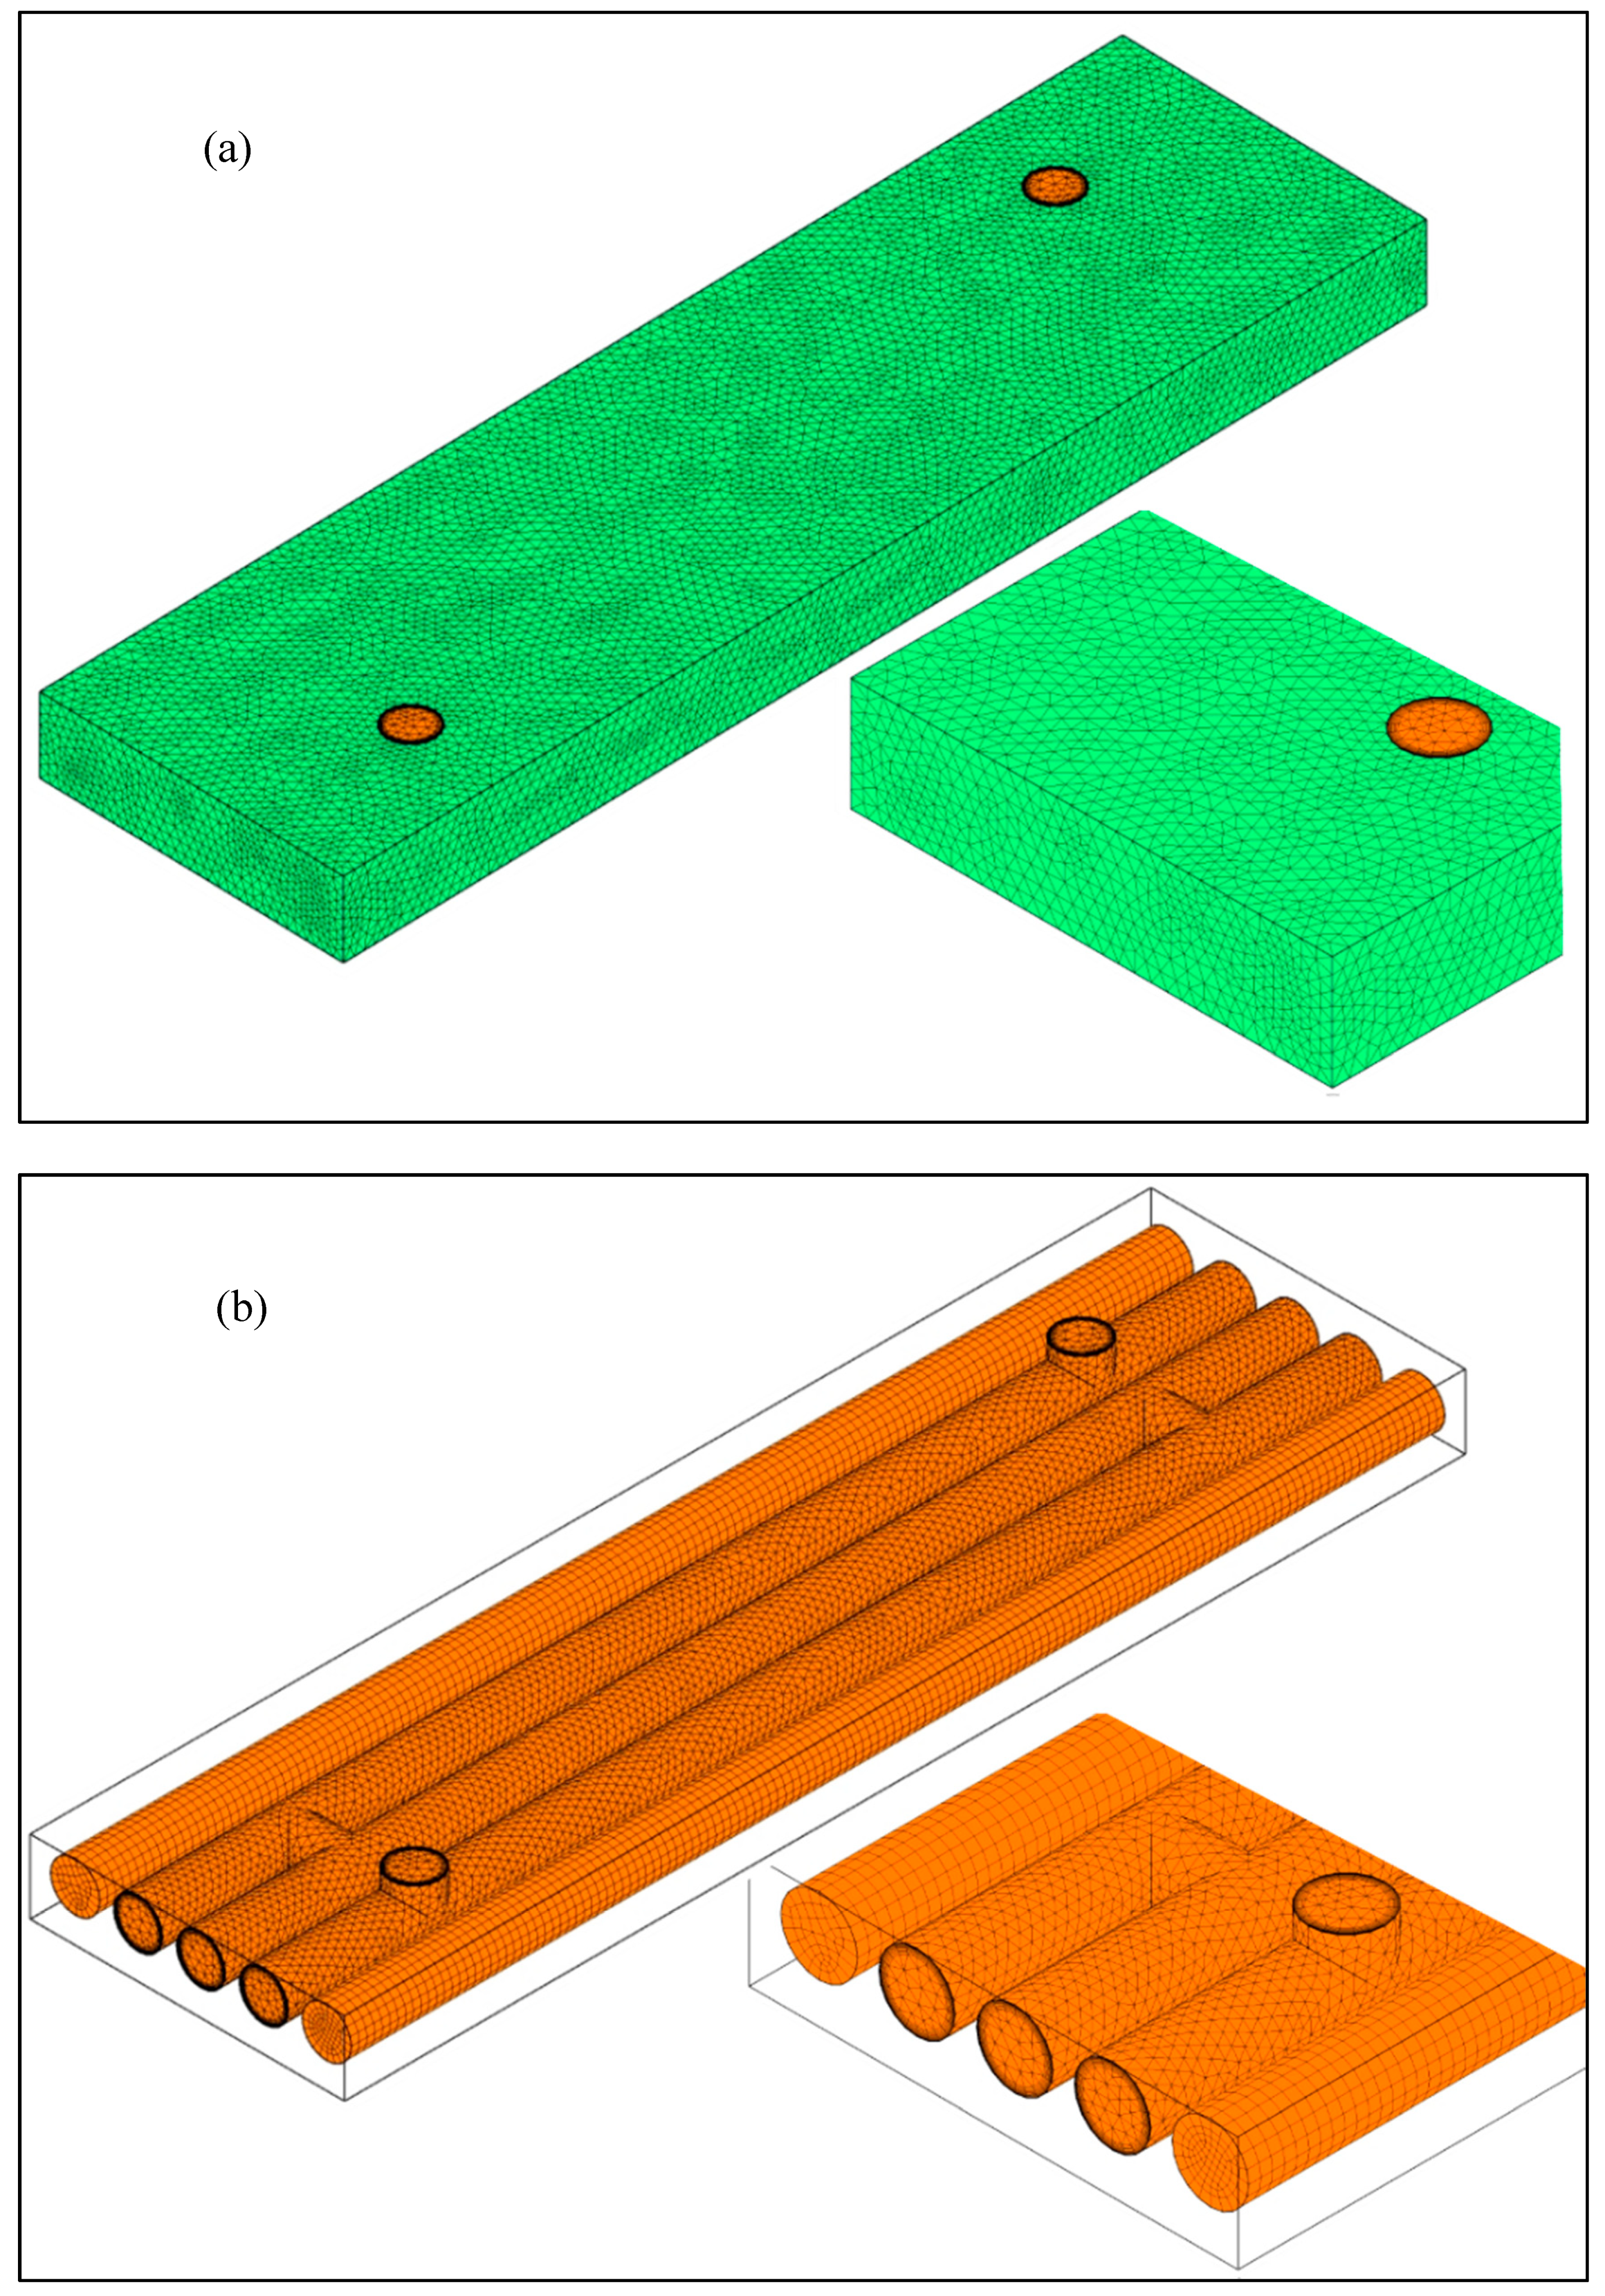
2.2.1. Computational Fluid Dynamics Model of the Air Duct
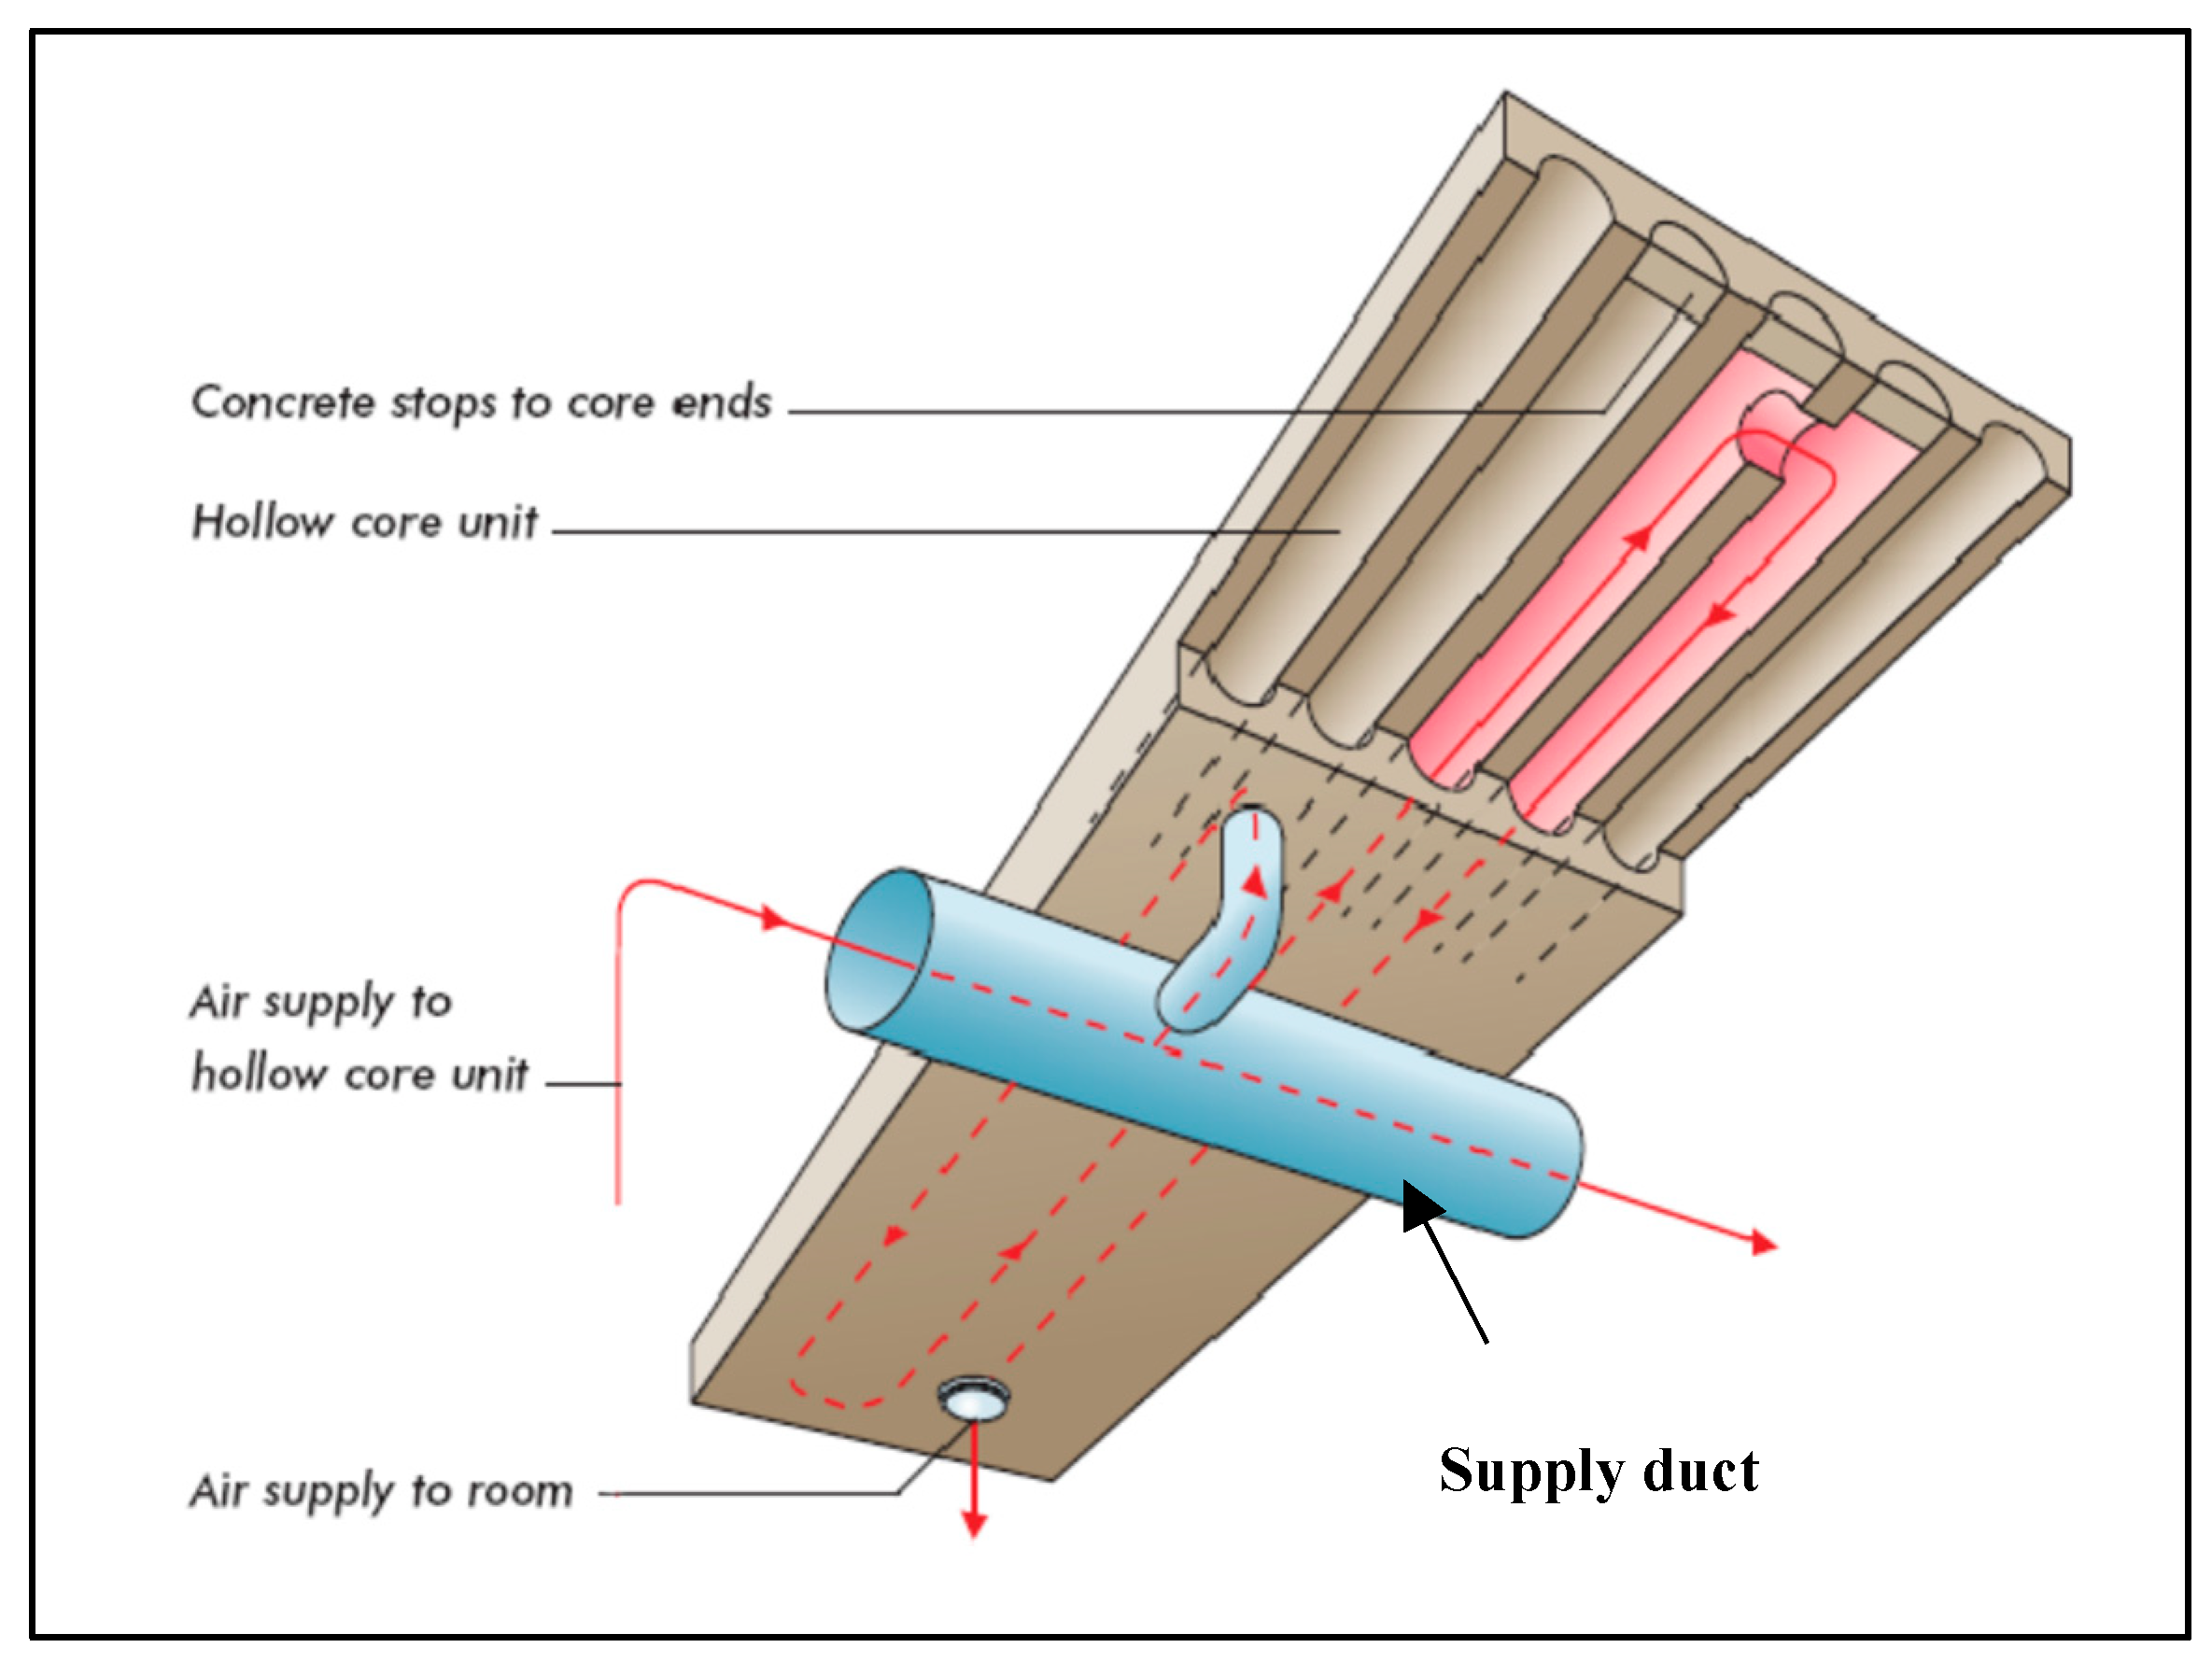
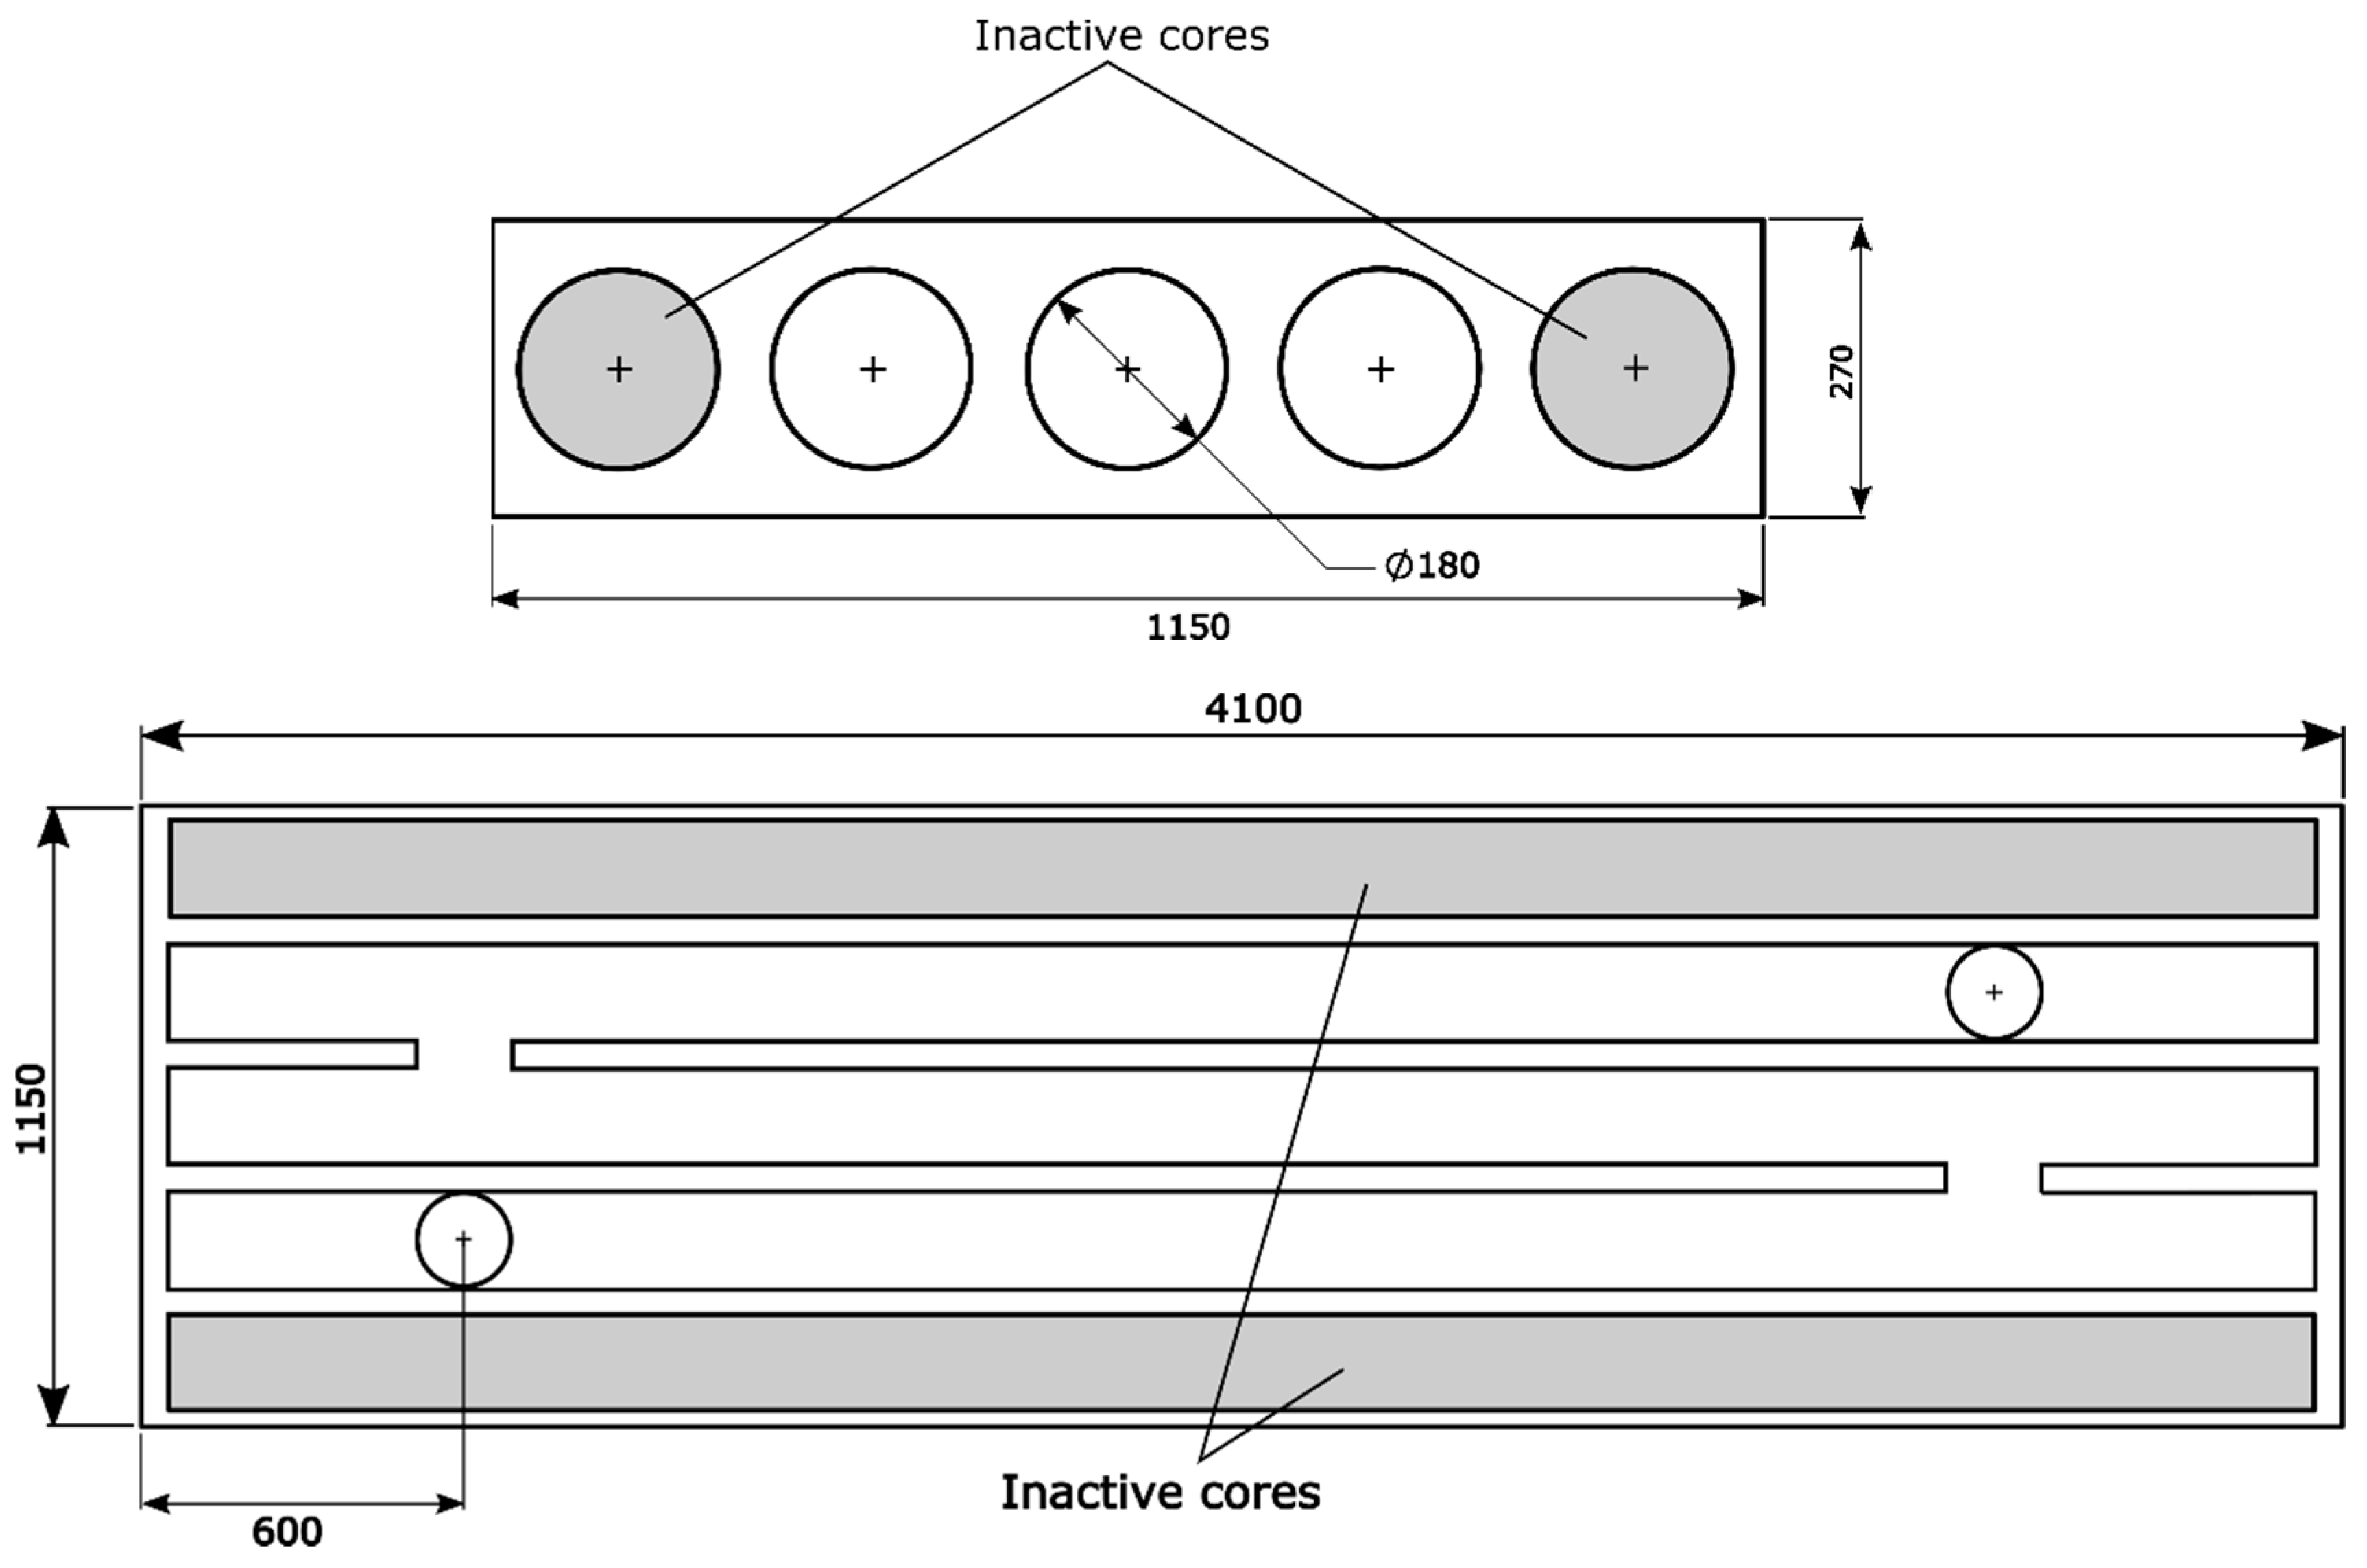
2.2.2. Computational Fluid Dynamics Model of the Hollow-Core Concrete Slab
3. Results and Discussion
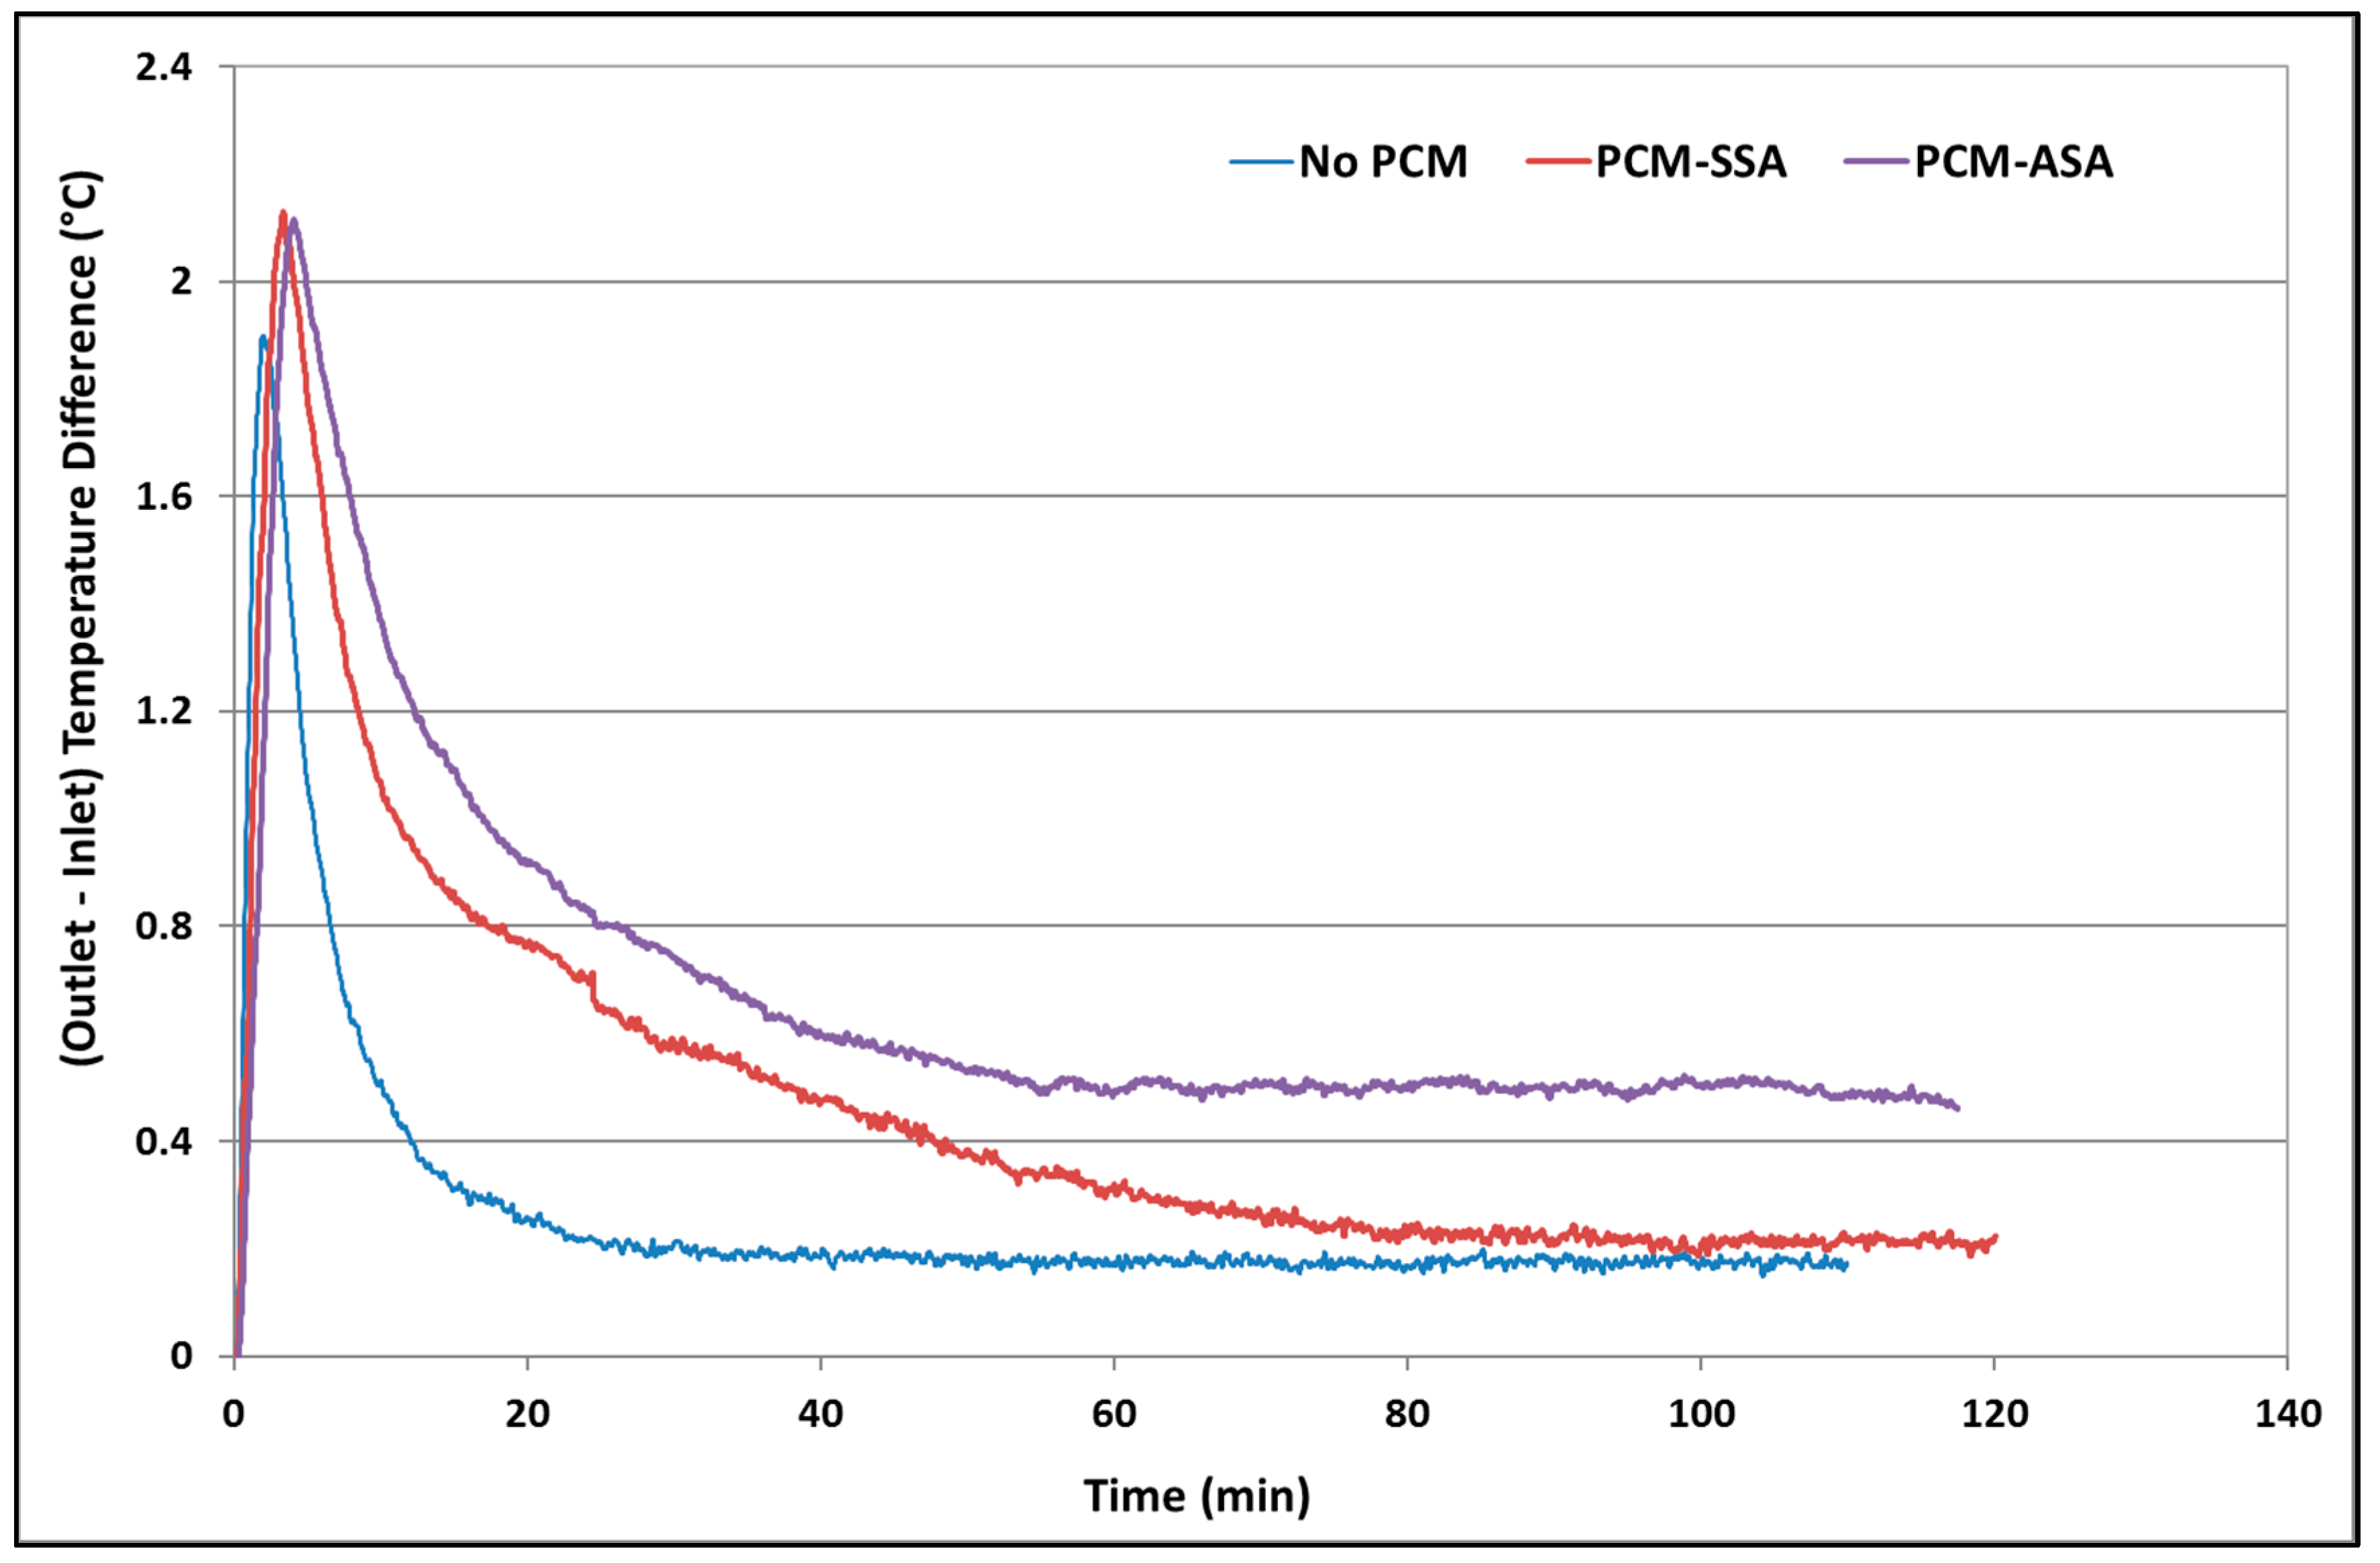
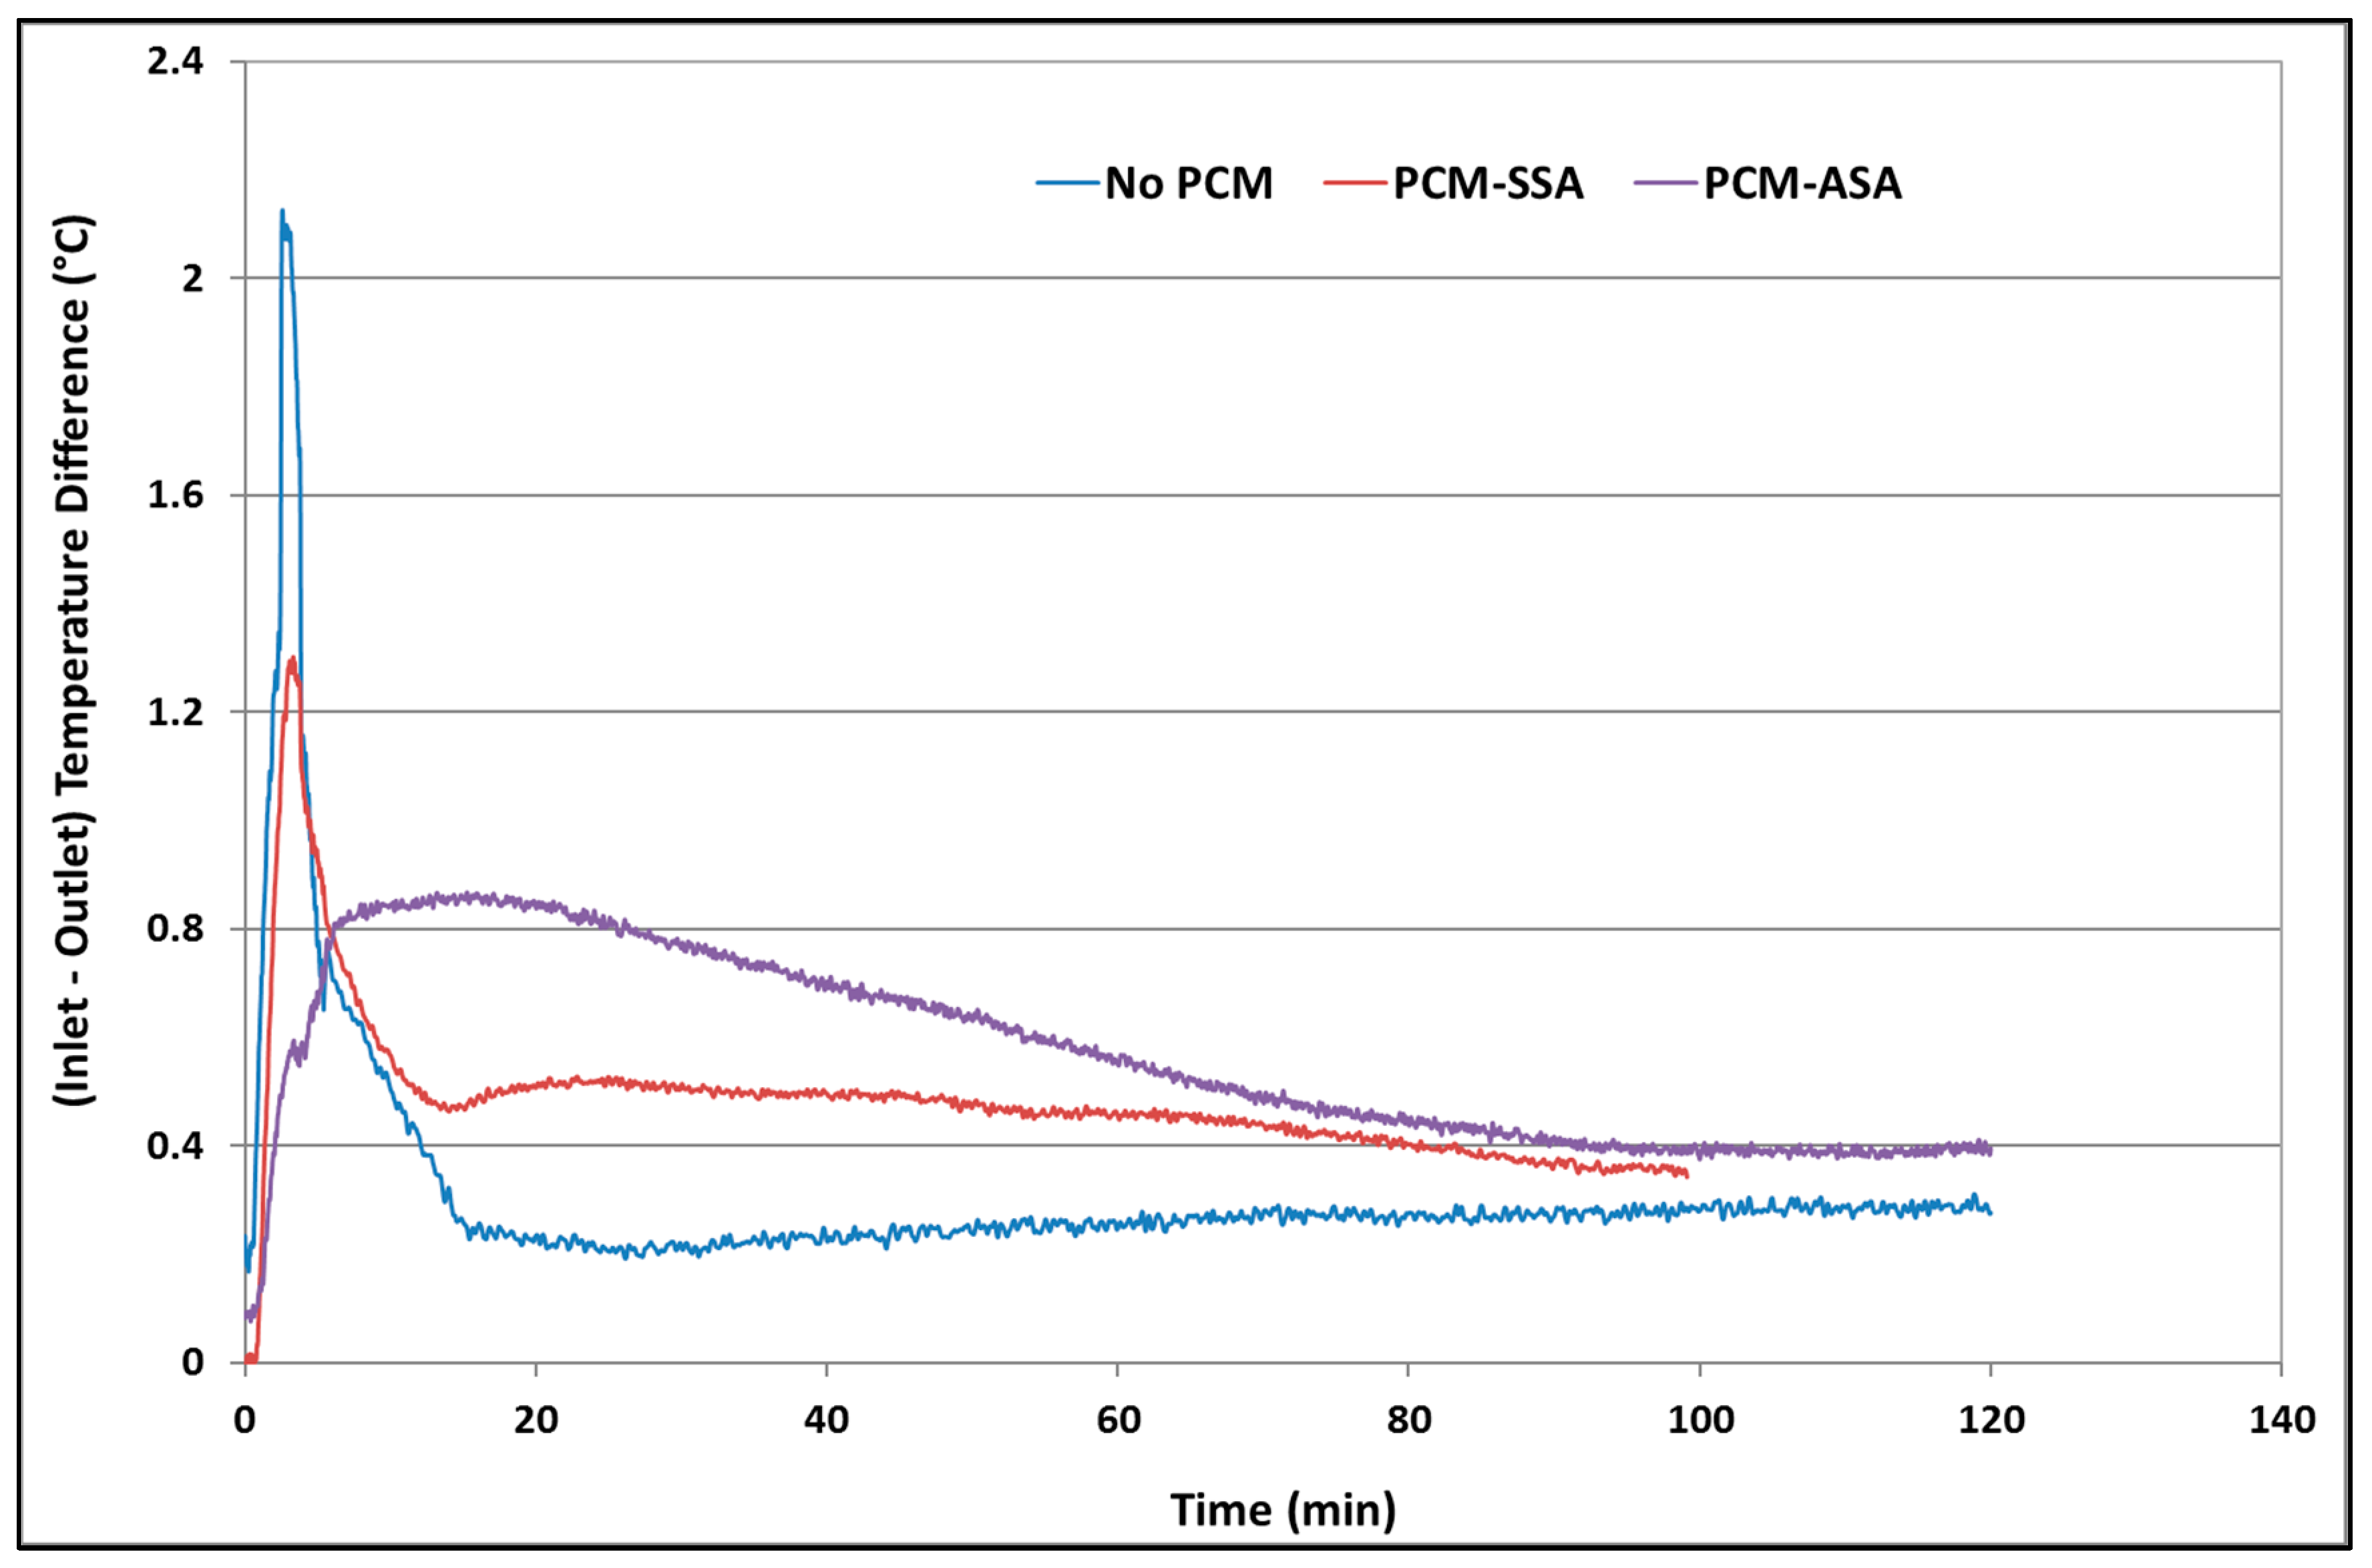
3.1. Experimental Results of PCM-Integrated Supply Air Duct
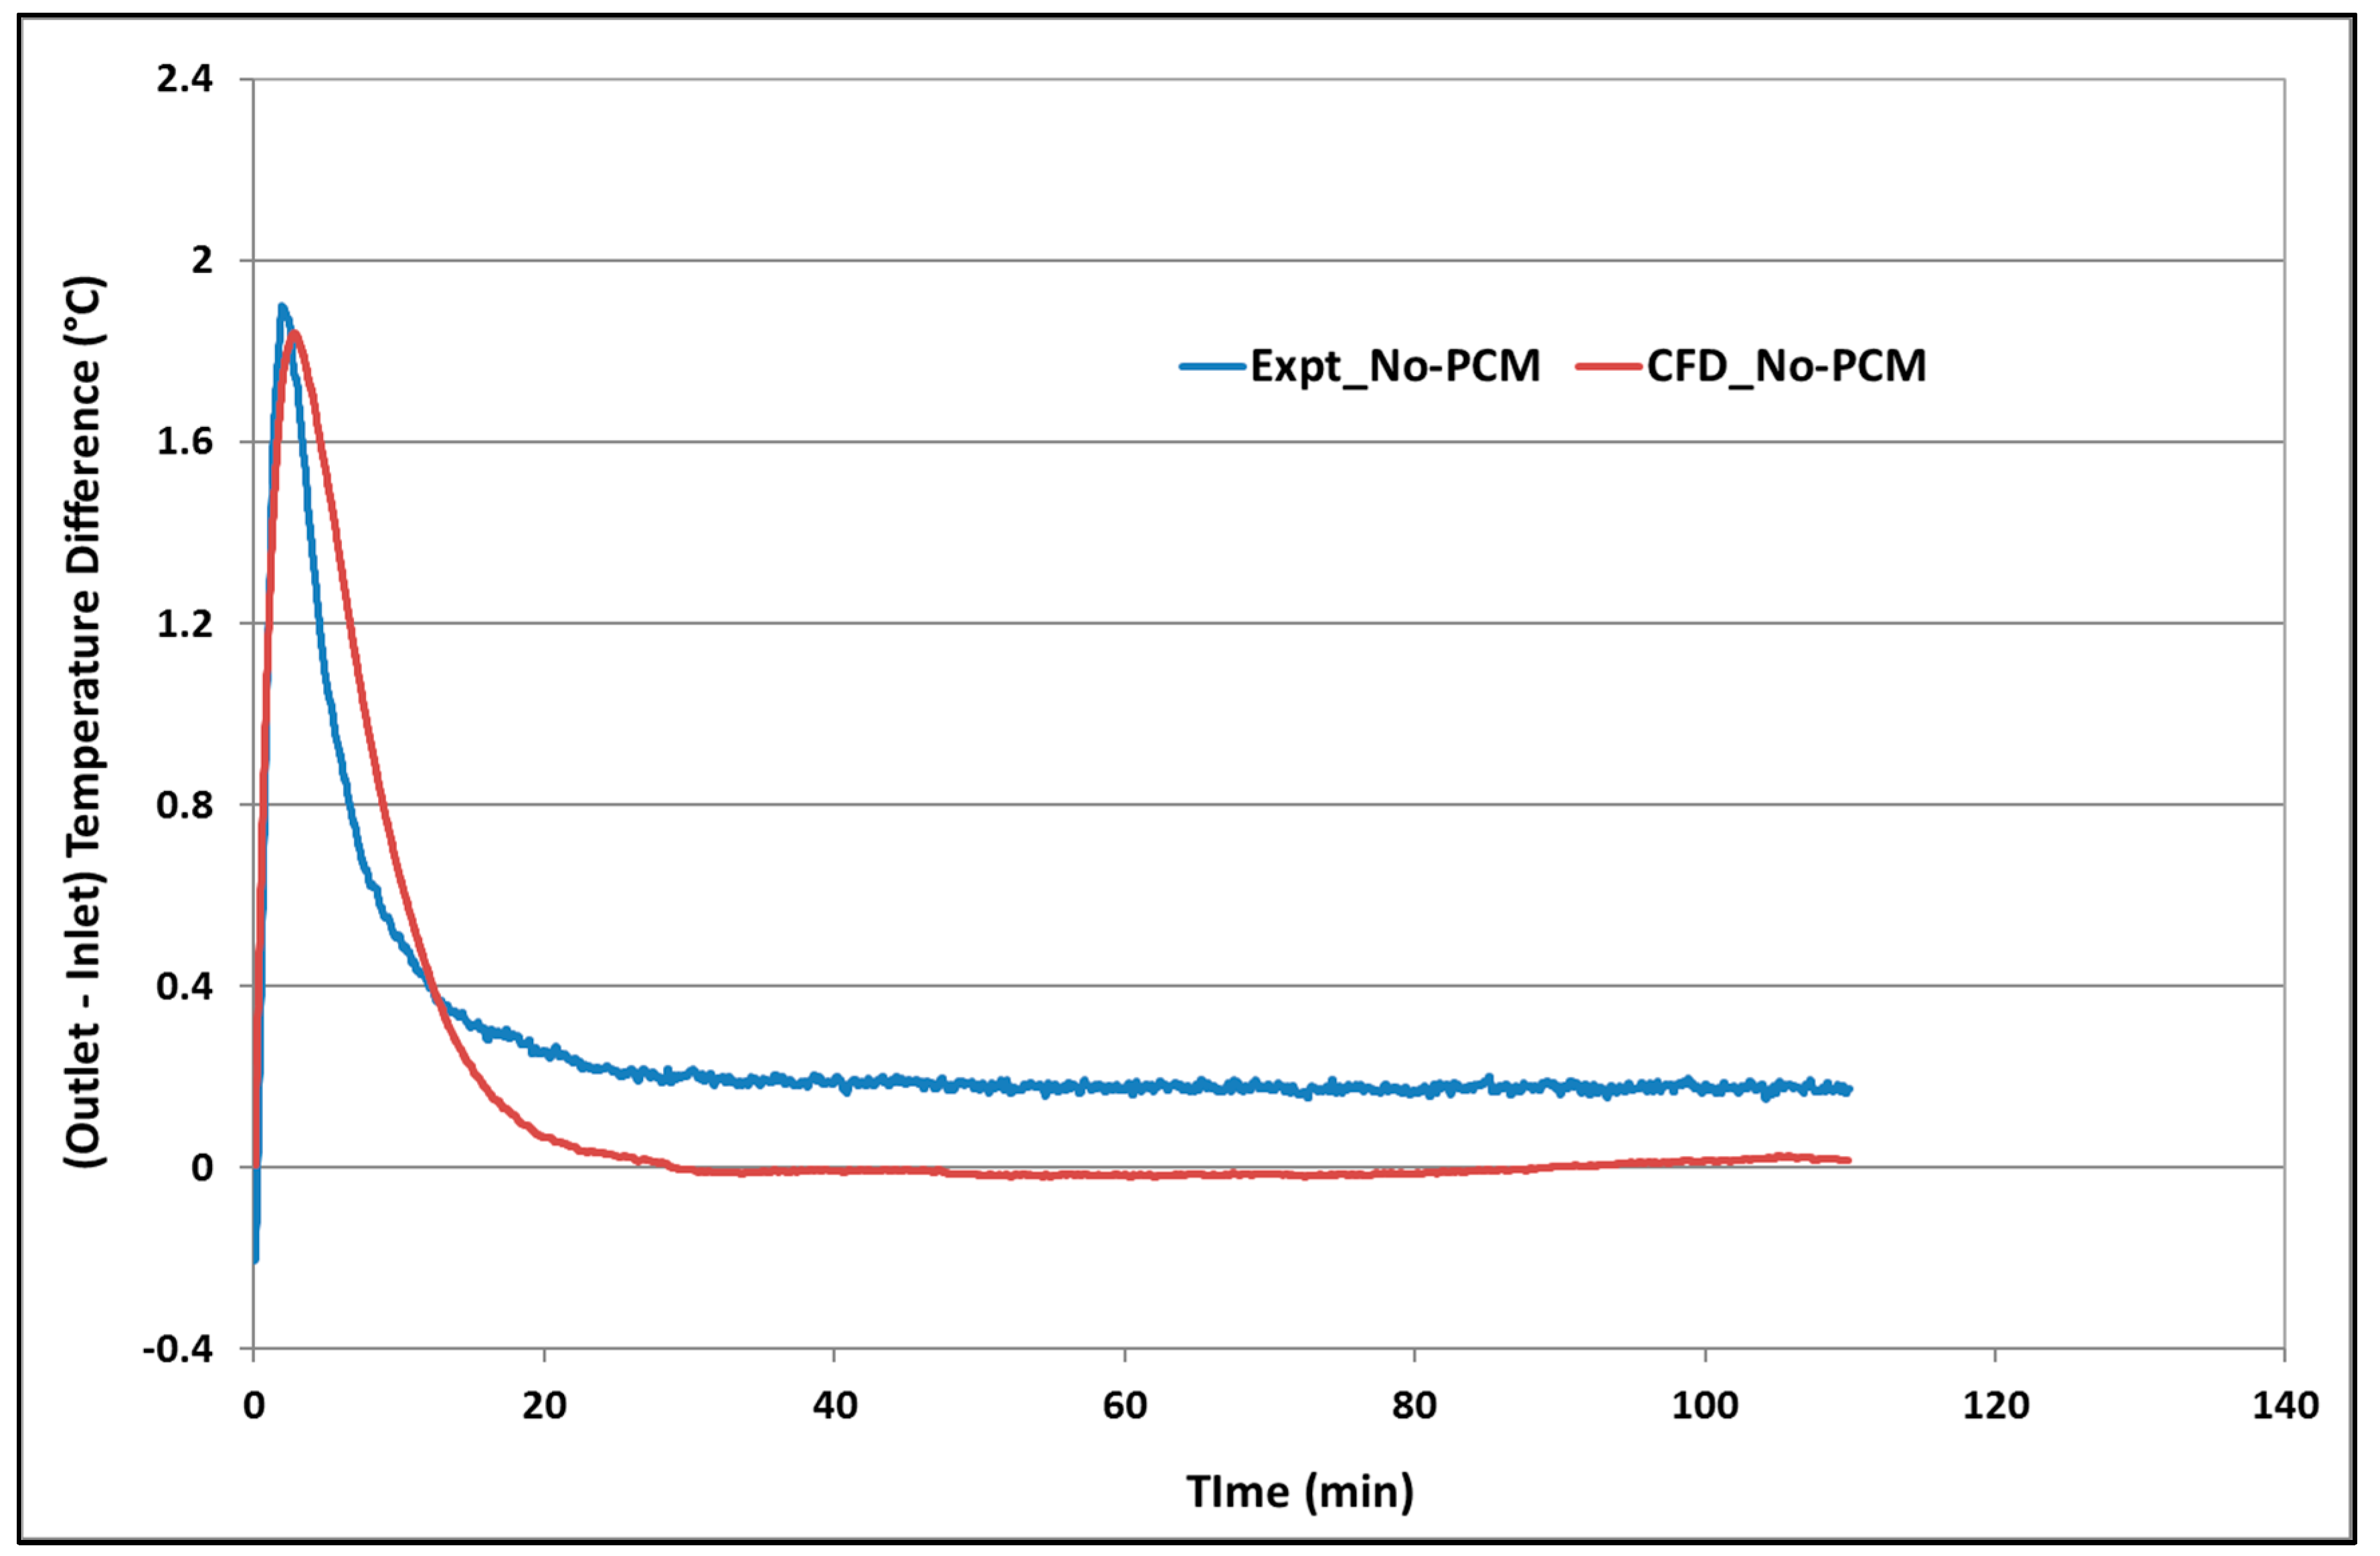
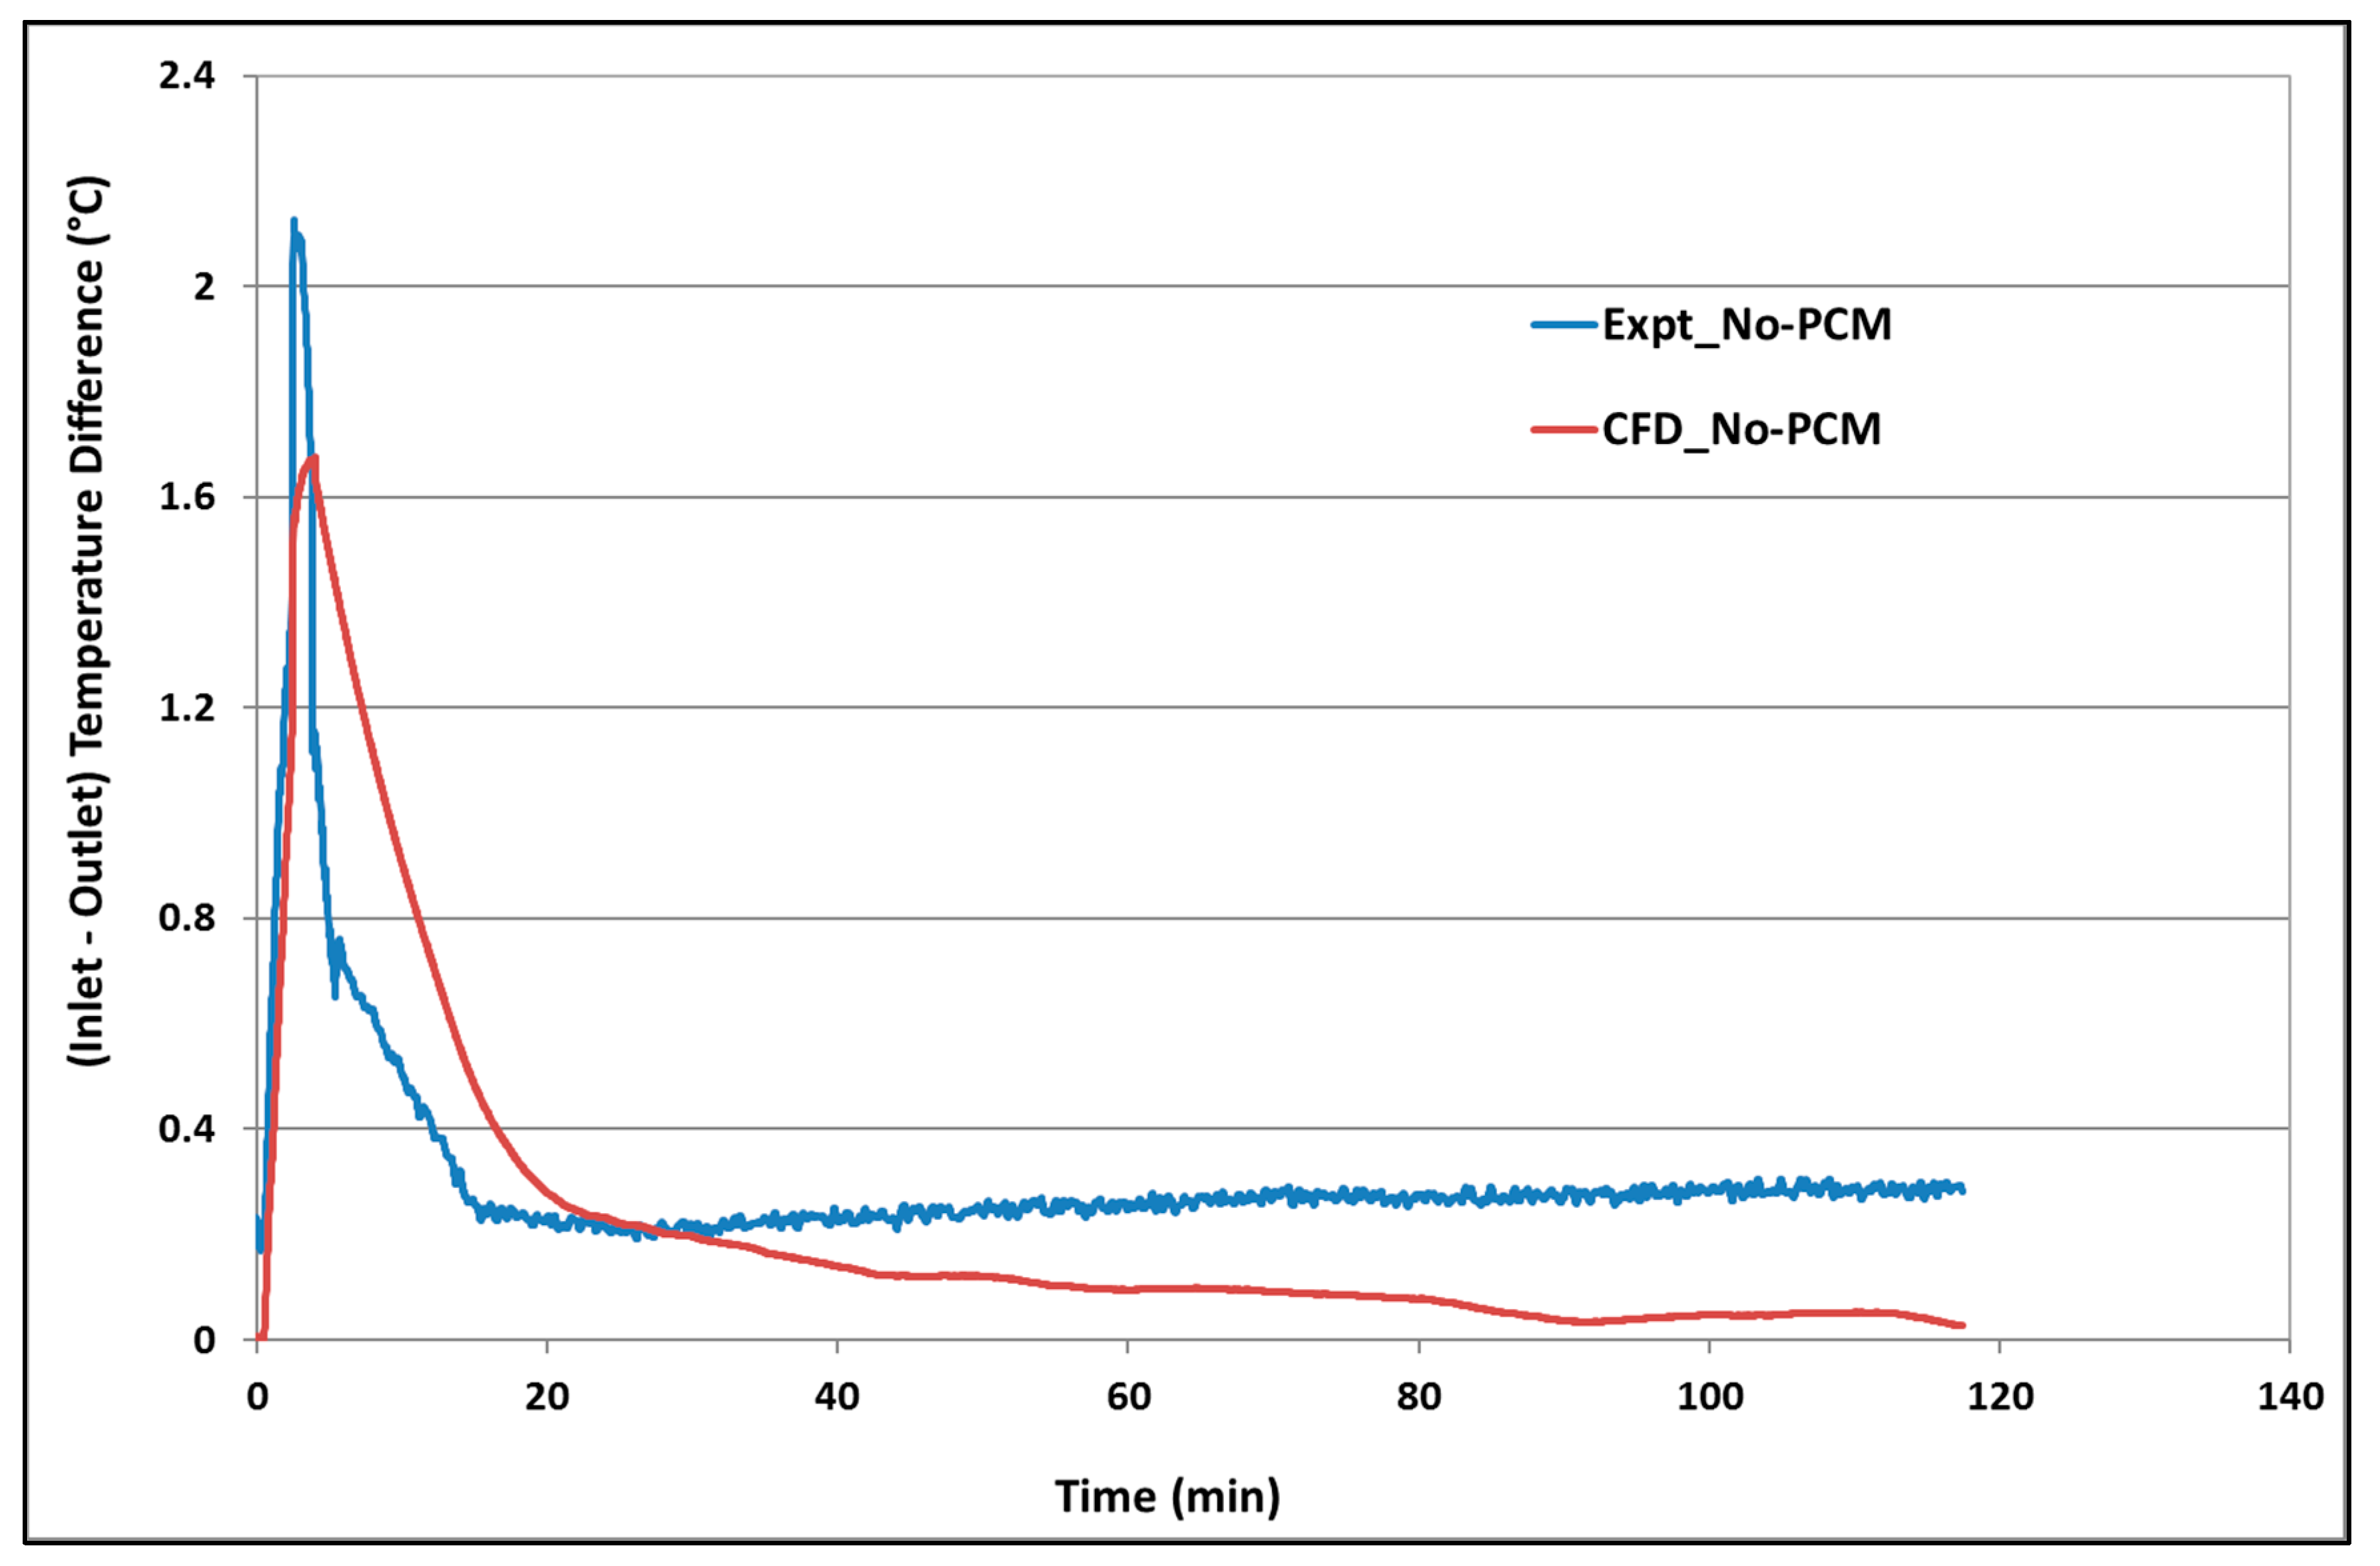
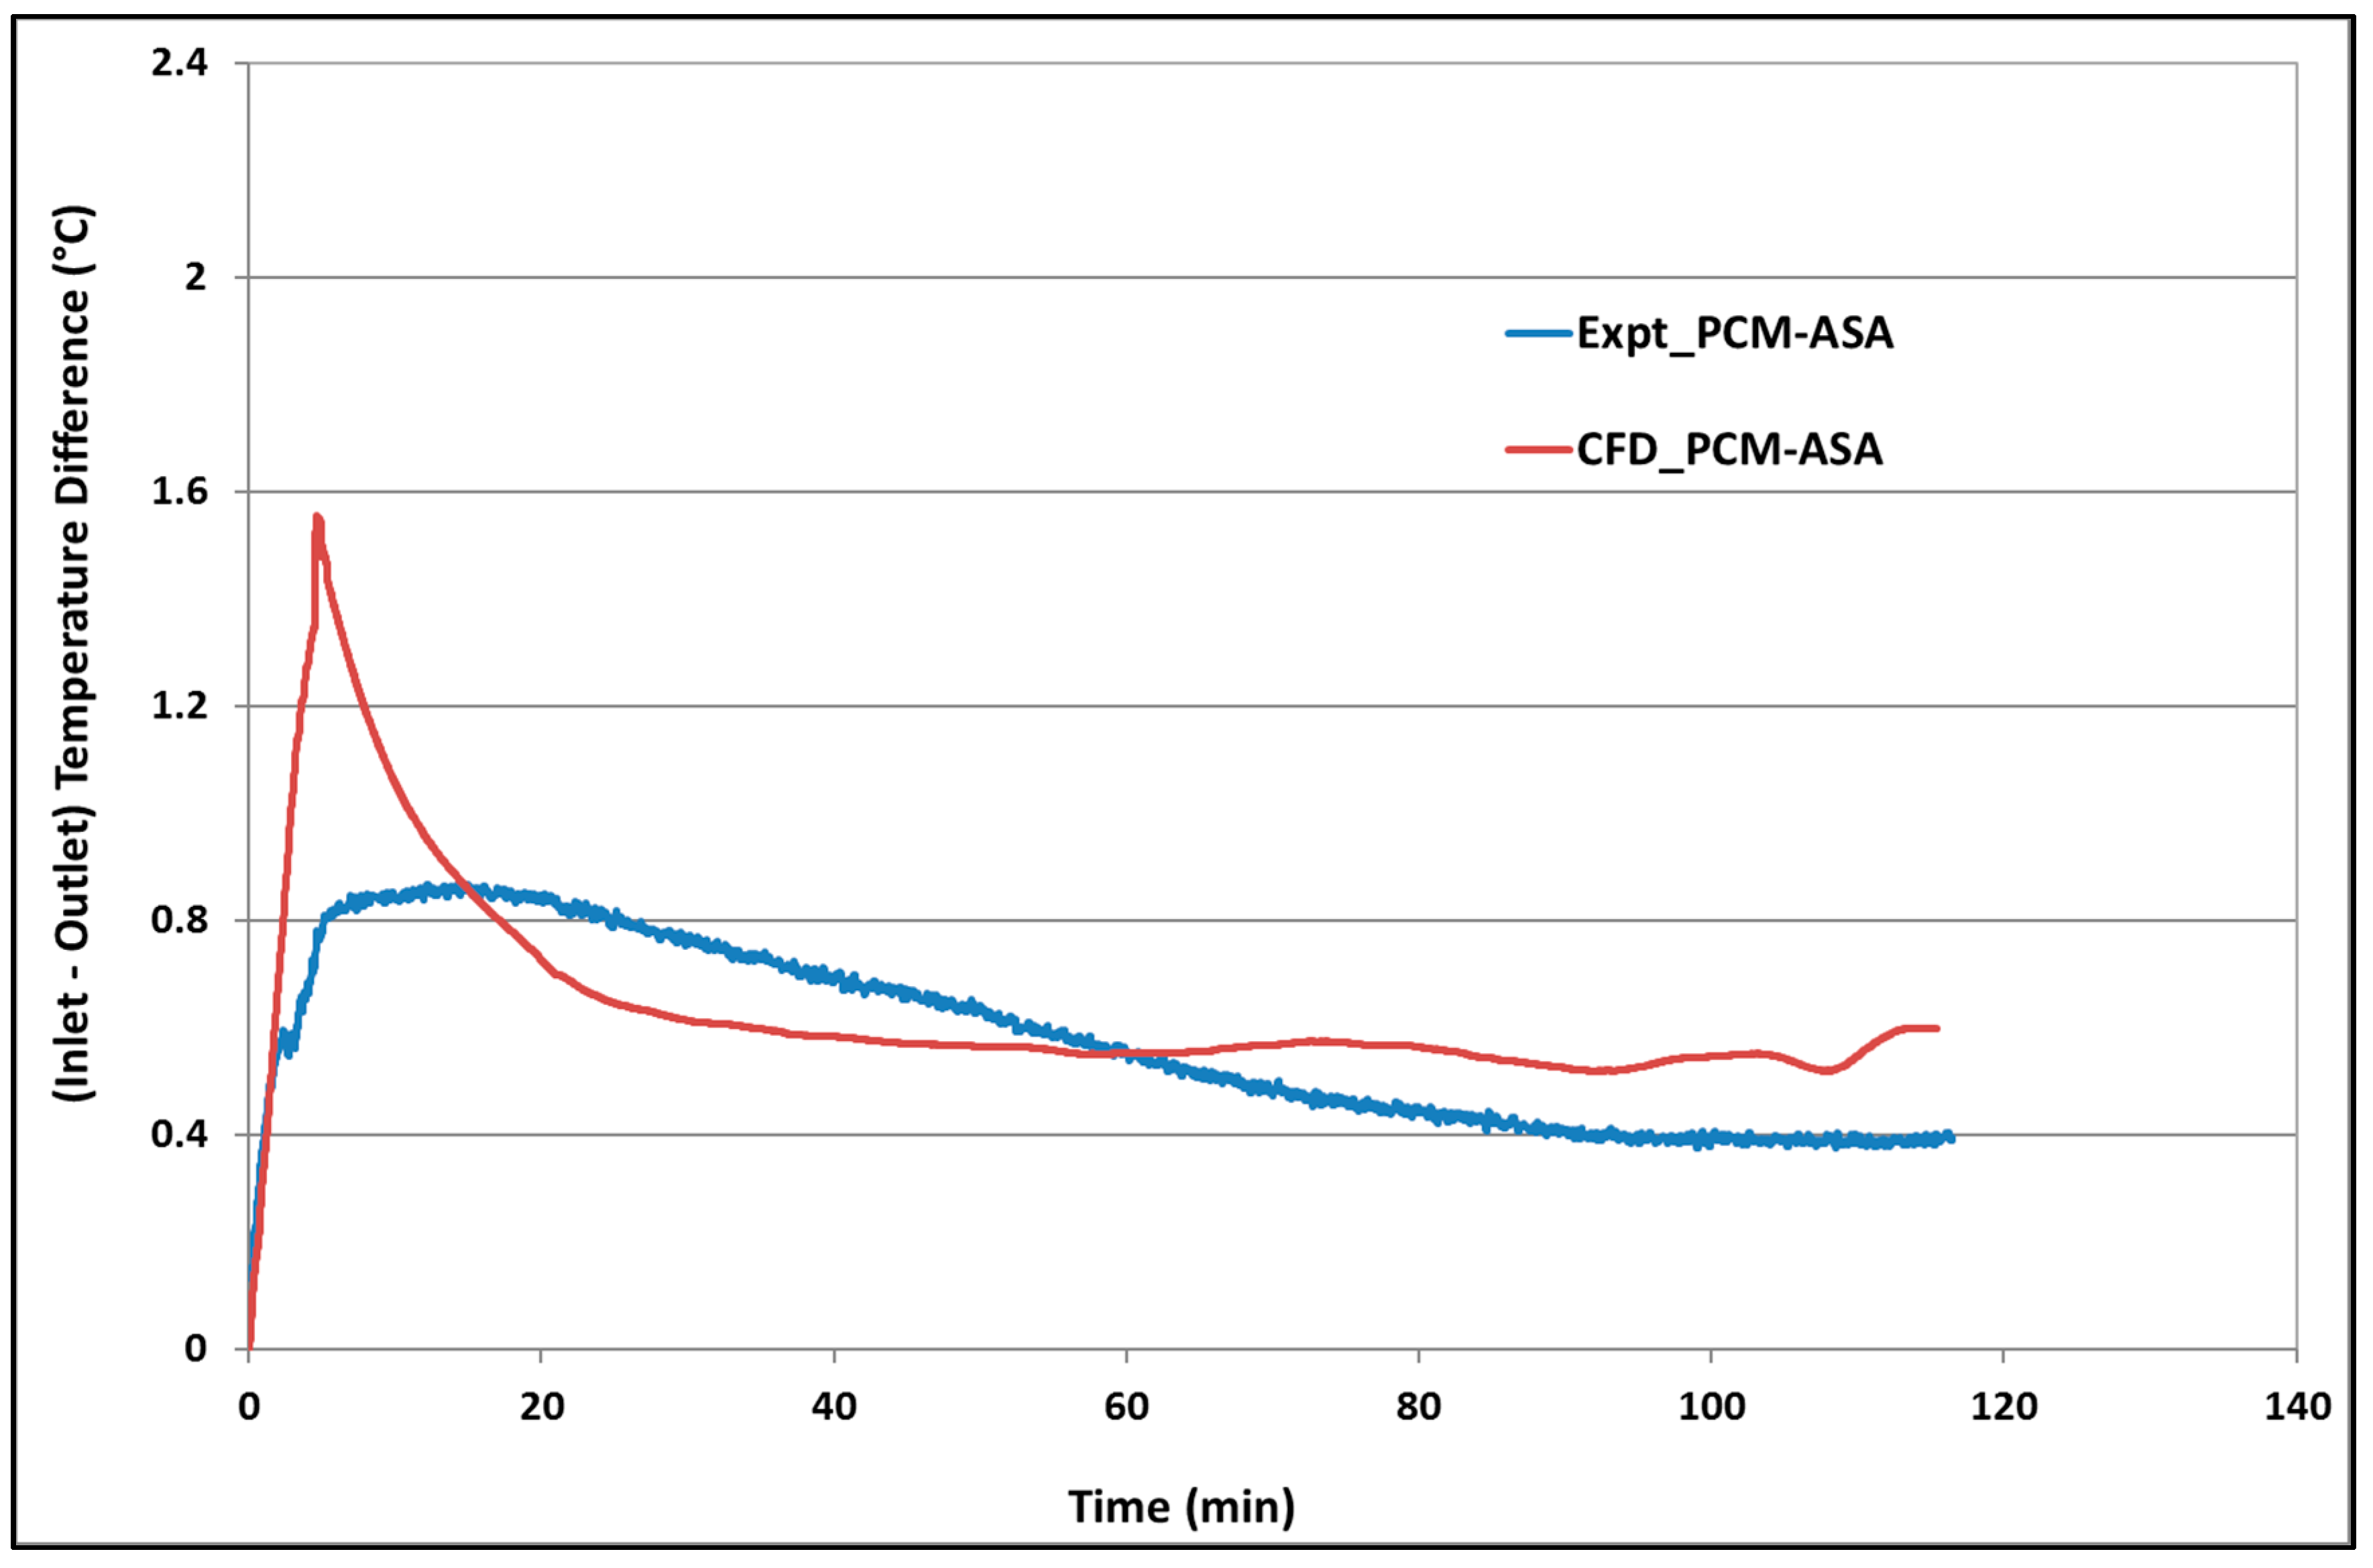
3.2. Validation of CFD Model of PCM–Air Duct
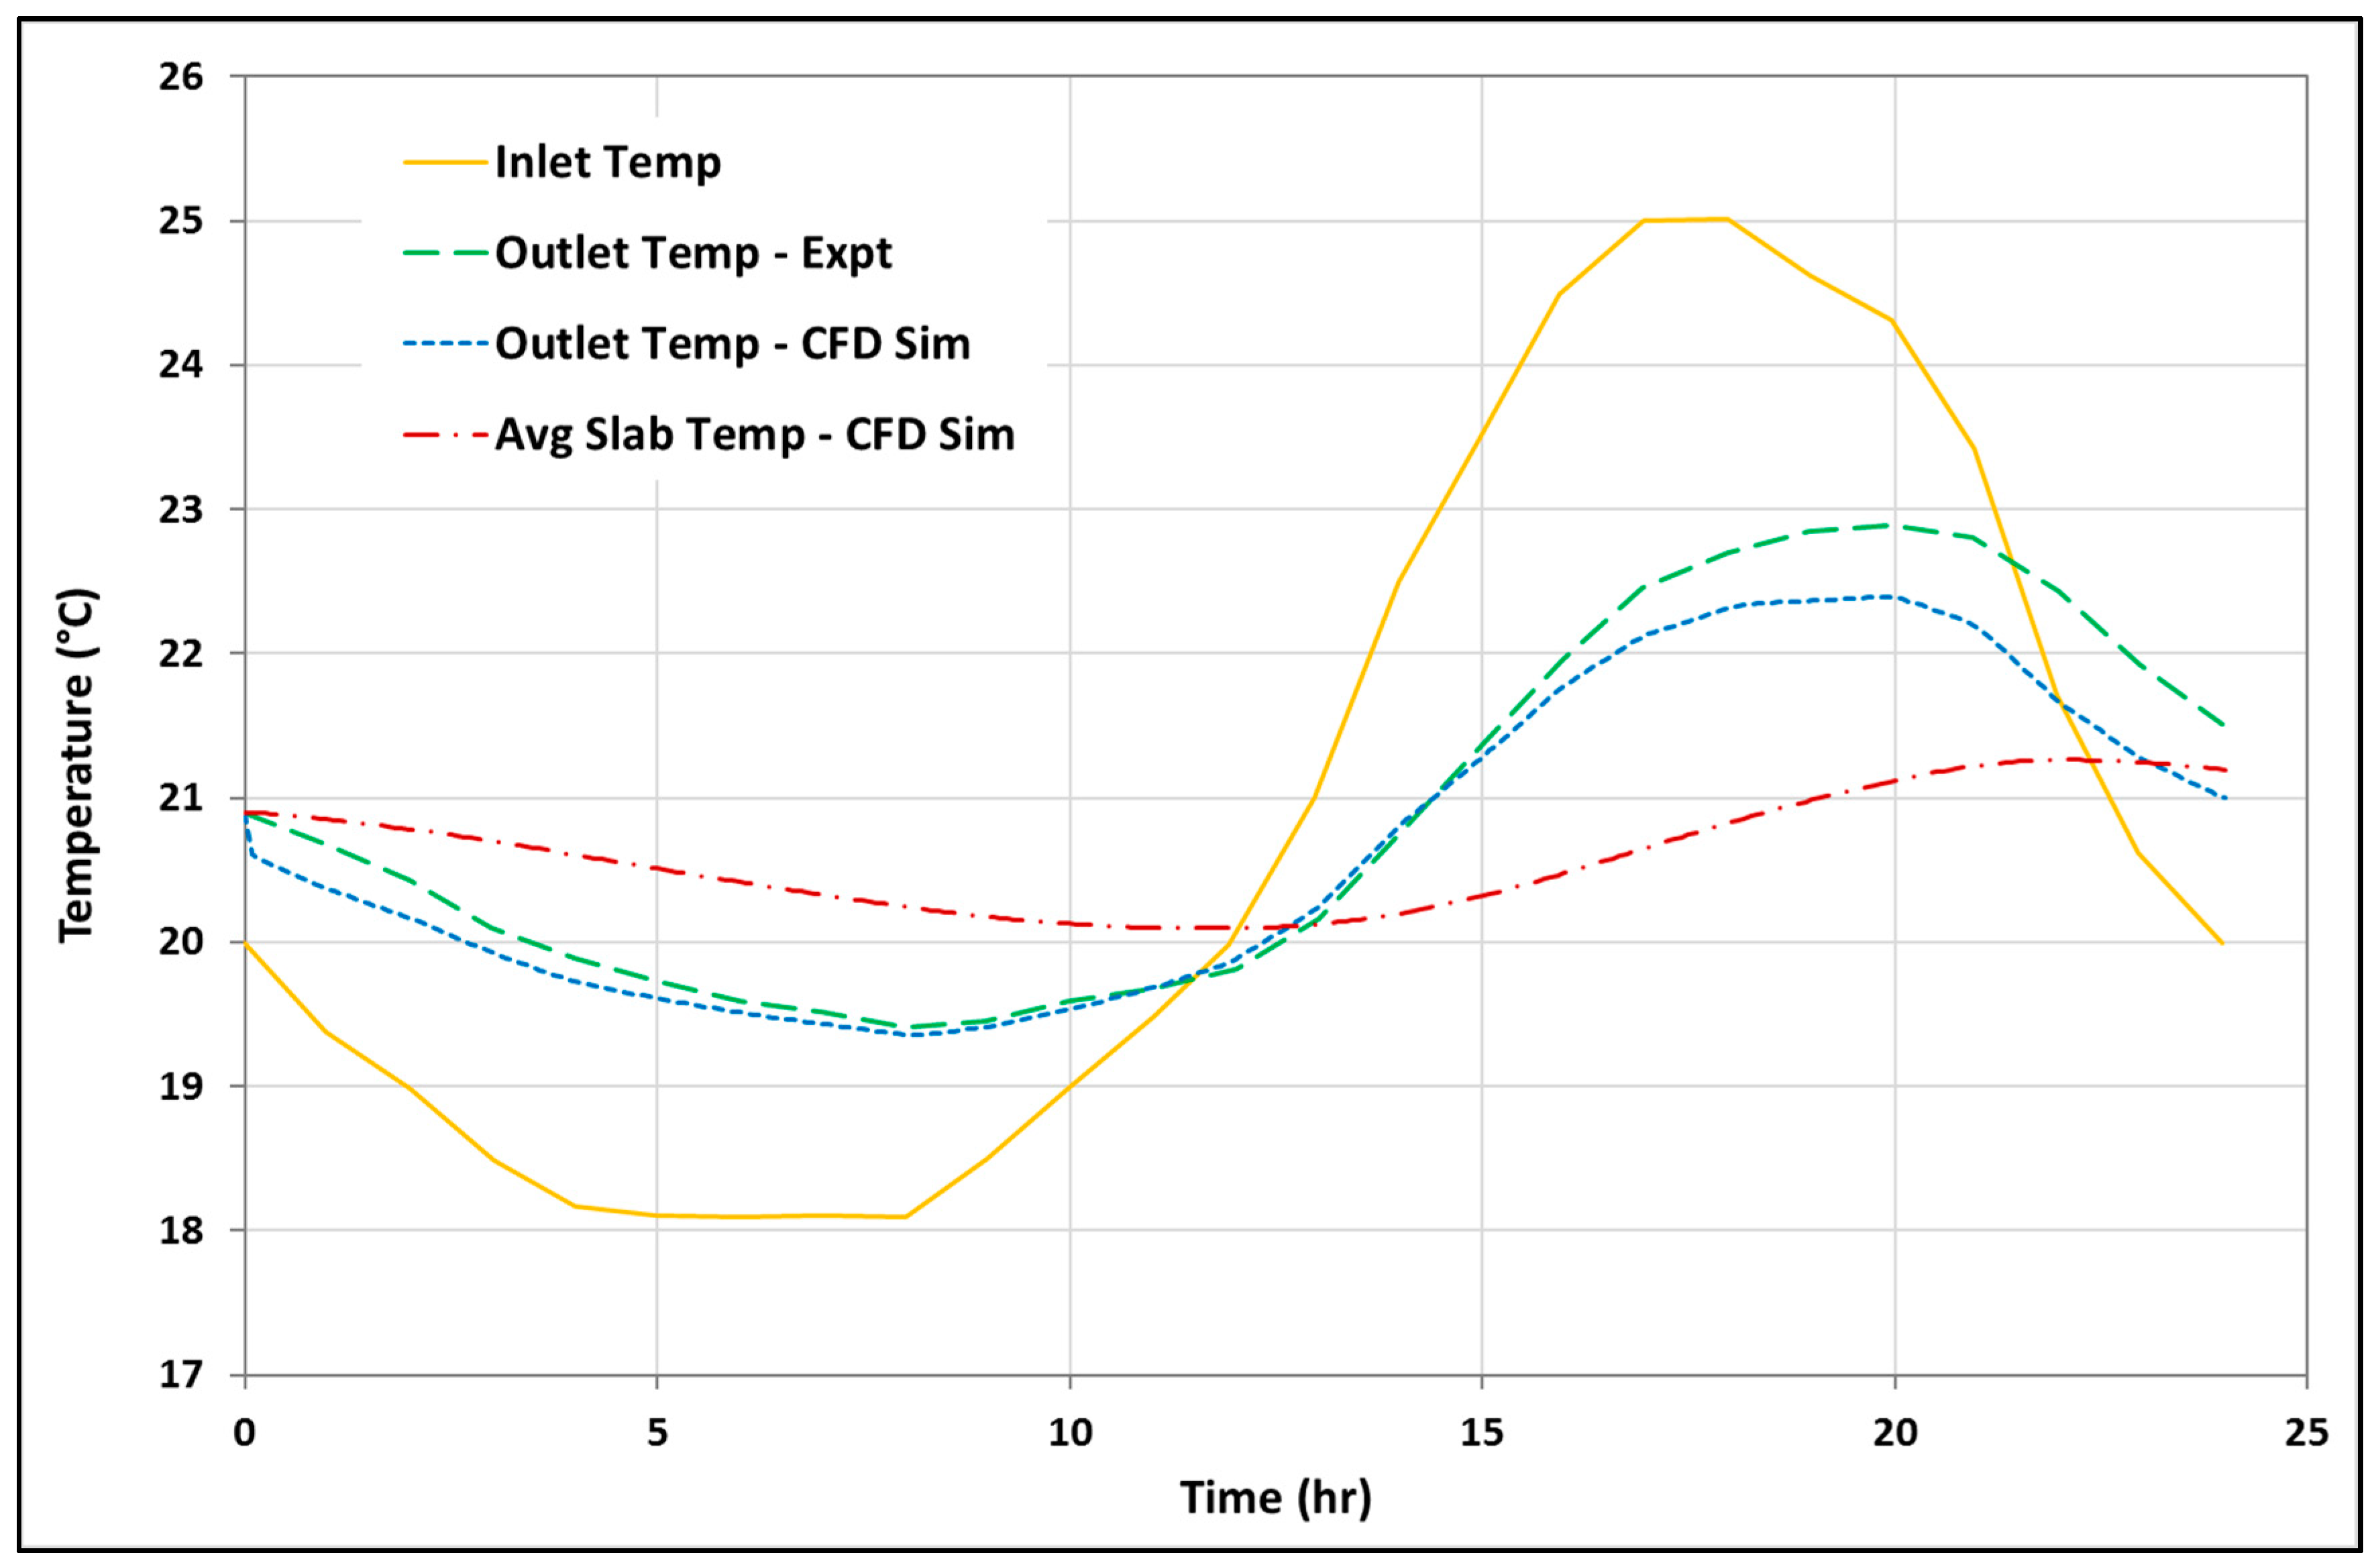
3.3. Validation of Hollow-Core Slab CFD Model
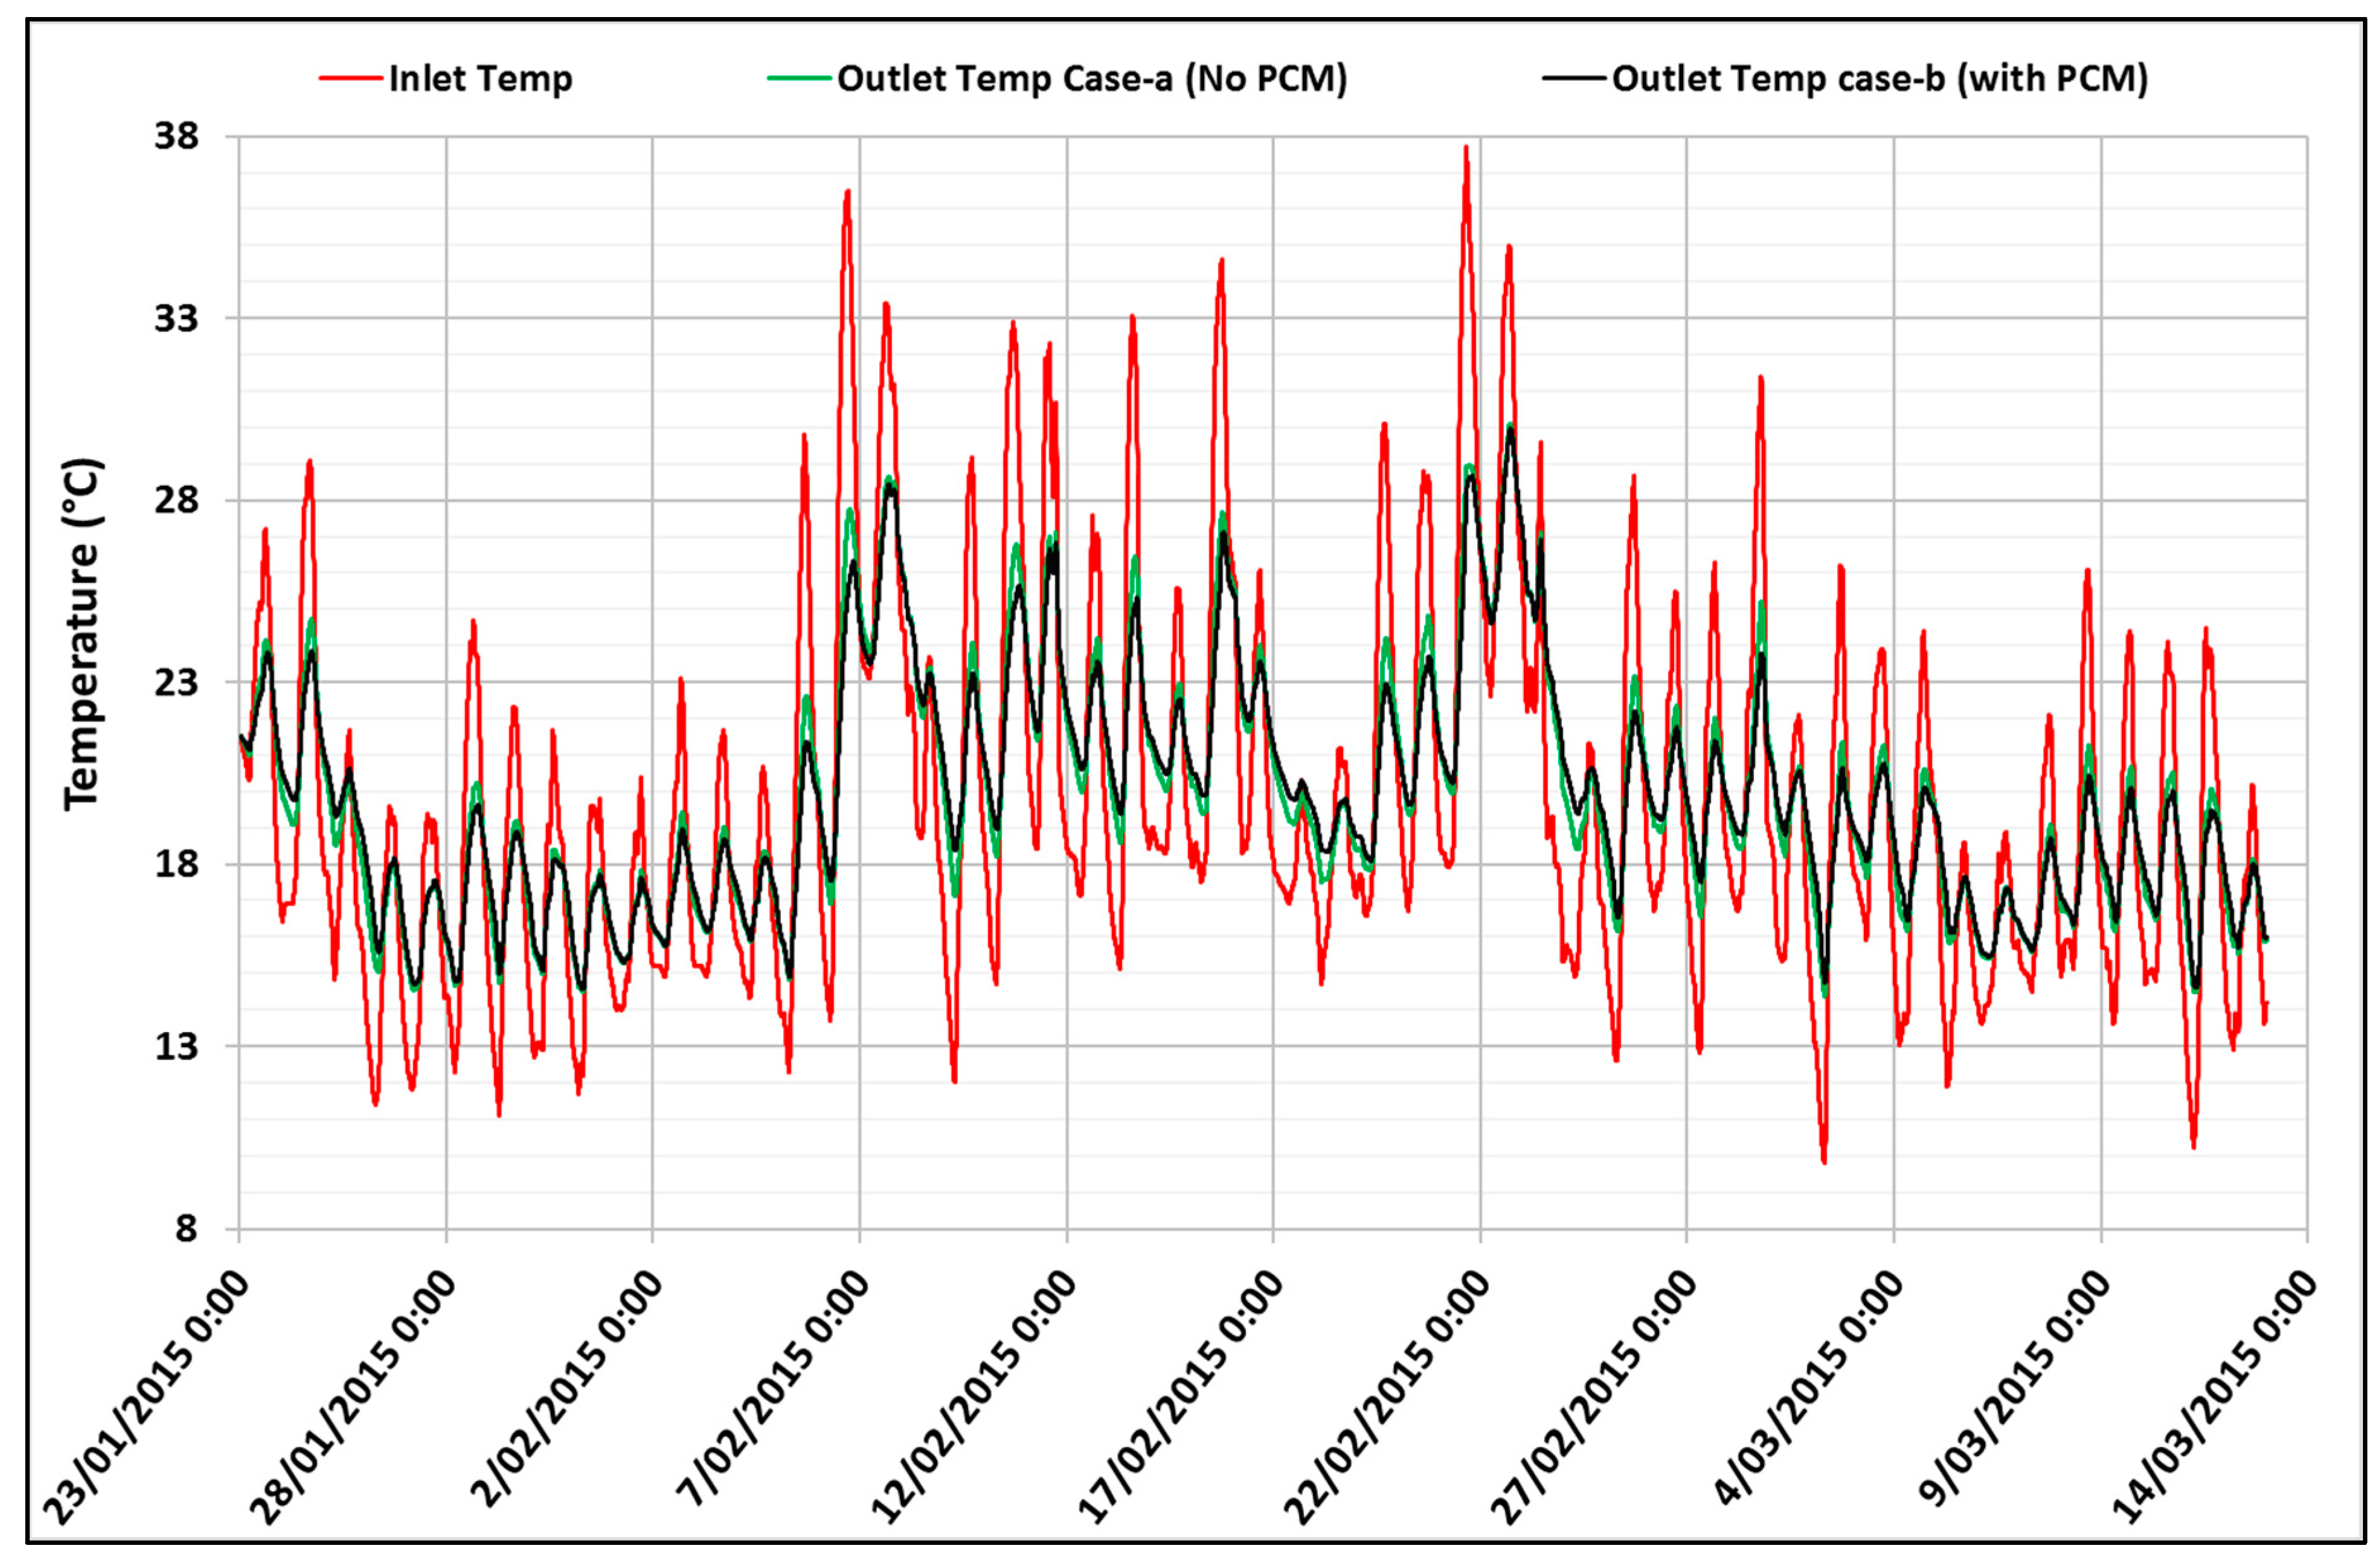
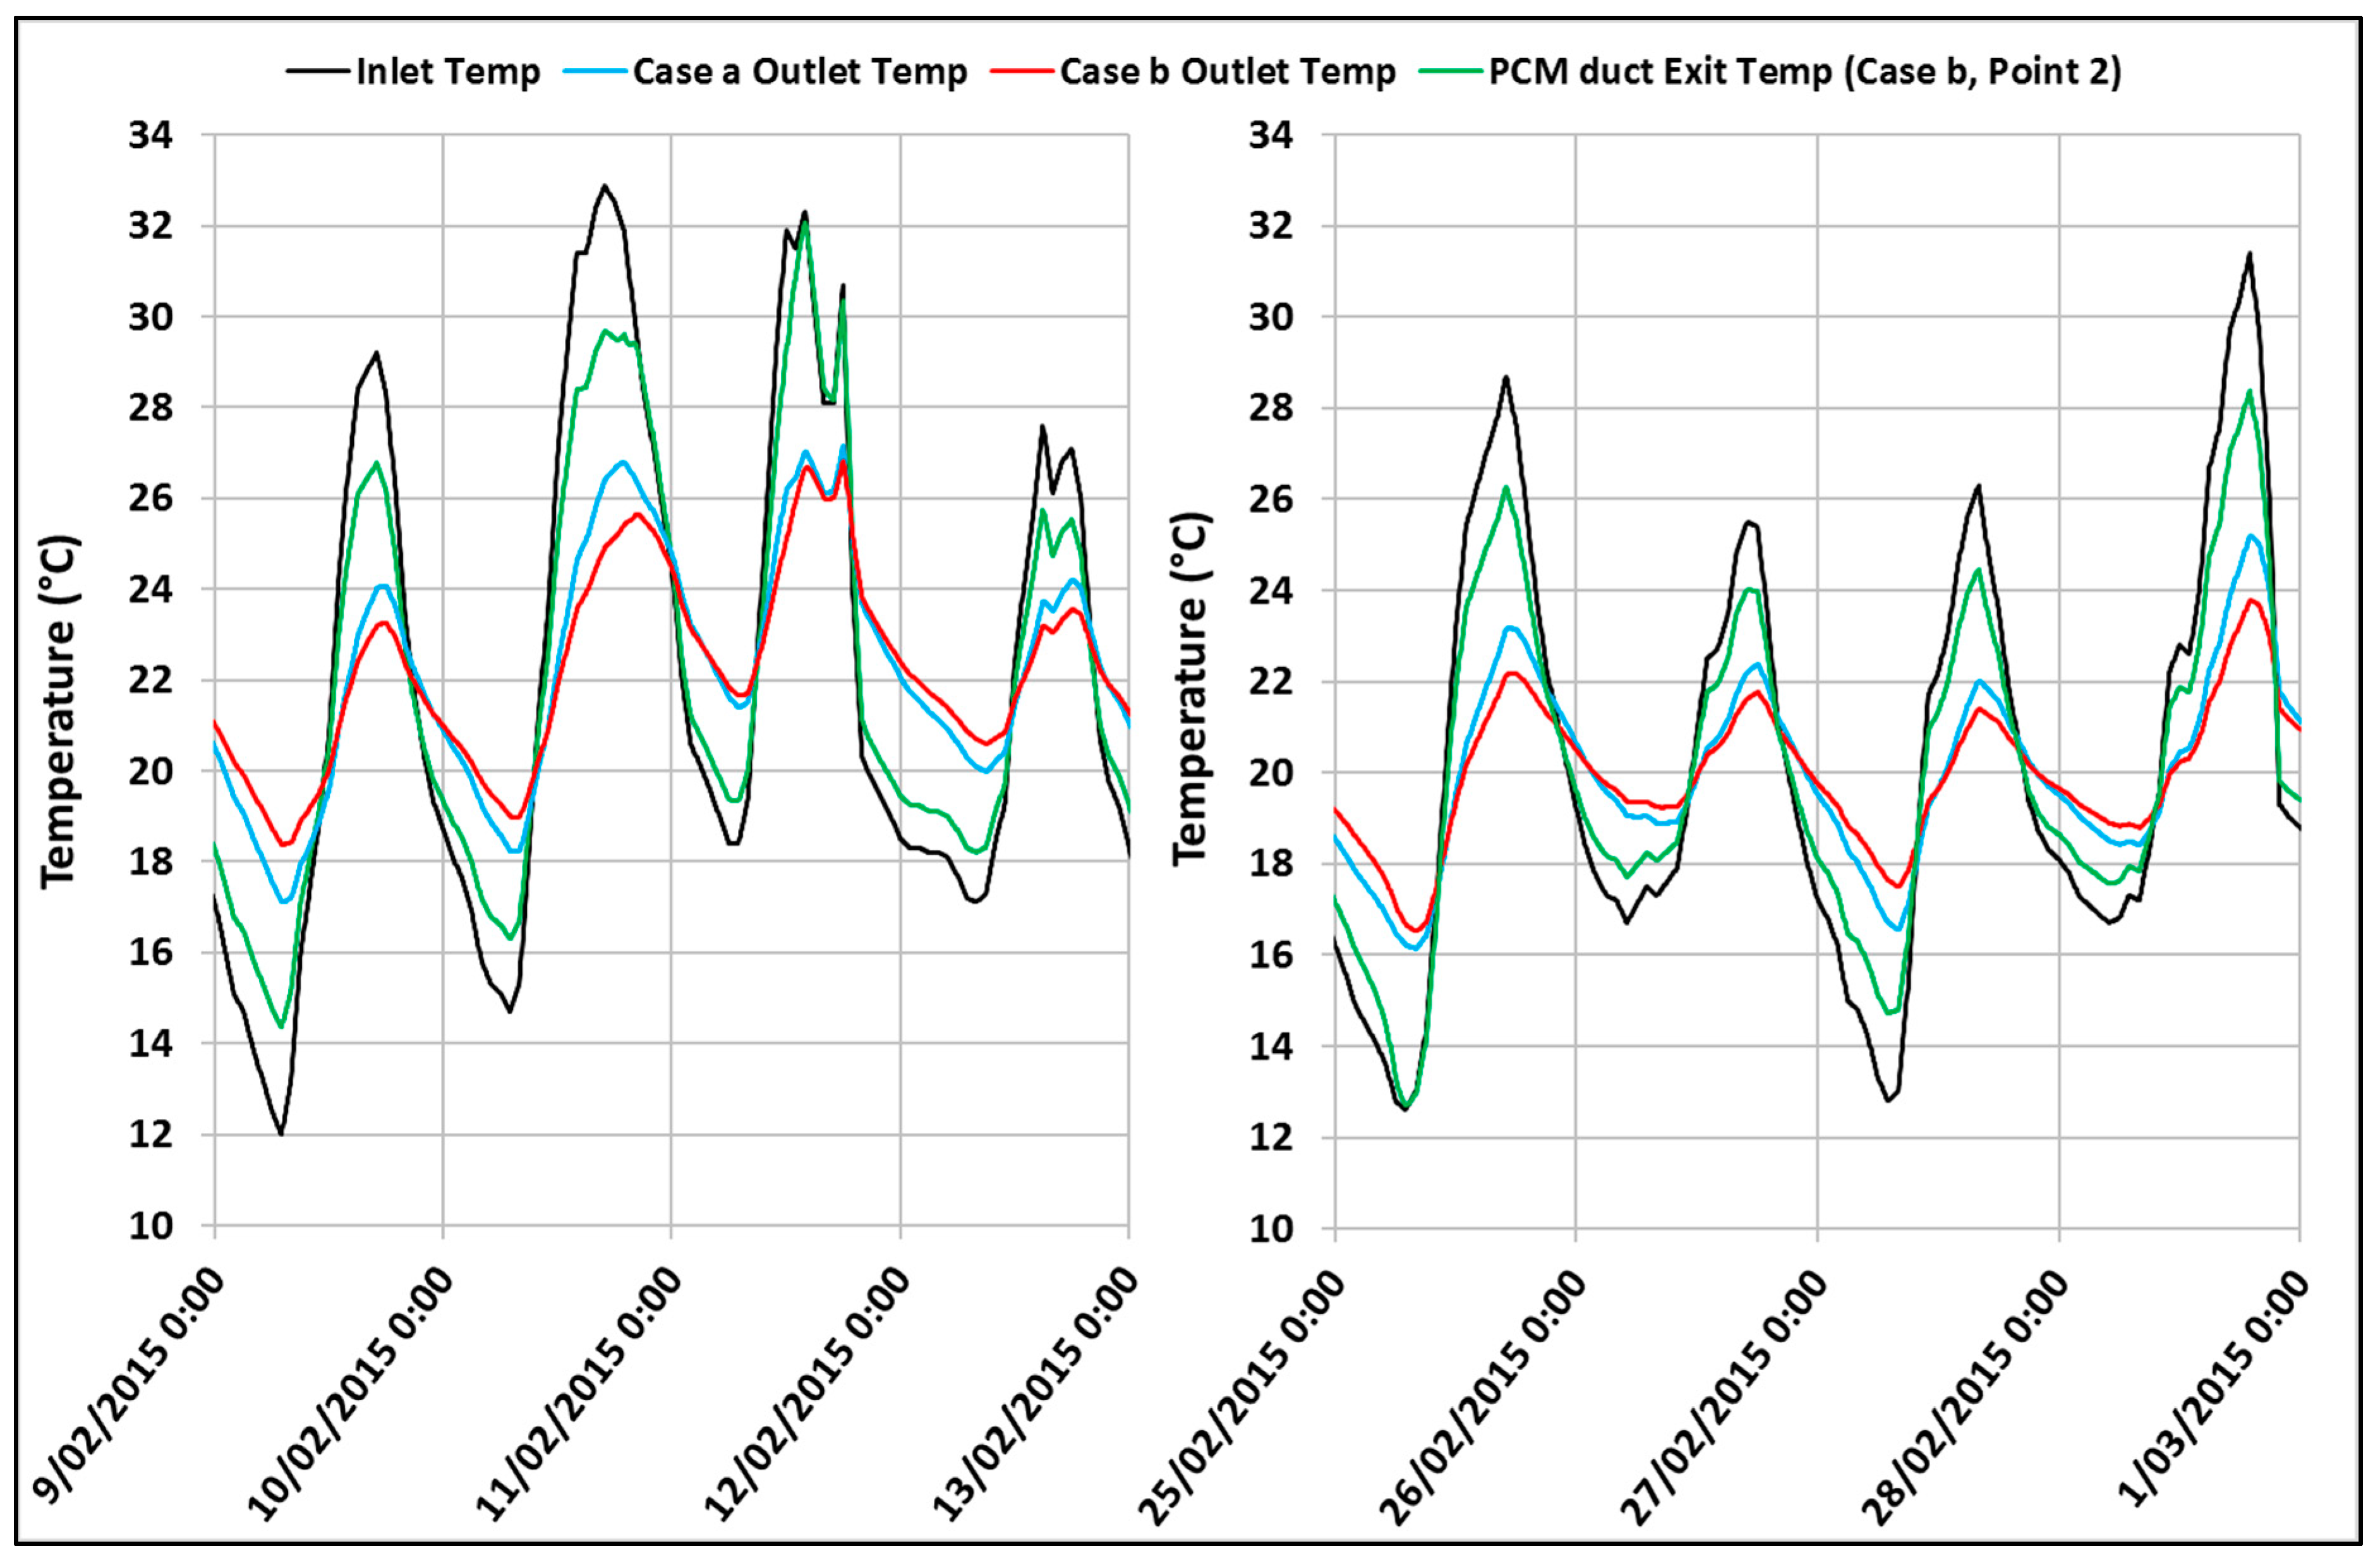
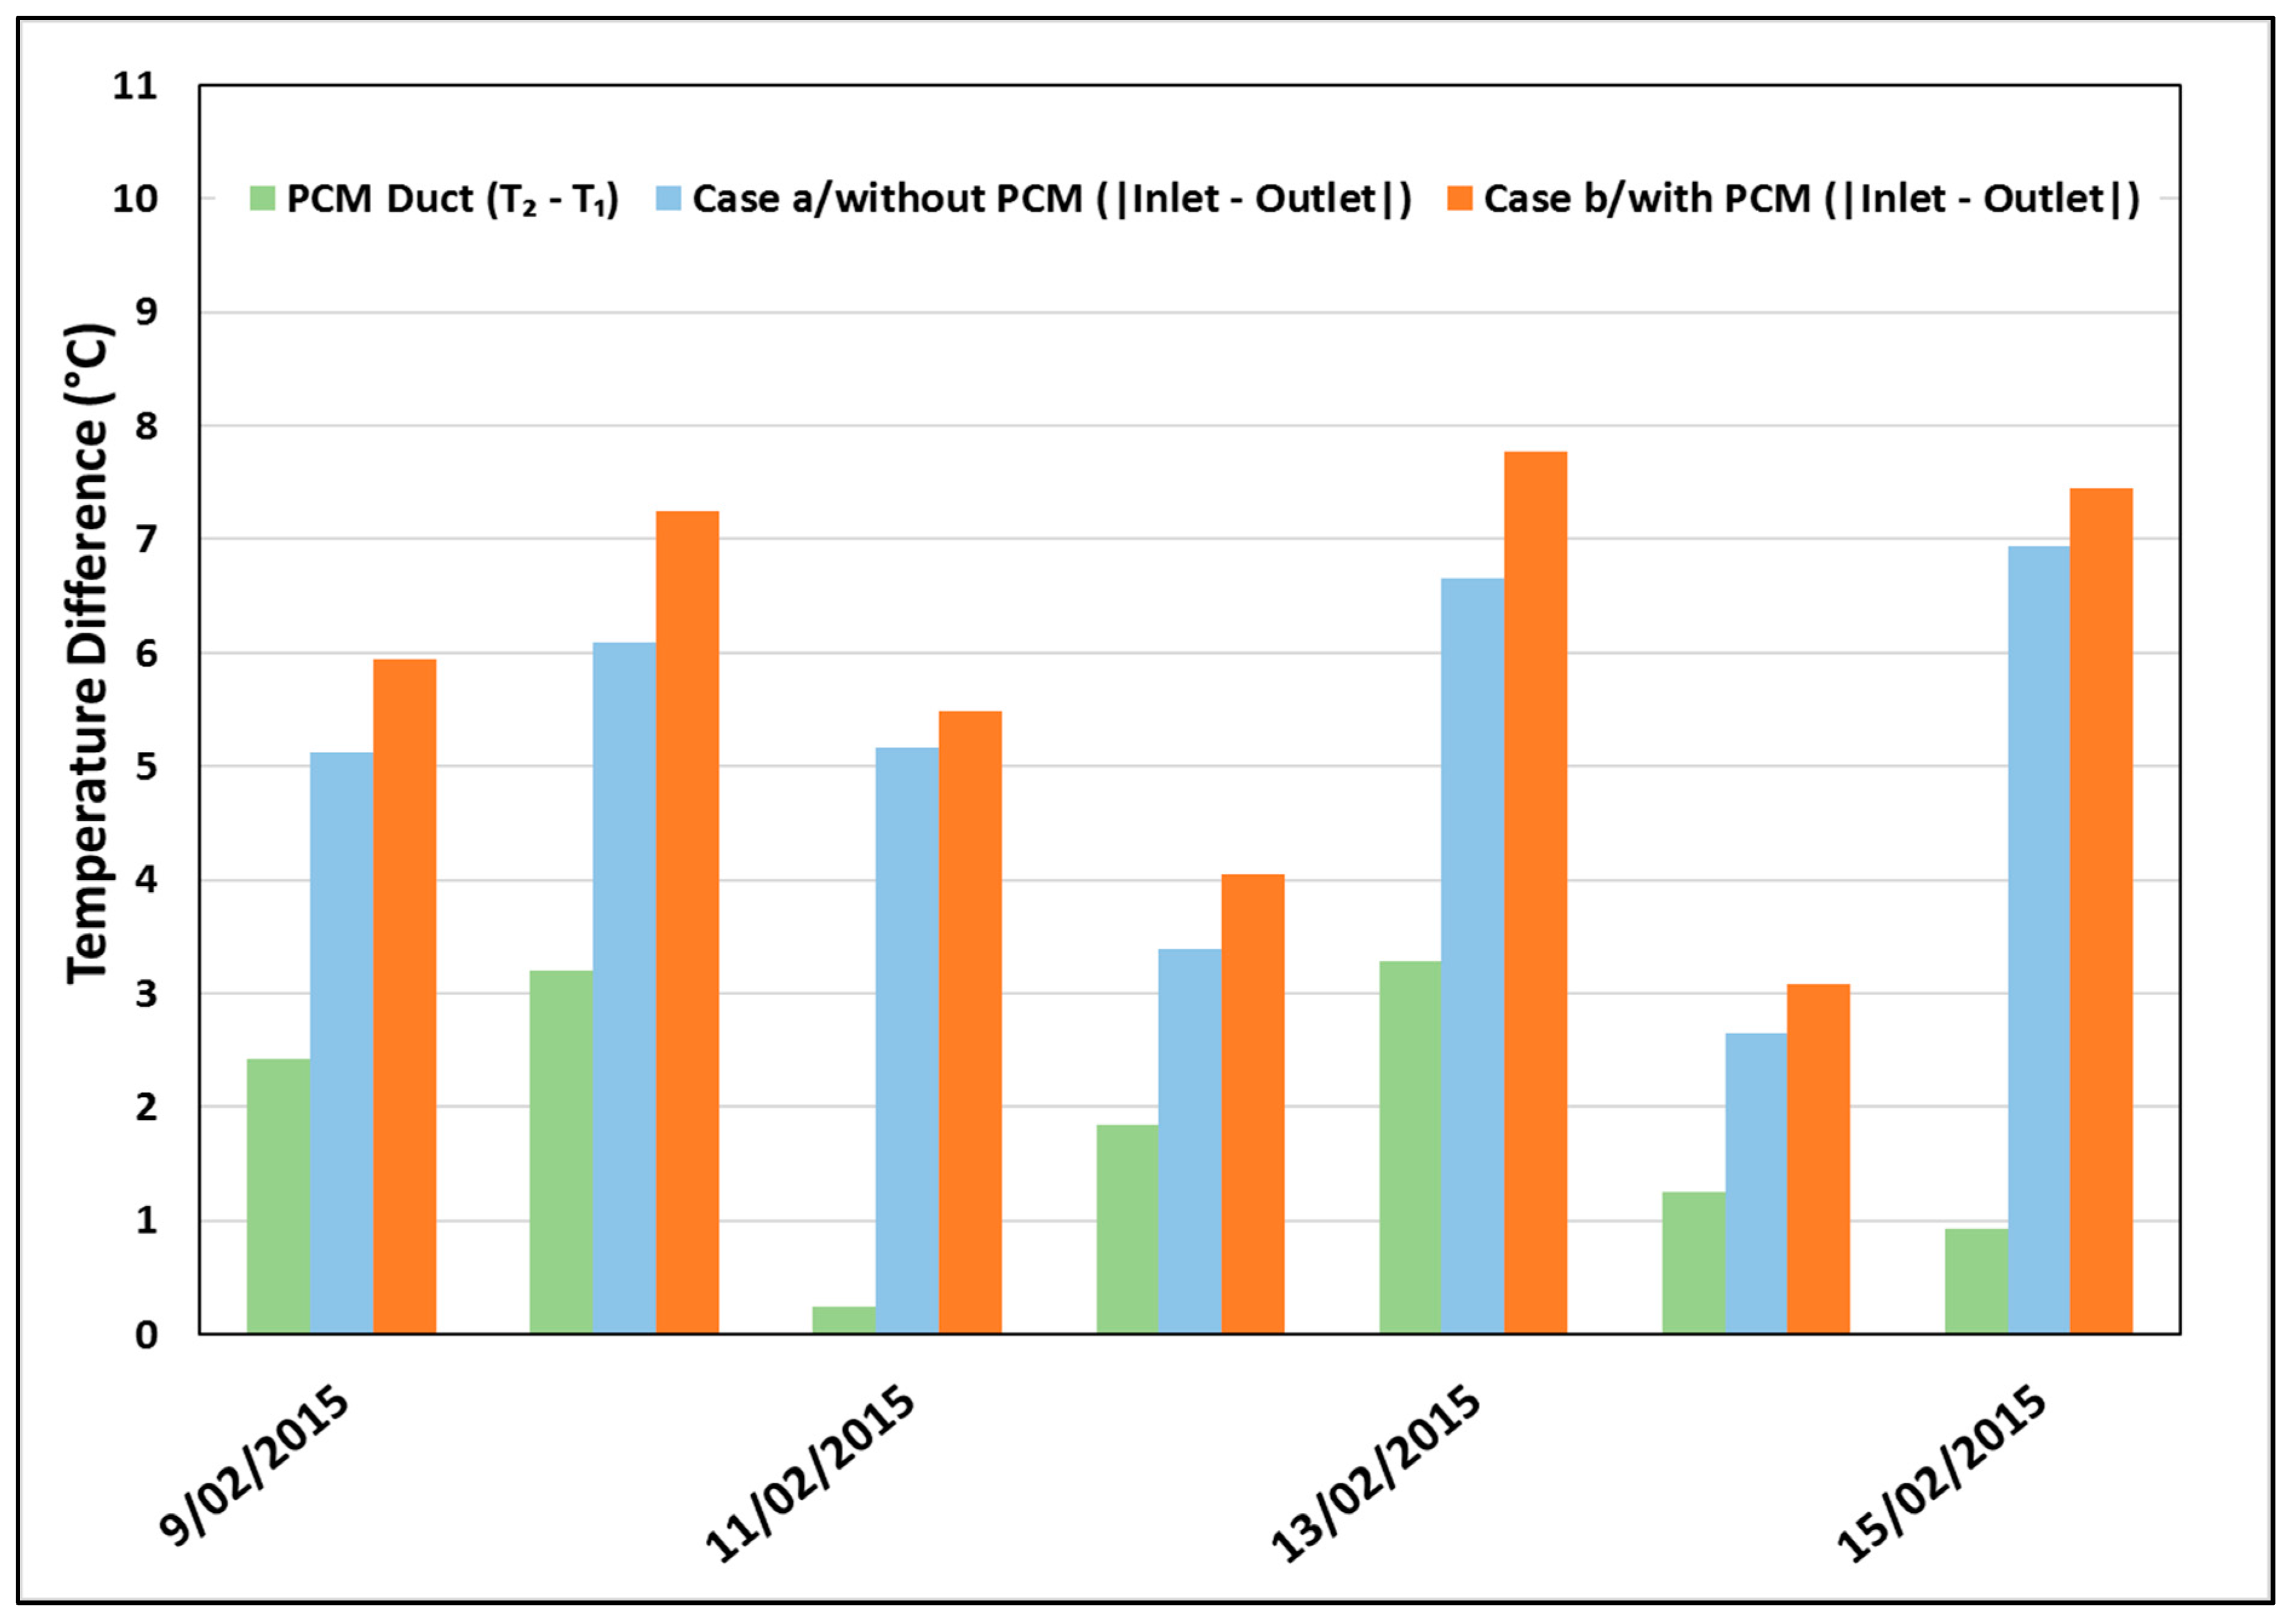
3.4. Scenario Analysis Using Different Weather Conditions
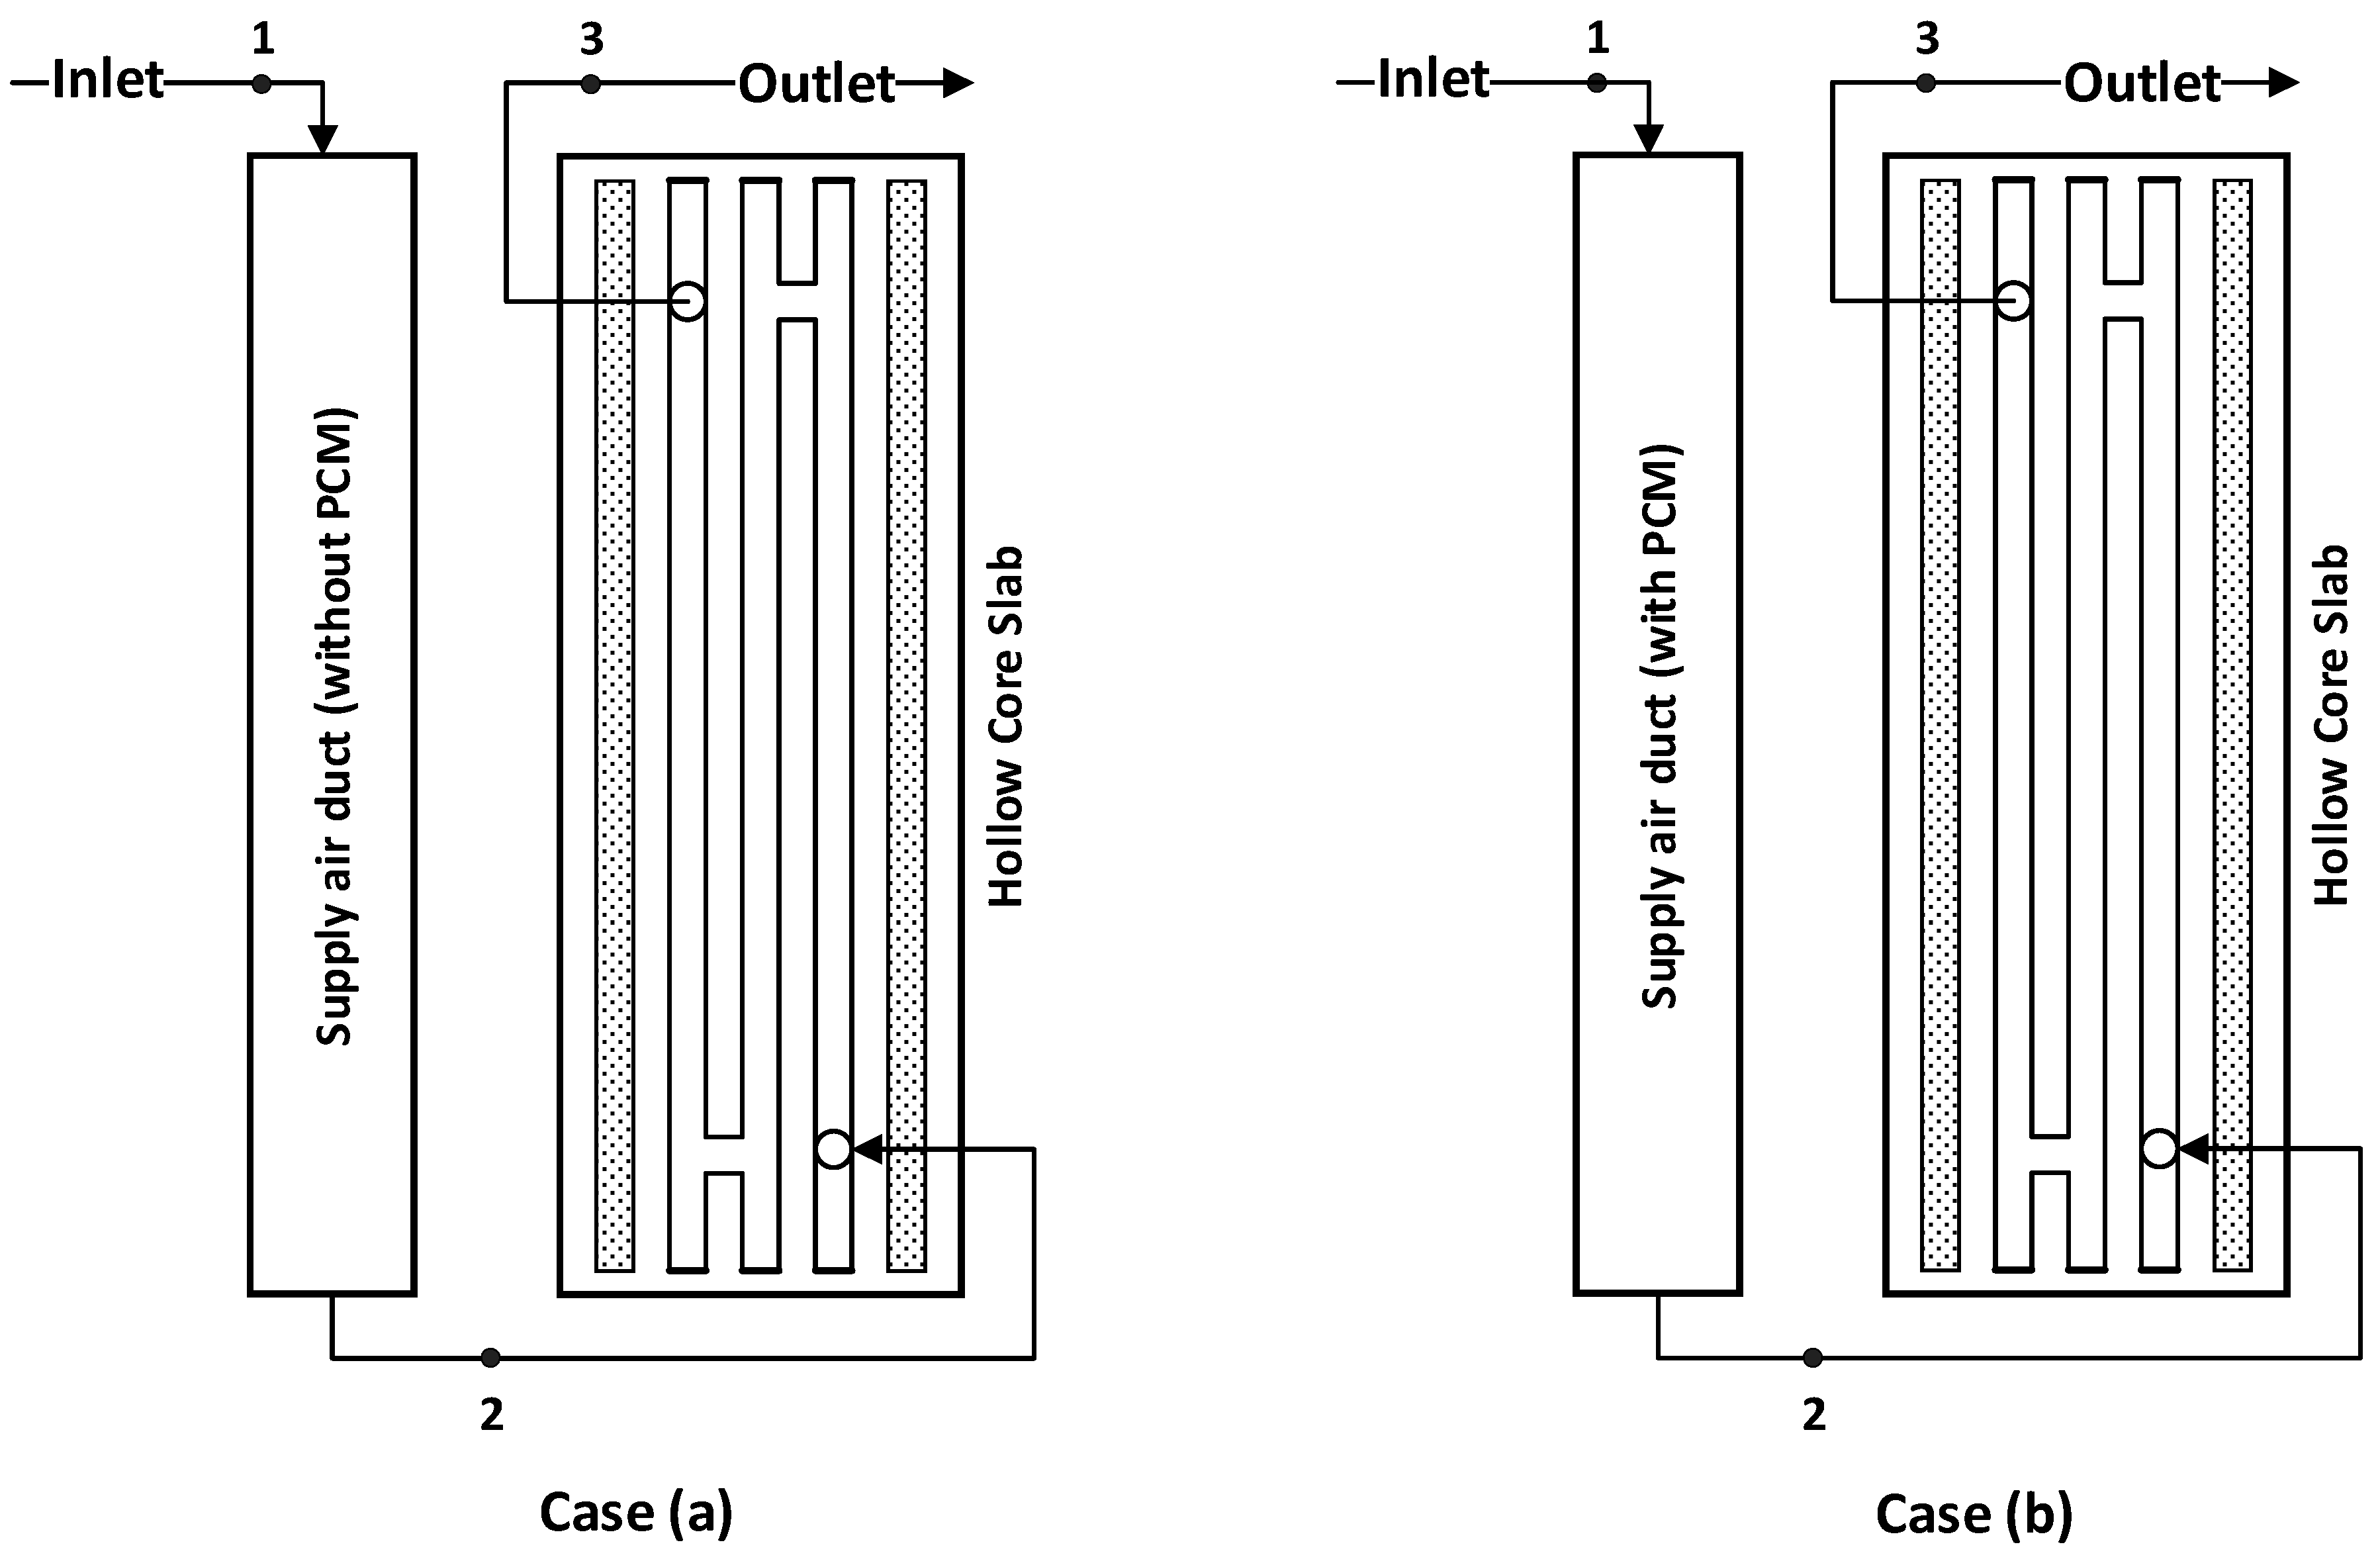
- Case-a (No PCM): Outdoor air passes through the air duct and then the hollow-core system into the room. The outlet temperature profile from the supply air duct simulation was used as the inlet temperature of the hollow-core slab simulation model.
- Case-b (With PCM): Outdoor air passes through the PCM-incorporated supply air duct and then the hollow-core system into the room. The outlet temperature profile from the PCM-incorporated supply air duct simulation was used as the inlet temperature of the hollow-core slab simulation model. In the simulation of the PCM-incorporated supply air duct, the PCM-ASA configuration was chosen as PCM effectiveness was maximum in this arrangement.
4. Conclusions
Author Contributions
Funding
Conflicts of Interest
References
- Lucon, O.; Ürge-Vorsatz, D.; Zain Ahmed, A.; Akbari, H.; Bertoldi, P.; Cabeza, L.F.; Eyre, N.; Gadgil, A.; Harvey, L.D.D.; Jiang, Y.; et al. Buildings. In Climate Change 2014: Mitigation of Climate Change. Contribution of Working Group III to the Fifth Assessment Report of the Intergovernmental Panel on Climate Change; Edenhofer, O., Pichs-Madruga, R., Sokona, Y., Farahani, E., Kadner, S., Seyboth, K., Adler, A., Brunner, P.E., Kriemann, B., Savolainen, J., et al., Eds.; Cambridge University Press: Cambridge, UK, 2014. [Google Scholar]
- Levine, M.; Ürge-Vorsatz, D.; Blok, K.; Geng, L.; Harvey, D.; Lang, S.; Levermore, G.; Mongameli Mehlwana, A.; Mirasgedis, S.; Novikova, A.; et al. Residential and commercial buildings. In Climate Change 2007: Mitigation. Contribution of Working Group III to the Fourth Assessment Report of the Intergovernmental Panel on Climate Change; Cambridge University Press: Cambridge, UK, 2007. [Google Scholar]
- Navarro, L.; de Gracia, A.; Colclough, S.; Browne, M.; McCormack, S.J.; Griffiths, P.; Cabeza, L.F. Thermal energy storage in building integrated thermal systems: A review. Part 1. active storage systems. Renew. Energy 2016, 88, 526–547. [Google Scholar] [CrossRef] [Green Version]
- Rinaldi, N. Thermal Mass, Night Cooling and Hollow Core Ventilation System as Energy Saving Strategies in Buildings. In KTH Architecture and The Built Environment; KTH Royal Institute of Technology: Stockholm, Sweden, 2009. [Google Scholar]
- Winwood, R.; Benstead, R.; Edwards, R. Advanced Fabric Energy Storage I: Review. Build. Serv. Eng. Res. Technol. 1997, 18, 1–6. [Google Scholar] [CrossRef]
- Xu, X.; Yu, J.; Wang, S.; Wang, J. Research and application of active hollow core slabs in building systems for utilizing low energy sources. Appl. Energy 2014, 116, 424–435. [Google Scholar] [CrossRef]
- Ren, M.J.; Wright, J.A. A ventilated slab thermal storage system model. Build. Environ. 1998, 33, 43–52. [Google Scholar] [CrossRef]
- Winwood, R.; Benstead, R.; Edwards, R. Advanced fabric energy storage II: Computational fluid dynamics modelling. Build. Serv. Eng. Res. Technol. 1997, 18, 7–16. [Google Scholar] [CrossRef]
- Winwood, R.; Benstead, R.; Edwards, R. Advanced fabric energy storage IV: Experimental monitoring. Build. Serv. Eng. Res. Technol. 1997, 18, 25–30. [Google Scholar] [CrossRef]
- Zmeureanu, R.; Fazio, P. Thermal performance of a hollow core concrete floor system for passive cooling. Build. Environ. 1988, 23, 243–252. [Google Scholar] [CrossRef]
- Willis, S.; Wilkins, J. Mass Appeal. Build. Serv. J. 1993, 15, 25–28. [Google Scholar]
- Russell, M.B.; Surendran, P.N. Influence of active heat sinks on fabric thermal storage in building mass. Appl. Energy 2001, 70, 17–33. [Google Scholar] [CrossRef]
- Corgnati, S.P.; Kindinis, A. Thermal mass activation by hollow core slab coupled with night ventilation to reduce summer cooling loads. Build. Environ. 2007, 42, 3285–3297. [Google Scholar] [CrossRef]
- Chae, Y.T.; Strand, R.K. Modeling ventilated slab systems using a hollow core slab: Implementation in a whole building energy simulation program. Energy Build. 2013, 57, 165–175. [Google Scholar] [CrossRef]
- Castell, A.; Martorell, I.; Medrano, M.; Pérez, G.; Cabeza, L.F. Experimental study of using PCM in brick constructive solutions for passive cooling. Energy Build. 2010, 42, 534–540. [Google Scholar] [CrossRef]
- Silva, T.; Vicente, R.; Soares, N.; Ferreira, V. Experimental testing and numerical modelling of masonry wall solution with PCM incorporation: A passive construction solution. Energy Build. 2012, 49, 235–245. [Google Scholar] [CrossRef]
- Athienitis, A.K.; Liu, C.; Hawes, D.; Banu, D.; Feldman, D. Investigation of the thermal performance of a passive solar test-room with wall latent heat storage. Build. Environ. 1997, 32, 405–410. [Google Scholar] [CrossRef]
- Behzadi, S.; Farid, M.M. Experimental and numerical investigations on the effect of using phase change materials for energy conservation in residential buildings. HVAC&R Res. 2011, 17, 366–376. [Google Scholar]
- Ahmad, M.; Bontemps, A.; Sallée, H.; Quenard, D. Thermal testing and numerical simulation of a prototype cell using light wallboards coupling vacuum isolation panels and phase change material. Energy Build. 2006, 38, 673–681. [Google Scholar] [CrossRef]
- Ascione, F.; Bianco, N.; De Masi, R.F.; de’ Rossi, F.; Vanoli, G.P. Energy refurbishment of existing buildings through the use of phase change materials: Energy savings and indoor comfort in the cooling season. Appl. Energy 2014, 113, 990–1007. [Google Scholar] [CrossRef]
- Ramakrishnan, S.; Wang, X.; Sanjayan, J.; Wilson, J. Thermal performance assessment of phase change material integrated cementitious composites in buildings: Experimental and numerical approach. Appl. Energy 2017, 207, 654–664. [Google Scholar] [CrossRef]
- Ramakrishnan, S.; Wang, X.; Sanjayan, J.; Petinakis, E.; Wilson, J. Development of thermal energy storage cementitious composites (TESC) containing a novel paraffin/hydrophobic expanded perlite composite phase change material. Sol. Energy 2017, 158, 626–635. [Google Scholar] [CrossRef]
- Ramakrishnan, S.; Sanjayan, J.; Wang, X.; Alam, M.; Wilson, J. A novel paraffin/expanded perlite composite phase change material for prevention of PCM leakage in cementitious composites. Appl. Energy 2015, 157, 85–94. [Google Scholar] [CrossRef]
- Entrop, A.G.; Brouwers, H.J.H.; Reinders, A.H.M.E. Experimental research on the use of micro-encapsulated Phase Change Materials to store solar energy in concrete floors and to save energy in Dutch houses. Sol. Energy 2011, 85, 1007–1020. [Google Scholar] [CrossRef]
- Hunger, M.; Entrop, A.G.; Mandilaras, I.; Brouwers, H.J.H.; Founti, M. The behavior of self-compacting concrete containing micro-encapsulated Phase Change Materials. Cem. Concr. Compos. 2009, 31, 731–743. [Google Scholar] [CrossRef]
- Jamil, H.; Alam, M.; Sanjayan, J.; Wilson, J. Investigation of PCM as retrofitting option to enhance occupant thermal comfort in a modern residential building. Energy Build. 2016, 133, 217–229. [Google Scholar] [CrossRef]
- Alam, M.; Jamil, H.; Sanjayan, J.; Wilson, J. Energy saving potential of phase change materials in major Australian cities. Energy Build. 2014, 78, 192–201. [Google Scholar] [CrossRef]
- Sage-Lauck, J.S.; Sailor, D.J. Evaluation of phase change materials for improving thermal comfort in a super-insulated residential building. Energy Build. 2014, 79, 32–40. [Google Scholar] [CrossRef]
- Ramakrishnan, S.; Wang, X.; Sanjayan, J.; Wilson, J. Thermal performance of buildings integrated with phase change materials to reduce heat stress risks during extreme heatwave events. Appl. Energy 2017, 194, 410–421. [Google Scholar] [CrossRef]
- Chaiyat, N. Energy and economic analysis of a building air-conditioner with a phase change material (PCM). Energy Convers. Manag. 2015, 94, 150–158. [Google Scholar] [CrossRef]
- Mazo, J.; Delgado, M.; Marin, J.M.; Zalba, B. Modeling a radiant floor system with Phase Change Material (PCM) integrated into a building simulation tool: Analysis of a case study of a floor heating system coupled to a heat pump. Energy Build. 2012, 47, 458–466. [Google Scholar] [CrossRef]
- Moreno, P.; Solé, C.; Castell, A.; Cabeza, L.F. The use of phase change materials in domestic heat pump and air-conditioning systems for short term storage: A review. Renew. Sustain. Energy Rev. 2014, 39, 1–13. [Google Scholar] [CrossRef]
- Real, A.; García, V.; Domenech, L.; Renau, J.; Montés, N.; Sánchez, F. Improvement of a heat pump based HVAC system with PCM thermal storage for cold accumulation and heat dissipation. Energy Build. 2014, 83, 108–116. [Google Scholar] [CrossRef]
- Alam, M.; Sanjayan, J.; Zou, P.X.W.; Ramakrishnan, S.; Wilson, J. Evaluating the passive and free cooling application methods of phase change materials in residential buildings: A comparative study. Energy Build. 2017, 148, 238–256. [Google Scholar] [CrossRef]
- Weinläder, H.; Körner, W.; Strieder, B. A ventilated cooling ceiling with integrated latent heat storage—Monitoring results. Energy Build. 2014, 82, 65–72. [Google Scholar] [CrossRef]
- Osterman, E.; Butala, V.; Stritih, U. PCM thermal storage system for ‘free’ heating and cooling of buildings. Energy Build. 2015, 106, 125–133. [Google Scholar] [CrossRef]
- Whiffen, T.R.; Russell-Smith, G.; Riffat, S.B. Active thermal mass enhancement using phase change materials. Energy Build. 2016, 111, 1–11. [Google Scholar] [CrossRef] [Green Version]
- Pomianowski, M.; Heiselberg, P.; Jensen, R.L. Full-scale investigation of the dynamic heat storage of concrete decks with PCM and enhanced heat transfer surface area. Energy Build. 2013, 59, 287–300. [Google Scholar] [CrossRef]
- Faheem, A.; Ranzi, G.; Fiorito, F.; Lei, C. A numerical study on the thermal performance of night ventilated hollow core slabs cast with micro-encapsulated PCM concrete. Energy Build. 2016, 127, 892–906. [Google Scholar] [CrossRef]
- Navarro, L.; de Gracia, A.; Castell, A.; Cabeza, L.F. Experimental evaluation of a concrete core slab with phase change materials for cooling purposes. Energy Build. 2016, 116, 411–419. [Google Scholar] [CrossRef] [Green Version]
- Navarro, L.; de Gracia, A.; Castell, A.; Cabeza, L.F. Experimental study of an active slab with PCM coupled to a solar air collector for heating purposes. Energy Build. 2016, 128, 12–21. [Google Scholar] [CrossRef]
- Li, X.; Sanjayan, J.G.; Wilson, J.L. Fabrication and stability of form-stable diatomite/paraffin phase change material composites. Energy Build. 2014, 76, 284–294. [Google Scholar] [CrossRef]
- Muruganantham, K. Application of Phase Change Material in Buildings: Field Data vs. EnergyPlus Simulation. Master’s Thesis, Arizona State University, Tempe, AZ, USA, 2010. [Google Scholar]
- Winwood, R.; Benstead, R.; Edwards, R.; Letherman, K.M. Building fabric thermal storage: Use of computational fluid dynamics for modelling. Build. Serv. Eng. Res. Technol. 1994, 15, 171–178. [Google Scholar] [CrossRef]
- Holman, J.P. Heat Transfer, 10th ed.; Mcgraw-Hill: New York, NY, USA, 2010. [Google Scholar]


| |Inlet − Outlet| | Without PCM (Case a) | With PCM (Case b) | ||
|---|---|---|---|---|
| Min | Max | Min | Max | |
| ΔT (°C) | % of days | % of days | % of days | % of days |
| ΔT ≤ 1 °C | 4.1% | 12.2% | 4.1% | 12.2% |
| 1 °C < ΔT ≤ 2 °C | 26.5% | 12.2% | 16.3% | 10.2% |
| 2 °C < ΔT ≤ 3 °C | 32.7% | 14.3% | 32.7% | 10.2% |
| 3 °C < ΔT ≤ 4 °C | 28.6% | 22.4% | 26.5% | 16.3% |
| ΔT > 4 °C | 8.2% | 38.8% | 20.4% | 51.0% |
© 2019 by the authors. Licensee MDPI, Basel, Switzerland. This article is an open access article distributed under the terms and conditions of the Creative Commons Attribution (CC BY) license (http://creativecommons.org/licenses/by/4.0/).
Share and Cite
Jamil, H.; Alam, M.; Sanjayan, J. Thermal Performance of Hollow-Core Slab Ventilation System with Macro-Encapsulated Phase-Change Materials in Supply Air Duct. Buildings 2019, 9, 51. https://doi.org/10.3390/buildings9020051
Jamil H, Alam M, Sanjayan J. Thermal Performance of Hollow-Core Slab Ventilation System with Macro-Encapsulated Phase-Change Materials in Supply Air Duct. Buildings. 2019; 9(2):51. https://doi.org/10.3390/buildings9020051
Chicago/Turabian StyleJamil, Hasnat, Morshed Alam, and Jay Sanjayan. 2019. "Thermal Performance of Hollow-Core Slab Ventilation System with Macro-Encapsulated Phase-Change Materials in Supply Air Duct" Buildings 9, no. 2: 51. https://doi.org/10.3390/buildings9020051