1. Introduction
The use of reflective roofing has been recognized as an adaptive response to global warming [
1]. Reflective roof membranes, otherwise known as cool roofs [
2], account for greater than 50% of roof surfaces installed onto industrial and low-slope commercial buildings in the US each year [
3]. While cool roofs can raise the surface albedo of urban areas and have therefore been encouraged by states and cities as part of urban heat island mitigation and global warming reduction efforts (see, for example, Gaffin et al. [
4]), they have also been shown to lower air conditioning loads on buildings, thereby saving energy in both North American [
5,
6] and European studies [
7].
While cool-roofs might be accepted as a logical means of lowering energy costs in warm and sunny climates for those buildings with air conditioning, studies have examined the implications for cooler areas. For example, Hosseini and Akbari modeled the behavior of buildings in four cold-climate cities in North America: Anchorage, AK, Milwaukee, WI, Montreal, QC, and Toronto, ON [
8]. They predicted net annual energy cost savings for cool roof use for these four northern cities.
However, studies by Ibrahim suggested that dark roofs have the potential to lower heating costs in the winter [
9,
10]. Thus, there is a question as to whether a reduction of summer air conditioning costs through the reflection of energy exceeds the reduction of winter heating costs through the absorption of solar heat. This has been referred to as the winter heating penalty effect [
11]. Fenner et al. described the experience of a major US national retailer after instituting cool roof use [
12]. Energy cost savings associated with cool roofs were experienced across the entire national store portfolio. It was noted that even in northern climates, overall cooling costs exceeded heating costs in all of their retail outlets. In the few instances of dark roofs within the portfolio in northern areas, no reduction in required heating energy was noted when compared to similar buildings with cool roofs.
While the work of Ibrahim [
9,
10] and also Matter [
13] showed reflective roofing to raise overall energy costs, those studies assumed heating energy was supplied by electricity. According to the US Department of Energy (DOE), electricity is used to supply less than 20% of space heating energy demand for commercial buildings [
14]. Also, Ibrahim and Matter did not take into account electric demand charges which are an important part of the US electric tariff system [
15]. Taylor and Hartwig, using CoolCalc and CoolCalcPeak published by Oak Ridge National Laboratory (ORNL) (part of the US DOE), showed that net energy costs would be reduced throughout the US by using cool roofing [
3]. They assumed air conditioning (electric) and gas heat. Demand charges had the effect of increasing air conditioning costs, thereby making a stronger case for cool roofs.
In this study, the use of gas and electric heat are compared in order to determine if electric heat favors the use of non-reflective roofs. Different levels of electric demand charges were used in order to determine if the electric tariff structure could provide a basis for making roof membrane reflectivity decisions. Cities across the US were selected to compare the effects of a wide range of heating degree days (HDD) and cooling degree days (CDD). Also, three levels of roof reflectivity, representing white, tan, and gray roof membranes, were used in order to determine if an intermediary level of heat absorption offers an advantage depending on climate. It is assumed that no changes to building heating and cooling set points would be made, and that therefore there would be no changes to occupants’ comfort levels.
This study follows the methodology used in the previous work by Taylor and Hartwig [
3]. In the following sections, the modeling method is explained together with the energy cost and other assumptions. The results are analyzed for thirteen cities and overall net energy costs/savings shown for different levels of demand charge and roof membrane reflectivity. The conclusions point to the implications for roofing decisions in northern areas of the US. Also, recommendations for possible future studies are made.
2. Methods/Analysis Inputs
2.1. Locations
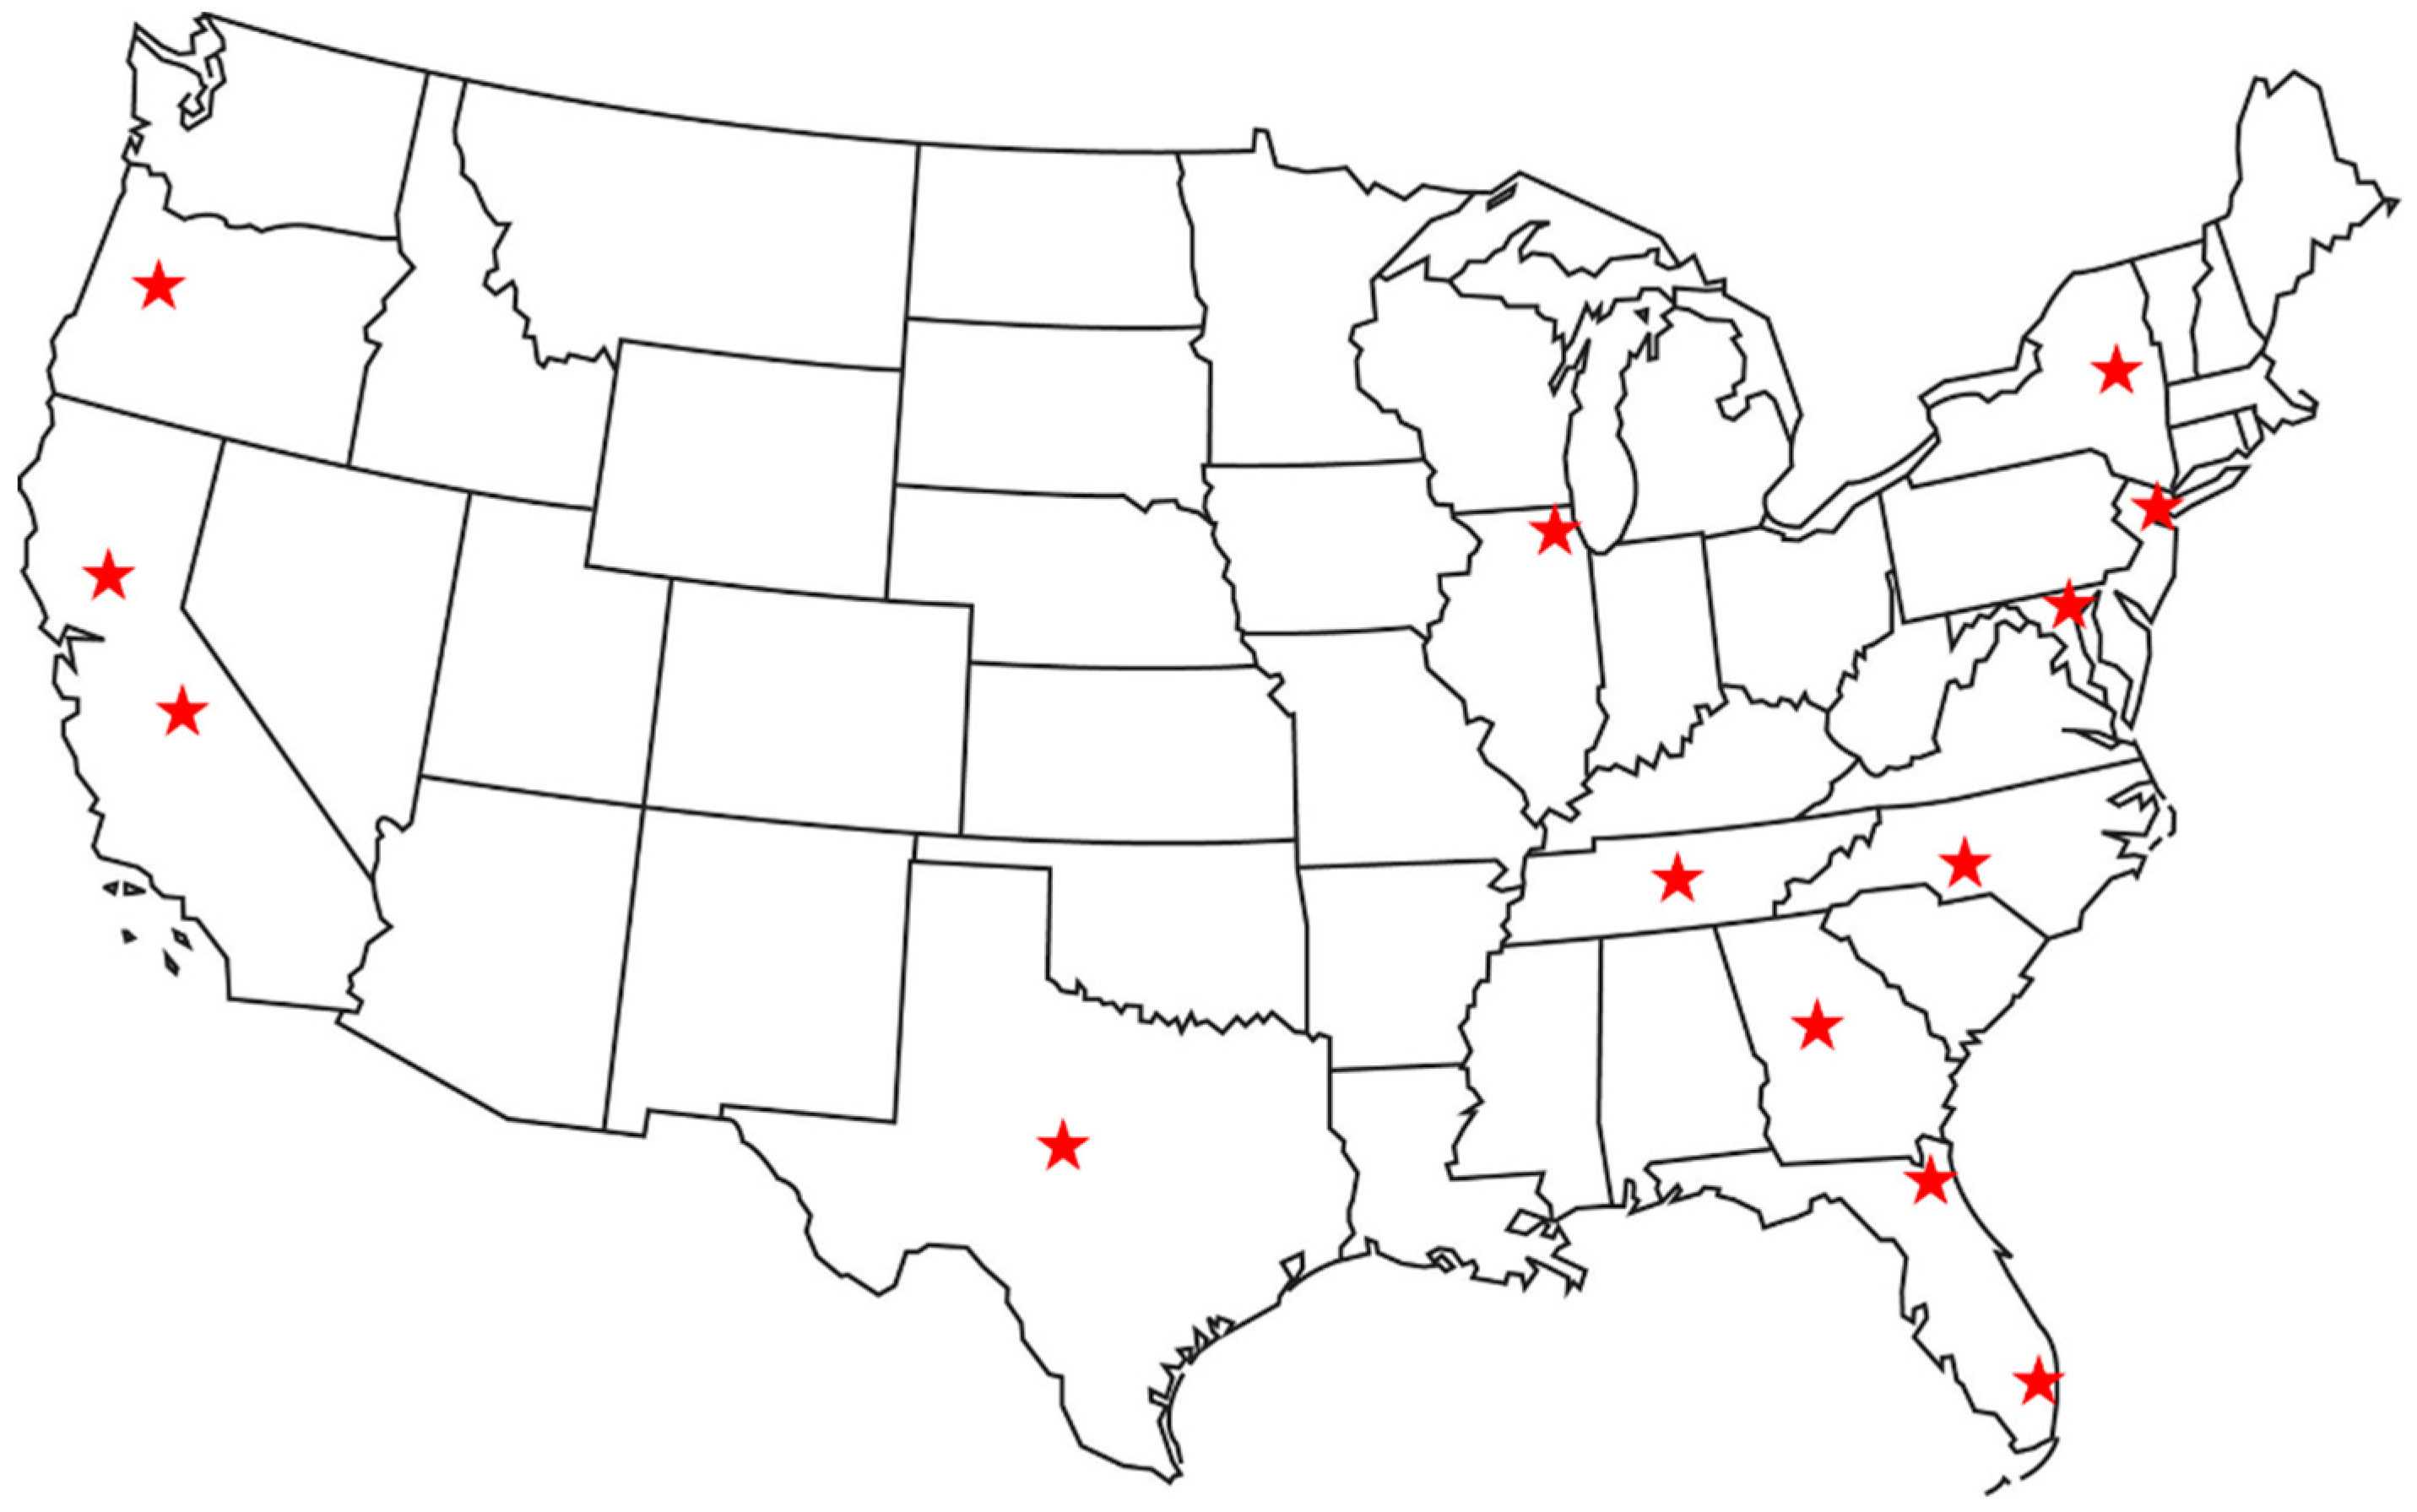
Thirteen US cities were selected as listed in
Appendix A. The general locations are indicated in
Figure 1. The cities were selected to be able to compare the results to the previous study [
3] and to allow for a range of north to south climate data in populous regions of the country.
2.2. Energy Cost Modeling
Energy costs were modeled for the thirteen US cities using the CoolCalcPeak calculator, published by DOE/ORNL [
16]. The tool was developed to provide estimated energy cost differences associated with a proposed membrane that has certain reflectivity and emissivity properties versus a highly absorptive membrane. The calculator incorporates climate data for 263 US cities and also allows for the evaluation of different insulation values. The background and development of the tool together with validation studies has been described elsewhere [
3].
The HDD and CDD used by CoolCalcPeak for the thirteen cities are shown in
Table A1. Also shown are the HDD and CDD values for 2017, obtained from an online weather database [
17]. Energy cost savings or increases obtained from CoolCalcPeak were scaled by the ratio between the HDD and CDD historical values used in the calculator and the 2017 values.
CoolCalcPeak makes no assumption as to building geometry. It only calculates energy loads on a building due to reflectance, emissivity, and insulation values, as well as local climate factors. Those energy loads might be a large percentage of the total for a wide, low building, or a small percentage for a tall, narrow building. The calculator is estimating energy loads due to the roof alone. Also, it assumes that the roof areas are unshaded, which potentially makes it less suitable for use when modeling building energy use for urban areas with tall buildings and high densities of land use. Therefore, for the results of this study will be more applicable to suburban areas or to those urban buildings that are not shaded.
2.3. Utility Costs
Yearly average electric costs were obtained from an online database for the latest year such data was available, 2017 [
18]. The values were those for commercial customers and were for each individual state thus capturing regional cost variations. Natural gas annual average costs were obtained by state, based on the annual average for commercial customers using 2017 US Energy Information Administration (EIA) data [
19]. All energy costs are shown in
Table A1.
Demand charges base a portion of a commercial customer’s electricity bill on their peak level of demand. They are typically based on the highest average electricity usage occurring within a defined time interval (usually 15 minutes) during a billing period. Unlike electricity consumption charges, which account for the volume (kilowatt hours, kWh) of electricity consumed throughout a billing period, demand charges track the highest rate (kilowatt, kW) of electricity consumption during the billing period. As shown in a survey of utilities carried out by the National Renewable Energy Laboratory (NREL), demand charge rates vary considerably across utilities, locations, building sizes, and building types [
20]. Demand charges often represent from 30%–70% of a commercial electric bill because of air conditioning use. Due to their variation, energy costs were analyzed for demand charges of USD 0, USD 5, USD 15, and USD 25 per kW. These were assumed to apply year round.
2.4. Roof System
The CoolCalcPeak calculator compares energy costs relative to a nominally non-reflective, absorptive roof membrane, comparable to a single ply cured ethylene propylene diene monomer, EPDM, membrane. The Cool Roof Rating Council reports independently tested unaged and three year exposed solar reflectance and emissivity values for commercially available roof membranes and coatings [
21]. The three year data represents typical long term roof performance and was used here. Three generic thermoplastic polyolefin, TPO, membranes, were evaluated with the solar reflectance and emissivity values shown in
Table 1.
An insulation thermal resistance of R-30 (RSI 5.283) was used because this value is representative for most US locations per the 2015 International Energy Conservation Code [
22]. Therefore, results and conclusions of this study would be applicable to new construction and reroofing of existing buildings.
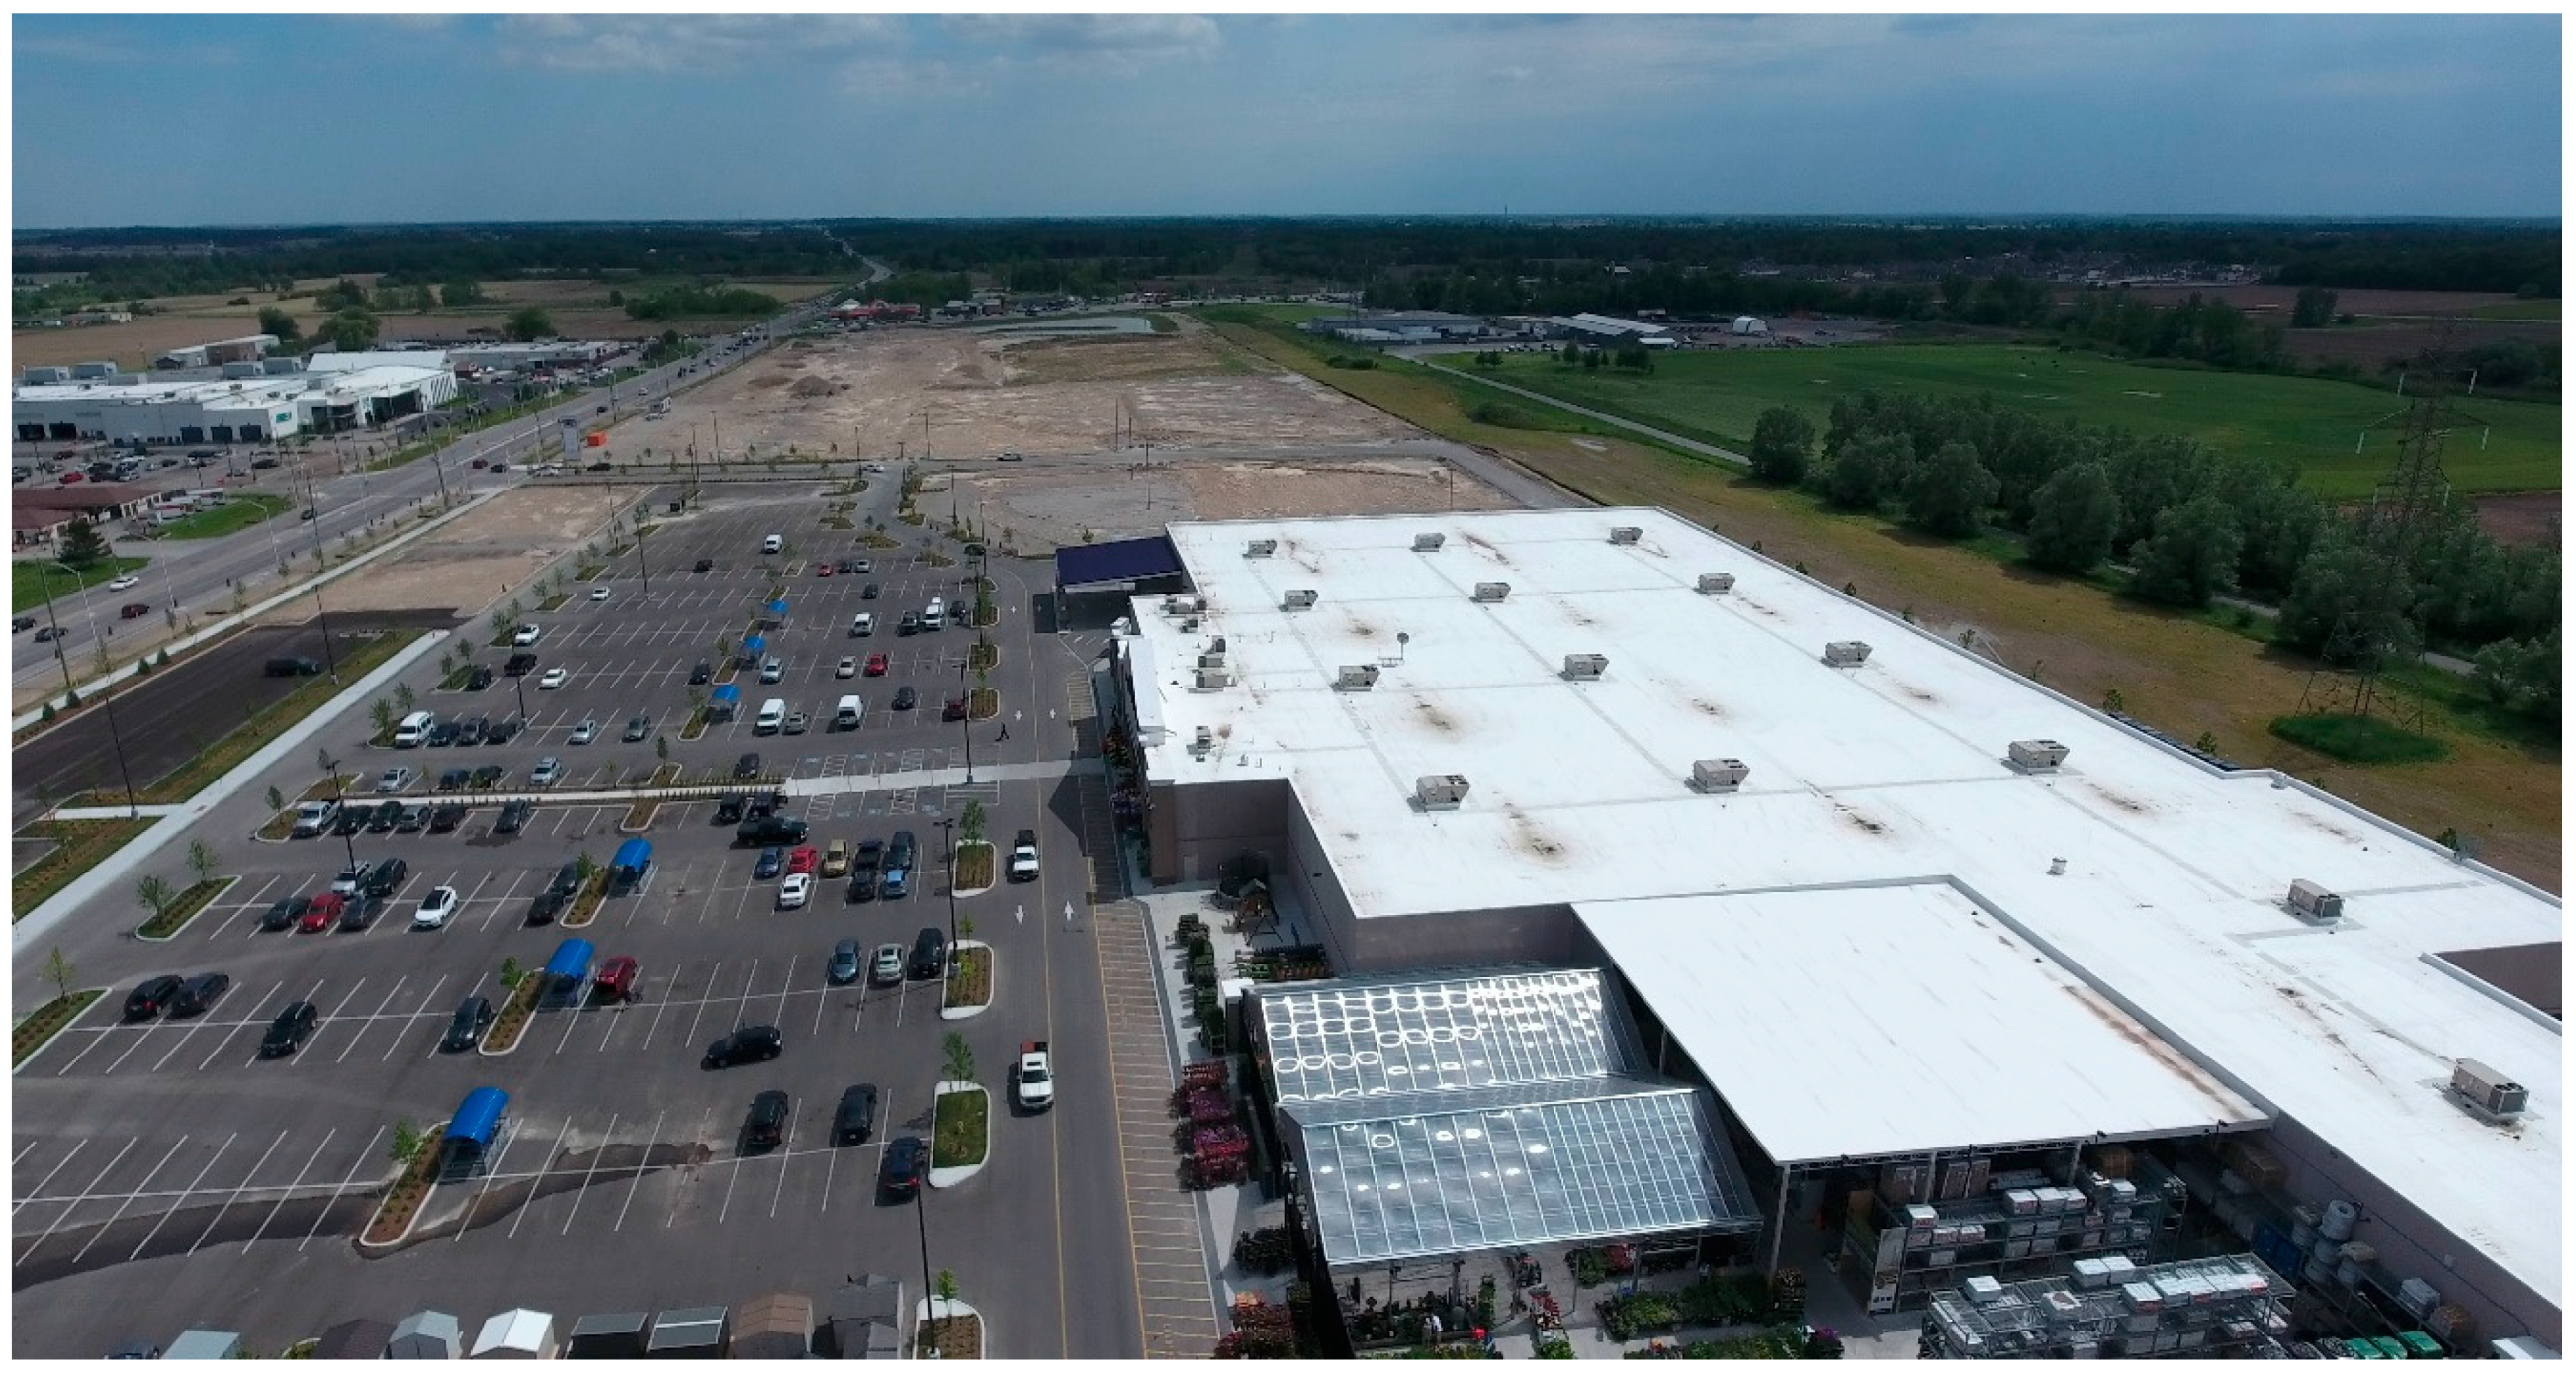
Buildings can vary greatly in terms of height, area, and geometry (width versus depth). So called “big box” retail construction in the US is single story in nature and covers a range of floor areas. For example, Walmart stores range between 30,000 and 219,000 square feet and Costco stores between 73,000 and 205,000 square feet [
23]. This study used an average big box roof area of 125,000 ft
2 (11,613 m
2) [
24], which is consistent with the previous work [
3]. An example of a big box retail store, with a reflective roofing membrane, is shown in
Figure 2.
2.5. Heating and Cooling System Efficiencies
CoolCalcPeak asks the user to select between low, medium, and high efficiency settings for the heating, ventilation, and air conditioning equipment (HVAC), these being described in [
25]. Building air conditioning efficiency is defined by a coefficient of performance (COP) which is the ratio of the amount of cooling provided by a cooling unit to the energy consumed by the system. The COP was set at 2.5, i.e., high efficiency, for all cases modeled here. Heating efficiency is defined as the ratio of the energy released into the building compared to the energy available in the fuel and ranges between 0, i.e., no heat is released, to 1.0 meaning that all of the fuel’s energy is released into the building. The natural gas heating efficiency was set at 0.8 (i.e., at high efficiency). These high efficiency values are representative of newer equipment and would make any projected energy savings conservative when considering older buildings with less insulation and less efficient HVAC equipment.
3. Results
Changes in a roof’s energy efficiency were calculated in USD for the annual net energy cost.
Table A2,
Table A3, and
Table A4 show the annual savings when converting from an absorptive roof membrane to a high, mid, or lower reflectance roof membrane, respectively. The savings are shown for USD 0, USD 5, USD 15, and USD 25 demand charges.
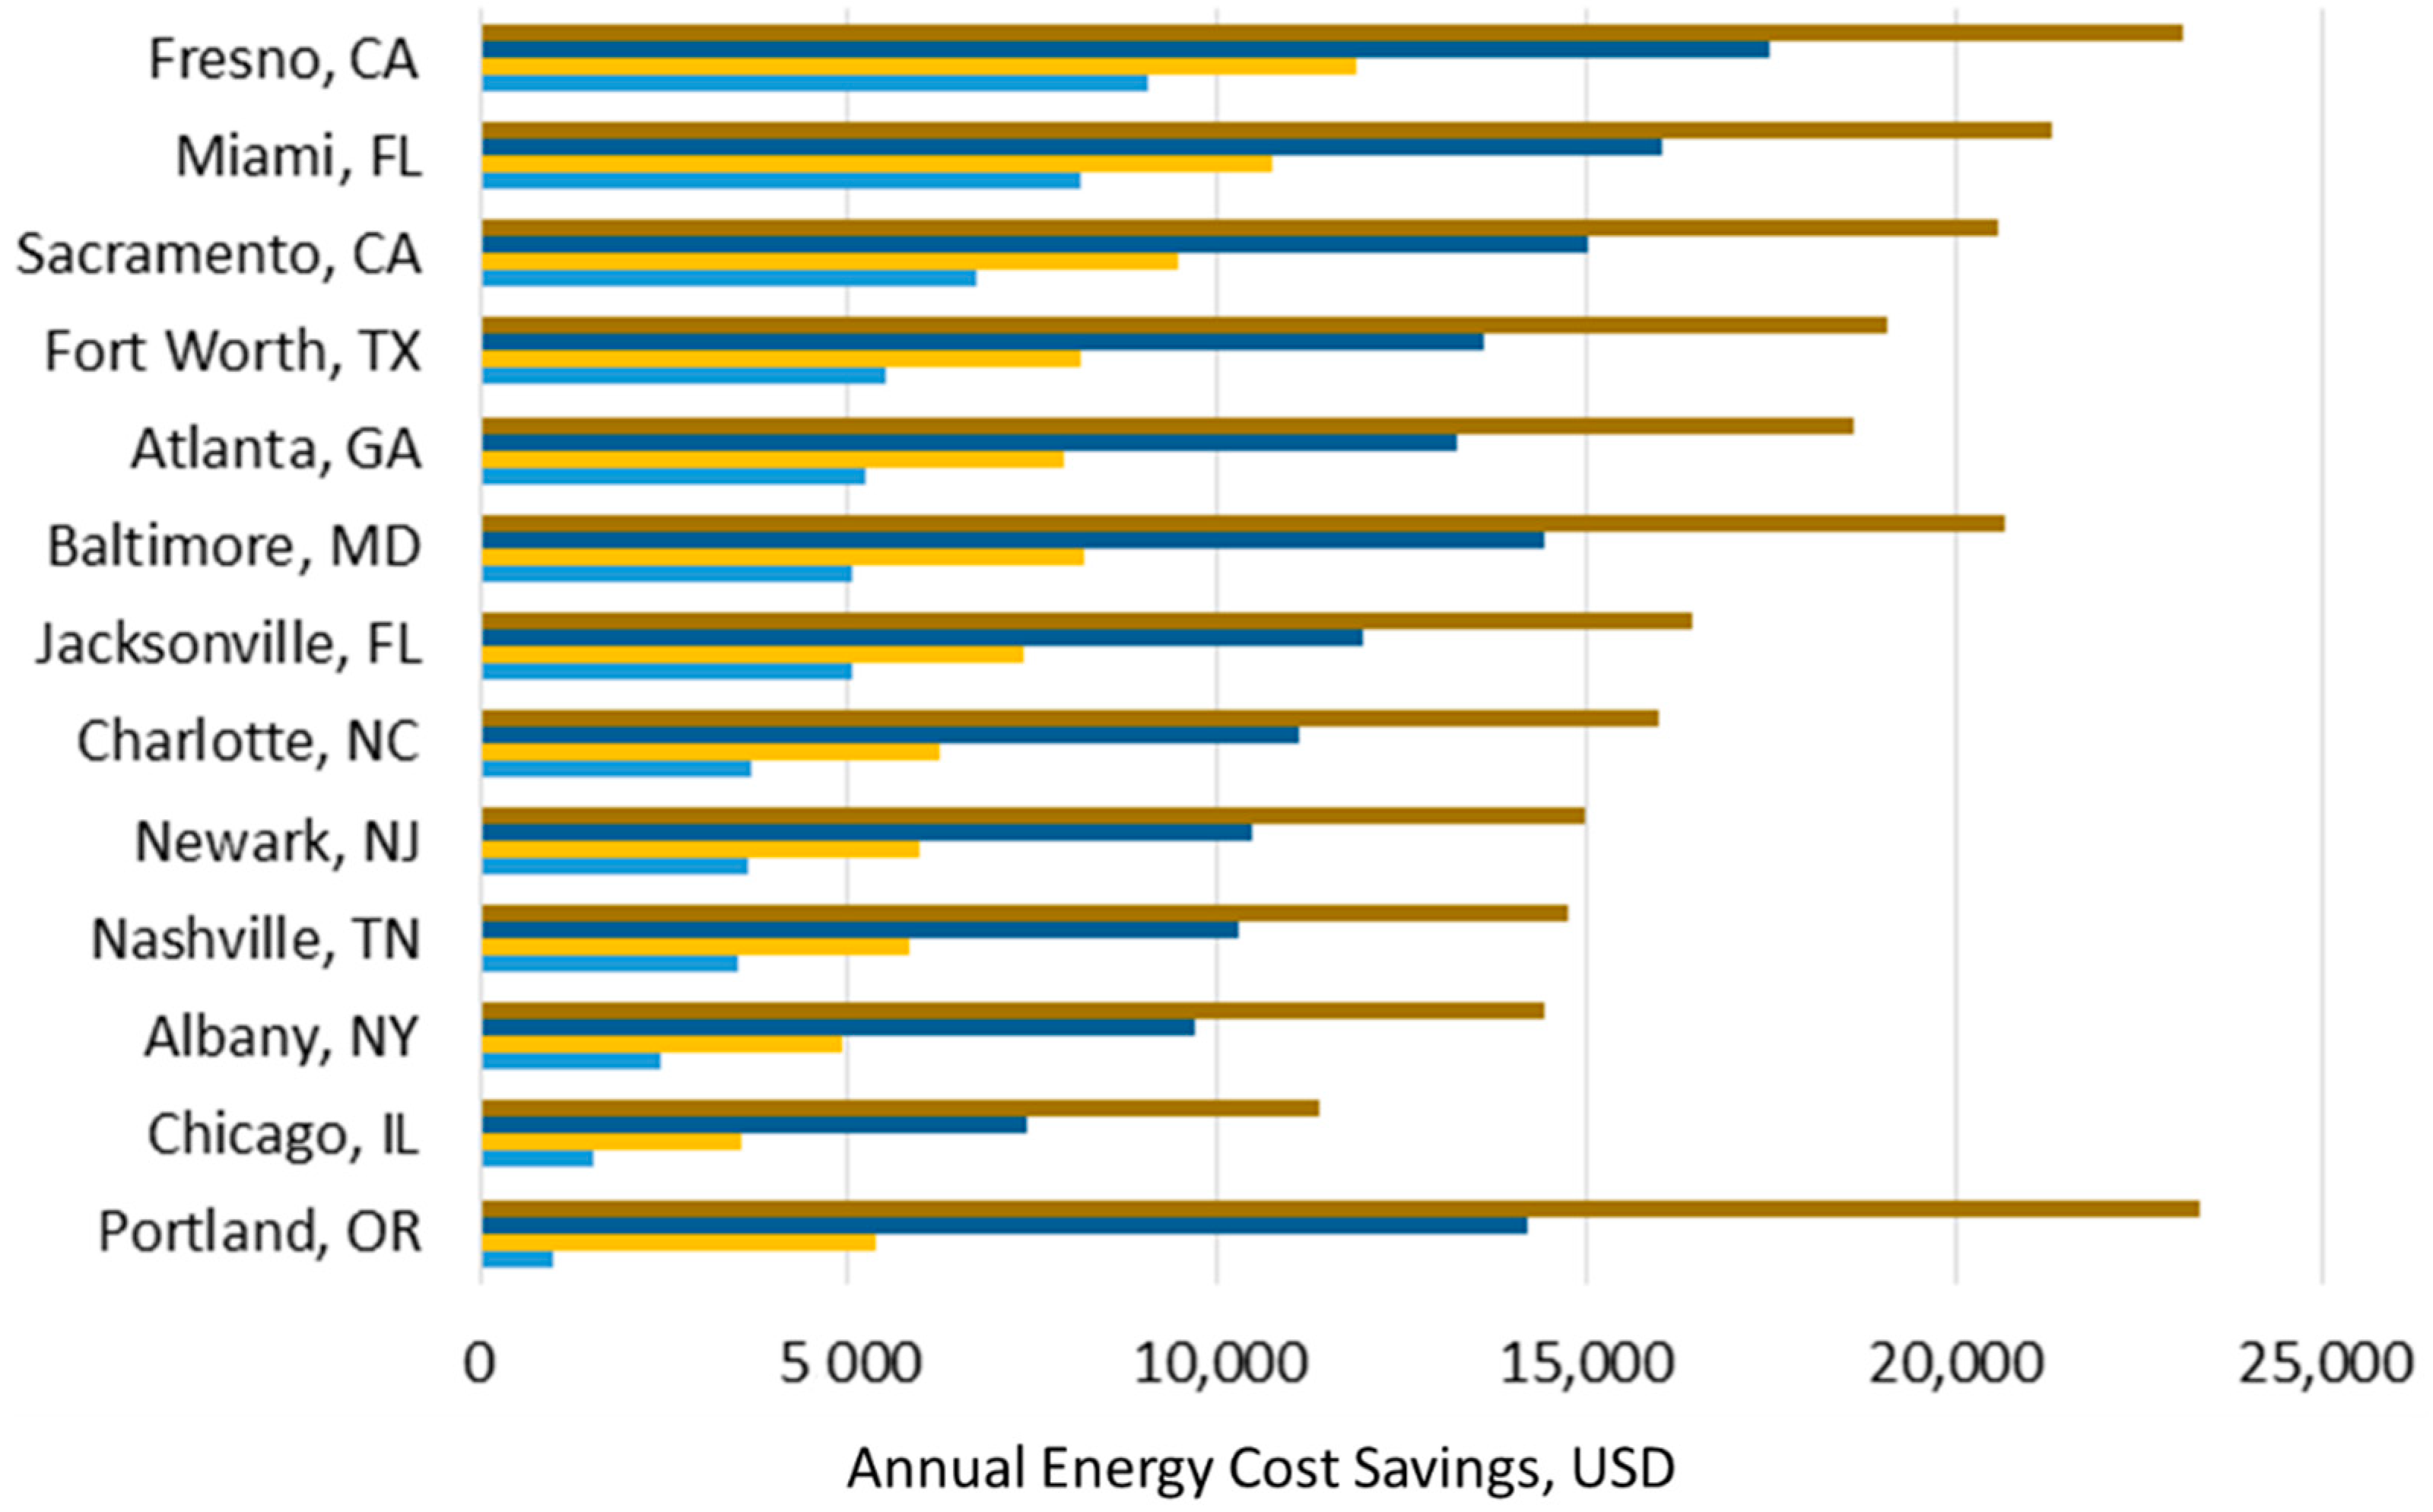
3.1. Gas Heat
As has been found in the author’s previous study of 18 US cities [
3], the use of a high reflectance membrane resulted in net energy savings for all locations studied when gas heat was used during winter months. This is shown in
Figure 3, for each of the four demand charges evaluated.
Examination of
Figure 3 suggests that northern cities that require highly reflective roof membranes as part of urban heat island reduction and global warming mitigation initiatives are not penalizing building owners who use gas heat with higher net energy costs. This is in agreement with this author’s prior study [
3]. The mid and lower reflectance membranes resulted in lower savings but in no case was a cost penalty incurred. This is logical, given that the comparison is to an absorptive membrane such as EPDM.
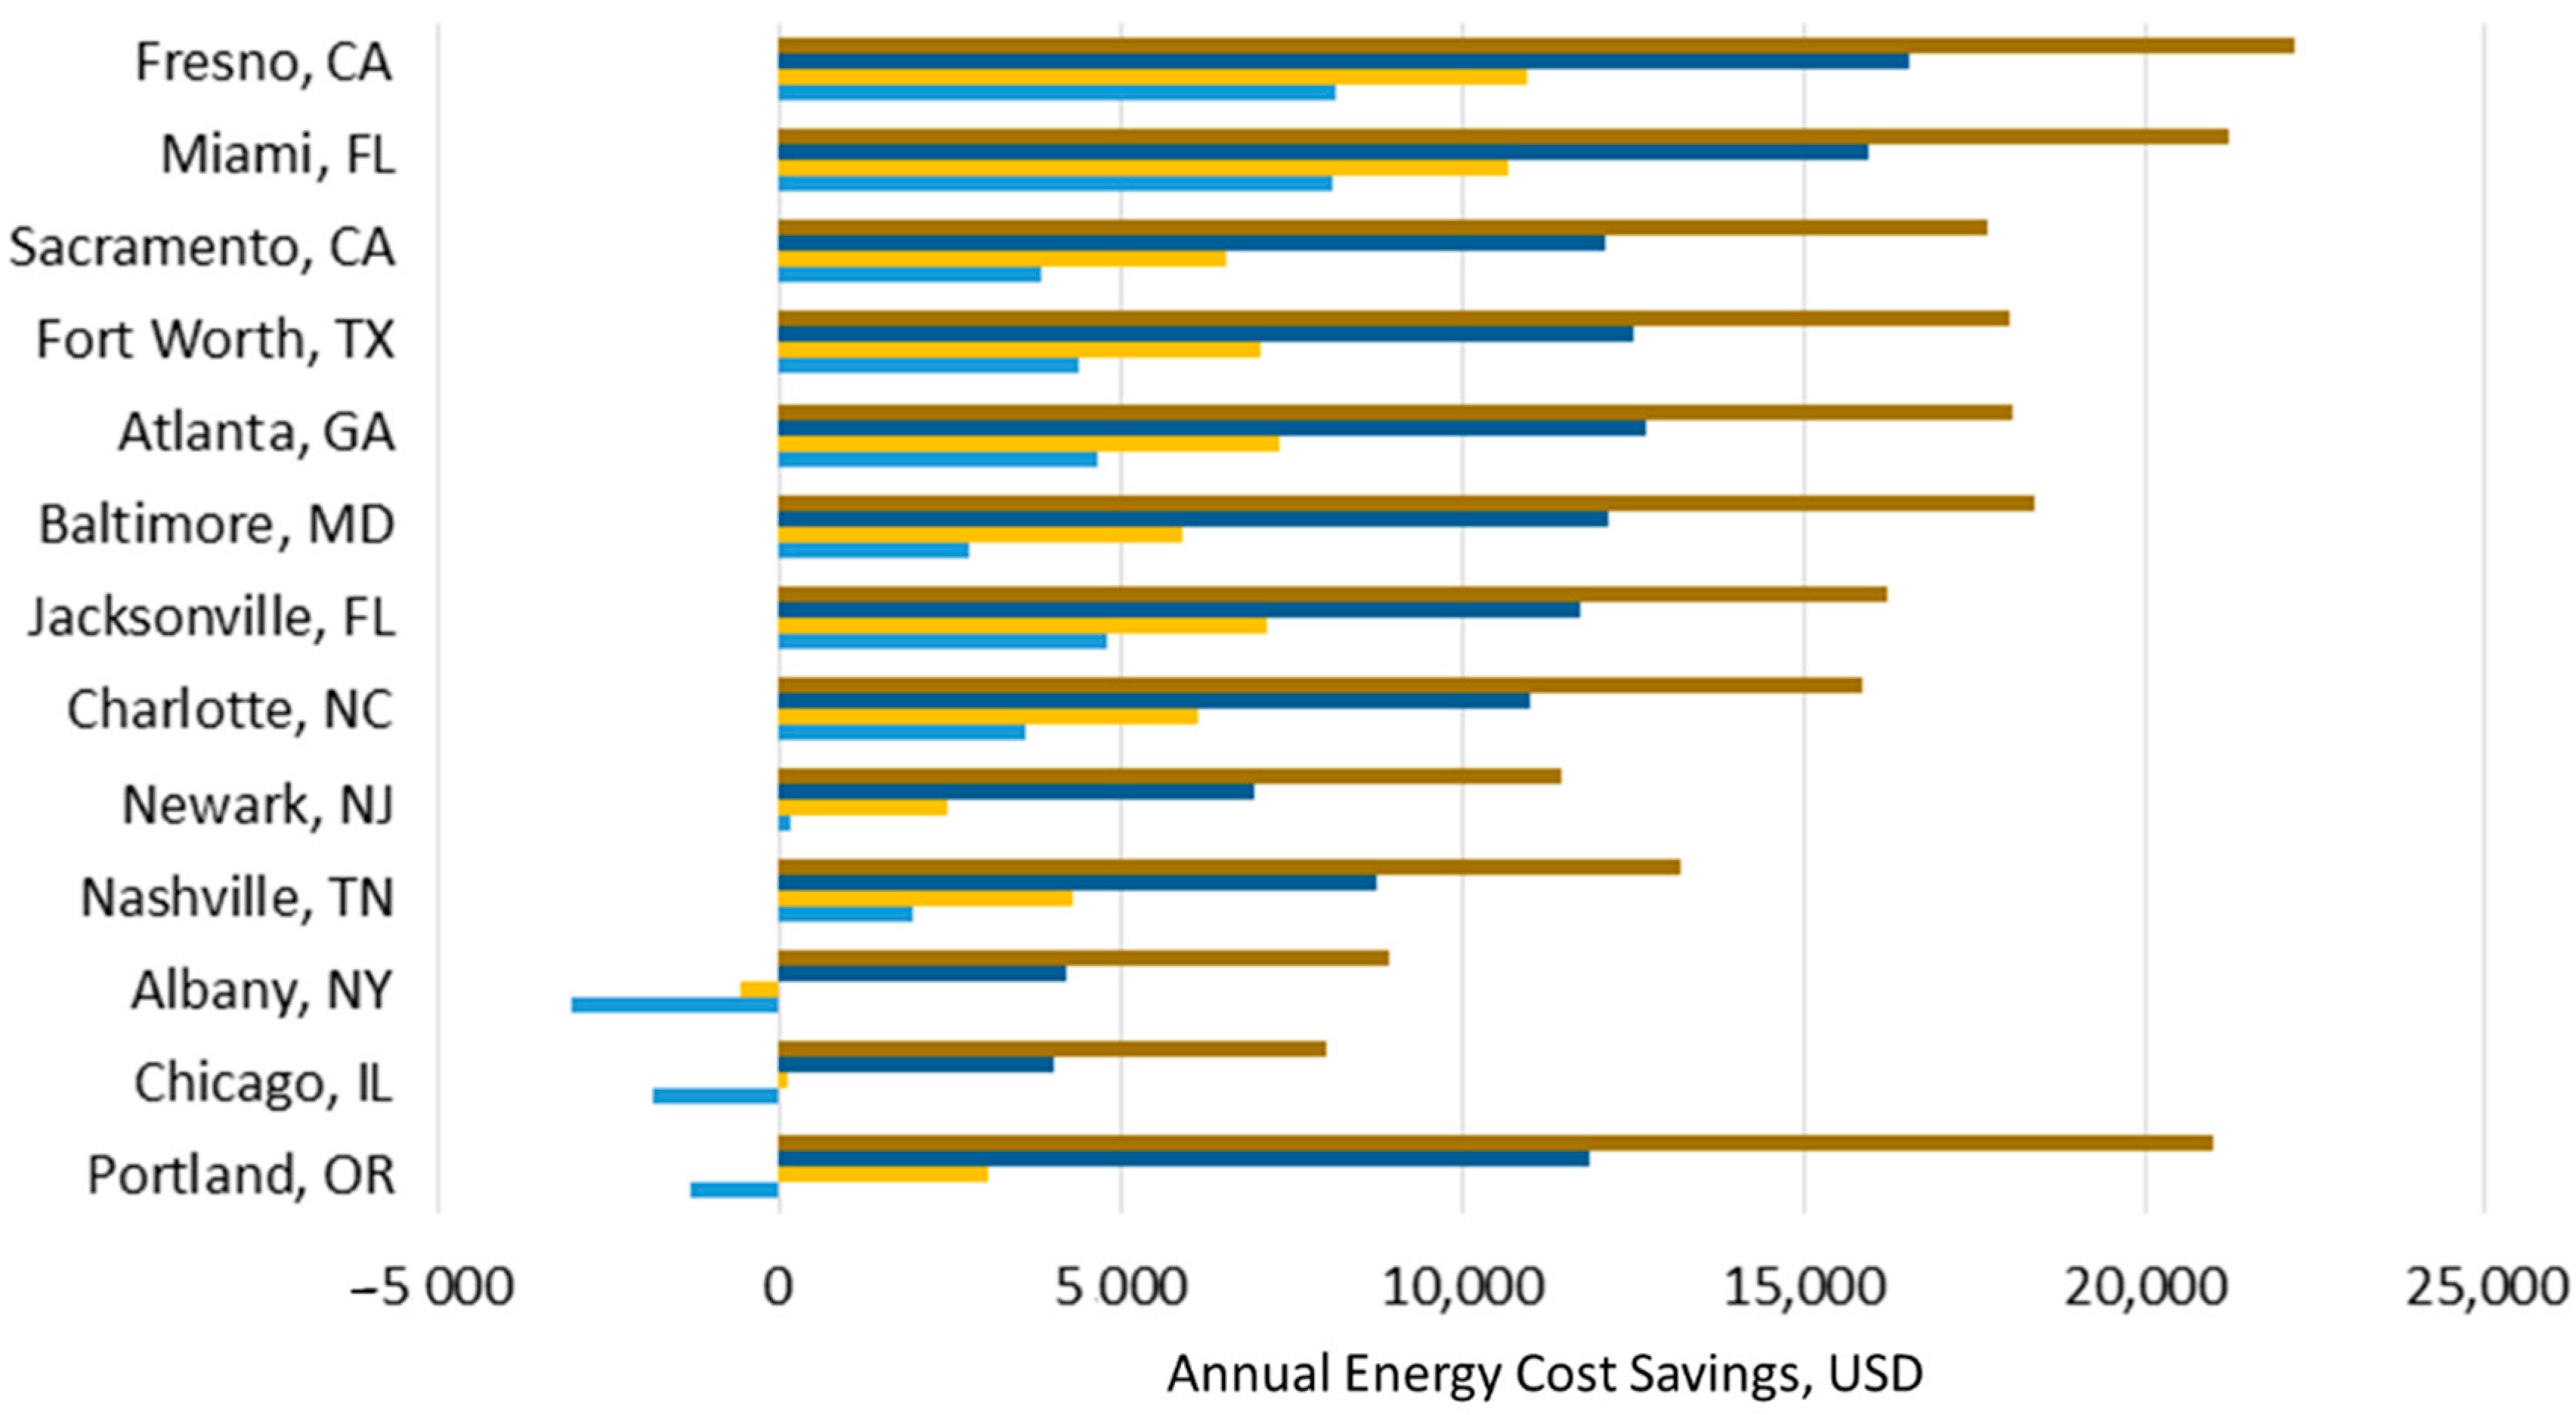
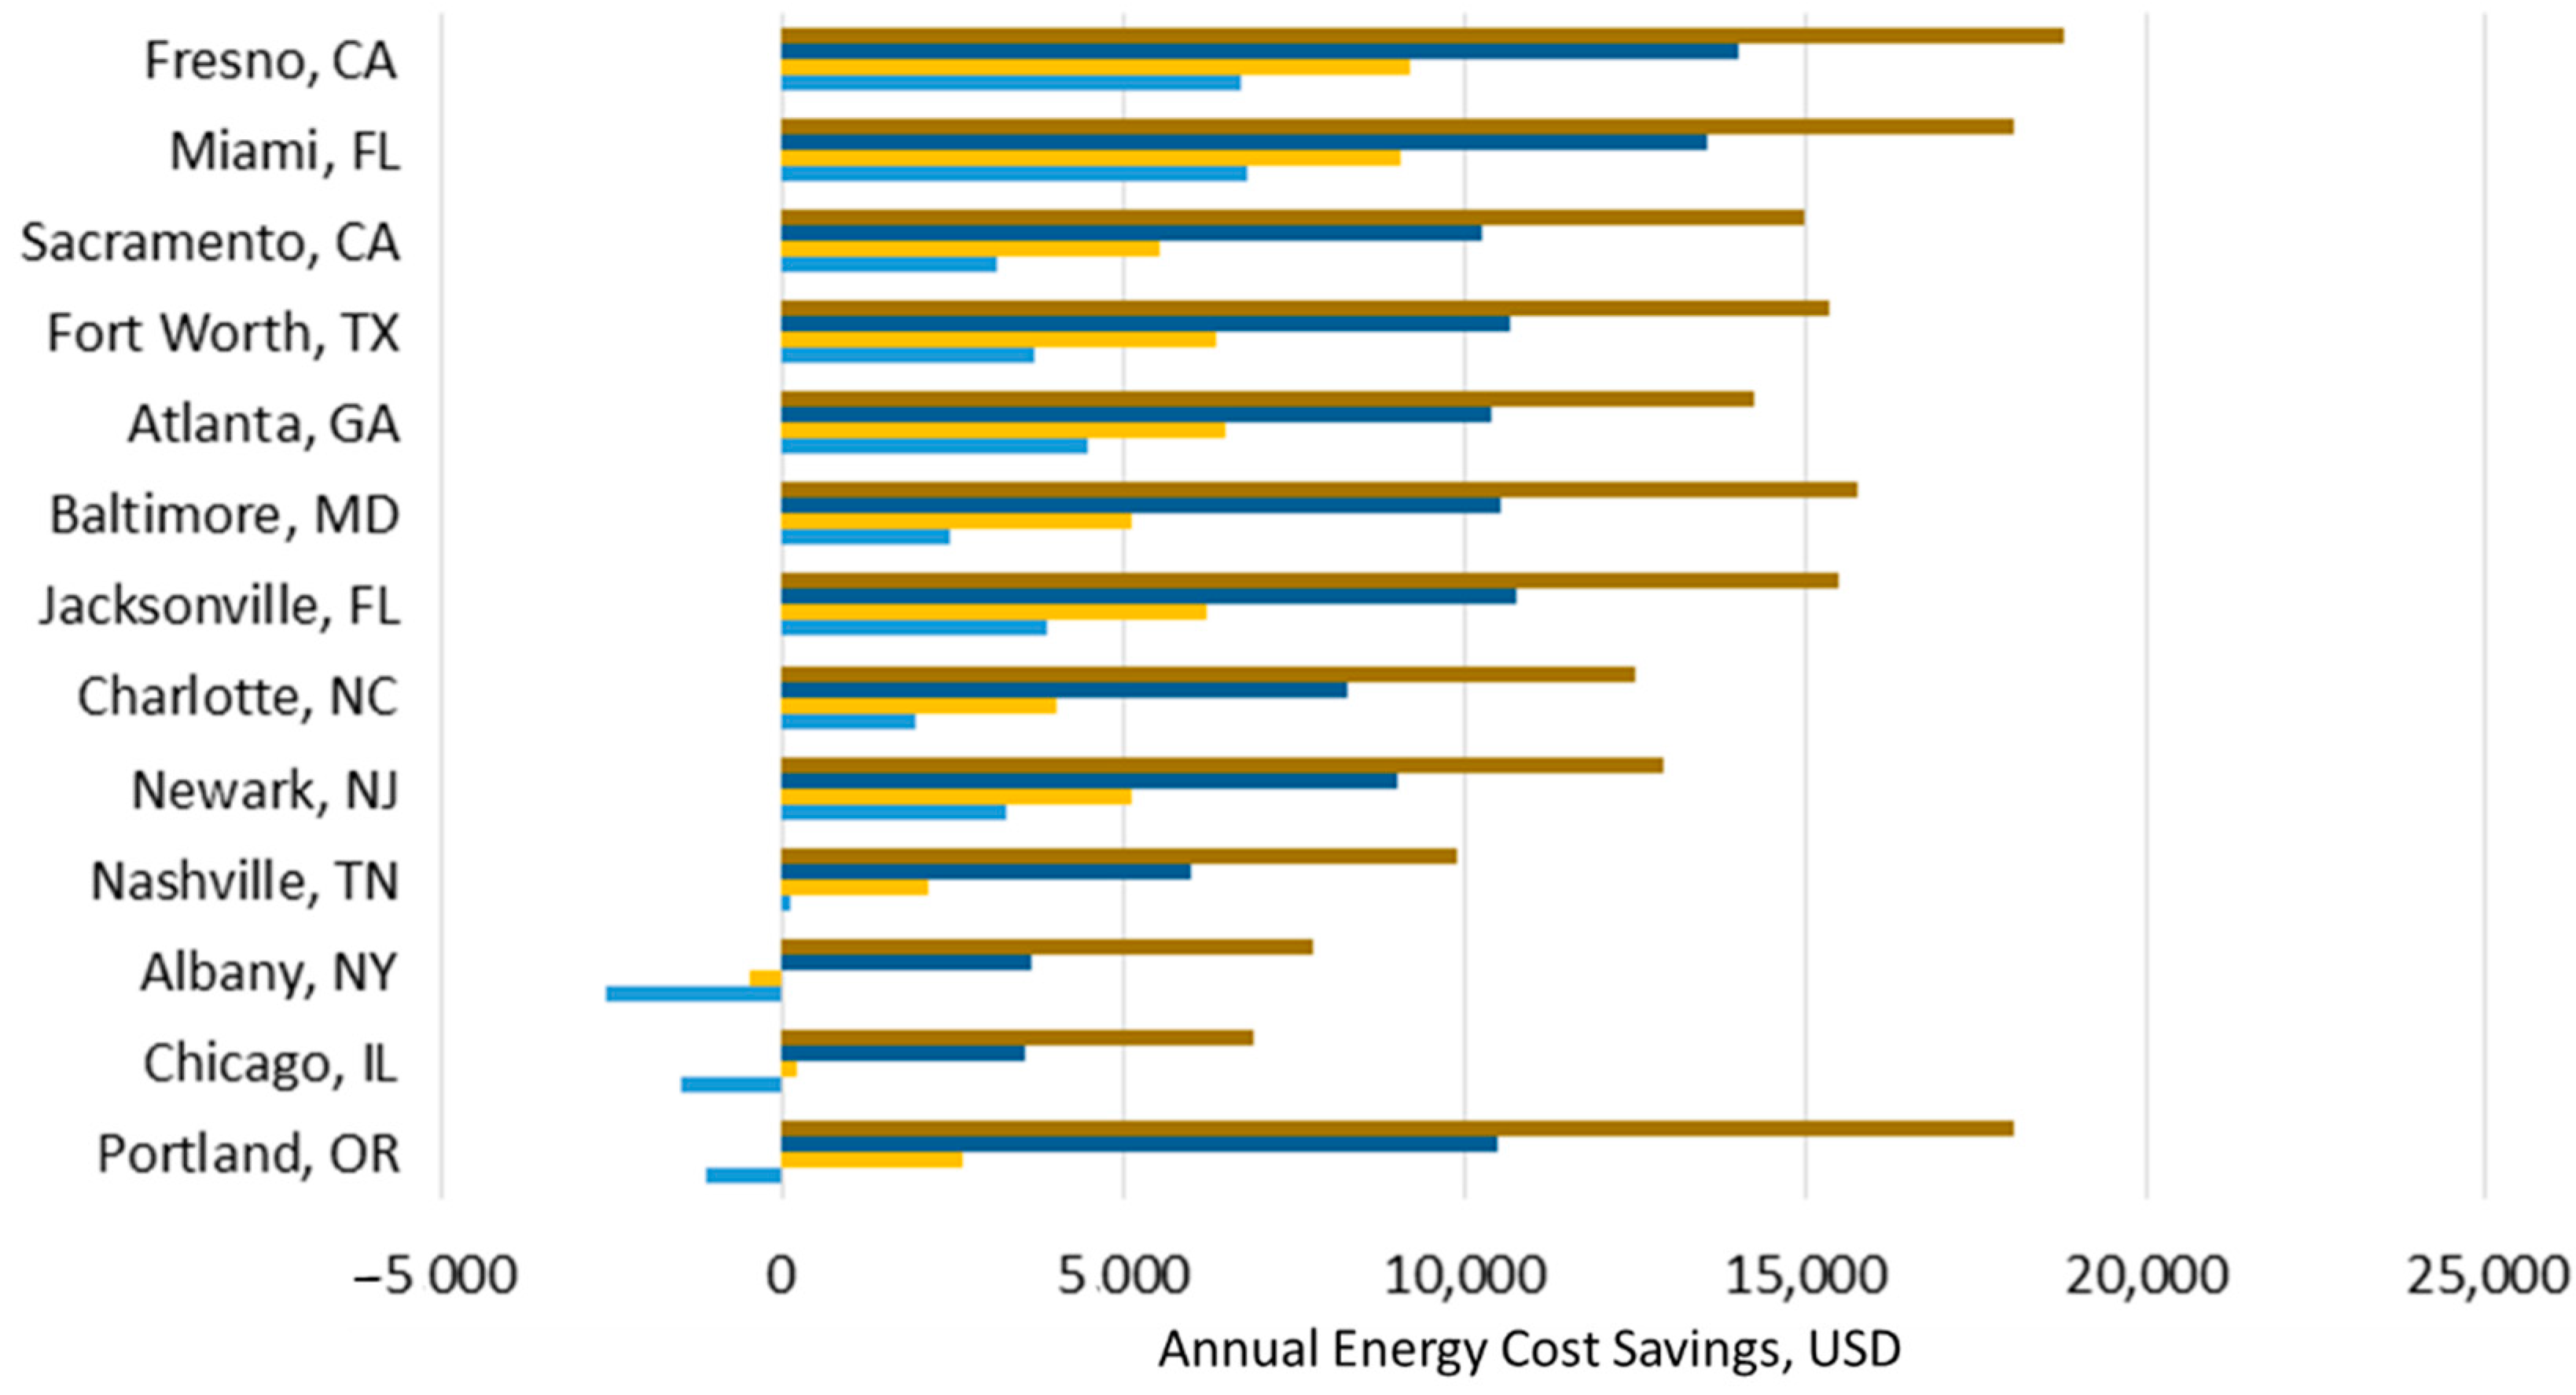
3.2. Electric Heat with High Reflectance Membrane
In the case of electric heat with the high reflectance membrane, savings were lower than when using gas heat for the locations studied with higher heating requirements (i.e., significant HDD). This confirms that there is a winter heating penalty. Nevertheless, all but three of the cities studied had net energy savings when no demand charges were applied. This is shown graphically in
Figure 4.
The other three cities only had savings when demand charges were present. Two of those cities, Albany, NY and Chicago, IL, had the highest HDD of 7083 and 6449.5, respectively. The third city, Portland, OR, had 4461 HDD but only 278.5 CDD, meaning that heating costs dominated.
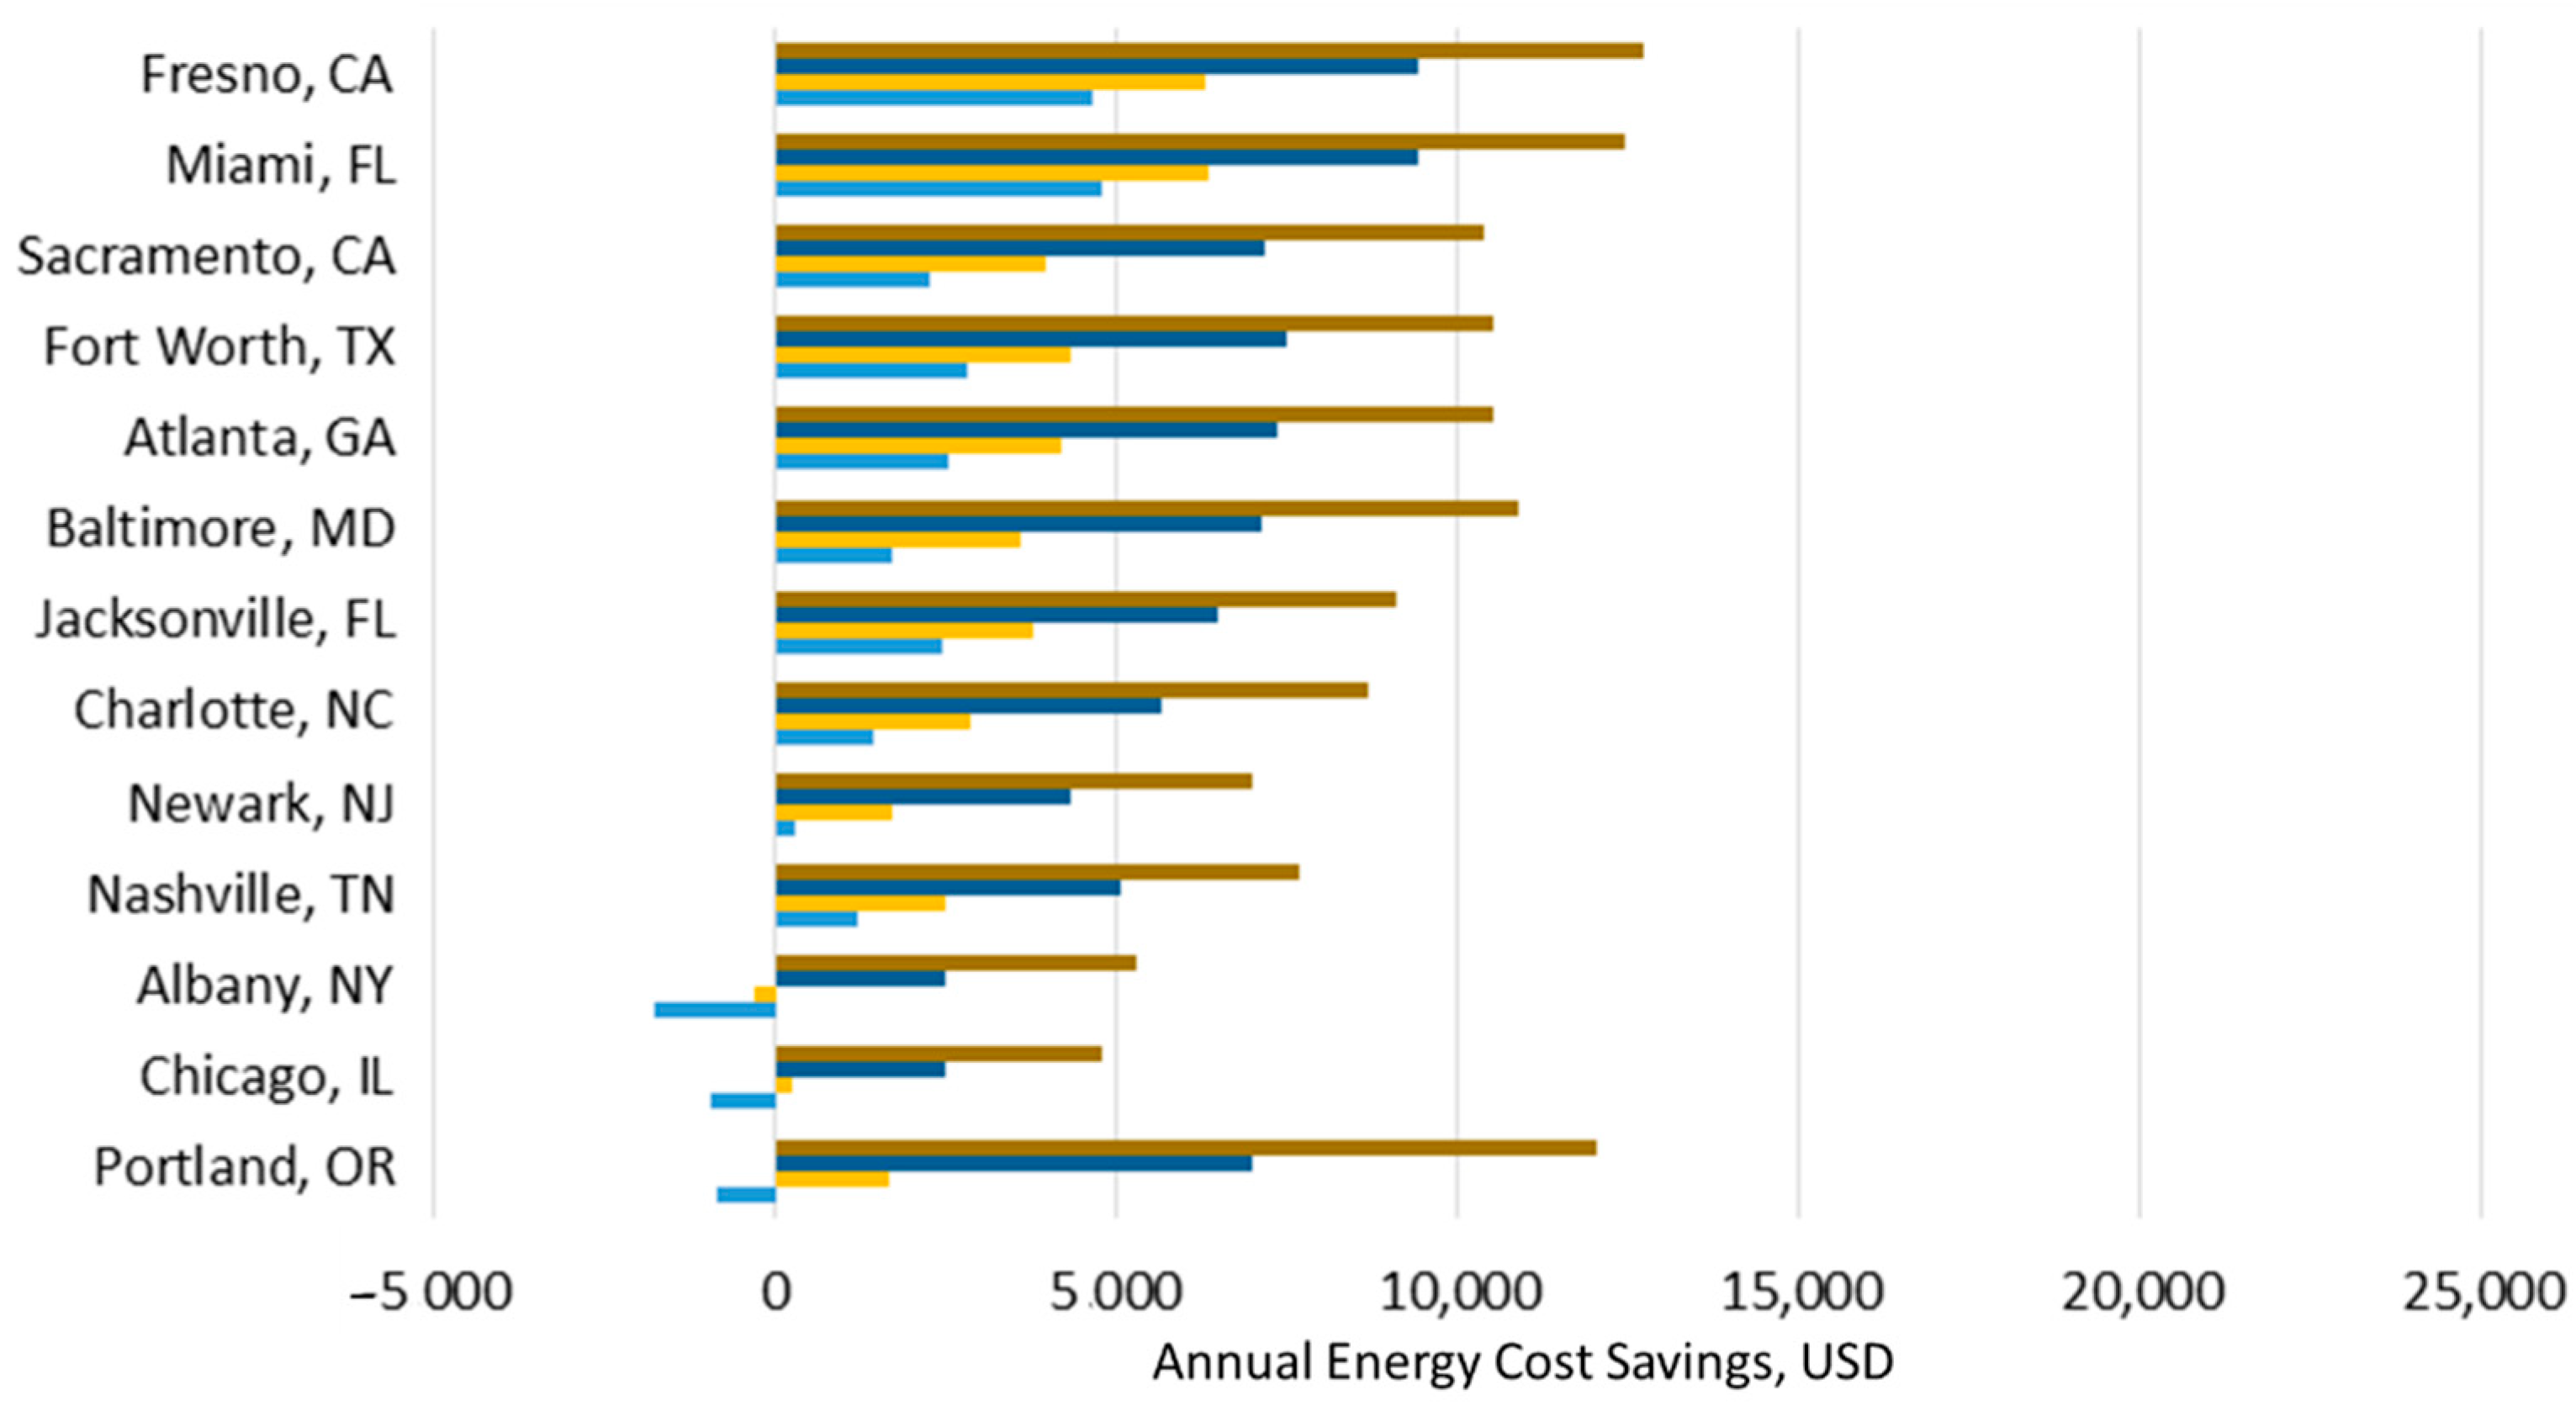
3.3. Electric Heat with Mid and Lower Reflectance Membranes
For the case of electric heat with mid and lower reflectance membranes, the net energy savings are shown in
Figure 5 and
Figure 6 respectively.
The results for the mid and lower reflectance membranes show reduced energy efficiency savings for all cities, but have not changed the overall outcome, i.e., that savings do occur. The results again show that the three cities, Albany, NY, Chicago, IL, and Portland OR, only have savings when demand charges are present.
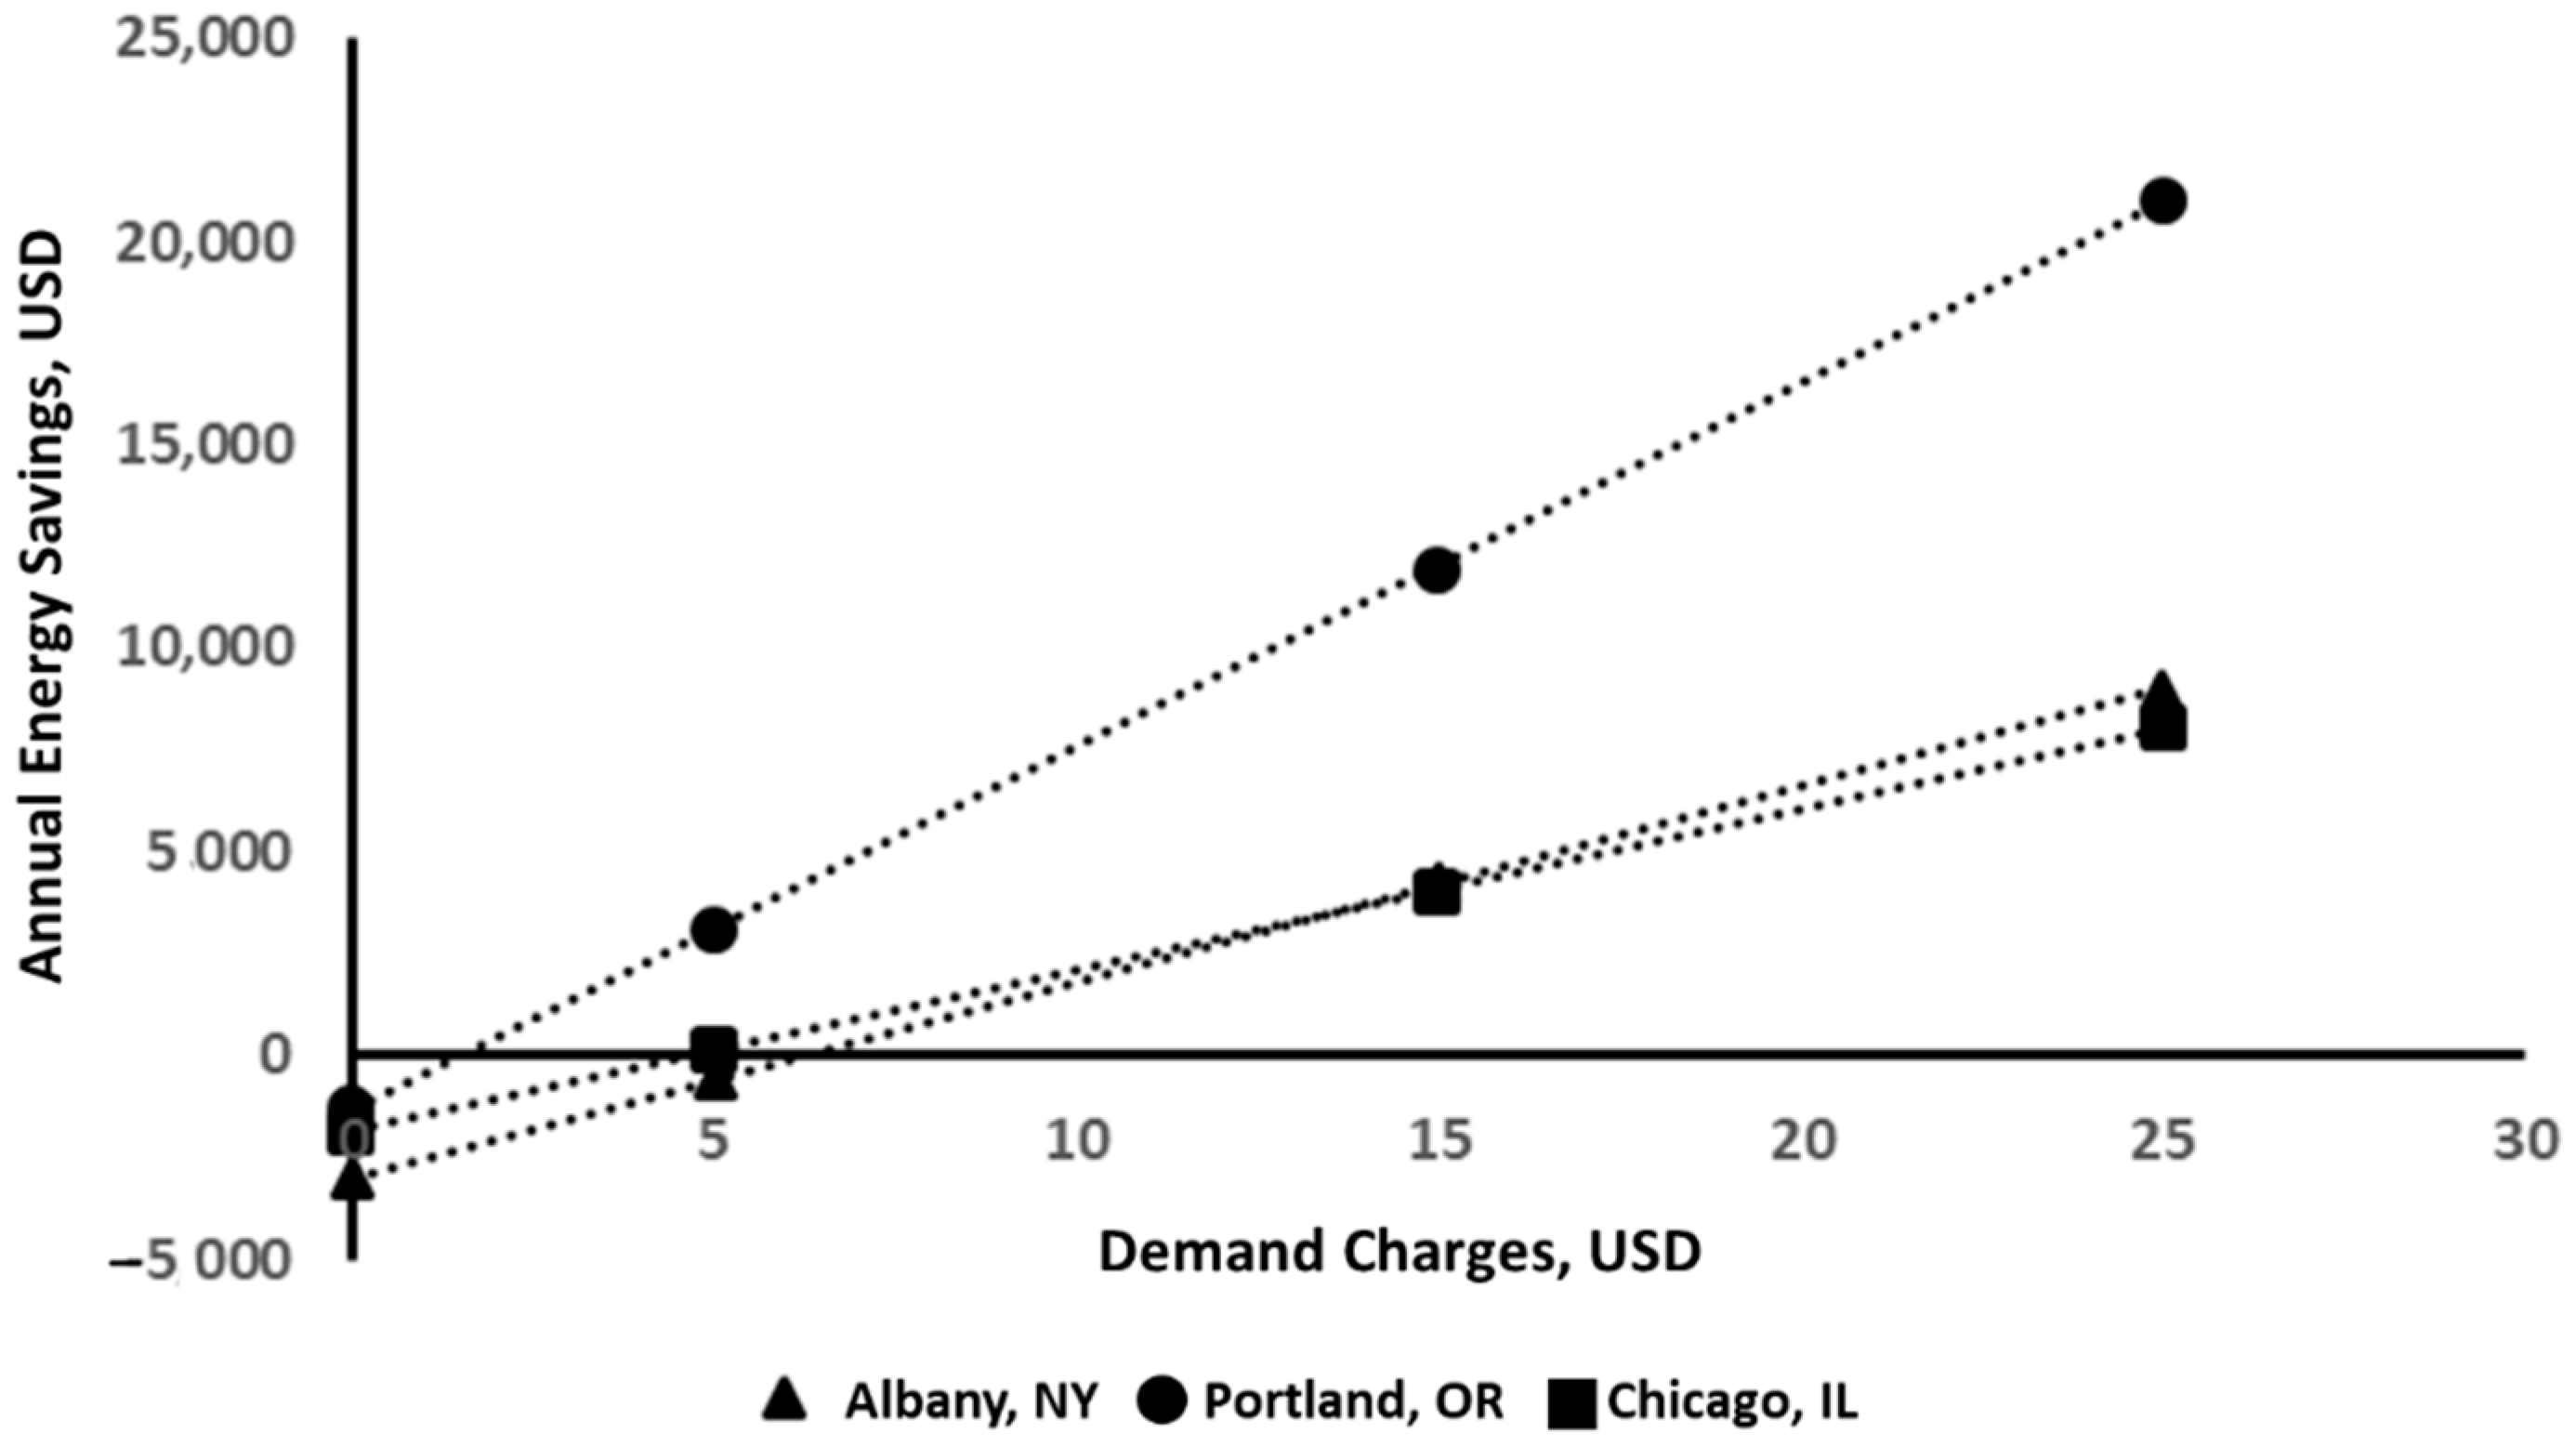
3.4. Effect of Demand Charges
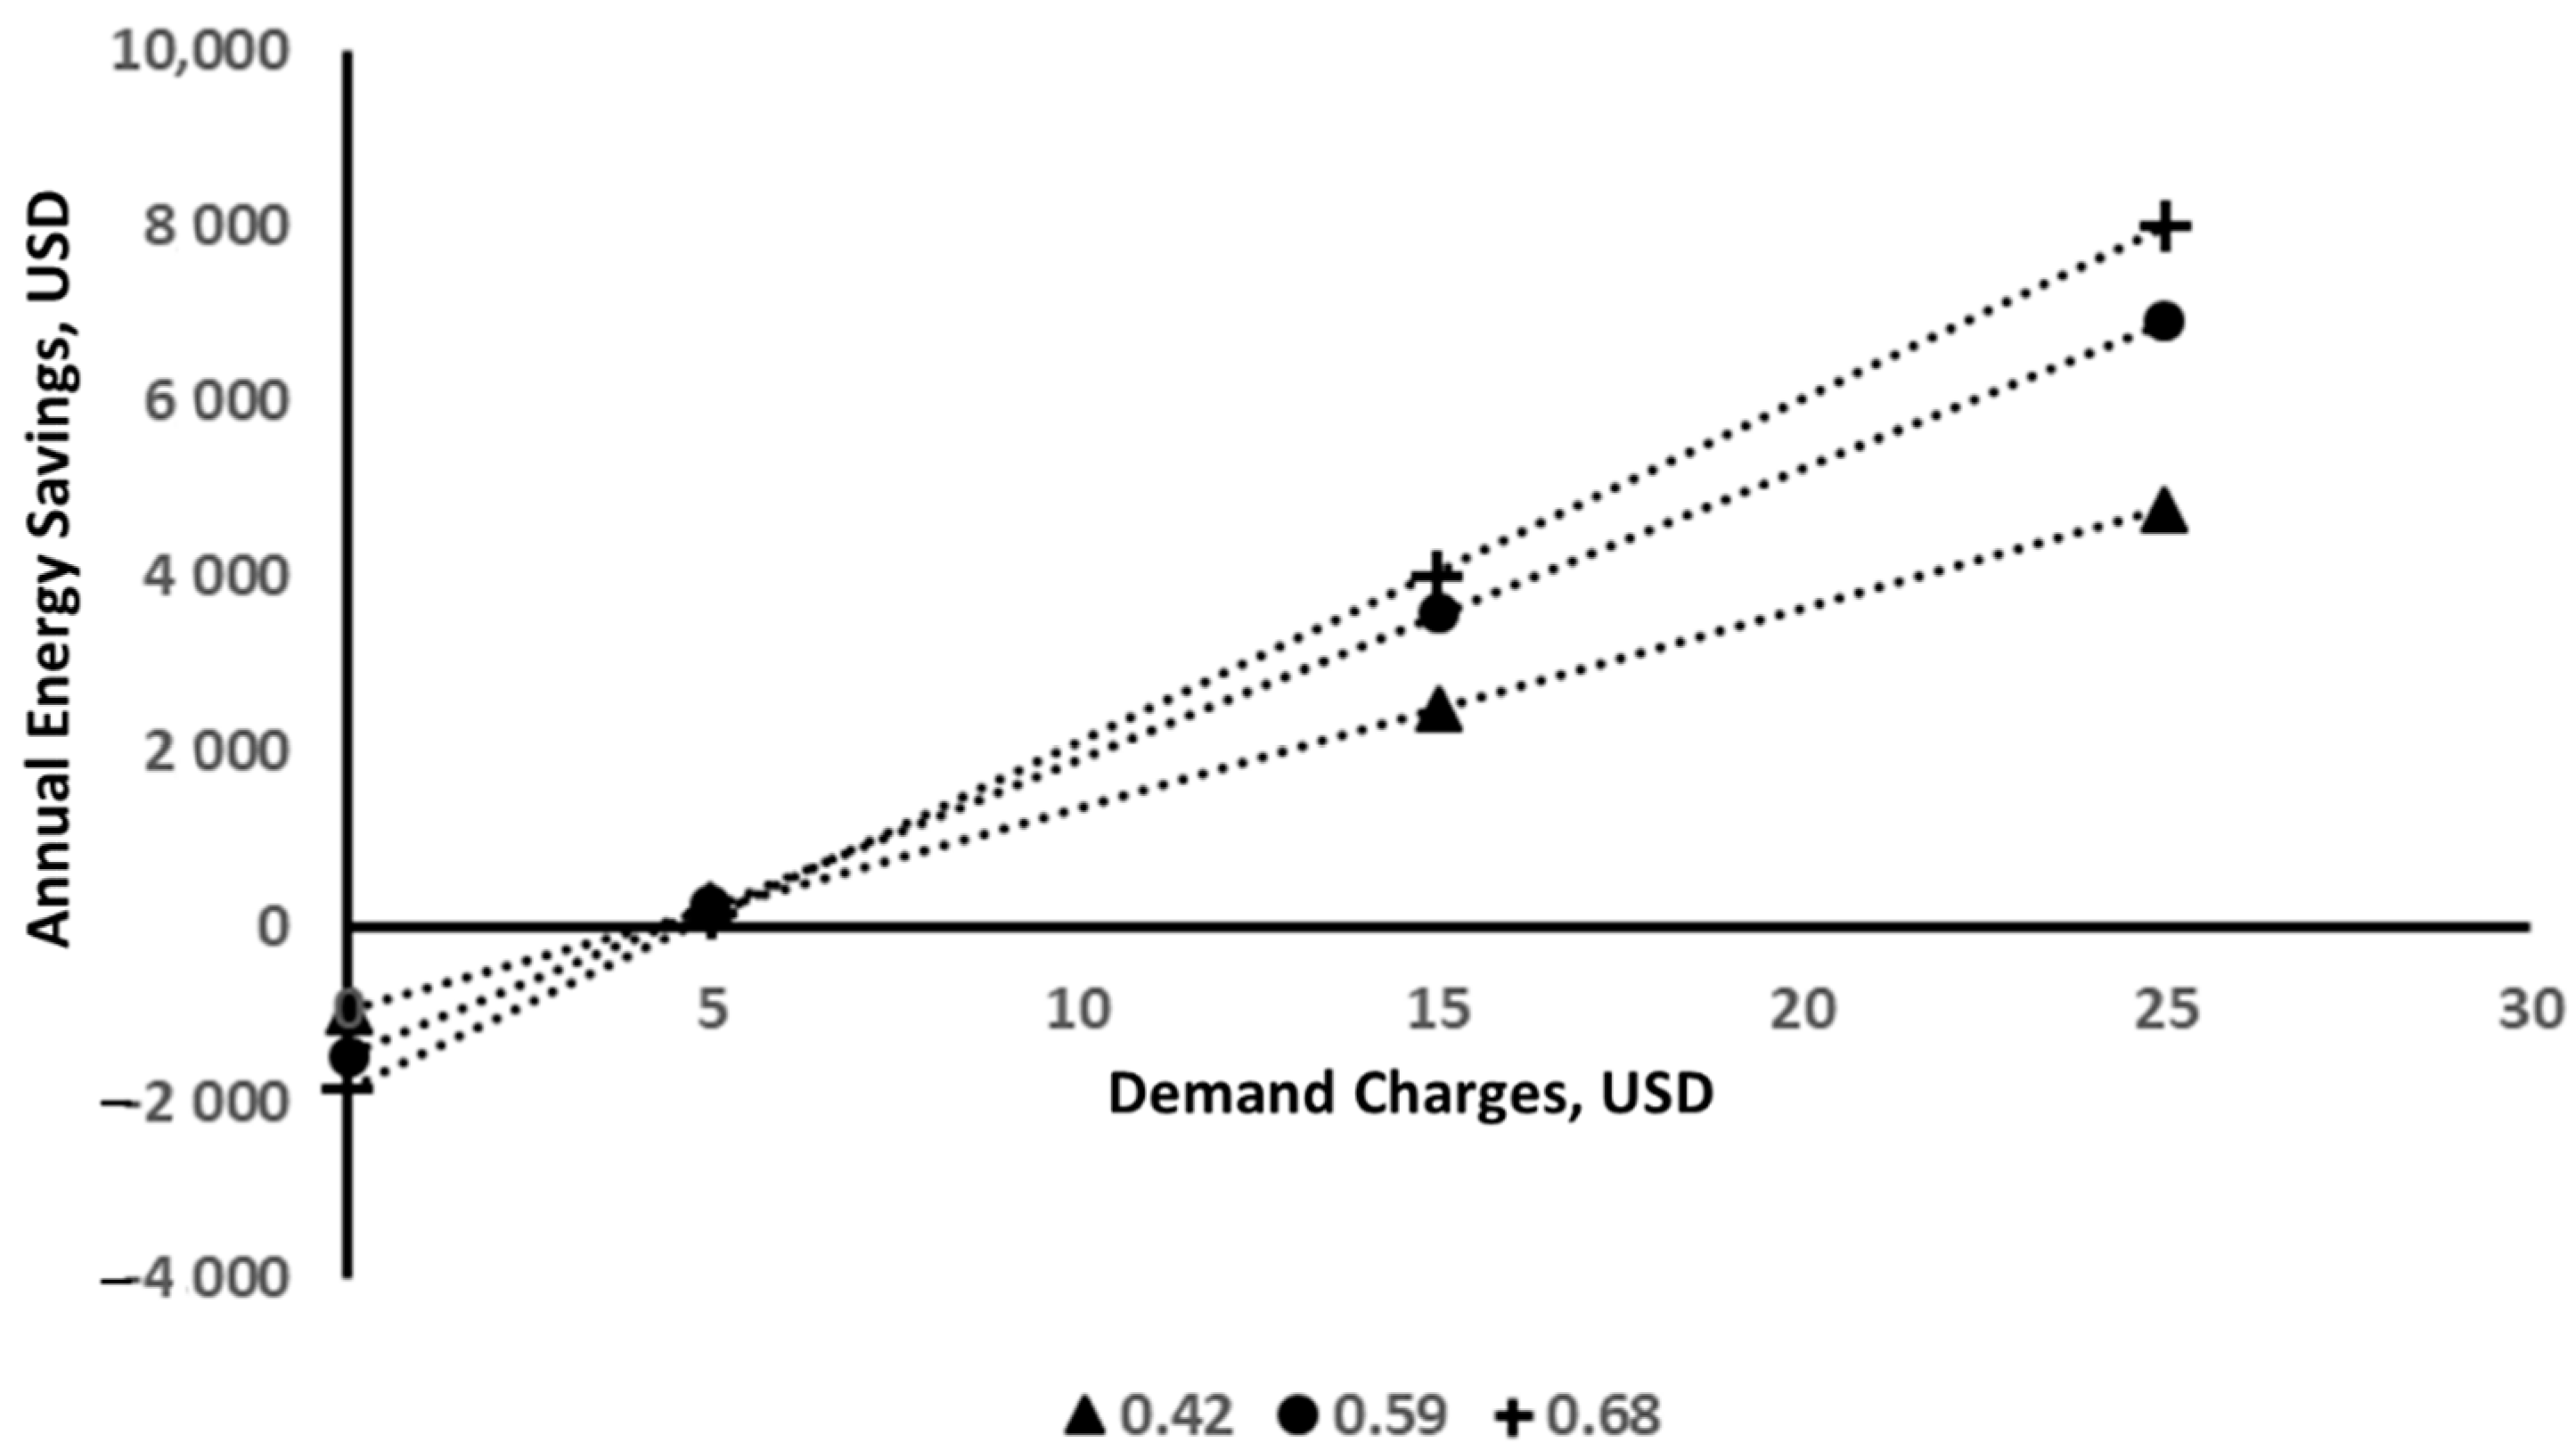
As indicated in the prior sections, all but three cities had net energy savings for all three reflectivity membranes and for all levels of demand charge. Savings for the three cities that showed energy efficiency reductions as a function of demand charges, for the high reflectance membrane, is shown graphically in
Figure 7.
For the case of Albany, NY, net savings were projected to occur when demand charges exceeded USD 6.28. While modeling for each specific location and electric tariff structure is necessary, the work here suggests that there is some minimum demand charge above which savings will always be achieved when electric heat is being used.
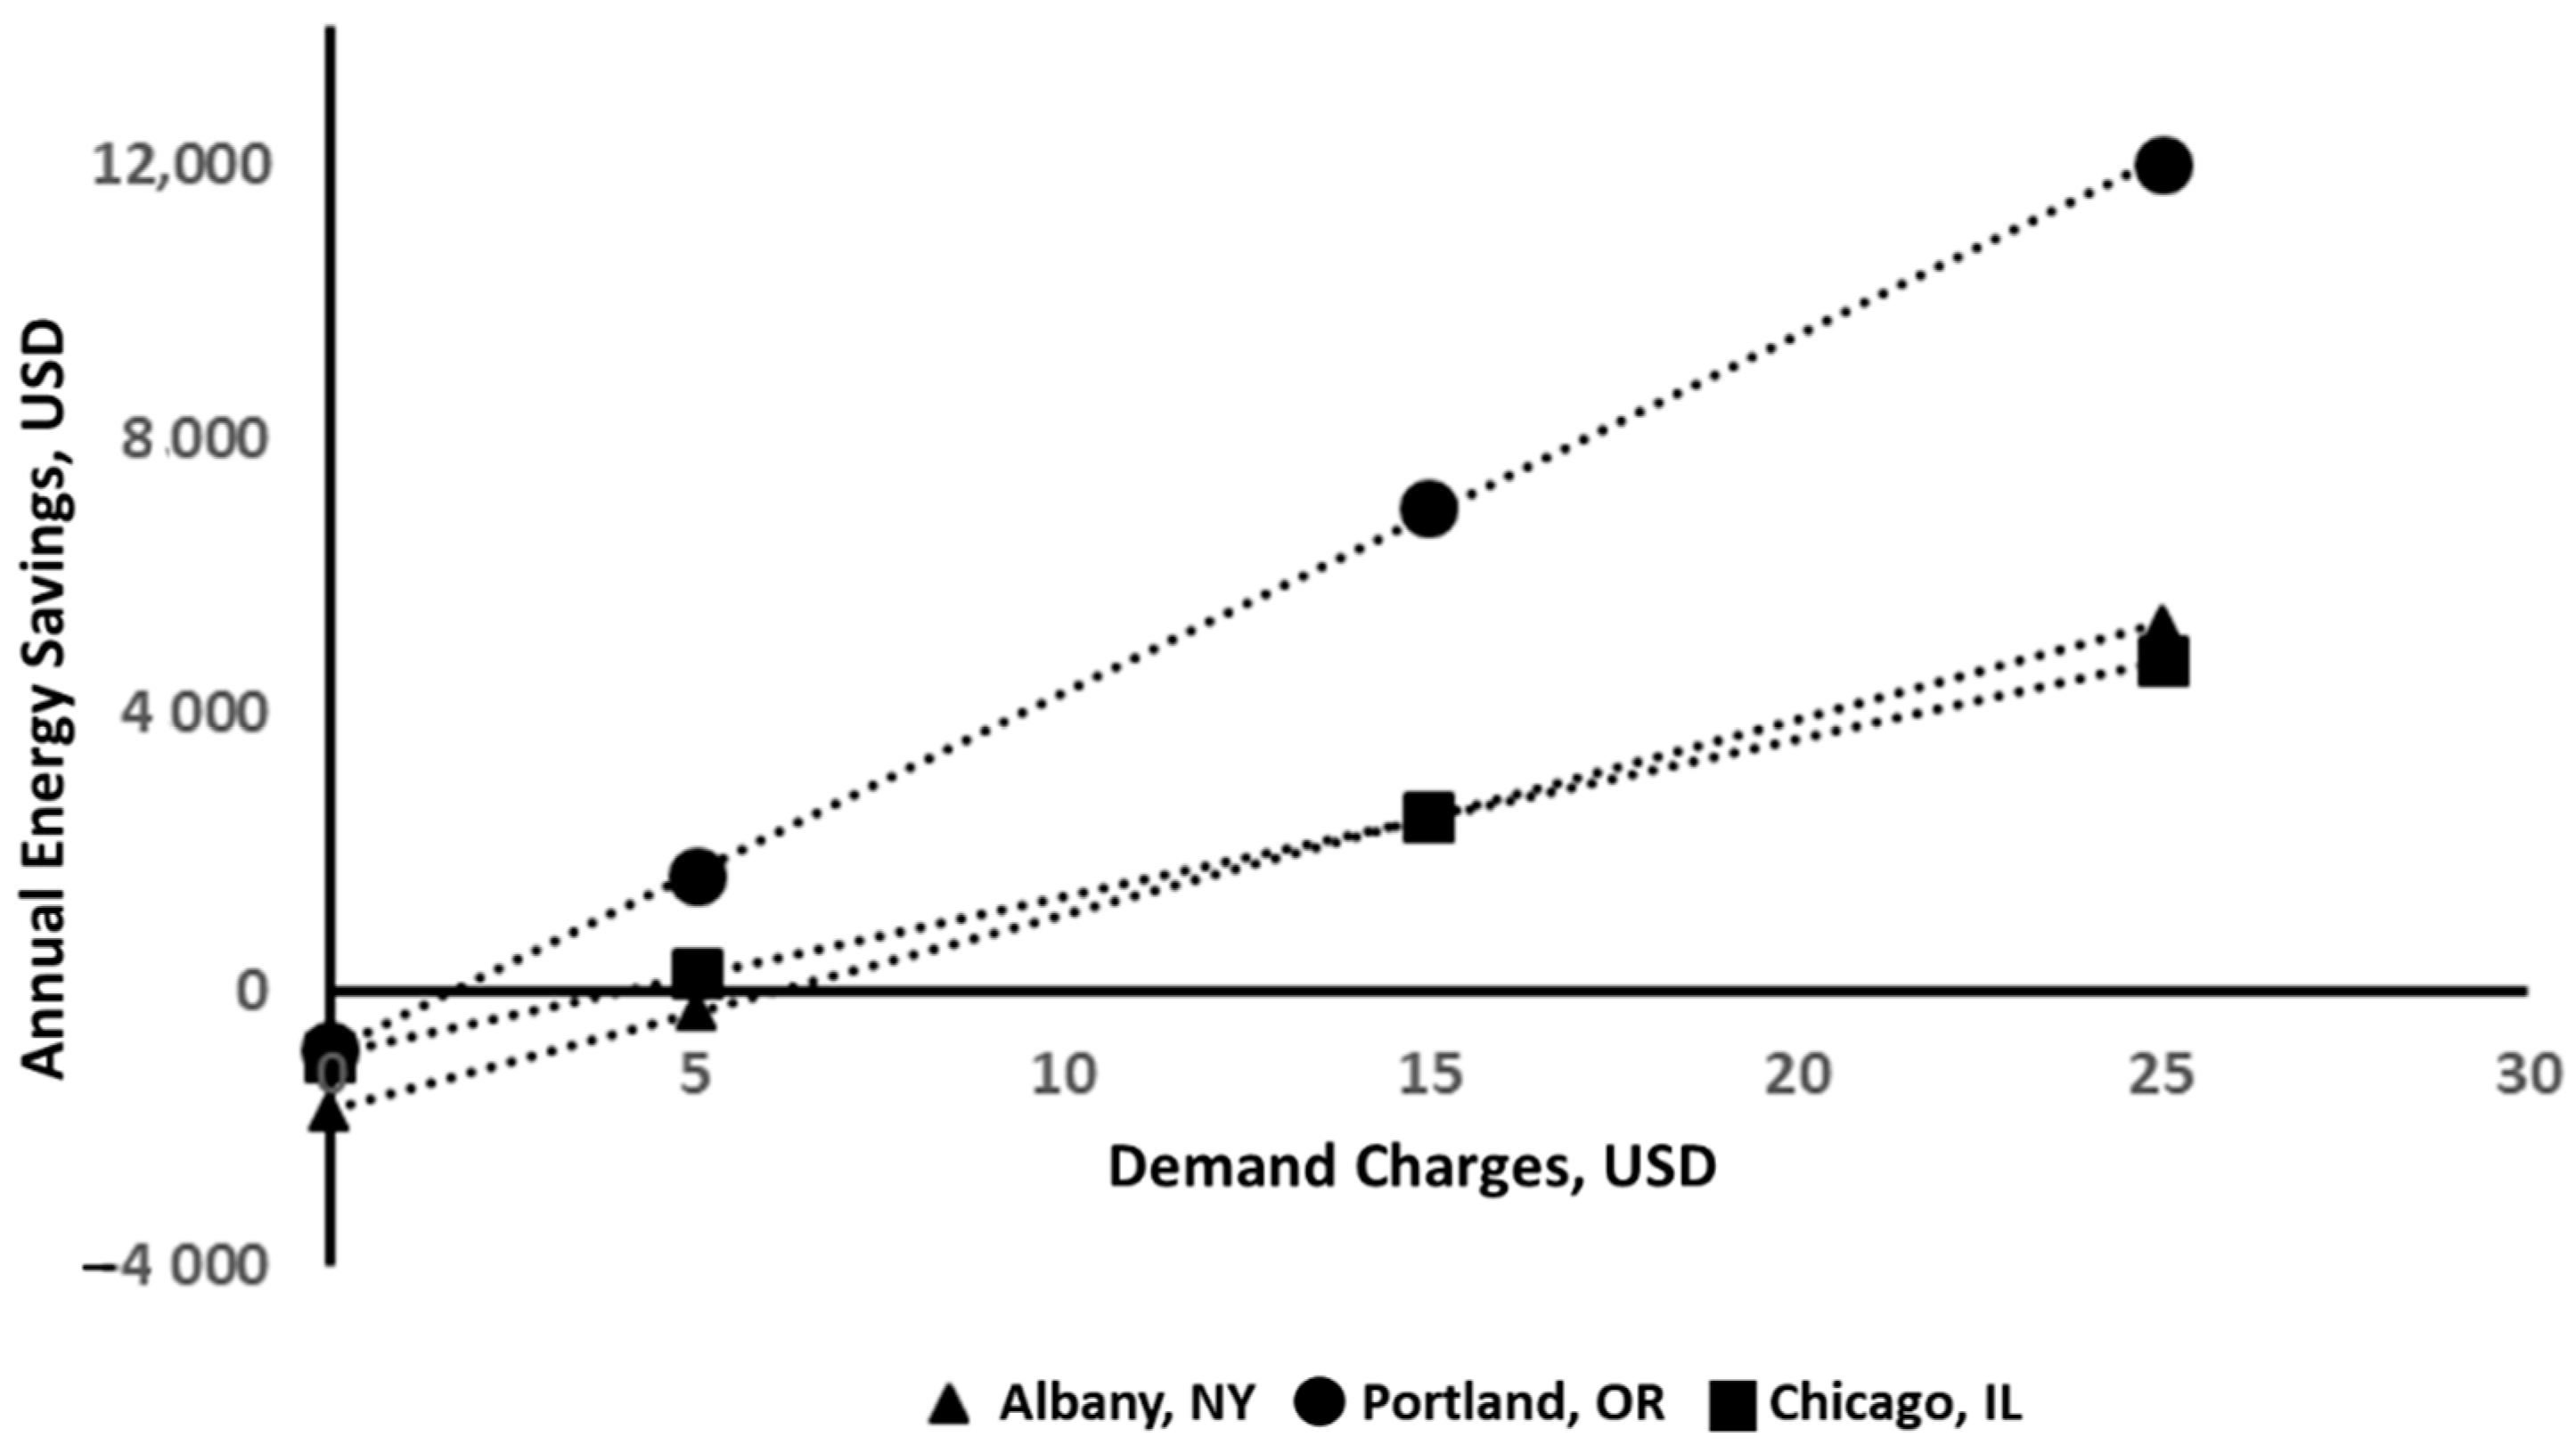
For various reasons, including aesthetics or the school of thought that darker roofs encourage winter snow melt (Building designers in northern areas of the US often state that darker roofs assist with snow melt, although no published studies are available to support this hypothesis.), mid to low reflectance membranes might be considered. For Albany, NY, Portland, OR, and Chicago, IL, the annual savings achieved when using a gray membrane (i.e., low solar reflectance) versus a dark, absorptive roof as a function of demand charges is shown in
Figure 8.
A comparison of
Figure 7 and
Figure 8 shows that while energy savings may be reduced by use of less reflective membranes, they are not eliminated. Net savings are achieved for demand charges above a minimum, which is approximately USD 6.25 for the cities studied here.
Figure 9 shows the savings that can be achieved by substituting low, mid, and high reflectance membranes in place of a dark absorptive roof, for Chicago, IL, as an example.
At lower solar reflectance, savings are reduced but gain in significance at higher demand charges.
4. Discussion
The results for the studied locations, suggest that energy savings after converting from an absorptive roof to a more reflective membrane can be achieved when using gas heat. This was the case even when demand charges were USD 0 and for all three levels of reflectivity.
For electric heat, savings are lower compared to the cases with gas heat but are still projected to occur so long as demand charges are above a minimum. Building designers would need to verify the breakeven point for specific projects, but this work suggests that the demand charge above which savings occur is relatively low, at around USD 6.25 or below, depending on the exact situation. This suggests that, while there is a so-called winter heating penalty, over a year there are always net savings so long as demand charges are present as part of the electric tariff. Therefore, cites that encourage the use of reflective roof membranes for the purposes of lowering overall energy use (i.e., as part of global warming initiatives) are not penalizing building owners with added costs. A decision to use an absorptive roof membrane (i.e., essentially non-reflective), would only make sense for buildings with electric heat and not gas heat, that were located in northern cities such as Albany, NY, Chicago, IL, or Portland, OR, and when demand charges were below USD 6.25.
Other work, notably that of Ibrahim [
9] and Mellott et al. [
26], has suggested that HDD be used to decide whether or not to install a highly reflective membrane versus an absorptive membrane.
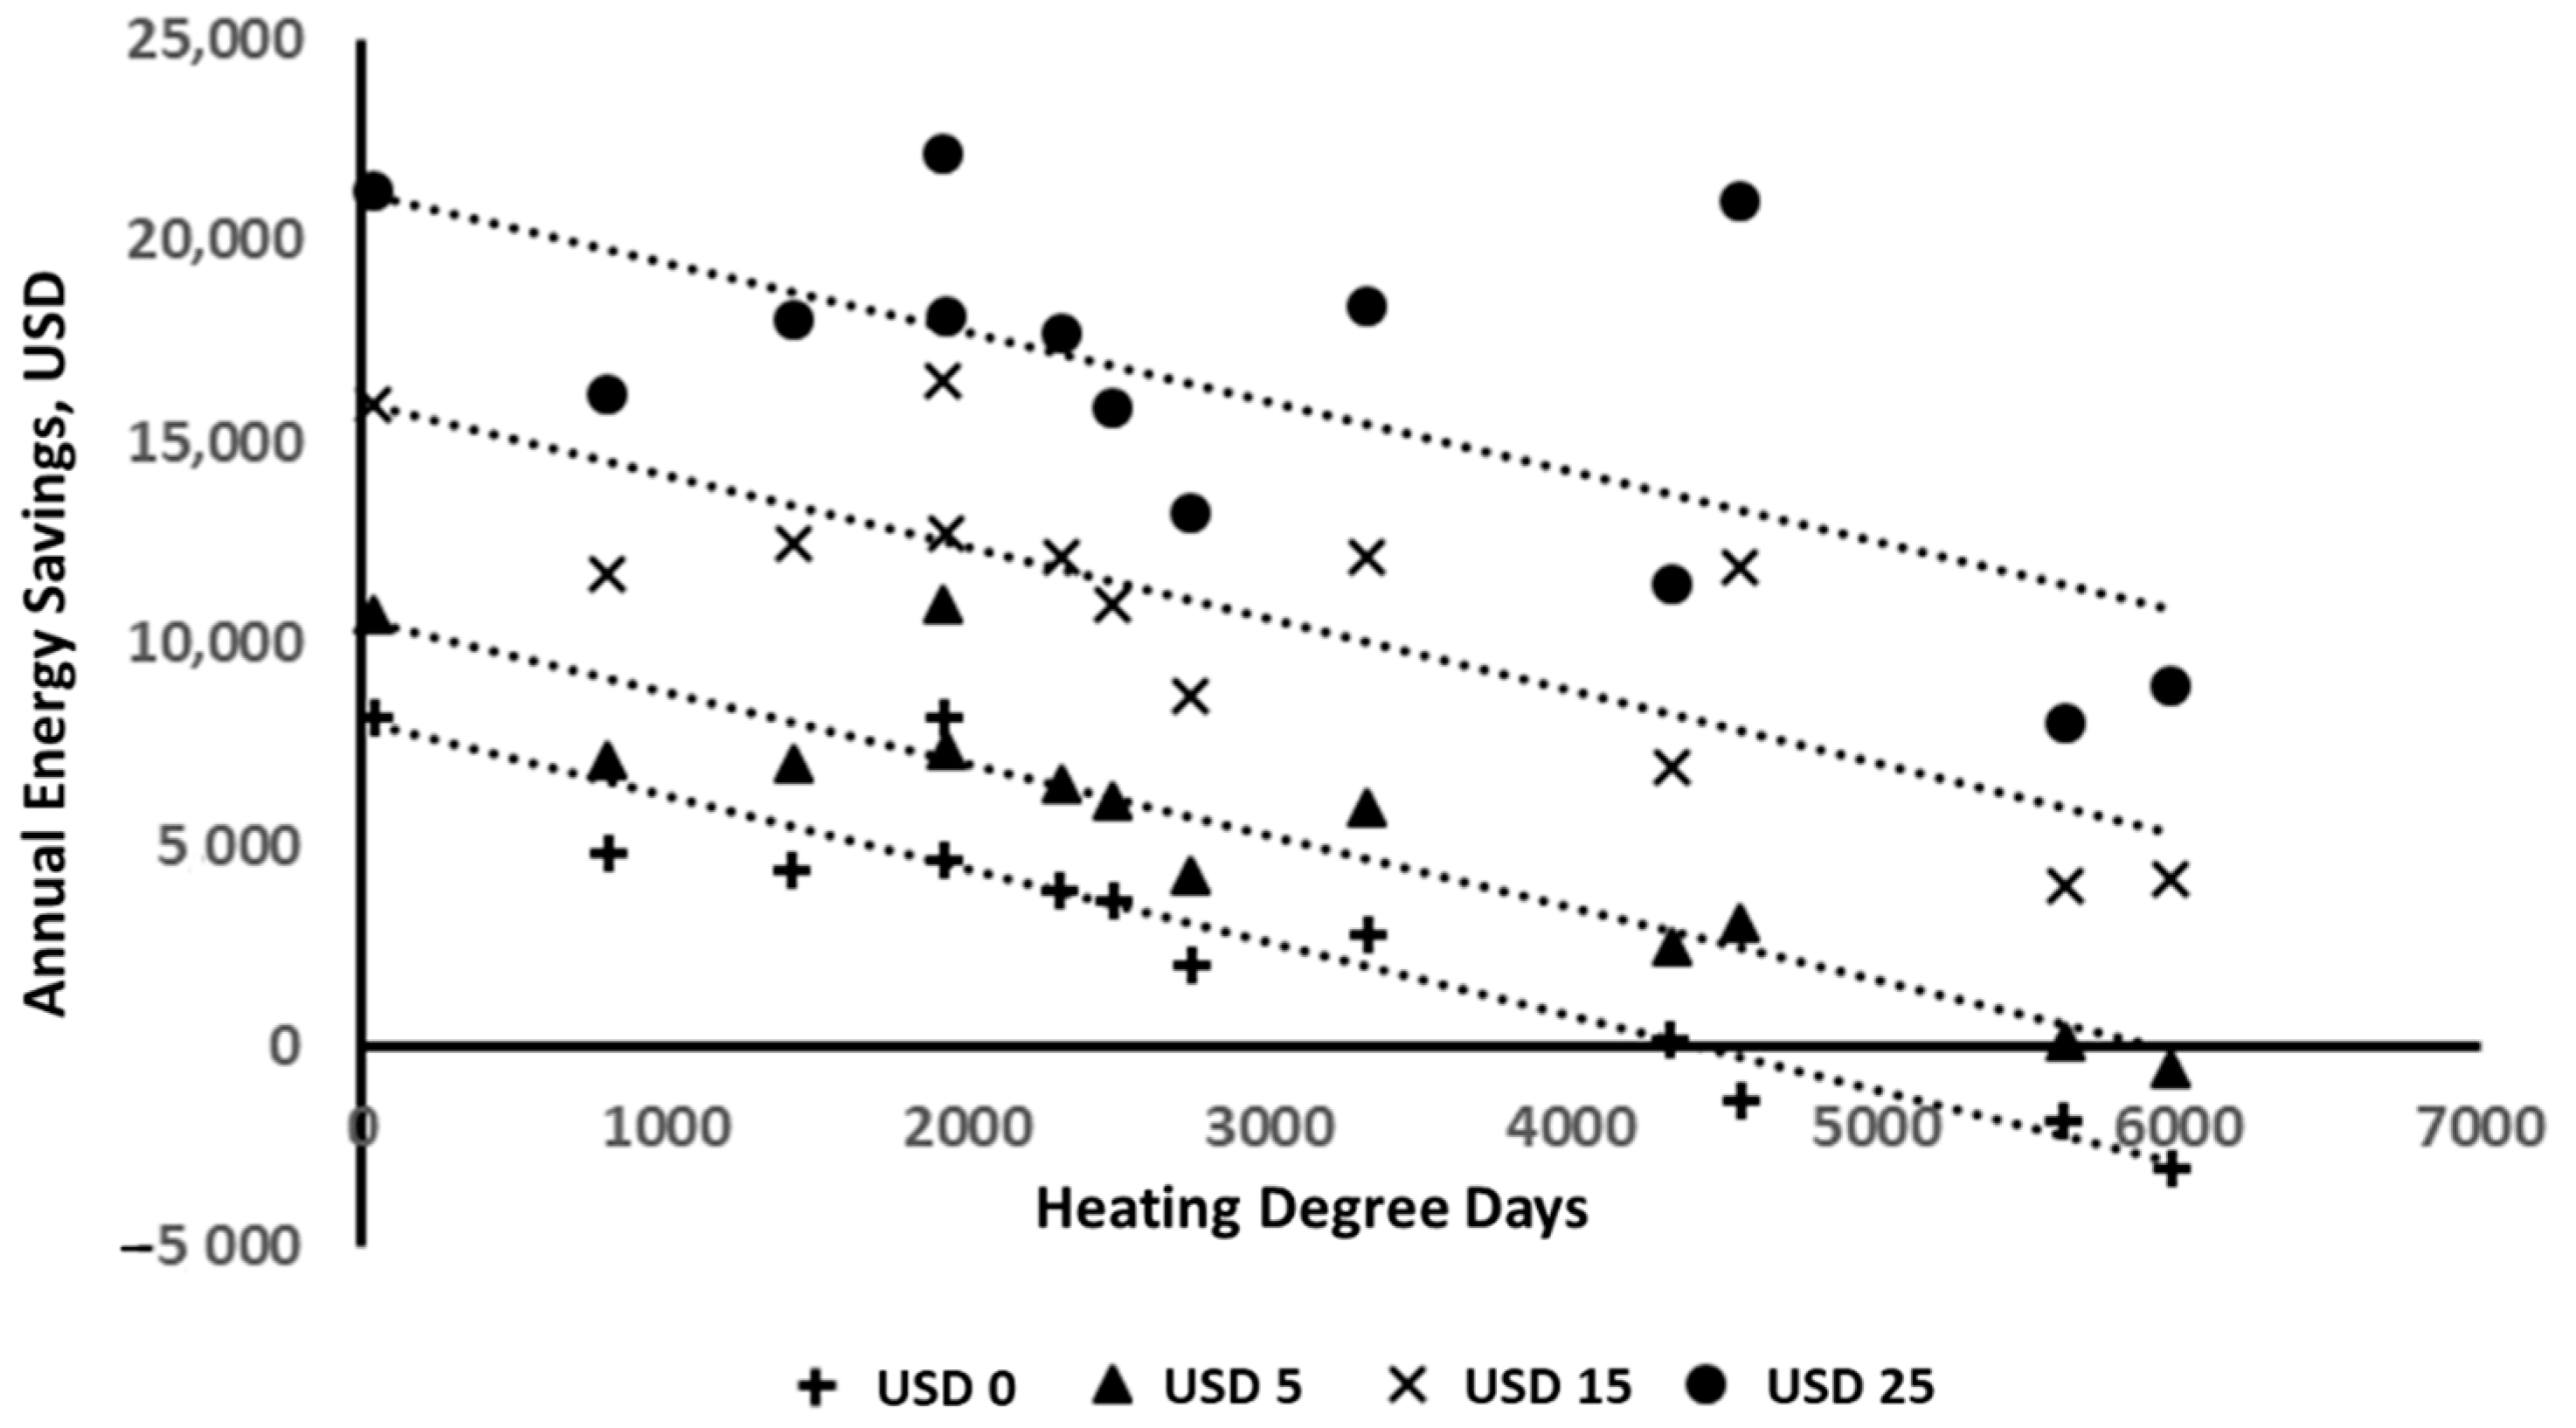
Figure 10 shows the modeled energy savings as a function of HDD, for all locations and each demand charge, assuming electric heat.
An examination of
Figure 10 shows that HDD is a poor indicator of achievable energy savings. At each demand charge, there is significant scatter from the linear best fit. This is because of the variation in CDD, shown in
Table A1, and therefore variation in air conditioning costs. However, in every case for demand charges greater than USD 5.00, savings are projected to occur. Below a demand charge of USD 5.00, savings were not achieved for Albany, NY, Portland, OR, and Chicago, IL, as already noted in earlier discussion. But, for those cities, the use of gas heat is always projected to result in savings for a conversion from an absorptive roof membrane to one that was reflective.
It should be noted that, if global warming continues to progress, HDD and CDD will be harder to forecast. However, in general it could be expected that CDD would increase compared to HDD, and that therefore air conditioning use would increase as compared to heating. That would increase the net savings modeled in this study and make a conversion to reflective roofing more compelling.
5. Conclusions
The modeling study, done using 2017 energy costs, has confirmed previous work showing that energy savings are projected to occur for all US cities included in this study, so long as gas heat is used, after conversion to reflective roofing membranes. Increased levels of reflectivity, from lower, to mid, and to high reflectance increases the amount of annual savings. Thus, for buildings with gas heat and air conditioning net annual savings are predicted for all locations studied after conversion to increased reflectance membranes.
This study has also shown that in those situations where electric heat is used, savings would be achieved in every case studied except for the three northern cities in the study. For those three cities, as long as demand charges exceed approximately USD 6.25 savings are also projected to occur. Again, higher levels of reflectance increase the net savings.
Roofing life cycles are normally measured in terms of decades and therefore the long-term reliability of this study could be questioned. However, so long as the relationship between gas and electric costs remains similar, the main conclusions of this study would hold. Solar panel installations on roofs could potentially reduce electric costs, but the roof membrane would be shaded and therefore solar reflectance assumptions would change markedly.
The use of heating degree days as an indicator for whether to install a reflective roof appears to be inappropriate. The relationship between HDD and savings appears to be confounded by other factors. Again, this study shows that when demand charges exceed USD 6.25, then savings are projected to occur in every case.
For those situations where highly reflective roof membranes are not desired, for example due to aesthetics or a desire to improve snow melt during winter months, then mid to low reflectance membranes still provide some measure of energy cost savings.
6. Recommendations for Future Studies
This study utilized the ORNL CoolCalcPeak tool for energy modeling. This tool only examines the impact of heat flux through the roofing assembly. The work could be extended by using modeling tools that would enable a whole building to be examined. Thus the effects of, for example, insulated ceilings, building use, and occupancy could be evaluated.
As solar panel installations on roofs become more common, they affect the heat flux through the roofing assembly. Such panels shade the roof and can be expected to reduce the impact of membrane reflectivity. It would be of value to evaluate the effect of their shading on building energy costs.
While this study evaluated energy efficiency changes based on one year’s energy costs and effects, it would be worthwhile doing an entire life cycle analysis. This could take into account projections of future energy costs including the effects of renewable energy sources.


