1. Introduction
The Architectural, Engineering and Construction (AEC) industry is undergoing a significant shift from traditional labor-intensive methods to automation through the use of information technology, and Building Information Modeling (BIM) has played a crucial role in this transformation [
1,
2]. The United States National Institute of Building Sciences (NIBS) gives the most authoritative definition: “A BIM is a digital representation of physical and functional characteristics of a facility. As such it serves as a shared knowledge resource for information about a facility forming a reliable basis for decisions during its lifecycle from inception onward [
3]”.
Literature review refers to the kind of academic paper which is written by making a comprehensive analysis for a large amount of collected information on a certain topic. As a type of scientific literature, literature review is considered a stopgap for in-depth understanding of the research fields [
4]. Through the systematizing of existing research, the fronts and trends of current research can be found, so as to provide strong support and argumentation for the establishment of new research topics in the future.
Most previous research focused on the research literature review of BIM and other fields, such as managerial areas of BIM [
4], BIM for Green Buildings [
5,
6], BIM for infrastructure [
7], and BIM for facilities management [
8]. To illustrate, He et al. [
4] reviewed 126 peer-reviewed journal papers on managerial areas of BIM (BIM-MA) and proposed an integrated conceptual framework to summarize current and future research of managerial BIM. Lu et al. [
5] conducted a comprehensive and critical reflection on the relationship between BIM and Green Building and explained it systematically using the classification of “Green BIM Triangle” taxonomy through an in-depth review of hundreds of journal articles published from 1999 to 2016 and 12 kinds of BIM software widely used in AEC industry. Liu et al. [
6] conducted literature review and concluded BIM could assist automate the process of green building assessment process. Furthermore, this study also found 31 Green Mark items could be attained through BIM authoring tool and BIM-based building performance analysis (BPA) tools. Bradley et al. [
7] presented a review of 250 key publications in the area of BIM for infrastructure and analyses the trends for BIM development for infrastructure according to publication year, publication origin, project phase and publication scope. Hilal et al. [
8] adopted the scientometric approach using science mapping techniques to examine BIM-FM articles using Web of Science (WOS) database for the period between 2000 and April 2018.
There are only a few studies on regional and global BIM review. Among the handful, Saka and Chan [
9] presented a scientometric review and metasynthesis of BIM development in the African AEC industry. They found a varying level of BIM growth in the African continent, with North Africa, West Africa, and Southern Africa leading the research development, while the other regions, namely the East Africa and Central Africa are lagging behind. In addition, the authors identified the major challenges encountered in BIM adoption are people/process-related barriers. Zhao [
10] conducted a scientometric review of scientific literature relating to BIM during 2005–2016, and identified the top hot-spots of BIM research, e.g., mobile and cloud computing, laser scan, augmented reality, semantic web technology, automated generation, safety rule and code checking. In comparison, this study involved a higher corpus of papers (1455 articles). Moreover, compared with Zhao’s [
10] 12-year span of review, the span of review for this study is 16 years. In addition, no previous review focused on venation of BIM development; this study distinguished 11 clusters of global BIM research into three stages, namely formulating stage, accelerating stage and transforming stage. In addition, the authors reviewed the BIM policy of Singapore and observed there is a co-production relationship between evolution of BIM policy and global BIM research.
This research adopts a quantitative and qualitative analysis method to analyze 1455 journal articles related to BIM published during 2004–2019. In the quantitative analysis, the distribution of BIM publication was analyzed considering times, authors, countries, research institute, subject categories and published journal. In the qualitative analysis, 1455 bibliometric records were imported into the scientometric toolkit for visualization analysis, co-authorship network, network of countries/regions and institutions, network of co-occurring subject categories, network of co-occurring keywords, journal co-citation network, author co-citation network and document co-citation network. In addition, co-citation clusters were identified and a critical review was conducted for the Top 3 documents in each cluster.
Future Trends of Global BIM Research
In this study, historical trends were explored to reveal the variations of BIM-related research topics. Based on scientometric analysis, it shows the evolution of global BIM research across three different stages: (1) formulating stage; (2) accelerating stage; and (3) transforming stage. This section presents the features associated with transforming stage and critical reviews of the recent BIM research with integration with emerging technologies, such as Augmented Reality (AR) [
11], Geographical Information System (GIS) [
12], and Internet of things (IoT) [
13]. Diao and Shin [
11] reviewed the literature on AR in AEC education industry and found that AR has wide application value in general education industry and some designated fields. The authors put forward that the combination of AR and building information model (BIM) has great application potential in architectural and civil practice and has become an emerging research direction. Y Song et al. [
12] reviewed the development trend and opportunities of BIM-GIS integration in the construction industry from the perspective of spatiotemporal statistics. According to Song et al., the application of BIM-GIS integration requires systematic theories, including deep utilization of mathematical modeling approaches and spatial-temporal modeling in BIM and GIS simulations. In addition, application of BIM-GIS integration minimizes the risk of underground construction.Tang et al. [
13] conducted comprehensive review on 97 papers from 14 journals and databases in other industries to identify emerging application areas and common design patterns and common emerging areas of application in dealing with BIM-IoT device integration methodologies, examine current limitations and predict future research directions. In summary, the integration of BIM with emerging technology is receiving increasing attention, with AR, GIS, IoT and other emerging technologies being new drivers of a paradigm shift in the AEC industry.
2. Research Method
The research framework includes defining the literature database and search rules, conducting preliminary retrieval, data processing and analysis, as illustrated in
Figure 1. The paper selection process in this study was referred to the methods used in other review articles (e.g., [
4,
5,
6,
7,
8,
9]).
2.1. Preliminary Search
The research boundaries were defined by following the rules below. Firstly, the research data were obtained from Web of Science (WoS) Core Collection. For scientific text data, all literature information except the main body is included in the index database. WoS, an authoritative database in the research field, was selected for literature search. The data structure of WoS is relatively complete, including literature types, authors, journals, keywords, abstracts, institutes and references. Engineering, architecture and information construction are also fully included in the database, which also contains major journals and conference papers. More than 18,000 influential journals around the world are covered by WoS, including open journals, more than 180,000 conference proceedings, and over 80,000 books from around the world [
14]. The information obtained from WoS was considered sufficient for this study.
Secondly, the initial search includes the following topics: “Building information modelling”, “Building information modeling” or “Building information model”, representing precise phrase search. To consider articles comprehensively covering BIM and avoid target literature omission, the time span was set as 2004–2019. The first journal article [
15] on BIM was published in 2004, thus 2004 was set as an the initial year. The retrieval was conducted on 21 February 2019. In January 2004, John Haymaker et al. [
15] firstly proposed “building information modeling” in the keywords of a paper and formalized a reusable reasoning module called “Perspectors” which can automatically construct a task-specific engineering view known as “Perspectives” by engineers. The method has been verified by a real project.
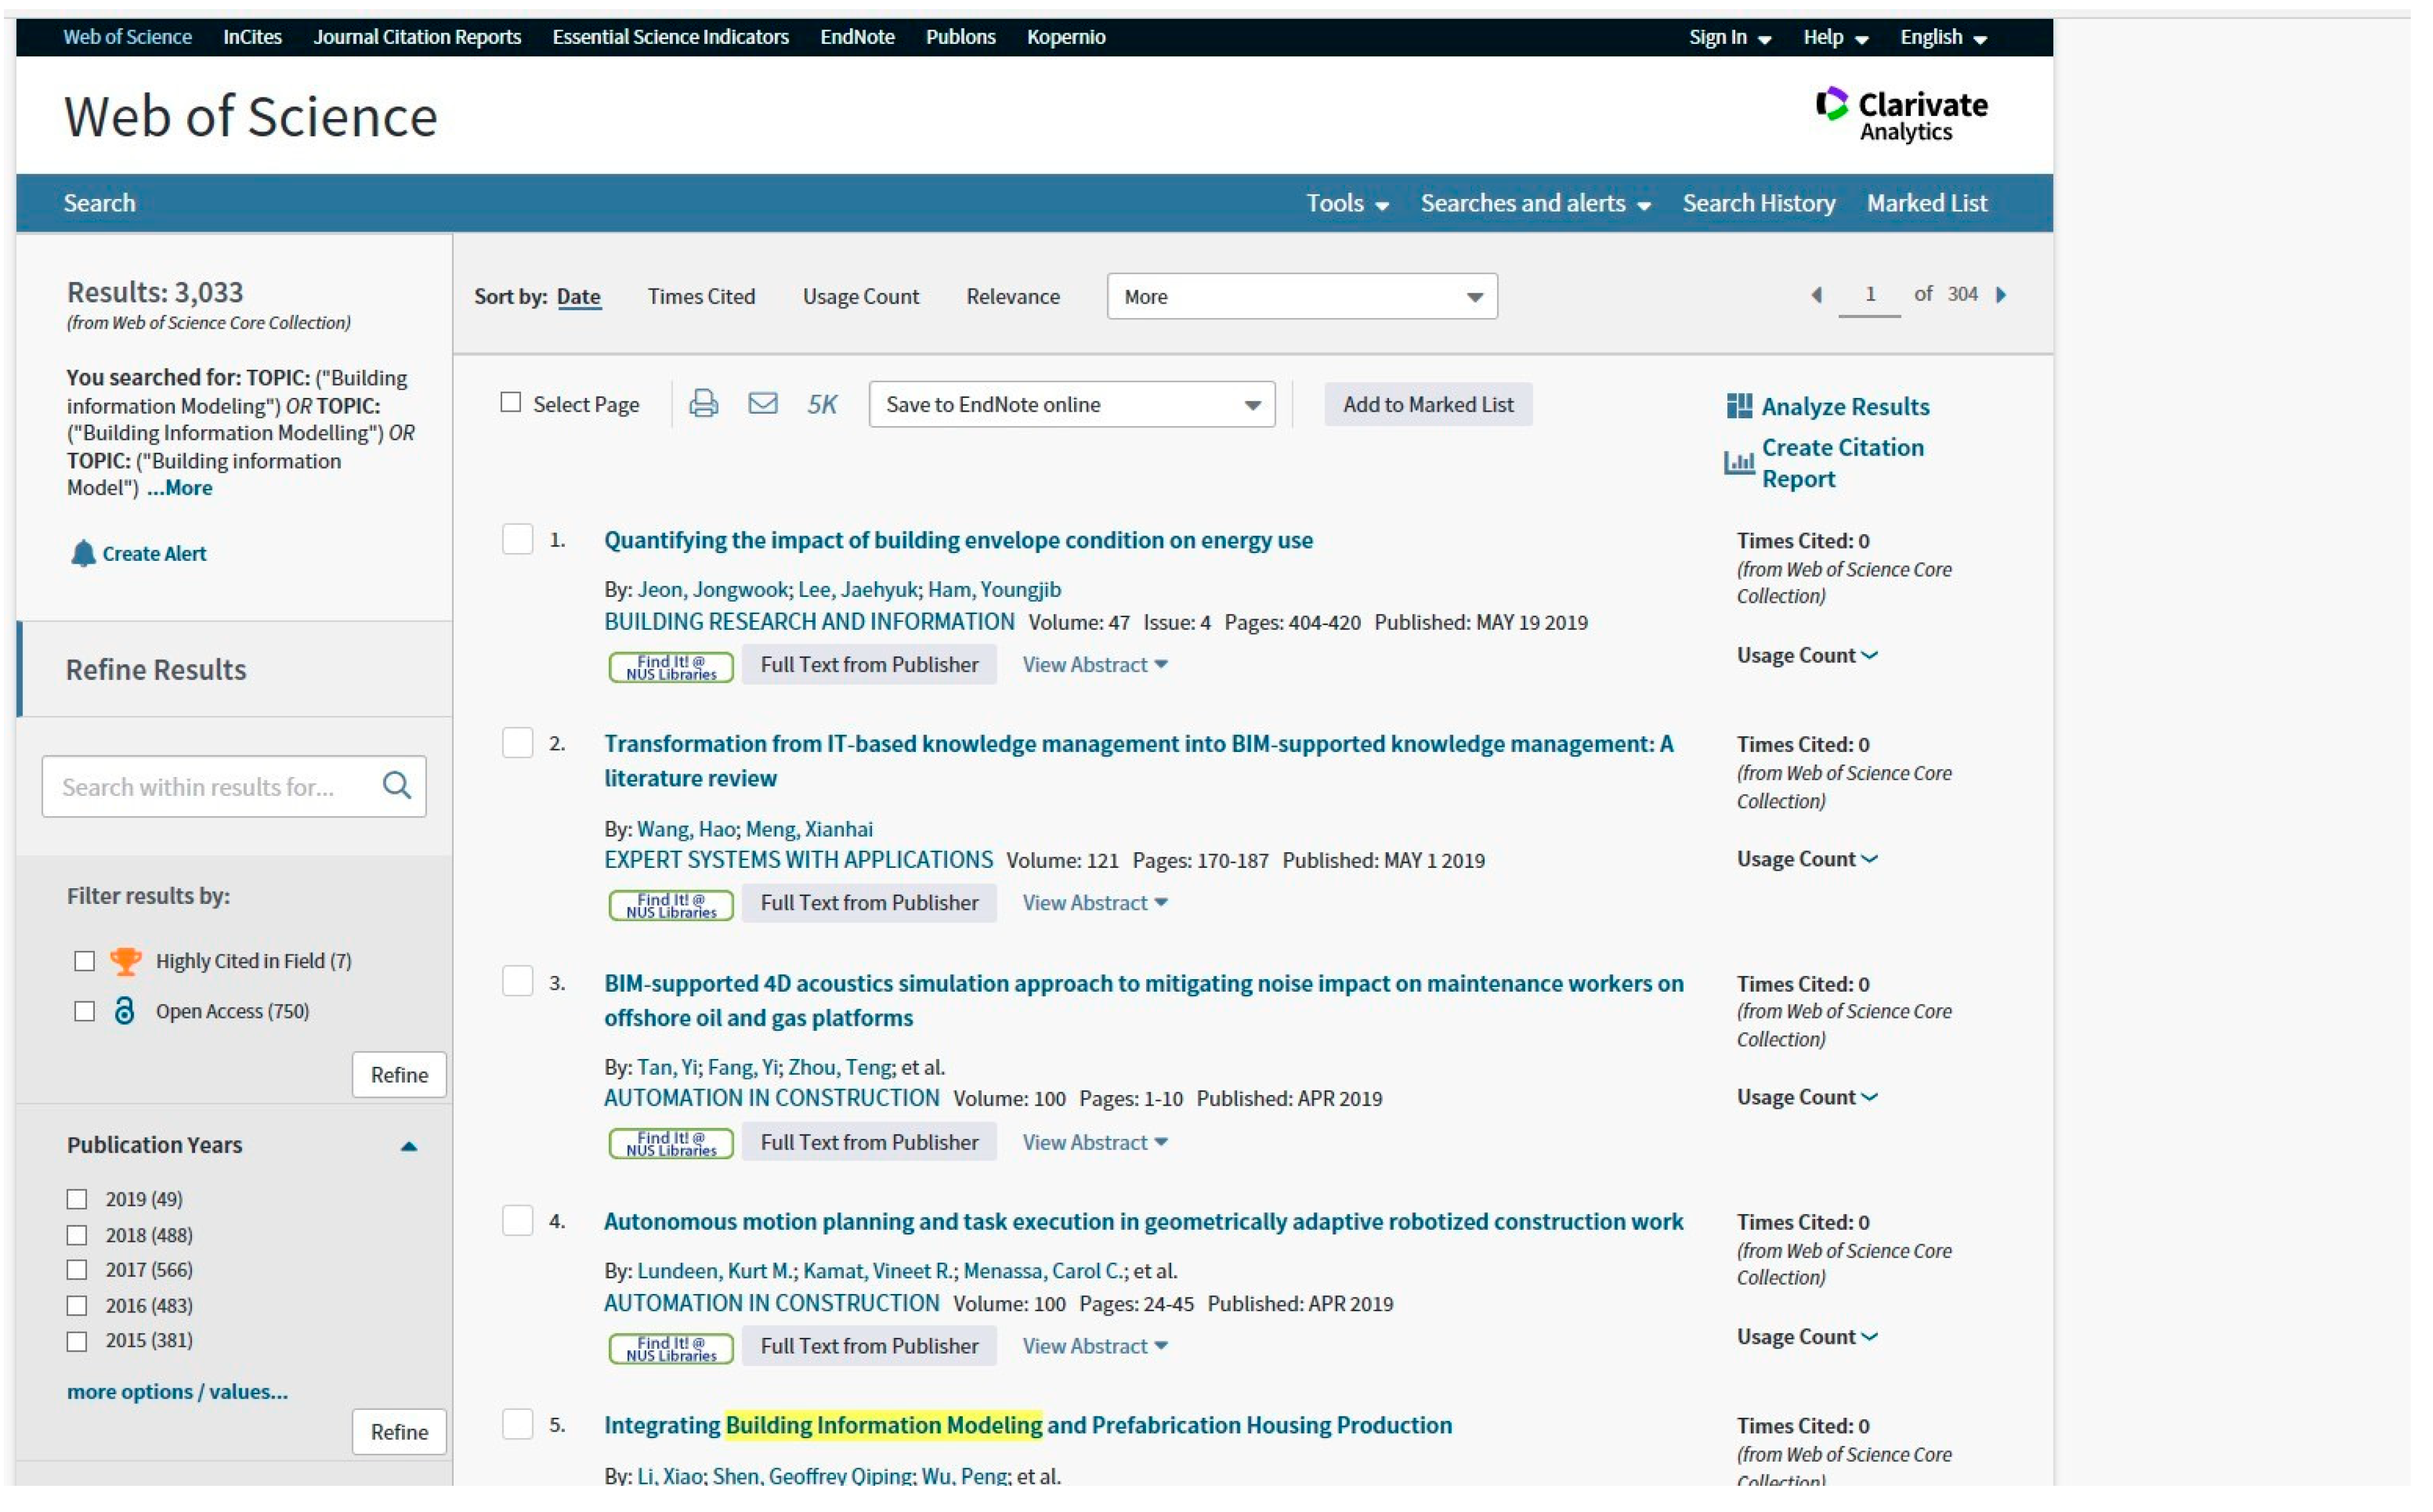
Thirdly, only English articles and reviews were selected. To ensure the comprehensiveness and reliability of the results of literature review, the literature referred to was limited to journals, excluding book reviews, letters, news reports and conference abstracts. This is because journal papers are usually peer-reviewed, and can be considered to provide more comprehensive, robust and superior quality of information than other types of publications. In total, 3033 articles on BIM were retrieved for the first time, with the database interface shown in
Figure 2.
Through refining and duplicate checking, 1455 articles on BIM were obtained. The specific data collection process is shown in
Table 1.
2.2. Data Pre-Processing
Before performing detailed analysis, data filtering and duplicate removal for WoS format of data should be carried out. It can help to remove redundant data and could be used for removing identical or similar files with the same content [
16]. In total, 1455 valid BIM articles were obtained after data pre-processing.
2.3. Research Toolkits
Common scientometric toolkits are Citespace [
17], Science of Science (Sci2) Tool [
18] and BibExcel [
19]. These toolkits can help scholars to quickly and effectively perform visualized information analysis. CiteSpace is an open-sourced toolkit which can be freely downloaded. It is mostly used to detect, analyze, and visualize patterns and trends in scientific literature [
20]. Its primary goal is to facilitate the analysis of emerging trends in knowledge domain. Featuring perfect functions, CiteSpace is characterized by spectral clustering and citation burst [
20]. It emphasizes on identifying critical points-in-time in the development of a field or a domain, in particular, intellectual turning points and pivotal points of research [
21]. In the whole process of constructing knowledge maps, the processing of each step by CiteSpace is reasonable, with the highlight of core items. Therefore, CiteSpace was used to analyze literature in this study.
2.4. Parameters Setting
The time span settings were from 2004 to 2019 for BIM bibliographic records. Each year was selected as a time slice and 16-time segments were obtained. The Cosine algorithm was selected for the correlation strength of network nodes. The threshold of time slice was set to 50, i.e., the first 50 (Top 50) were extracted. Finally, redundant links were removed by Pathfinder in-network pruning, as recommended by Chen and Morris [
22]. Moreover, the corresponding node types were selected, and the corresponding scientific knowledge map was drawn according to the research needs.
3. Statistical Overview
This section presents a quantitative analysis for 1455 BIM bibliometrics record. The development status of BIM research field can be reflected by the diachronic change trend of the amount of publications in this field. To understand the research achievements of BIM in the last decade, statistics of distribution of BIMs publication were analyzed by their publishing times, authors, countries, research institute, subject categories and published journal.
3.1. Distribution of BIM Publications with Times
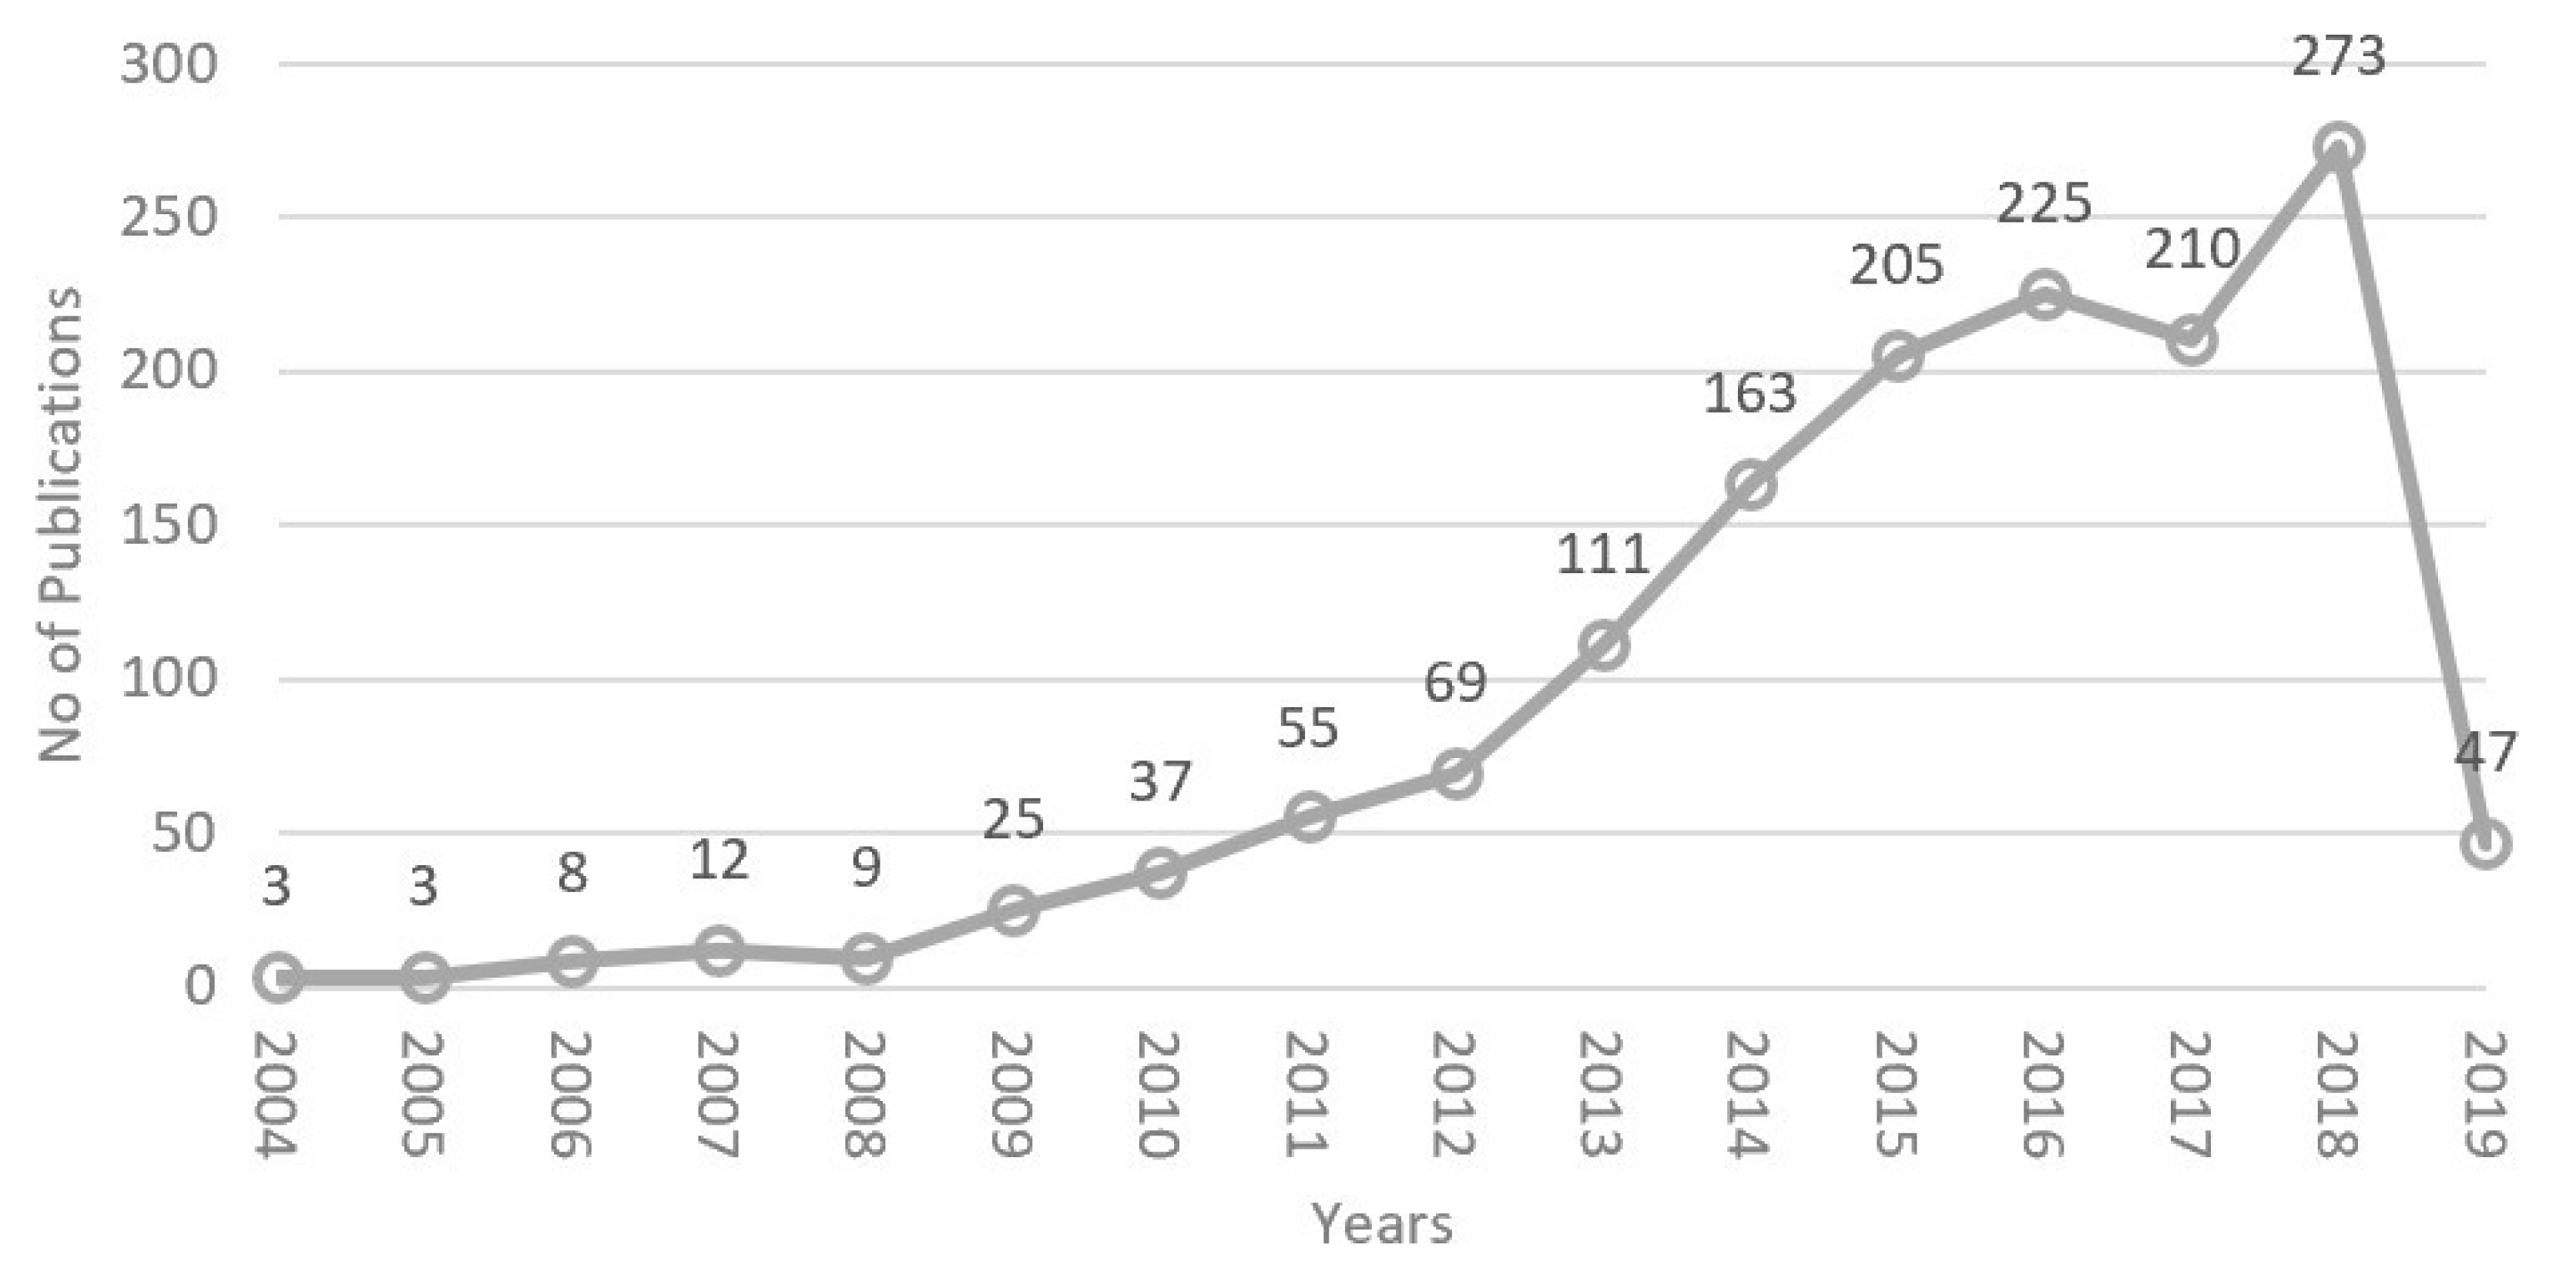
All 1455 BIM publications collected from the WoS database are shown in
Figure 3, the temporal distribution of which is recorded. It is shown that the volume of research documents related to BIM has been on a rise since 2008, with a sharp increase especially since 2012. BIM is receiving extensive attention and ushering in the upsurge of development in the world. Published articles in the BIM field have greatly increased since 2008. In total, 708 BIM papers were published in the last three years (2016–2018), accounting for approximately half of the literature in this study.
As shown in
Figure 3, the development of BIM research has continued since the beginning of the 20th century. In January 2004, Haymaker et al. [
15] firstly proposed “building information modeling” in the keywords of a paper. In 2005, Tse et al. [
23] tried to explore other dimensions of BIM. They mentioned the low frequency of BIM usage. Traditional entity-based CAD software was still taken as the actual drawing tool. Core obstacles include the difference between architectural design and drafting, inadequate objects and object customization capability, the complex and time-consuming modeling process, lack of training and technical support, lack of customer requirements, additional file acquisition costs and inability to obtain free trial software. In addition, the separation of design and drafting has become a common practice, which may be the most prominent obstacle to the widespread use of BIM and the nD modeling in the future.
3.2. Distribution of Published Paper with Authors
According to literature retrieved from WoS, the top 10 most productive BIM authors were identified, as shown in
Table 2. Xiangyu Wang from Curtin University, Australia, tied for the first place with 41 BIM publications, followed by Rafael Sacks from Israel Polytechnic University and Jack C. P. Cheng. Among the Top 10 productive authors, three come from Curtin University of Australia, two from Hong Kong Universities, and another two from the University of Seoul and Yonsei University, South Korea.
As shown by the number of publications in countries where the Top 10 authors are located, the Top 3 countries are Australia (76 publications), Hong Kong (43 publications) and South Korea (36 publications). It is also worth mentioning that the volume of publications by Top 10 productive authors accounts for approximately 15% of the total.
3.3. Distribution of Published Literature with Countries/Regions
The information of countries/regions in articles can be obtained from the published bibliographic records, so as to determine the main countries/regions of the publications. According to the records in WoS, 1455 BIM articles were published in 75 countries/regions. The Top 10 productive countries/regions are shown in
Table 3.
With regard to the contribution of the total volume of BIM documents, publications in the Top 10 countries accounted for approximately 93% of the total volume of BIM documents. The Top 3 countries, namely the United States, China and the United Kingdom, contributed 341, 224 and 194 papers, respectively, accounting for more than half of the total volume. The four Asian countries/regions among the Top 10, namely China, South Korea, Taiwan and Malaysia, accounted for approximately 30% of the total publications. In European countries, there were 194 publications in England, 70 publications in Germany and 41 publications in Italy, accounting for about 20% of the total publications. In North American countries, 341 were published in the United States and 60 were in Canada, taking up approximately 27% of the total publications. In Oceania, Australia contributed more than 10% of the total.
3.4. Distribution of Published Documents with Research Institutes
Information of research institutes in publications can be obtained from bibliographic records as well, so as to determine the main research institutes of the publications. According to records in WoS, 1128 research institutes have published 1455 BIM articles. The Top 10 productive institutes are shown in
Table 4.
In terms of the contribution of the total volume of BIM literature, the Top 10 research institutes accounted for nearly 30% of the total volume of published BIM documents. The Top 3 research institutes were Curtin University, Georgia Institute Technology and Hong Kong Polytechnic University. Regionally, there were three Hong Kong research institutes among the Top 10. The total contribution of Hong Kong was 97 articles, accounting for 23% and 7% of the Top 10 literature volume and the total volume, respectively. There were also three American research institutes: Georgia Institute Technology, Pennsylvania State University and University of Florida. In addition, among the Top 10 research institutes, Asian research institutes contributed 193 publications, taking up 45% and 13% of the Top 10 literature volume and the total volume, respectively.
3.5. Distribution of Published Documents with Subject Categories
In total, 1544 BIM bibliographic records loaded from WoS were allocated to 86 WoS categories. The Top 10 productive research institutes are shown in
Table 5. The Top 3 categories were Engineering Civil with 813 publications, followed by Construction Building Technology and Engineering Industry with 582 and 156 publications, respectively. They accounted for 56%, 40% and 11% of the total volume of publications, respectively.
3.6. Distribution of Published Documents with Journals
According to statistical data obtained from WoS core collection database, the Top 10 Journals of BIM research were determined. BIM literature publications are shown in
Table 6. There were 294 papers published on Automation in Construction, occupying the first place in BIM research, followed by the Journal of Information Technology in construction with 96 papers and the Journal of Computing in Civil Engineering with 64 papers. Among these 10 journals, four were published in the USA and three were published in the UK.
4. The Results of Scientometric Analysis
This section outlines the analytics surrounding co-authors, co-words and co-citations. The Co-Authors Analysis
Section 4.1 consists of co-authorship network, network of countries/regions, and network of research institutes. The Co-Words Analysis
Section 4.2 includes network of co-occurring subject categories and network of co-occurring keywords. The Co-Citations
Section 4.3 includes journal co-citation network author co-citation network and document co-citation network.
4.1. Co-Author Analysis
The information on the authors, research institutions and countries/regions can be obtained from bibliographic records, so as to determine the leading researchers, institutions, and countries/regions of BIM research [
10]. Thereafter, a co-authorship network, as well as a network of co-authors’ institutions and countries/regions, was generated.
4.1.1. Co-Authorship Network
The co-authorship network is shown in
Figure 4. Each node represents an author, and links between the authors represent the collaboration established through co-authors in the article. The node size represents the number of publications, and the thickness of the links represents the level of the partnership in a specified year. The colors of the lines (e.g., blue, green, yellow, orange and red) correspond to different years from 2004 to 2019. The bibliographic records of 1455 BIM documents were analyzed with CiteSpace. There were 312 nodes and 336 links for the co-authorship network.
As shown in
Figure 4, there are multiple closed-loop circuits in the research of collaboration, indicating that researchers in these closed-loop circuits have established strong collaboration. For example, the closed-loop circuit of Rafael Sacks, Yeon-Suk Jeong and Charles M. Eastman implies strong cooperation by these authors in 2008 and 2009. Jochen Teizer and Markus König established strong cooperation in 2019. In addition, several research communities, including multiple authors and one or two productive authors, were identified after the co-authorship network analysis. For example, Xiangyu Wang and Jun Wang are two core authors of a research group which also includes Martijn Truijens, Yi Jiao and Shih-Chung Kang. Inhan Kim is the main author of a research group composed of Shen Zhenghua and Jungho Yu, among others. There are other research communities in recent years, such as those of Liang Ma, Poorang Piroozfar and Ruoyu Jin.
The following two important indicators are usually used to measure the importance of authors, articles, research institutes and countries/regions:
Betweenness centrality (noted with purple rings).
In graph theory, the centrality of nodes is the theoretical property of a graph, which quantifies the position importance of nodes in the network. A commonly used centrality measure is betweenness centrality which is an index measuring the importance of nodes in the network. It is defined as the ratio of the shortest path between two nodes to the sum of all these shortest paths. Nodes with high betweenness centrality usually connect two or more large groups of nodes to each node. This index is used to discover and measure the importance of literature in CiteSpace, and a purple highlighted ring is used to highlight this kind of literature (or authors, periodicals, research institutes, etc.). Clusters in the network can be easily separated and influencing and revolutionary scientific publications can be identified by these nodes. In
Figure 4, purple rings are used for nodes of Xiangyu Wang (centrality = 0.18), Jack C.P. Cheng (centrality = 0.13), Jun Wang (centrality = 0.12), Peter Love (centrality = 0.12) and other several authors, and they connect different groups of authors.
Citation burst detection (noted in red).
Citation burst detection is an important index for studying the most active field. One of CiteSpace’s breakthroughs is to provide a burst item analysis method based on the word frequency growth algorithm, which detects rapidly growing specialized words in a short period of time by counting citation keywords. The characteristics of temporal distribution and dynamic variability of the burst items can better reflect the research fronts and development trend in the knowledge domain. Citation burst detection is used for emergencies, which can last for a year or several years. Citation burst detection can be used as evidence to show that a particular publication is heavily cited at a certain time. In other words, the publication has attracted great attention from the scientific community during that period. Burst detection in CiteSpace is based on Kleinberg algorithm.
Figure 4 shows that four authors received citation bursts of different intensities by red notes. According to the burst strength, the rank was Sacks R (strength = 6.09, 2009–2013), Eastman CM (strength = 3.82, 2009–2012), Jeong YS (strength = 3.32, 2009–2010) and Lee G (strength = 3.13, 2012–2014).
4.1.2. Network of Countries/Regions
To understand the research status of the field of BIM in the world, a network of countries/regions was generated. There are 51 nodes and 113 links in the network. In
Figure 5, the size of nodes represents the appearance frequency of the country in which the author is located in. The larger the circle is, the higher appearance frequency of authors in the country is. The color of the rings represents the authors’ literature publication time in the corresponding country, and the wider the single ring is, the higher appearance frequency of authors in the country is within a certain time period.
As shown clearly in
Figure 5, the circle area of the USA is the largest in the field of BIM research with absolute advantages. It shows that the United States has strong research strength and influence in the field of BIM. China ranks second, suggesting the moderate BIM research power of the country. The United Kingdom ranks third, South Korea ranks fourth and Australia ranks fifth with the frequency of 156. It indicates that progress has been achieved in these countries on BIM research. It can also be seen that European and Asian countries attach great importance to the development of BIM, and that they actively carry out relevant studies in the field of BIM.
In addition, in the area of international cooperation, Canadian researchers have cooperated extensively with researchers from Australia, South Korea, Finland and other countries. The U.K., New Zealand and Germany are connected by relatively thick golden/red lines, indicating a strong partnership between these countries in 2018 and 2019.
The nodes with high betweenness centrality are identified with purple outer rings. As shown in
Figure 5, the representative countries/regions include New Zealand (centrality = 1.25), the United Kingdom (centrality = 0.84), Malaysia (centrality = 0.68), Canada (centrality = 0.64) and Israel (centrality = 0.63). These countries with nodes of high betweenness centrality play an important role in BIM research.
As for citation burst detection, five countries received citation bursts with different strengths at different times. Ranked according to the burst strength, the sequencing is as follows: the United States (strength = 10.49, 2004–2012), Israel (strength = 5.31, 2009–2010), Germany (strength = 279 4.01, 2009–2011), Italy (Strength = 3.65, 2017–2019), and Finland (strength = 3.26, 2009–2015).
4.1.3. Network of Research Institutes
Other than the distribution network of countries/regions, the network of the research institutes in the field of BIM were established as well. It includes 195 nodes and 240 links in total, as shown in
Figure 6.
Figure 6 shows that the frequency (circles) of Curtin University is the highest. It has published the most articles in the field of BIM with absolutely high research strength, followed by Georgia Institute of Technology in the USA, Kyung Hee University in South Korea and Hong Kong Polytechnic University in Hong Kong. This implies that the four institutions have strong research potential in BIM. It is observed that half of the Top 10 research institutes are located in Asia, which can be seen merely from the volume of publications. In recent years, BIM has been widely concerned and actively studied in Asia.
Additionally, the cooperation between different institutes was explored, as shown in
Figure 6. The nodes are the names of the research institutes. The connection between nodes is used to describe the collaboration strength of different research institutes. The color of the connection indicates the time of the first collaboration of the node. The thickness of the connection indicates the collaboration times between the institutes. The thinner the lines are, the fewer times of cooperation there are. Hong Kong Polytechnic University has established extensive collaboration with a number of research institutes in the field of BIM such as Tsinghua University, Queensland University Technology and Birmingham City University. The University of Florida, University of Oklahoma, University North Carolina Charlotte, Calif State University Fresno and DKS Informat Consulting LLC have jointly formed a research group for close collaboration in 2018; these research institutes are connected by thick gold lines.
Furthermore, high betweenness centrality points were identified, as shown by purple outer rings. Representative research institutes include Hong Kong Polytechnic University (centrality = 0.26), University of Washington (centrality = 0.24, Research institutions such as Tongji University (centrality = 0.23) Georgia Institute of Technology (centrality = 0.22) and Kyung Hee University (centrality = 0.20). These research institutes with high betweenness centrality are the hub nodes connected with other research institutes and different clusters.
In terms of citation burst, seven research institutes have received varied strength of citation burst at different times. According to the burst strength, the sequences were Georgia Institution of Technology (strength = 6.63, 2006–2012), Technion-Israel Institute of Technology (strength = 6.57, 2009–2013), University of Salford (strength = 5.69, 2007–2012), University of Newcastle (strength = 4.26, 2011–2013), UCL (strength = 3.62, 2017–2019), Virginia Polytechnic Institute and State University (strength = 2.98, 2011–2013) and University of Reading (strength = 2.98, 2013–2014).
4.2. Co-Word Analysis
With more and more countries and research institutes focusing on BIM research, there are various studies on different topics, subjects and keywords. Co-word analysis aims to study the internal correlation and scientific structure of the literature through the statistical analysis of the keywords that reflect the subject of the literature. Co-word analysis can help estimate trends and conduct front research.
4.2.1. Network of Co-Occurring Subject Categories
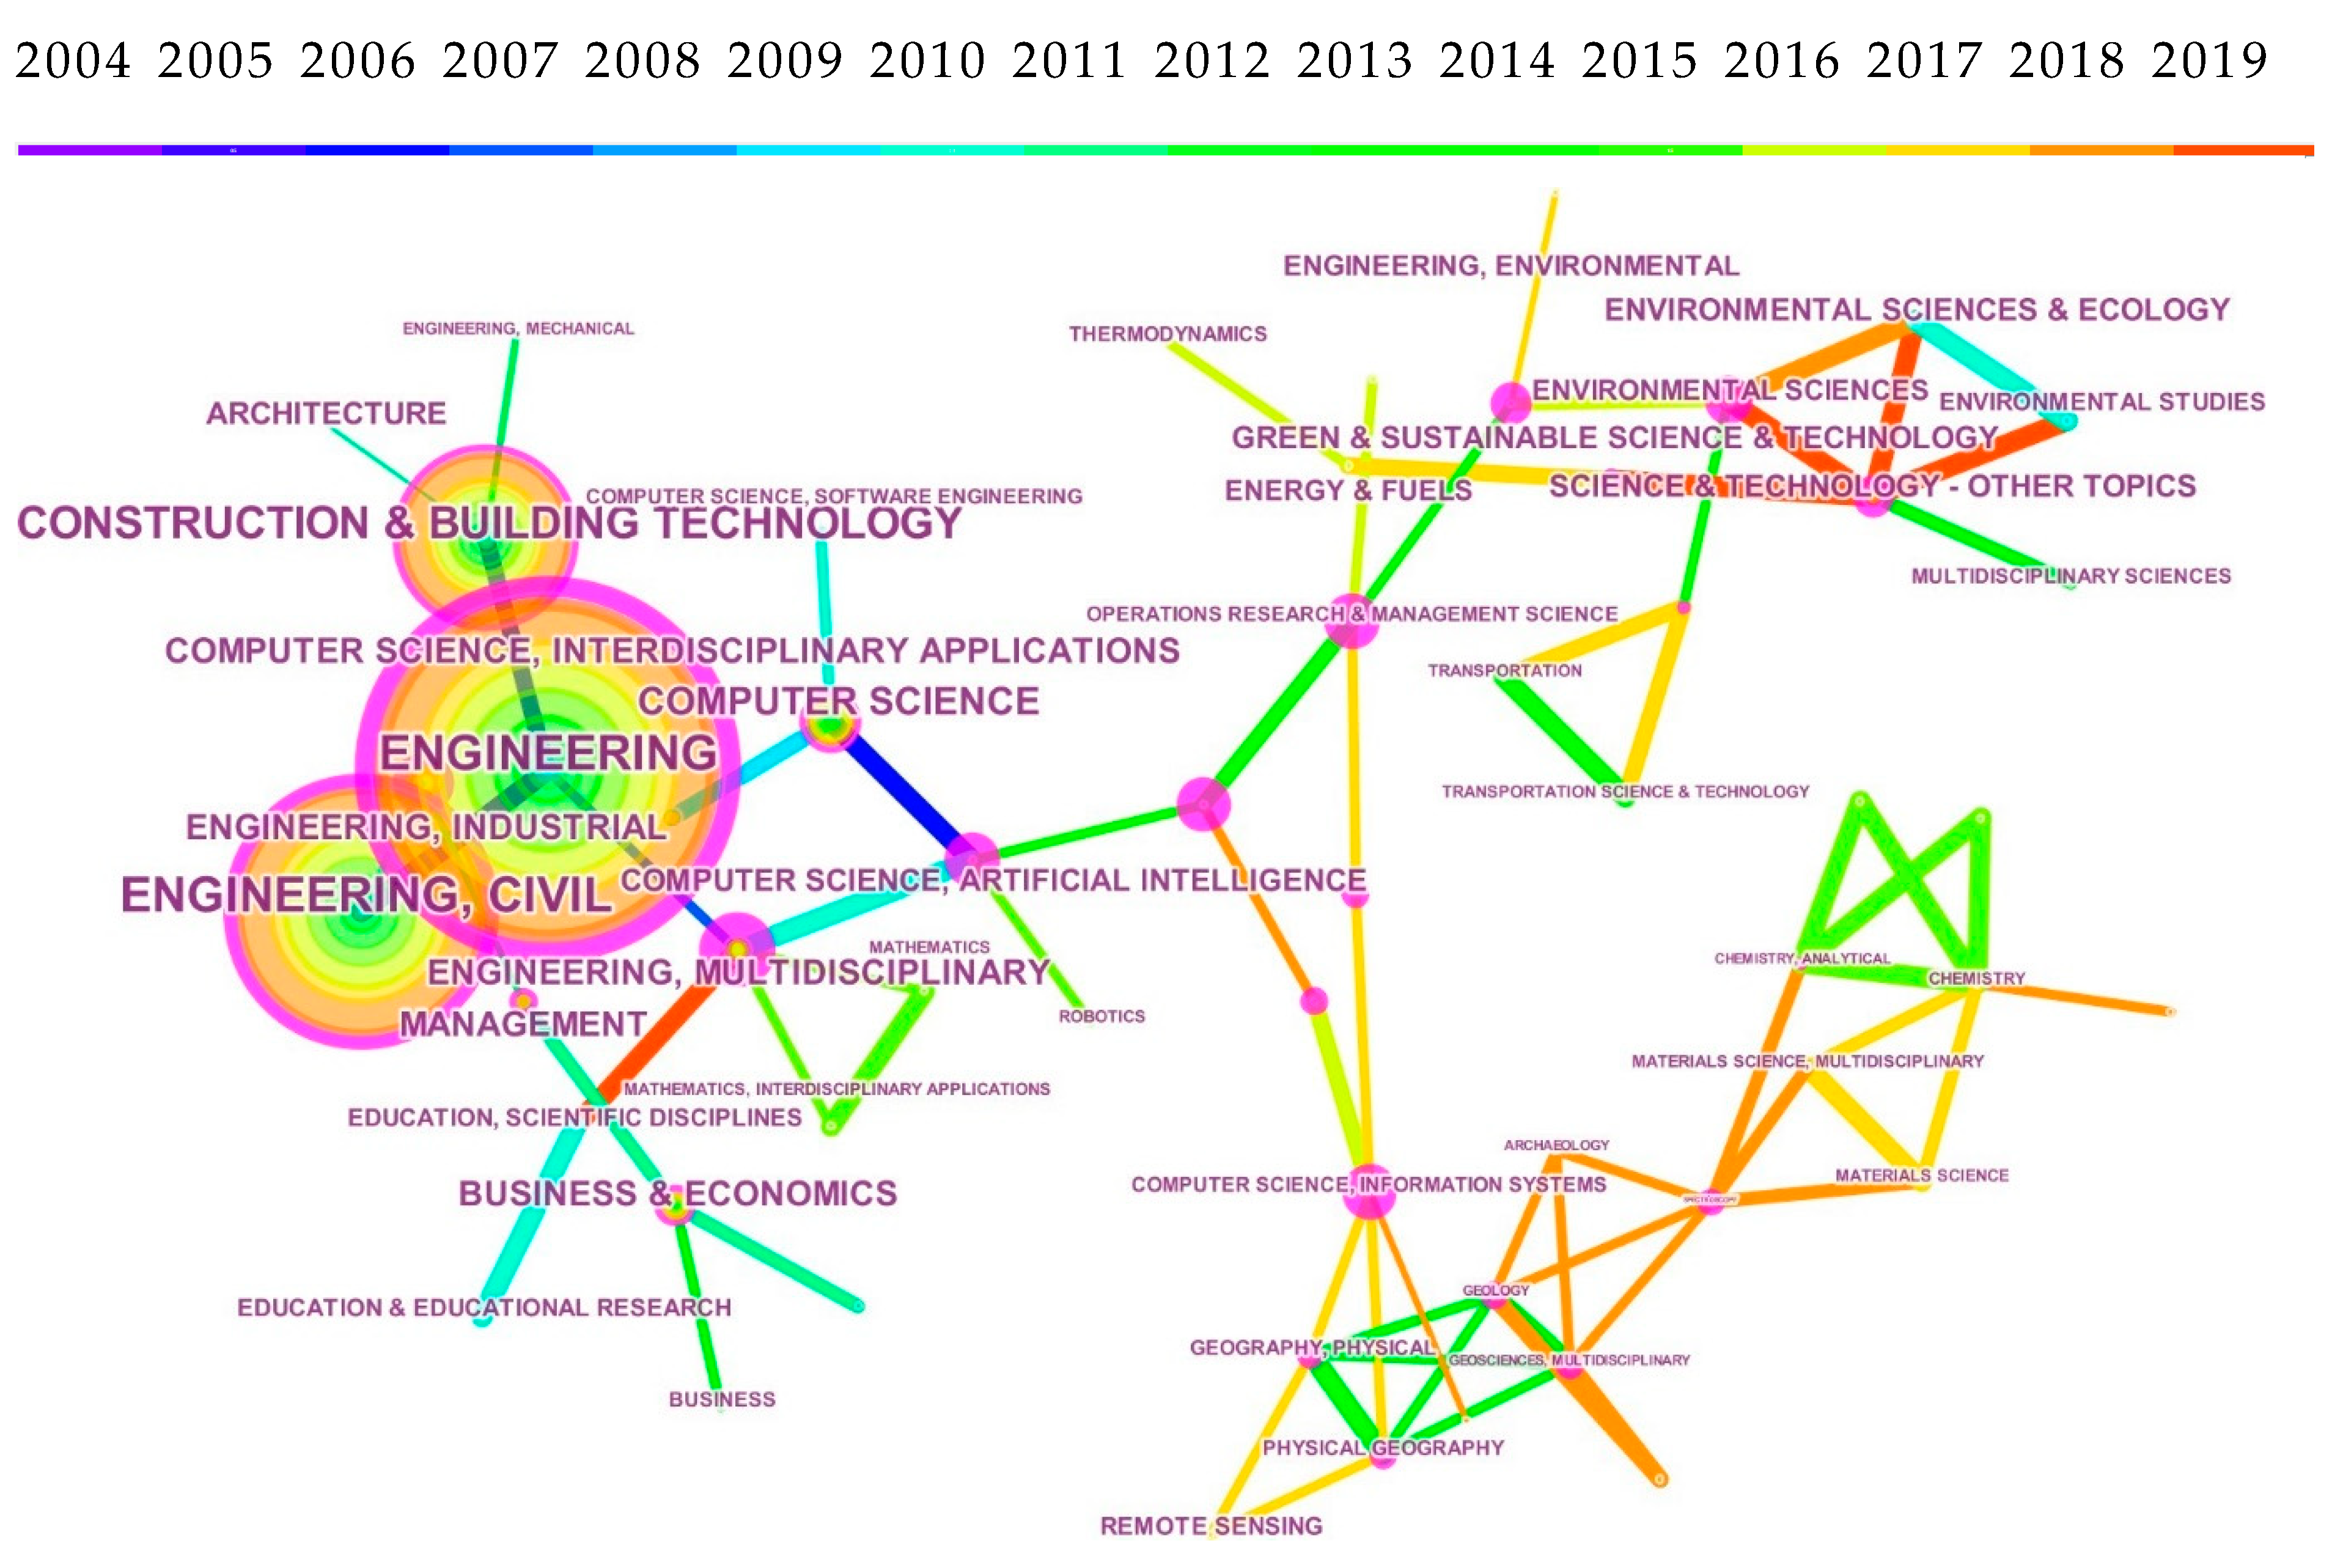
Each journal publication from Web of Science Core Collection database was assigned to one or more subject categories based on relevant journals. A network of subject category research was generated with 62 nodes and 135 links. This network was used to analyze the emerging trend of BIM research, as shown in
Figure 7.
In
Figure 7, the node size represents the number of articles in each category. Among them, the frequency of Engineering is the highest, followed by Engineering Civil, Construction and Building Technology, Computer Science, Engineering, and Multidisciplinary and Engineering Industry. It manifests that most BIM articles were assigned to these categories.
It should also be noted that, in the past two years, subjects such as Green and Sustainable Science and Technology, Science and Technology-Other Topics and Environmental Studies have also attracted the attention of scholars. It is worth mentioning that there are 58 articles in the category of Green and Sustainable Science/Technology and 187 articles about Computer Science. Thus, it implies that the potential of BIM in energy and environmental analysis and sustainable design has been recognized and attached with great importance by the academic community.
Furthermore, nodes with high betweenness centrality are highlighted by purple outer rings, including Computer Science, Artificial Intelligence (centrality = 0.80), Engineering, Electrical and Electronic (centrality = 0.76), Computer Science, Information Systems (centrality = 0.68) Engineering, Multidisciplinary (centrality = 0.66), and Operations Research and Management Science (centrality = 0.65). They represent the turning point connecting different stages of research, which has a significant impact on the development of BIM research.
Nine categories have received citation bursts of different strengths at different times. According to the burst strength, the sequence was: Green and Sustainable Science and Technology (burst strength = 7.53, 2017–2019), Remote Sensing (burst strength = 6.19, 2017–2019), other topics of Science and Technology (burst strength = 5.72, 2017–2019), Architecture (burst strength = 5.41, 2004–2019), Geography, Physical (burst Strength = 5.16, 2017–2019), Physical Geography (burst strength = 5.16, 2017–2019), Robotics (burst strength = 4.89, 2014–2015) and Engineering, Environmental (Burst Strength = 3.70, 2017–2019). It indicates that these categories of publications are the most active fields in the research and development of BIM.
4.2.2. Network of Co-Occurring Keywords and Clusters Analysis
Keywords play a role in summarizing the content of literature studies. To a certain extent, they represent the research content of an article. The centrality of network nodes is one of the key indexes reflecting the core degree of nodes, which can be used to measure the importance of some node in the network as well as its correlation with other nodes. Therefore, the core issue or focus of scientific researchers can be reflected by the keywords with high centrality and frequency. There are two types of keywords in the literature database of Web of Science: “author keyword” provided by the authors and “keyword +” identified by journals. The co-occurring keyword network is constructed by the two types of keywords in bibliographic records. There are similar keywords in all bibliographic records, such as “BIM”, “building information modeling”, “Building information modelling”, “building information modeling (BIM)”, and “Building information modelling (BIM)”. The function of merging similar keywords in CiteSpace is used to merge these similar keywords to “Building Information Model”.
When analyzing the research hotspots of BIM, the network node was set to “Keyword”, and the synonymous keywords were merged after running the software to obtain the keyword co-occurring network in the research literature, as shown in
Figure 8. Each keyword in the map is represented by a square node. A larger block size represents a higher frequency of the keyword shown in the field of BIM research, i.e., they are high-frequency keywords. The purplish-light red square nodes represent the high centrality of the keywords and their close correlation with other keywords. For this, there were 160 nodes and 516 links in the co-occurring network.
The keywords with high frequency and high centrality in BIM research literature in the recent decade are shown in
Table 7. The Top 10 keywords in the literature were Building Information Model (frequency = 738), Construction (frequency = 359), Design (frequency = 213), System (frequency = 195), Management (frequency = 190), Model (frequency = 138), Framework (frequency = 97), Project (frequency = 95), Industry (frequency = 87), and Performance (frequency = 85). Combined with high centrality keywords, we can find that the hot areas of global BIM research in the recent decade include design, project, framework, industry and model. Keywords with high betweenness centrality are correlated with different research subjects, which have a significant impact on the development of BIM research as well.
Besides, citation bursts were observed for the following eight keywords: Building information model (burst strength = 11.66, 2008–2014), Adoption (burst strength = 5.80, 2017–2019), Interoperability (Burst strength = 5.63, 2007–2013), 4D CAD (burst strength = 4.57, 2011–2014), Cloud Computing (burst strength = 4.38, 2012–2014), Generic Algorithm (burst strength = 4.26, 2014–2016), Energy Efficiency (burst strength = 4.25, 2014–2016) and Augmented Reality (burst strength = 4.04, 2013–2015), indicating that these are the hotspots of BIM research in corresponding years.
Clustering in data mining is a process of aggregating and classifying data in complex networks according to similarity. In keyword clustering analysis, the similarity of nodes in the network is reflected, which is conducive to identifying and detecting representative knowledge subgroups in a certain field of research, i.e., the hot subjects in the research field. The network node was set to “Keyword” for clustering on the basis of the generation of keyword co-occurring network. Finally, the keyword clustering network in the field of BIM research was obtained, as shown in
Figure 9.
BIM research hotspots can be summarized into 13 subjects: #0: research review (Silhouette = 0.79, Size = 19); #1: building design (Silhouette = 0.832, Size = 16); #2: modeling path (Silhouette = 0.971, Size = 14); #3: Construction engineering (Silhouette = 0.838, Size = 13); #4: interior construction progress monitoring (Silhouette = 0.913, Size = 13); #5: Ontology-based partial building information model extraction (Silhouette = 0.826, Size = 12); #6: facility management (Silhouette = 0.872, Size = 10); #7: space conflict (Silhouette = 0.853, Size = 10); #8: lean production management system (Silhouette = 0.765, Size = 9); #9: construction supply chain management (Silhouette = 0.914, Size = 8); #10: object-oriented model (Silhouette = 0.938, Size = 8); #11:repetitive construction project (Silhouette = 0.918, Size = 8); #12: integrating resource product (Silhouette = 0.856, Size = 8); and #13: Organization Division (Silhouette = 0.962, Size = 7). The larger the value of silhouette is, the more obvious the cluster effect is, while a smaller value of silhouette leads to an insignificant effect.
4.3. Co-Citation Analysis
When two documents are cited by a third document simultaneously, there will be co-citation relationship between the two documents [
4,
20]. The citation frequency of literature can objectively reflect the degree to which the literature can be recognized by the academic community or the knowledge domain, as well as the position of the literature in the network. Continuously highly cited literature is considered classical in a certain field, while the early foundational literature and seminal literature in a field could reflect the development and research basis of the studies in that field. CiteSpace software was used to perform co-citation analysis of journals, authors and documents. BIM’s co-citation network was generated, in which the meaning of the size and color of the nodes and the thickness and color of the links are similar to the interpretation of the previous networks.
4.3.1. Journal Co-Citation network
The journal co-citation network in the field of BIM was established using CiteSpace software. There were 261 nodes and 644 links in the network.
As shown in
Figure 10, the five most influential journals were Automation in Construction (frequency = 1071), Journal of Construction Engineering and Management (frequency = 548), BIM Handbook (frequency = 475), Advanced Engineering Informatics (frequency = 451) and Journal of Computing in Civil Engineering (frequency = 447). These five journals are also the most published source journals in the field of BIM.
In
Figure 10, some nodes with high betweenness centrality are highlighted with purple rings, such as International Journal of Project Management (centrality = 0.22), Journal of Construction Engineering and Management (centrality = 0.20) and Energy and Buildings (centrality = 0.11). These journals represent major academic turning points and interrelated journals published at different stages.
In addition, citation burst was found in the following representative journals: Journal of Information Technology in Construction (burst strength = 19.09, 2008–2013), Automation In Construction (burst strength = 18.5, 2006–2014), Building Product Models: Building Product Models: Computer Environments, Supporting Design and Construction (Book) (burst strength = 14.63,2005–2012), Cost Analysis of Inadequate Interoperability in the US Capital Facilities Industry (Book) (burst strength = 8.12, 2009–2014) and Computer-Aided Design (burst strength = 8.05, 2006–2013). It shows that the articles published in these journals were widely cited in a short period of time, therefore, they are worthy of attention.
4.3.2. Author Co-Citation Network
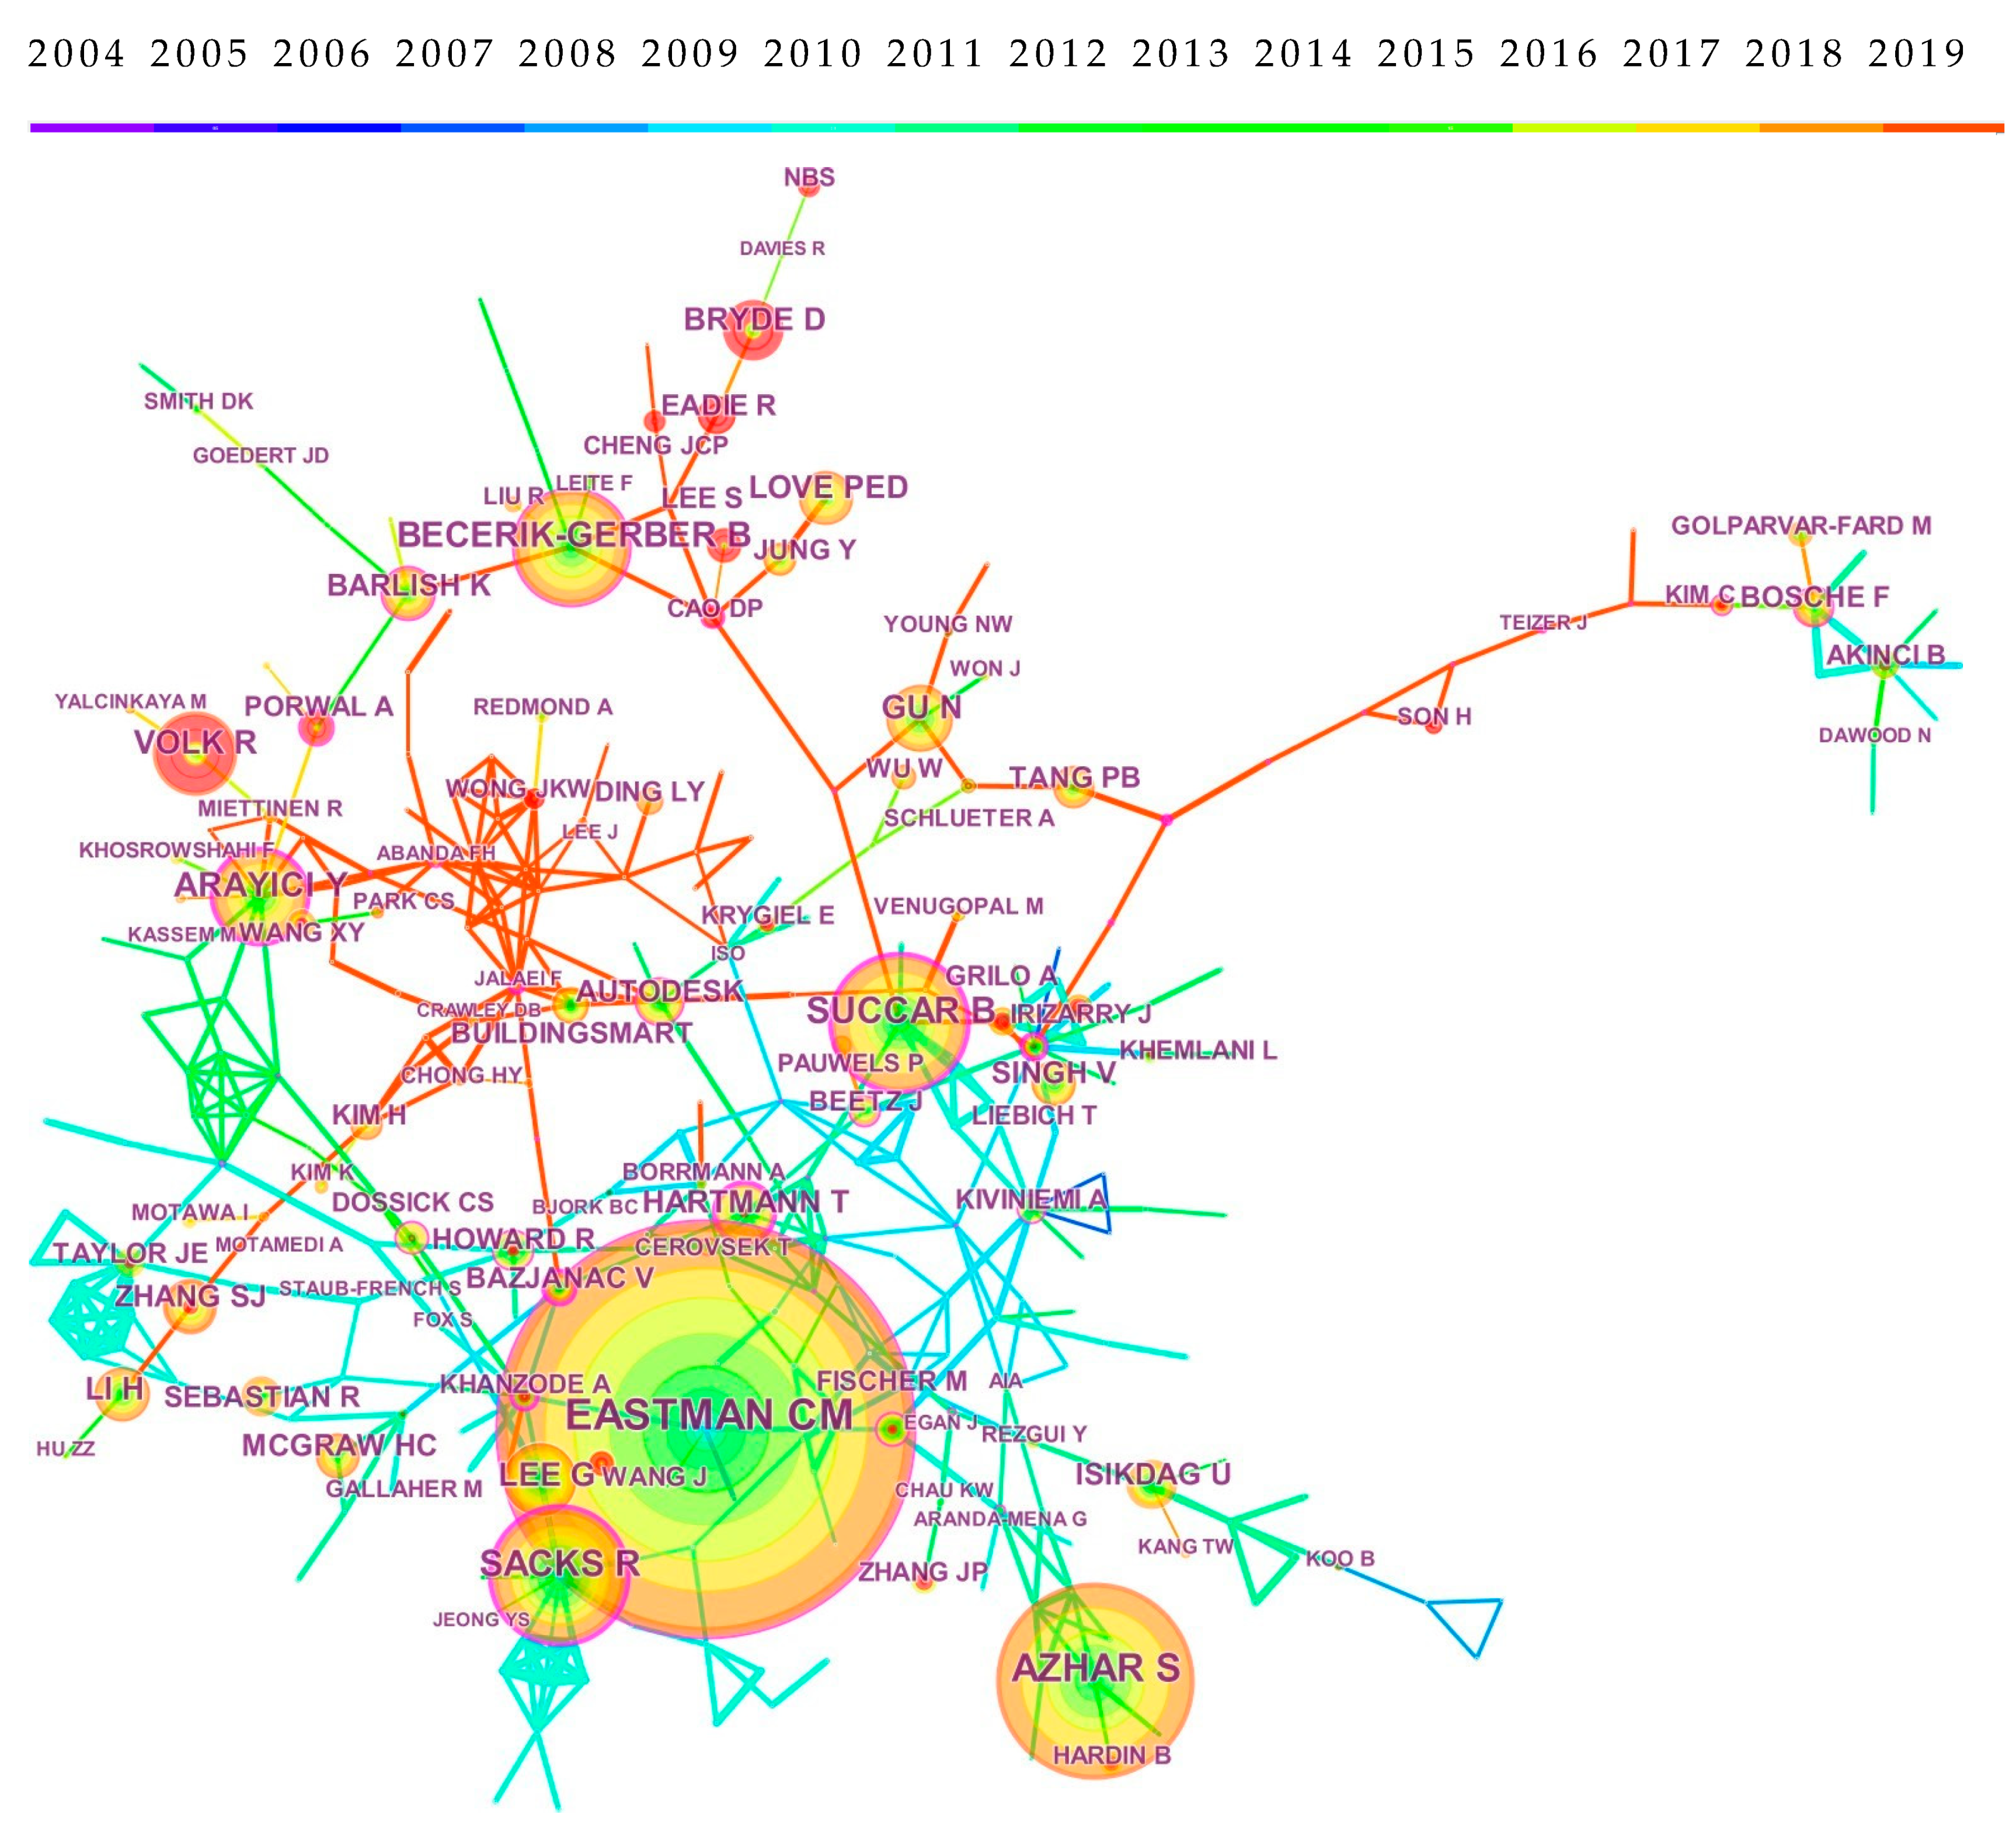
Author co-citation analysis can be used to identify the relationship between the authors cited in the same article and analyze the evolution of the research group. The author co-citation network in the field of BIM is shown in
Figure 11, consisting of 308 nodes and 757 links. The meaning of the size and color of nodes as well as the thickness and color of links in the map is interpreted similarly to that of the previous maps.
As shown in
Figure 11, the Top 10 authors were Charles M. Eastman (frequency = 621, USA), Salman Azhar (frequency = 300, USA), Rafael Sacks (frequency = 212, Israel), Bilal Succar (frequency = 208, Australia), Burcin Becerik -Gerber (frequency = 184, USA), Yusuf Arayici (frequency = 145, Turkey), Rebekka Volk (frequency = 127, Germany), Ghang Lee (frequency = 125, South Korea), Ning Gu (frequency = 115, Australia), and Heng Li (frequency = 100, Hong Kong). The diversity of the most cited authors’ locations indicates that BIM research has been widely carried out around the world.
Authors with high betweenness centrality are identified with purple rings. The nodes with purple rings means that the authors enjoy high betweenness centrality, representative authors include Arayici Y (centrality = 0.25), Succar B. (centrality = 0.24), and Sacks R (centrality = 0.23) c. They are the main intellectual drivers of BIM research and interrelated research in different research groups.
Several authors have experienced citation bursts with the frequency of citations increasing rapidly in a short period of time. According to citation burst strength, the Top 5 authors are Michael P. Gallaher (burst strength = 10.8136, 2009–2014), Lachmi Khemlani (burst strength = 10.59 2009–2013), Kiviniemi Arto (burst strength = 10.26,2007–2012), Bo-Christer Björk (burst strength = 8.27, 2009–2012) and Bonsang Koo (burst strength = 7.86, 2009–2014). These authors can affect the direction of BIM research, thus their articles are worthy of attention.
4.3.3. Document Co-Citation Network
Document co-citation analysis can be used to analyze the underlying structure of a knowledge field and show the number and authority of citations. During the analysis of this document co-citation, the co-citation clusters were also confirmed by CiteSpace. The document co-citation network is shown in
Figure 12, with 394 nodes and 851 links. Each node represents a document and is marked with the name of the first author and the year of publication. Each link represents the co-citation relationship between two corresponding documents. The node size shows the co-citation frequency of documents. Documents with high betweenness centrality and citation burst are highlighted by purple rings and red rings, respectively.
As shown in
Figure 12, the 2008 and 2011 versions of BIM Handbook [
24,
25] published by Charles M. Eastman et al. received 266 and 143 co-citations, respectively, followed by 134 co-citations of Salman Azhar [
2], 130 co-citations of Bilal Succar [
26] and 129 co-citations of Rebekka Volk [
27]. These articles are worthy of attention. Representative documents with high betweenness centrality were those of Arayici Y et al. [
28] (centrality = 0.52), Timo Hartmann et al. [
29] (centrality = 0.49), Salman Azhar [
30] (centrality = 0.46), Timo Hartmann et al. [
31] (centrality = 0.46) and Stefan Boddy et al. [
32] (centrality = 0.40).
Several documents have received citation bursts, of which the representative ones include those by Charles M. Eastman (burst strength = 19.65, 2009–2015), Rob Howard et al. [
33] (burst strength = 9.78,2010–2015), Timo Hartmannt [
31] (burst strength = 7.86, 2011–2015), Rafeal Sacks et al. [
34] (burst strength = 6.92, 2006–2012) and Rafael Sacks [
35] (Burst Strength = 6.55, 2012–2014), which indicates that there was a significant increase in the number of citations of these documents over a short period of time in the corresponding years.
5. A Revolution in Global BIM Research
BIM is a revolutionary technological development that is rapidly reshaping the AEC industry and transforming the way we build. This aim of this section is to identify the significant co-citation clusters to determine the key or anchor representative research and categorize the global BIM research over the past 16 years into three stages: infancy stage, maturity stage and expansion stage.
As the core and essence of articles, keywords can be used as proxies to summarize research hotspots in terms of directions and topics [
36]. A significant feature and function of CiteSpace is to probe and identify the research hotspots in related fields through the analysis of keyword frequencies [
36]. There are three cluster analysis algorithms in CiteSpace: latent semantic indexing (LSI), log-likelihood ratio (LLR) and mutual information (MI). In this study, LLR algorithm was used to select the optimal cluster label according to uniqueness and coverage, as recommended by Chen [
37].
Based on the keywords of the documents cited in each cluster, 12 significant co-citation clusters were identified, as illustrated in
Figure 13. There were 40 members in #0 “building information model”, which was the largest. The number in cluster #11 “total construction as-built documentation” was the smallest, with only five members.
The Top 3 representative articles in each cluster are also shown in
Figure 13; for instance, in Cluster #7 Construction safety planning, the Top 3 representative articles were by Chuck Eastman et al. [
38], Javier Irizarry et al. [
39] and Umit Isikdag et al. [
40]. Alternative tags with the second and third highest LLR scores are also shown in
Table 8, in which clusters are sorted by size (i.e., the number of documents/members).
Silhouette metric in clusters was used to measure the average homogeneity of the clusters. A high silhouette score indicates high consistency of cluster members in clusters of similar sizes. The score range of the above 11 clusters was 0.858–0.996, suggesting high consistency of members in each cluster. Mean year of publications suggests whether the cluster consists of the latest published documents or the old ones, through which it can be found that Cluster #4 “integral part” consists of old documents, while Clusters #6 and #10 consist of new documents. In addition, representative documents of each cluster refer to the Top 3 documents with most co-citation frequency in a cluster. These representative documents have a profound impact on the label of the cluster, which is worthy of attention.
Note: Rows for Clusters #0–#4 and #9 are classified to the formulating stage; for Clusters #5–#8, to the accelerating stage; and for Clusters #10 and # 11, to the transforming stage.
5.1. Evolution of Global BIM Research
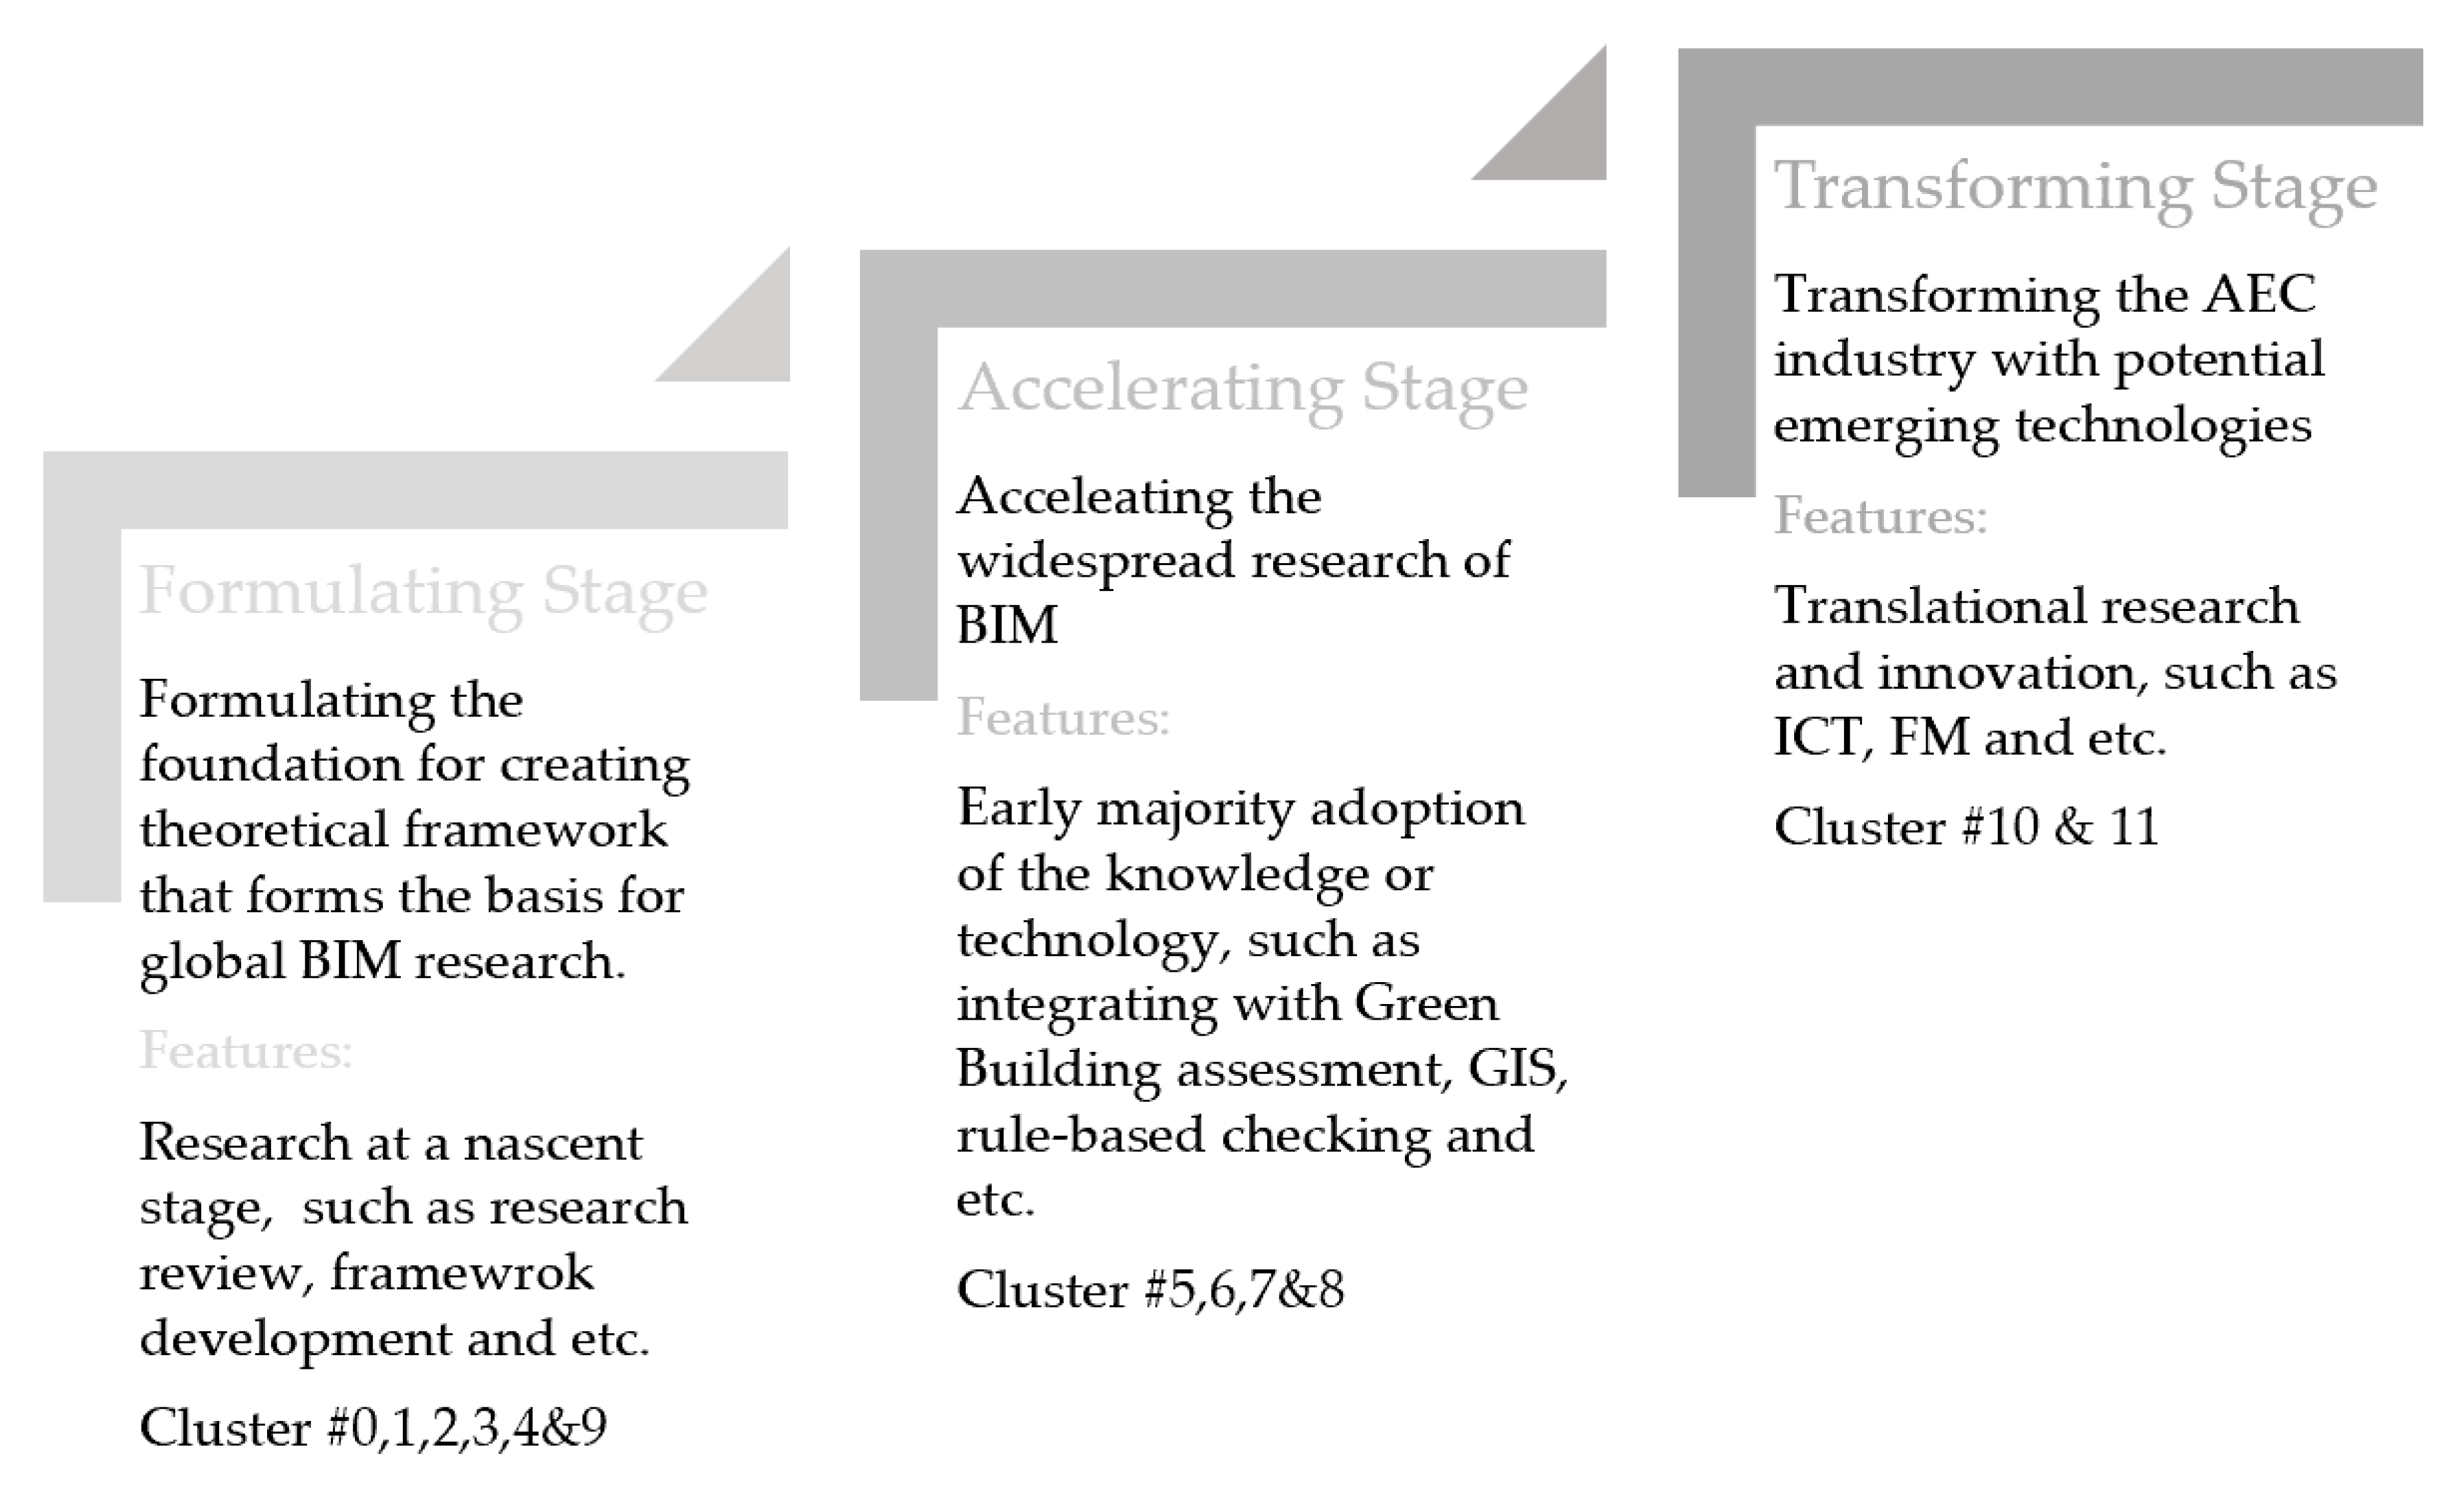
Clustering is essentially the grouping of a set of objects in such a way that objects in the same group, herein called a cluster, are more similar in traits or features to each other than to those in other groups. It is an iterative process of knowledge discovery, or interactive multi-objective optimization that involves trial and error. There are several types of clustering, such as strict partitioning clustering, strict partitioning clustering with outliers, hierarchical clustering, overlapping clustering and subspace clustering. Strict partitioning clustering with outliers, which is a type of hard clustering, was adopted in this study. These clusters, which are formed based on document co-citation, as well as the formulating stage, accelerating stage or transforming stage, are distinguished by the cluster labels of global BIM research. The cluster labels are used as a proxy to determine the diffusion of innovation or technology adoption stage. For Clusters #0–#4 and #9, it can be inferred that the research has been expanded and translated into industry practice; for Clusters #5–#8, it can be inferred that the research direction is at the accelerate stage, suggested by early to early majority adoption of the knowledge or technology; and for Cluster #10 and #11, it can be inferred that the research thrust for that cluster is innovative and at a nascent, transforming stage, as illustrated in
Figure 14.
5.2. Evolution of Global BIM Research
Formulating stage means formulating the foundation for creating theoretical framework that forms the basis for global BIM research. At this stage, research themes are summarized in the following aspects: (1) research review in BIM; (2) conceptual BIM framework; and; (3) building BIM capability.
5.2.1. Formulating Stage—Research Review
There were 40 members in Cluster #1 “Research Review”. The Top 3 representative articles were published by Carrie S. Dossick [
43], Rafael Sacks [
44] and Timo Hartmann [
29], all of which were published in the “Journal of Construction Engineering and Management”. Carrie S. Dossick et al. [
43] (frequency = 46) reviewed related work on what caused successful technology adoption both in the AEC industry and in general. The application of BIM technology in MEP coordination as well as how the cooperation and communication are affected by introduction of BIM were also studied by them. Their findings show that BIM-enabled projects are often technically coupled but with organizational differences. It also suggests that organization power and structure should be considered for the successful performance of BIM. Rafael Sacks et al. [
44] (frequency = 39) reviewed different concepts and BIM of lean construction in the life cycle of the whole projects. On this basis, an analytical framework or classification was established to evaluate the interrelationship between lean construction and BIM. Timo Hartmann et al. [
29] (frequency = 27) qualitatively summarized and reviewed the results of 26 case studies applying 3D/4D models to construction projects, showing researchers and practitioners the challenges of applying 3D/4D model to projects. The challenges faced by 3D/4D models in test cases by practitioners were elaborated by them as well. The main analytical results show that project practitioners in most of the test cases use the model only in one application domain. This article suggests that further research is needed on how to integrate 3D/4D modeling technology into the work and business processes conducted by project teams, thereby making wider use of the 3D/4D models throughout the life cycle of the project.
There were 33 members in Cluster #2 “literature review”. The Top 3 representative articles were published by Rebekka Volk [
27], David Bryde [
45] and Ning Gu [
46]. Rebekka Volk et al. [
27] (frequency = 27) reviewed more than 180 articles on BIM for existing buildings. The results show that the lack of implementation of BIM for existing buildings is caused by the following factors: (1) high modeling/transformation efforts from captured building data to semantic BIM objects; (2) the information update in BIM; and (3) handling of uncertain data, objects and relationships in BIM of existing buildings. David Bryde et al. [
45] carried out a literature review on BIM, collected information on 35 building projects using BIM, and explored the benefit degree of BIM application to a cross-section of the construction projects. The study also provided a set of criteria for project success, using analysis to determine the degree of compliance of each project to the criteria. The study also pointed out that the most frequently reported benefits were related to cost reduction and control in the life cycle of projects, and that negative benefits were mainly concentrated on the use of BIM software. Cost–benefit analysis, awareness improvement, education and training are key responses to the challenge of BIM use. Ning Gu et al. [
46] (frequency = 90) did a literature review for BIM-related academic publications, white papers, technical reports from major technology providers, guidelines, online newsletters and government reports. They analyzed the present situation of BIM in the AEC industry and reevaluated its role and potential contribution in the future. They analyzed the preparation of products, processes, and personnel in the industry to locate the adoption of BIM according to the cross-domain status quo and expectation. This paper suggests that there are many factors that may affect the adoption of BIM, of which the functional requirements of technical tools and non-technical strategic issues are two primary factors.
Observation 1: At formulating stage, many authors conduct research review in BIM, theoretical exploration of BIM origins, foundations, relevant theories and emerging scenarios to lay the foundation of the BIM development, such as Clusters #1 and #2.
5.2.2. Formulating Stage—Conceptual BIM Framework
There were 36 members in Cluster #0 “Building Information Model”. The Top 4 representative articles were published by Succar Bilal [
26], Rob Howard [
33], James D. Goedert [
41] and Dana K. Smith [
42]. Succar Bilal [
26] (frequency = 130) explored a number of open BIM international guidelines and developed the BIM framework. Rob Howard et al. [
33] (frequency = 51) discussed BIM and IFC and proposed a framework for a preliminary outline that should be developed into a precise tool with the function of case comparison. James D. Goedert et al. [
41] (frequency = 29) created 3D and 4D completion models, and attached construction process information to the models so that the owners could use them after construction. The research results show that BIM program and software need to be modified to obtain the construction process documents. Dana K. Smith et al. [
42] (frequency = 29) published a book based on strategic thinking which could help readers to understand the whole situation and refine the BIM workflow, thus showing the potential of BIM construction by all participants in the industry.
There were 31 members in Cluster #3 “Construction Project”. The Top 3 representative articles were published by Salman Azhar [
2], Youngsoo Jung [
47] and Pingbo Tang [
48]. Salman Azhar et al. [
2] (frequency = 134) mentioned that BIM could simulate construction project in a virtual environment. The prospect of BIM was also discussed by them, showing that the future of BIM is exciting and challenging. It was expected that an increasing number of BIM applications may help to strengthen the collaboration of AEC industry, reduce fragmentation, ultimately improve performance and reduce project costs. Youngsoo Jung et al. [
47] (frequency = 59) proposed a comprehensive BIM framework to evaluate promising areas and to identify driving factors for practical applications in real-world construction projects. Pingbo Tang et al. [
48] (frequency = 54) presented an approach that can be used to automate create the process of as-built BIMs for construction projects.
Cluster #9 “Project Information Management Framework” contained 18 members. The Top 4 representative articles were published by Charles M. Eastman [
25], M. Venugopal [
59], Jim Steel [
60] and Fernanda Leite [
61]. Charles M. Eastman et al. [
25] (frequency = 266) published the 2nd Edition, 2011 version of BIM Handbook. M. Venugopal et al. [
59] (frequency = 21) proposed to use the model view definition (MVD) concept as an object-oriented and modular mechanism, so as to embed semantic meaning in model views. The conclusion of the paper is that the Industry Foundation Classes (IFC) model lacks a formal definition of entities, attributes and relationships despite the rich expression of the IFC product model. It suggests that the modularization and logical framework of formal specifications based on IFC concepts should be further studied to achieve standardized and reusable model views. Jim Steel et al. [
60] (frequency = 14) presented experiences with issues of model-based interoperability in exchanging building information models between various tools, particularly using the industry standard IFC data modeling format. Fernanda Leite et al. [
61] (frequency = 14) evaluated the modeling work related to different levels of detail generation in BIM and the role levels of development (LoD) played in supporting the design coordination of mechanical, electricity and plumbing (MEP). The results show that the total modeling time from one LoD to another increases, from double to 11-fold the modeling work. The research shows that additional modeling work can contribute to more comprehensive analysis and better decision support in the process of design and construction.
Observation 2: The conceptual BIM framework is developed to satisfy the niche BIM-based application.
5.2.3. Formulating Stage—Building BIM Capability
There were 28 members in Cluster #4 “Integral Part”, with first alternative label “Civil engineering education” and second alternative label “Teaching Building Information Modeling”. The Top 3 representative articles were published by Charles M. Eastman [
25], Vishal Singh [
49] and Tomo Cerovsek [
50]. Charles M. Eastman et al. [
25] (frequency = 143) published a BIM Handbook (2008) which brought together information about current BIM, history and potential future in a convenient location. It can be used as a convenient reference book or a technical support for buildings involved in design, construction and operation. Vishal Singh et al. [
49] (frequency = 73) developed a BIM-server based multi-disciplinary integrated collaboration platform. Tomo Cerovsek [
50] (frequency = 45) proposed an improved method, framework and schemata of integrated BIM tools and patterns through the critical review of building product modeling, including the development of communication standards and the characteristics of more than 150 AEC/O (building, engineering, construction and operations) tools and digital models.
Observation 3: BIM capability is built by developing educational curriculum structure around BIMs use-case, such as Cluster #4.
5.3. Accelerating Stage
The theoretical foundation developed under formulating stage forms the knowledge-based for BIM research during the accelerating stage. Accelerating stage means accelerating the widespread research of BIM and kick-starting the transition from traditional 2D based workflow to an object-orientated workflow. At this stage, research focuses on the integration of BIM and other related technologies such as GIS, energy calculation, rule-based checking and the development of BIM application.
There were 27 members in Cluster #5 “building information modeling”. The first three representative articles were published by Salman Azhar [
30], Arno Schlueter [
51] and Burcin Becerik-Gerber [
52]. Salman Azhar et al. [
30] (frequency = 56) demonstrated the application of BIM in sustainable design and LEED
® certification with real cases. The results of this study show that the documents supporting LEED credits can be compiled directly or indirectly using the results of BIM-based sustainable analysis software. Compared with traditional methods, this process simplifies the LEED
® certification process and saves a lot of time and resources. Arno Schlueter et al. [
51] (frequency = 39) developed a BIM-based prototypical tool to support graphical visualization of instantaneous energy, energy calculations and result performance metrics. Burcin Becerik-Gerber et al. [
52] (frequency = 36) reviewed extensive cases and provided anecdotal evidence to support the view that the use of BIM could make the construction process more efficient. They also presented the results of an industry-wide online survey. The aim of their study was to understand the perceived value of BIM in the American construction industry, with particular attention paid to the actual benefits and costs associated with the use of BIM at the project level.
There were 24 members in Cluster #6 “inspecting post-construction energy efficiency”. The Top 3 representative articles were published by Alan Redmond [
53], Lieyun Ding [
54] and Johnny Kwok Wai Wong [
55]. Alan Redmond et al. [
53] (frequency = 36) put forward an integrated platform of cloud BIM using the cloud calculation as BIM application based on the semi-structured interview for 11 expert interviewees. The platform also includes applications such as energy performance analysis, which was designed to identify the energy use and energy needs of HVAC partitions in the early design phase, as well as BIM applications, so as to take advantage of the corresponding 3D, 4D, and 5D features. Lieyun Ding et al. [
54] (frequency = 27) developed a BIM application framework to outline BIM applications in the construction industry, such as project quality, safety and environmental management. The expansion process from 3D to computable nD model, especially the method of integrating safety, quality and carbon emission variables into BIM, was described and analyzed as well. Johnny Kwok Wai Wong et al. [
55] (Frequency = 23) reviewed and compared 84 Green-BIM-related documents, of which 44 were in the design stage, 25 in the construction stage, 8 in the maintenance and retrofitting stage and 12 in the demolition stage. The authors also suggested that the use of “one-stop” BIM technology should be promoted for environmental sustainability monitoring and management throughout the life cycle of buildings in future studies. Meanwhile, the use of cloud-based BIM technology should be considered, thereby using “big data” to manage the sustainability of buildings.
There were 23 members in Cluster #7 “construction safety planning”. The Top 3 representative articles were published by Charles M. Eastman [
38], Javier Irizarry [
39] and Umit Isikdag [
40]. Charles M. Eastman et al. [
38] (frequency = 46) explored a rule checking system which evaluated architectural design according to different criteria, such as building code and construction safety. It also mentioned that the rule-based checking system was still in an early stage. Javier Irizarry et al. [
39] (frequency = 34) integrated BIM and geographic information system (GIS) into a unique system that tracked the status of the supply chain and provided early warning signals to ensure the delivery of materials. Umit Isikdag et al. [
40] (frequency = 13) showed that high-level geometric and semantic information obtained from BIMs can be transferred to the geospatial environment, the results of which suggest that sufficient level and quantity of geometric and semantic information related to buildings are provided by BIMs to achieve seamless automation of data management tasks in the process of location selection and fire response management.
There were 21 members in Cluster #8 “modeling organization”. The first three representative articles were published by Rafael Sacks [
56], Cabinet Office [
57] and Guillermo Aranda-Mena [
58]. Rafael Sacks [
56] (frequency = 16) carried out an experimental study on BIM and product data exchange in the design and production of the building prefabricated facade. The study also showed that there are no restrictions on the use of existing software to design and refine prefabricated facade. The production of the same set of drawings shows a 57% increase in productivity compared to the CAD process. However, the data exchange between the building and the prefabricated engineering system is incomplete and inconsistent, which confirms the necessity of the BIM exchange standard. Current Industry Foundation Classes (IFC version 2 × 3) model lacks a predefined set of entities and attributes. Cabinet Office [
57] (Frequency = 11) is a government construction strategy published by the British government in an effort to improve the productivity and save costs in the construction industry. Guillermo Aranda-Mena et al. [
58] (frequency = 10) investigated 47 value propositions using BIM through several case studies in Australia and Hong Kong. They focused on the challenges and benefits for architectural and engineering consultants. In addition, the findings were coded, interpreted and synthesized to identify the challenges and business drivers. The authors also found that the shared understanding of BIM application on business drivers ranged from commercial to high-rise building projects, especially for managing the process of design and construction.
Observation 4: At this stage, research on BIM application was revolutionized to be incorporated with other technologies such as energy calculation, GIS and rule-based checking.
5.4. Transforming Stage
This stage focuses on transforming the AEC industry with potential emerging technologies and getting the stakeholders to use BIM extensively in a streamlined and integrated manner over the building life cycle.
There were 14 members in Cluster #10 “automated IFC-based workflow”. The Top 3 representative articles were published by Rizal Sebastian [
62], Mehmet Yalcinkaya [
63] and Heap- Yih Chong [
64]. Rizal Sebastian [
62] (frequency = 21) proposed five success factors known as “POWER” for integrated collaborative application of BIM-based on literature analysis, previous research and case studies: (1) product information sharing (P); (2) organizational roles synergy (O); (3) work processes coordination (W); (4) environment for teamwork (E); and (5) reference data consolidation (R). It is also conducive to actually discussing the changes in the roles and processes needed for developing and operating sustainable buildings with the support of integrated ICT framework and tools in science and practice. Mehmet Yalcinkaya et al. [
63] (frequency = 17) drew some clear conclusions through the comprehensive annotation of a large number of BIM research articles published from 2004 to 2014. Latent semantic analysis (LSA) was used to analyze the abstracts of 975 academic papers objectively, through which 12 main research fields were revealed. Various specific research topics related to each of the main areaswere identified. These main research fields and research subjects reflect the model and trend of BIM research. Heap- Yih Chong et al. [
64] (frequency = 16) analyzed the BIM standards, guidelines and peer-reviewed academic publications through retrospective review. The results show that there has been much research and development in the use of BIM in different stages, but few in refurbishment and demolition, which also reveals some significant insights, including: (1) new BIM tools are needed for evaluation of the sustainability criteria; (2) the interoperability between BIM software and energy consumption analysis tools needs to be improved; (3) streamlining the BIM usage into refurbishment and demolition is required; and (4) there is a need for an innovative procurement system to make the society sustainability compliant with the project.
There were five members in Cluster #11 “total construction as-built documentation”. The Top 3 representative articles were published by Burcin Becerik-Gerber et al. [
65], Dongping Cao et al. [
66] and Ibrahim Motawa et al. [
67]. Burcin Becerik-Gerber et al. [
65] (frequency = 77) explored how BIM can be a useful platform to complement FM practices. Through online survey and face-to-face interviews, the application status, potential application prospect and people’s interest in application of BIM in FM were evaluated. The interaction between BIM and FM was defined by illustrating application areas and data requirements for FM practices that support BIM. The synergistic effect between the two aspects is emphasized in this paper to help professionals identify potential areas where BIM may be useful in FM practice. Dongping Cao et al. [
66] (frequency = 27) analyzed the current BIM practice in China and evaluated how such practices change their effectiveness based on the investigation of 106 projects using BIM. The results also prove that the project characteristics have a significant impact on the success of BIM use. However, the more important factors affecting the effectiveness of BIM are the degree of comprehensive use and customer/owner support. The results show that the current BIM practice involves both technical and organizational issues, which also provide a reference for developing the potential of BIM in the industry. Ibrahim Motawa et al. [
67] (frequency = 19) developed a knowledge-based BIM system for building maintenance, so that maintenance teams can learn from past experience and trace the complete history of building elements and all affected elements through previous maintenance operations. The results show that the knowledge-based BIM integrated system can provide advanced and useful functions for construction operations. On the other hand, the knowledge management principle embedded in the system is combined with the information management principle embedded in the BIM system, which suggests a direction for the transition from “building information modeling” to “building knowledge modeling”.
Observation 5: At the transforming stage, research on BIM application was revolutionized to integrate with emerging technologies, such as ICT, FM, etc.
5.5. Co-Research Direction and Policy Implication
Reflecting on the research in the above three stages, various government and national bodies across the globe started to formulate national BIM implementation policies and strategies to ease BIM adoption such as evolution of BIM policy in Singapore from BIM to Virtual Design Construction (VDC) and to Integrated Digital Delivery (IDD). In Singapore, Building and Construction Authority (BCA) is the driving agency for BIM, VDC and IDD adoption [
68]. In November 2010, the first BIM roadmap was formulated to steer the construction industry leverage on BIM technology as a mean to enable building professionals to deliver their building in a more sustainable and effective manner. BIM was identified as one of the key drivers to improve productivity and integration across various disciplines. The first BIM roadmap aimed to realize the version of a highly integrated and technologically advanced construction sector by 2020 [
68,
69]. In 2015, The second Roadmap was rolled out with the goal of catalyzing the construction industry to extensively use BIM in a streamlined project delivery process and integrated work environment over the building lifecycle. The second BIM roadmap focused on the following five key strategies, as illustrated in
Figure 15. Building on the momentum of the previous two Roadmaps, BCA released the IDD plan to enlarge the digitalization and transform the AEC industry with potential emerging technologies in 2017 [
70]. IDD aims to achieve timely, cost-effective, productive and high-quality project delivery through four stages: design, manufacturing, fabrication and asset delivery. This is made possible with the help of BIM, VDC and suitable digital solutions to convey relevant, accurate and timely digital information across the whole life cycle [
71].
As shown in
Figure 14 and
Figure 15, there is a co-production relationship between evolution of BIM policy and global BIM research, both going through the three stages of formulating stage, accelerating stage and transforming stage.
6. Discussion of Review Findings
This section summarizes the main findings of the current study. This review applies the scientometric analysis method to statistically analyze the literature database on global BIM research using Web of Science.
The following sections discuss the main finding of the review and the future direction of global BIM research:
According to the scientometric analysis, research publication in BIM topic started in 2004. The global BIM research, which is distinguished into 12 clusters, has gone through three key stages, namely formulating stage, accelerating stage and transforming stage:
At formulating stage, the research themes focused on: (1) research review in BIM; (2) conceptual BIM framework; and (3) building BIM capability by developing BIM educational curriculum structure around BIMs use-case
Accelerating stage means accelerating the widespread research of BIM and kick-starting the transition from traditional 2D based workflow to an object-orientated workflow. At this stage, the research focused on the integration of BIM and other related technologies such as GIS, energy calculation, rule-based checking and the development of BIM application.
During the Transforming stage, the AEC industry used emerging technologies and pushed stakeholders to use BIM extensively in a streamlined and integrated manner over the building life cycle.
There is a co-production relationship between the evolution of Singapore’s BIM policy and global BIM research, both going through the three stages of formulating stage, accelerating stage and transforming stage.
The integration of BIM with emerging technology is receiving increasing attention, with AR, GIS, IoT and other emerging technologies being new drivers of the paradigm shift in the AEC industry.
The results of analysis show that some regions/countries and research institutes in the network have no collaboration links with other networks, such as Brazil. Using the findings from this research, these regions/countries/research institutes may consider adjusting/modifying their research polices as they are far from the dominant collaboration network in this field. There are many other factors to measure the influence level, such as betweenness centrality, citation burst, frequency and so on. For example, Israel without many publications has received great number of citation bursts and high betweenness centrality.
It is also worth mentioning that not all highly productive researchers/institutes have received the same high level of influence.
In addition, the findings of this review can assist researchers, industry practitioners and policymakers to understand which authors, journals and documents need to be considered when dealing with BIM topics, as well as possible directions in this field.
7. Conclusions
In the recent decade, the research in the field of BIM has been developing continuously, which has completely subverted the traditional operation mode of AEC industry and attracted more and more researchers’ attention at the same time. An overall, systematic and comprehensive qualitative and quantitative review of the existing global research status of BIM is given through the application of scientific metrology technology in this paper, in an effort to explore the global trend of BIM research. After removing duplicate literature in the core database of WoS, 1455 BIM records were obtained from bibliographic records. CiteSpace version 5.3. R4 was used to perform co-authorship network analysis (authors, research institutes and countries), co-occurring network analysis (keywords and categories) and co-citation network analysis (authors, journals and documents) to identify and visualize the status quo and trend of BIM.
Through the quantitative and qualitative analysis of global BIM research, the contributions and influence of main researchers were identified. In the field of BIM research, Xiangyu Wang, Rafael Sacks and Jack C.P. Cheng are the Top 3 productive authors, while Charles M. Eastman, Salman Azhar and Rafael Sacks are the Top 3 authors with high frequency of citations. In terms of the distribution of journal articles, most BIM articles are sourced from the United States, China and the United Kingdom. In addition, Curtin University, Georgia Institute of Technology and Hong Kong Poly University were recognized as the most productive research institutes in the field of BIM. These countries and research institutes have played an important role in linking research activities between different countries and institutes.
As for the classification of research disciplines, the number of published records of BIM was the most in the following three subjects: Engineering, Engineering Civil and Construction and Building Technology. However, it is also worth mentioning that many scholars have been attracted by subjects such as Green and Sustainable Science and Technology in recent years. The high-frequency keywords include construction, design, system, management, model, framework, project, industry and performance. In BIM keyword analysis, the related high-frequency keywords include construction, design, system, management, model, framework, project, industry and performance. The frequency of BIM research co-citation journals is mainly concentrated in journals such as Automation in Construction, Journal of Information Technology in Construction, and Journal of Computing in Civil Engineering. Over the past decade, the co-citation frequency and citation frequency of these journals was also very high, suggesting that they had a strong and sustained impact on BIM research.
This paper provides valuable information for researchers and practitioners by applying visualization technology to visualize the current situation in the research field of BIM. Key scholars, institutions, regions/countries and core articles were identified with the elaboration of the current situation of the research field and the hotspots of BIM research. In addition, this article lays the knowledge foundation for future research.
Data used for this study were obtained from the Web of Science Core Collection. There are certain limitations to the research data with the lack of integration with literature from other academic databases (e.g., EI retrieval and Scopus). Future research could consider integrating other academic databases.


