Article

Industrial Data-Based Life Cycle Assessment of Architecturally Integrated Glass-Glass Photovoltaics

1
School of Engineering and Architecture, Lucerne University of Applied Sciences and Arts, Technikumstrasse 21, CH-6048 Horw, Switzerland
2
Institute for Ecopreneurship, School for Life Sciences, University of Applied Sciences Northwestern Switzerland, Hofackerstrasse 30, 4132 Muttenz, Switzerland
*
Author to whom correspondence should be addressed.
These authors contributed equally to this work.
Buildings 2019, 9(1), 8; https://doi.org/10.3390/buildings9010008
Submission received: 20 November 2018 / Revised: 21 December 2018 / Accepted: 24 December 2018 / Published: 29 December 2018
(This article belongs to the Special Issue Environmental Impact Assessment of Buildings)

Abstract

:
Worldwide, an increasing number of new buildings have photovoltaics (PV) integrated in the building envelope. In Switzerland, the use of coloured PV façades has become popular due to improved visual acceptance. At the same time, life cycle assessment of buildings becomes increasingly important. While a life cycle inventory for conventional glass-film PV laminates is available, this is not the case for glass-glass laminates, and in particular, coloured front glasses. Only conventional glass-film PV laminates are considered in databases, some of which are partly outdated. Our paper addresses this disparity, by presenting life cycle inventory data gathered from industries producing coloured front glass by digital ceramic printing and manufacturing glass-glass PV laminates. In addition, we applied this data to a hypothetical façade made of multi-coloured glass-glass laminates and its electricity generation in terms of Swiss eco-points, global warming potential, and cumulative energy demand as impact indicators. The results of the latter show that the effect of the digital ceramic printing is negligible (increase of 0.1%), but the additional glass (4% increase) and reduction of electricity yield (20%) are significant in eco-points. The energy pay-back time for a multi-coloured PV façade is 8.1 years, which decreases by 35% to 5.3 years when replacing the glass rain cladding in an existing façade, leaving 25 years for surplus electricity generation.

1. Introduction

1.1. Building Integrated Photovoltaics

Photovoltaics (PV) offer great opportunities in densely populated regions such as Switzerland, particularly when installed on the surfaces of buildings. This is primarily due to their ability to generate electricity without noise emissions, and deployment in a large range of sizes and forms. Ground mounted photovoltaics are impractical due to the scarcity and consequently high cost of land in Switzerland. However, the Swiss energy strategy 2050 aims to increase the national electricity supply from PVs from about 2% in 2016 [1] up to 20% by 2050. Global warming (climate change) is a critical issue drawing wordwide attention, and Switzerland should reduce green house gas emission by 20% in comparison to their 1990 level by 2020 according to Swiss law (the CO 2 Act). In addition, nuclear power, which is CO 2 -free and generates about 40% of Swiss electricity, will phase out [2].
Building integrated photovoltaics (BIPV) contribute to achieving this goal by fully utilising building surfaces, such as the roof or façade, to maximise electricity generation. This goal is difficult to achieve with monochromatic BIPV, as they compromise the architectural aesthetic of the building, leading to low visual acceptance on behalf of the architect or the building’s owner. Various types of technologies for aesthetically appealing PV systems in buildings have recently been developed, such as thin films or special foils [3]. Such systems are referred to as architecturally integrated. However, the conservative nature of the construction sector, as well as vague or even conflicting building regulations regarding façade elements have thus far delayed the application of these technologies [4].
Multi-coloured glass-glass (MCGG) and crystalline silicon cell (c-Si) PV laminates are an approach to overcome some of these aforementioned issues and achieve aesthetically pleasing, yet technically and economically viable building integrated PV systems, by utilising market-proven technologies which also retain high market potential in the future. This solution combines translucent digital ceramic print technology [5,6,7] with existing mainstream technologies, notably crystalline silicon cells and glass-glass sheets (see Figure 1).
C-Si is the mainstream technology in commercial PV markets accounting for 94% of the market share, while thin film accounts for 6% [8]. Despite the emergence of many new technologies, the former is most likely to remain dominant for next decade, driving substantial market growth by ongoing cost reduction and improvement in efficiency [9].
The most common configuration of PV laminates for grid connected systems comprises 60 cells, which are typically arranged as a 6 by 10 matrix, occupying an area of approximately 1.00 × 1.615 m 2 . The cells are wired in series, thus metallic tab wires attached to a front side of a cell are connected to the backside of a neighbouring cell. This interconnecting wiring technology is subject to ongoing improvements in cell efficiency, with a triple busbar arrangement currently dominating the market [10]. Deployed without a frame, this system is referred to as a photovoltaic laminate, while an additional surrounding frame designates it as a photovoltaic panel. A junction box and two ca. 1m cables are attached to the laminate or the panel for connection to adjacent units.
Interconnected cells are brittle and easily corroded by moisture. To protect against impact and moisture from hail and rain in outdoor environments, the solar cell strings are encapsulated by two sheets of polymer foils (e.g., Ethylene-vinyl acetate, or EVA), which are in turn encapsulated by two sheets of glass. Finally, these layers are laminated under heat and pressure in a vacuum to form a PV laminate. For a non-BIPV solution, a Tedlar® polymer film is also commonly used instead of a glass back-sheet. However, a BIPV laminate should resist fire hazards and wind loads to comply with architectural regulations on a building façade. Glass sheets are a typical solution to achieve this, as glass is a commonly used façade component under the established building codes. Moreover, even for a non-BIPV solution, glass back-sheets are increasingly popular as they prevent moisture intrusion.
MCGG PV laminates can readily replace façade panels in a rainscreen wall. A rainscreen wall system [11] prevents penetration of rainwater into a building wall and is widely used since the 1970s (see Figure 2). It consists of a rainscreen cladding, ventilated and drained air cavity, and an air barrier system from the outermost layer of a building. Common materials for rainscreen cladding include fibre cement, metal, and timber, which are selected based on various criteria. Glass is frequently chosen when an aesthetically pleasing façade finish is preferred. The multi-coloured glass-glass PV laminates have the potential to satisfy this aesthetic criterion and be accepted as rainscreen cladding, making them economically and environmentally beneficial as the existing rainscreen mounting system can accommodate the PV (see Figure 2b).

1.2. Life Cycle Assessment

Environmental Life cycle Assessment (LCA) is a methodology to assess all the environmental impacts of a product or a service during the whole life cycle from the raw material extraction to final disposal [13]. Alternative products have different eco-profiles over their lifetime; one product’s environmental impact contributes mainly to its production phase, while another’s dominates during its use or operating phase. A classical example are disposable diapers, which create 90 times more solid waste than reusable cloth diapers. The latter, however, produce tenfold water pollution due to detergents etc., and consume triple the energy [14]. LCA does not provide a simple answer, but it enables rational judgements with trade offs. For this reason, LCA is becoming an increasingly important and popular tool in policy and industry [13].
The International Organisation for Standardisation (ISO) standardised an LCA methodological framework and terminology (ISO 14040:2006) [15] and provided general guidelines and requirements (ISO 14044:2006) [16]. According to ISO, the LCA procedure consists of the following steps:
  • Goal and scope: Definition of the System boundary & functional unit.
  • Life Cycle Inventory (LCI): Elaboration of a mass balance for a process with all inputs and outputs.
  • Life Cycle Impact Assessment (LCIA): Assessment of environmental consequences of the LCI such as climate change, natural resource depletion, ozone depletion, ecotoxicity etc. with specific indicators. A sensitivity analysis considers the individual effects of the choices made, i.e., flows and indicators.
  • Interpretation: Identification of processes and flows with main environmental impact and recommendation of measures for improvement.
BIPV affects the heating and cooling load in buildings, as it generates heat as well as electricity and replaces building elements which may have a different thermal resistance [17]. The current reviews covering the state-of-the-art of LCA on BIPV assess the influence of BIPV on the energy performance of buildings [18,19]. Adaptive BIPV deployed on windows provides shading and admits daylight, while also reducing the energy consumption for lighting, heating, and cooling [20]. These energy reduction factors can be considered in two ways:
  • Place the factors into a system boundary. For example, Jayathissa [20] estimated the energy load (heating, cooling, and lighting energy) in an office with windows fitted with dynamic BIPV, static shading, and no shading at all. The study compares the environmental impact of the German grid electricity to that generated by different BIPV technologies (thin film and crystalline), and the resulting reduction in energy loads. These results are further discussed in the context of this study in Section 3.5.
  • Alternatively, these factors can be excluded from a system boundary along with building materials serving a similar purpose, (e.g., when replaced by BIPV in a façade). For example, Ng [21] estimated the lifetime performance of semi-transparent BIPV glazing when it replaces double glazing windows, which similarly impacts building energy performance.
In this study, the latter approach was adopted by replacing the rainscreen cladding in a façade with BIPV. This better caters to the focus on electricity generation within the scope of the study, the purpose of which is explained in the following section.

1.3. Purpose of the Study

Glass is a commonly used material in both photovoltaic and building industries, and its proportional weight in a glass-glass PV laminate is over 90%. Moreover, glass-glass c-Si PV laminates are the de facto standard for a building integrated solution. However, its environmental impact assessment (LCA) is not available, thus the resulting approximated environmental impact based on life cycle inventory databases may not reflect reality.
To realistically assess the environmental impact of the entire life cycle of a MCGG c-Si PV laminate, this study presents up-to-date data on c-Si production gathered from literature, as well as material and energy flow data from a solar glass and PV laminate supplier. Moreover, a façade case study considers a realistic BIPV use case, in which the PV laminate replaces the rainscreen cladding.
Unlike ground mounted photovoltaics, building integrated photovoltaic systems need to satisfy multiple goals, i.e., aesthetic appeal, fail-safe installation and operation, and electricity generation with lower environmental impact than that of the existing Swiss low-voltage grid. As a consequence, multiple parties contribute towards achieving these goals, including the glass and photovoltaic manufacturer, architect, building owner, planner, and installer. These goals need to be achieved collectively as each party has only a limited scope of influence, thus the relevant information must be consolidated. However, existing PV life cycle inventory data and assessment results are aggregated and averaged, thus individual data relevant to the building context cannot be often identified.
The purpose of this study is therefore to provide life cycle perspectives of BIPV in general, and glass-glass crystalline silicon cell photovoltaics in particular, by presenting life cycle inventory data and the assessment results in an itemised and organised manner, such that they are relevant and comprehensible to the involved parties. Furthermore, the influence of façade components on the environmental impact of BIPV are analysed, as well as the additional benefits of BIPV for a building. In the long term, these results support the parties in making future decisions in their respective areas of influence.
The rest of the paper is organised as follows: In Section 2, we elaborate our LCA methodology of a PV façade, and the impact indicators used; Section 3 presents results obtained from the LCA of the façade components, and the electricity generated in terms of energy pay-back time; in Section 4, we draw our conclusions. A glossary of abbreviated terminology used in this paper can be found in Table 1.

2. Methodology

The following section specifies the PV laminate and façade installation used in this study. In accordance with the sequence of the four LCA phases in Section 1.2, the goal and scope definition, inventory analysis, and impact indicators used in this study are presented. The impact assessment and interpretations is presented as results in Section 3.

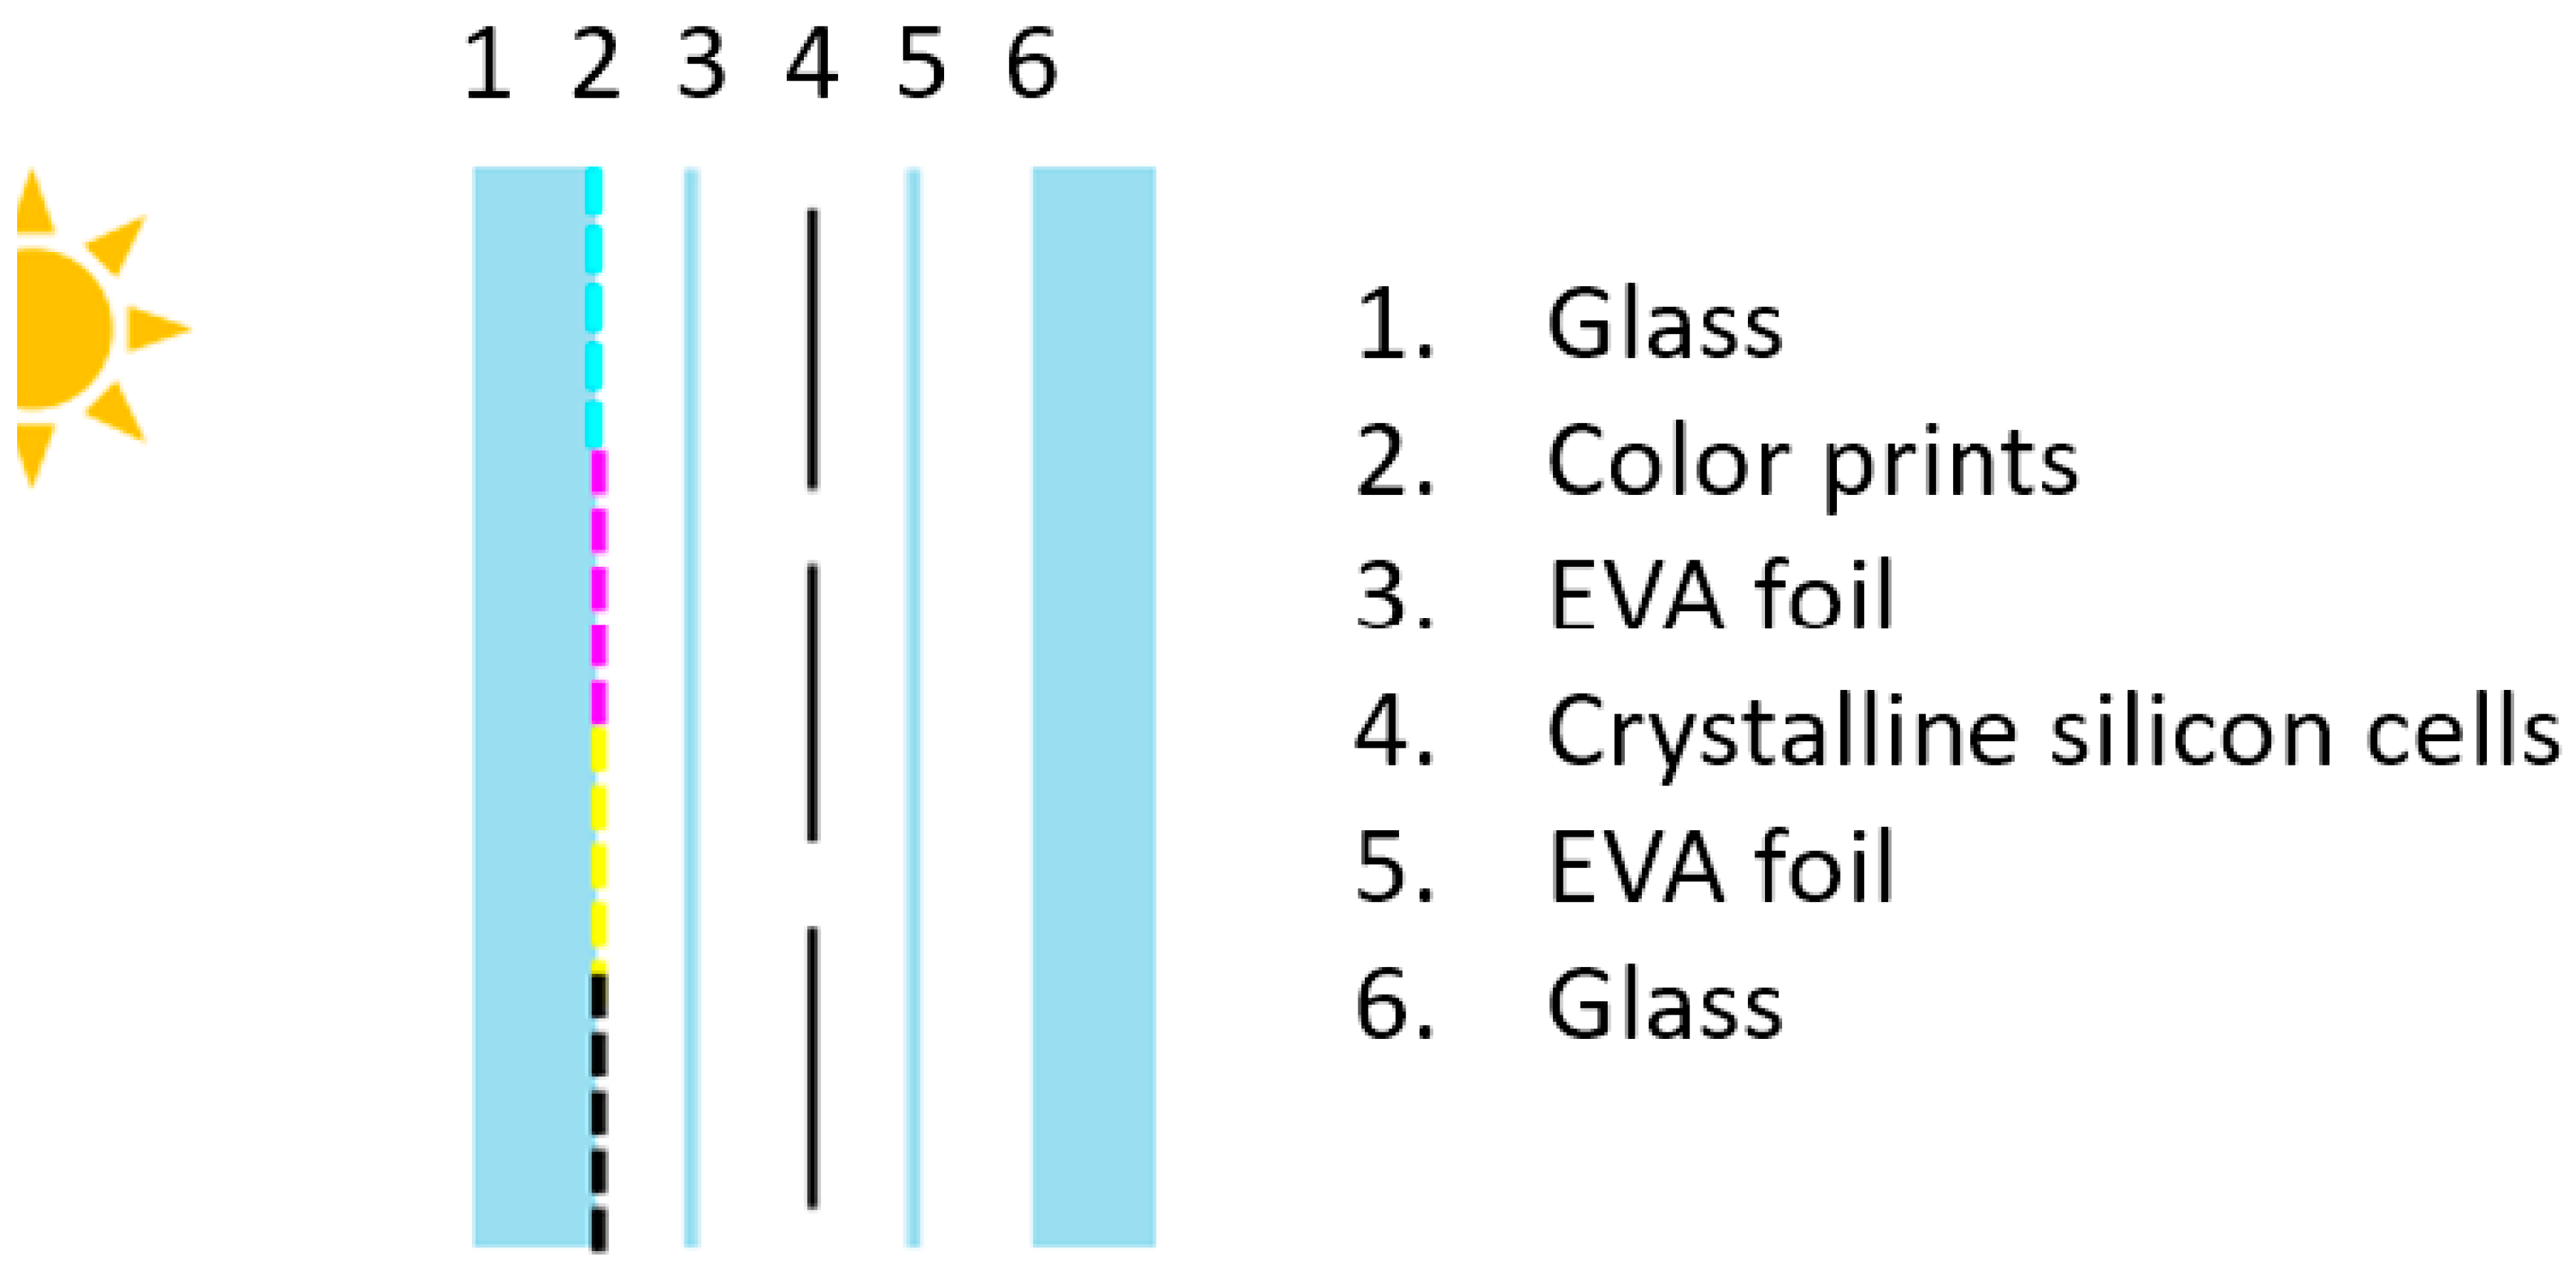
2.1. PV Laminate Specifications for Life Cycle Assessment

Table 2 lists detailed specifications of a PV laminate used in this study, which is representative of one of the most common configurations in the market. The basic configuration of a laminate consists of multi-crystalline silicone (m-Si) cells and a multi-coloured front glass sheet. Common variants on the market replace the multi-coloured front glass sheet with a clear glass sheet, and m-Si by s-Si.
To consider the entire life cycle of a photovoltaic laminate, the study considers a hypothetical façade installation consisting of 140 laminates (see Table 3). The system capacity using the m-Si clear glass PV laminates (250 Wp) is 30.8 kWp. When using multi-coloured glass sheets, electricity production decreases by 20%, reducing the capacity to 24.6 kWp. The system with clear glass s-Si PV laminates has 35 kWp capacity. The annual electricity yield expressed in kWh/kWp for each orientation is measured in Dübendorf, Switzerland, after the inverter and before being fed into the grid; this takes into account losses due to AC conversion, while transmission losses in the grid are disregarded. The calculation of electricity production assumes a projected PV lifetime of 30 years. To consider various degradation modes such as discolouration and corrosion [22], the annual yield is linearly derated by 0.69% as recommended by IEA PVPS [23].

2.2. Goal and Scope of Life Cycle Assessment

In accordance with the purpose of the study stated in Section 1.3, the scope of the LCA covers:
  • up-to-date crystalline silicon cell production
  • clear and multi-coloured glass production by a specific manufacturer
  • glass-glass laminate production with various configurations by a specific manufacturer
  • a hypothetical but realistic PV façade installation
  • electricity generated from the façade facing south, east/west, and north
  • and a comparison of the generated electricity to that of the Swiss low voltage electricity grid.
Figure 3 presents functional units of each product along the supply chain of the BIPV system, leading to the generated electricity as final product. The laminate is assessed by applying the “cradle to gate” approach. The system boundary includes the material and energy flows of the upstream processes for the laminate. Nevertheless take back and recycling of a laminate is already included. The electricity is assessed by applying the “cradle to cradle” approach. The system boundary includes all processes for laminate production, including production of the Balance of System (BOS) [24], such as mounting system, cabling, and an inverter. Furthermore, this considers the transportation, installation, cleaning, and maintenance of the PV installation, and its end of life. To obtain the environmental impact per 1kWh electricity generated using the model in this study, the total environmental impact of the façade (including water and waste water from cleaning) is simply divided by the total electricity generated during its lifetime.

2.3. Life Cycle Inventory

A main challenge in LCA is the collection of data for the Life Cycle Inventory (LCI). This can be mitigated by using the Ecoinvent database [25], which contains basic data on materials, energy, waste, transportation, and other factors. This data is collected from averages of material and energy flows provided by industrial sectors, expert estimates, and literature values. This study uses the APOS [26] data set, which is one of the three sets of data available in Ecoinvent 3.4. The calculations were performed in software mainly using Simapro 6.4, supplemented by MS Excel.
Ecoinvent data is updated frequently, but a literature review has shown that updated LCI data on the requisite photovoltaic components for this study are not yet integrated in the latest Ecoinvent version 3.4. Thus, this study carried out an LCI for system components based on recent literature and current industry data, which are stated in the sections below.

2.3.1. LCI of Crystalline Silicon Cells

The LCI for m-Si and s-Si cells in Ecoinvent 3.4 were updated with an LCA of photovoltaics dated 2011 [27] (Part 1: Data Collection, Table 37). A main difference compared to the LCI in Ecoinvent 3.4 is the an increase in electricity consumption for the m-Si wafer process from 4.7 kWh to 20.8 kWh. For further differences, see the cited reference.

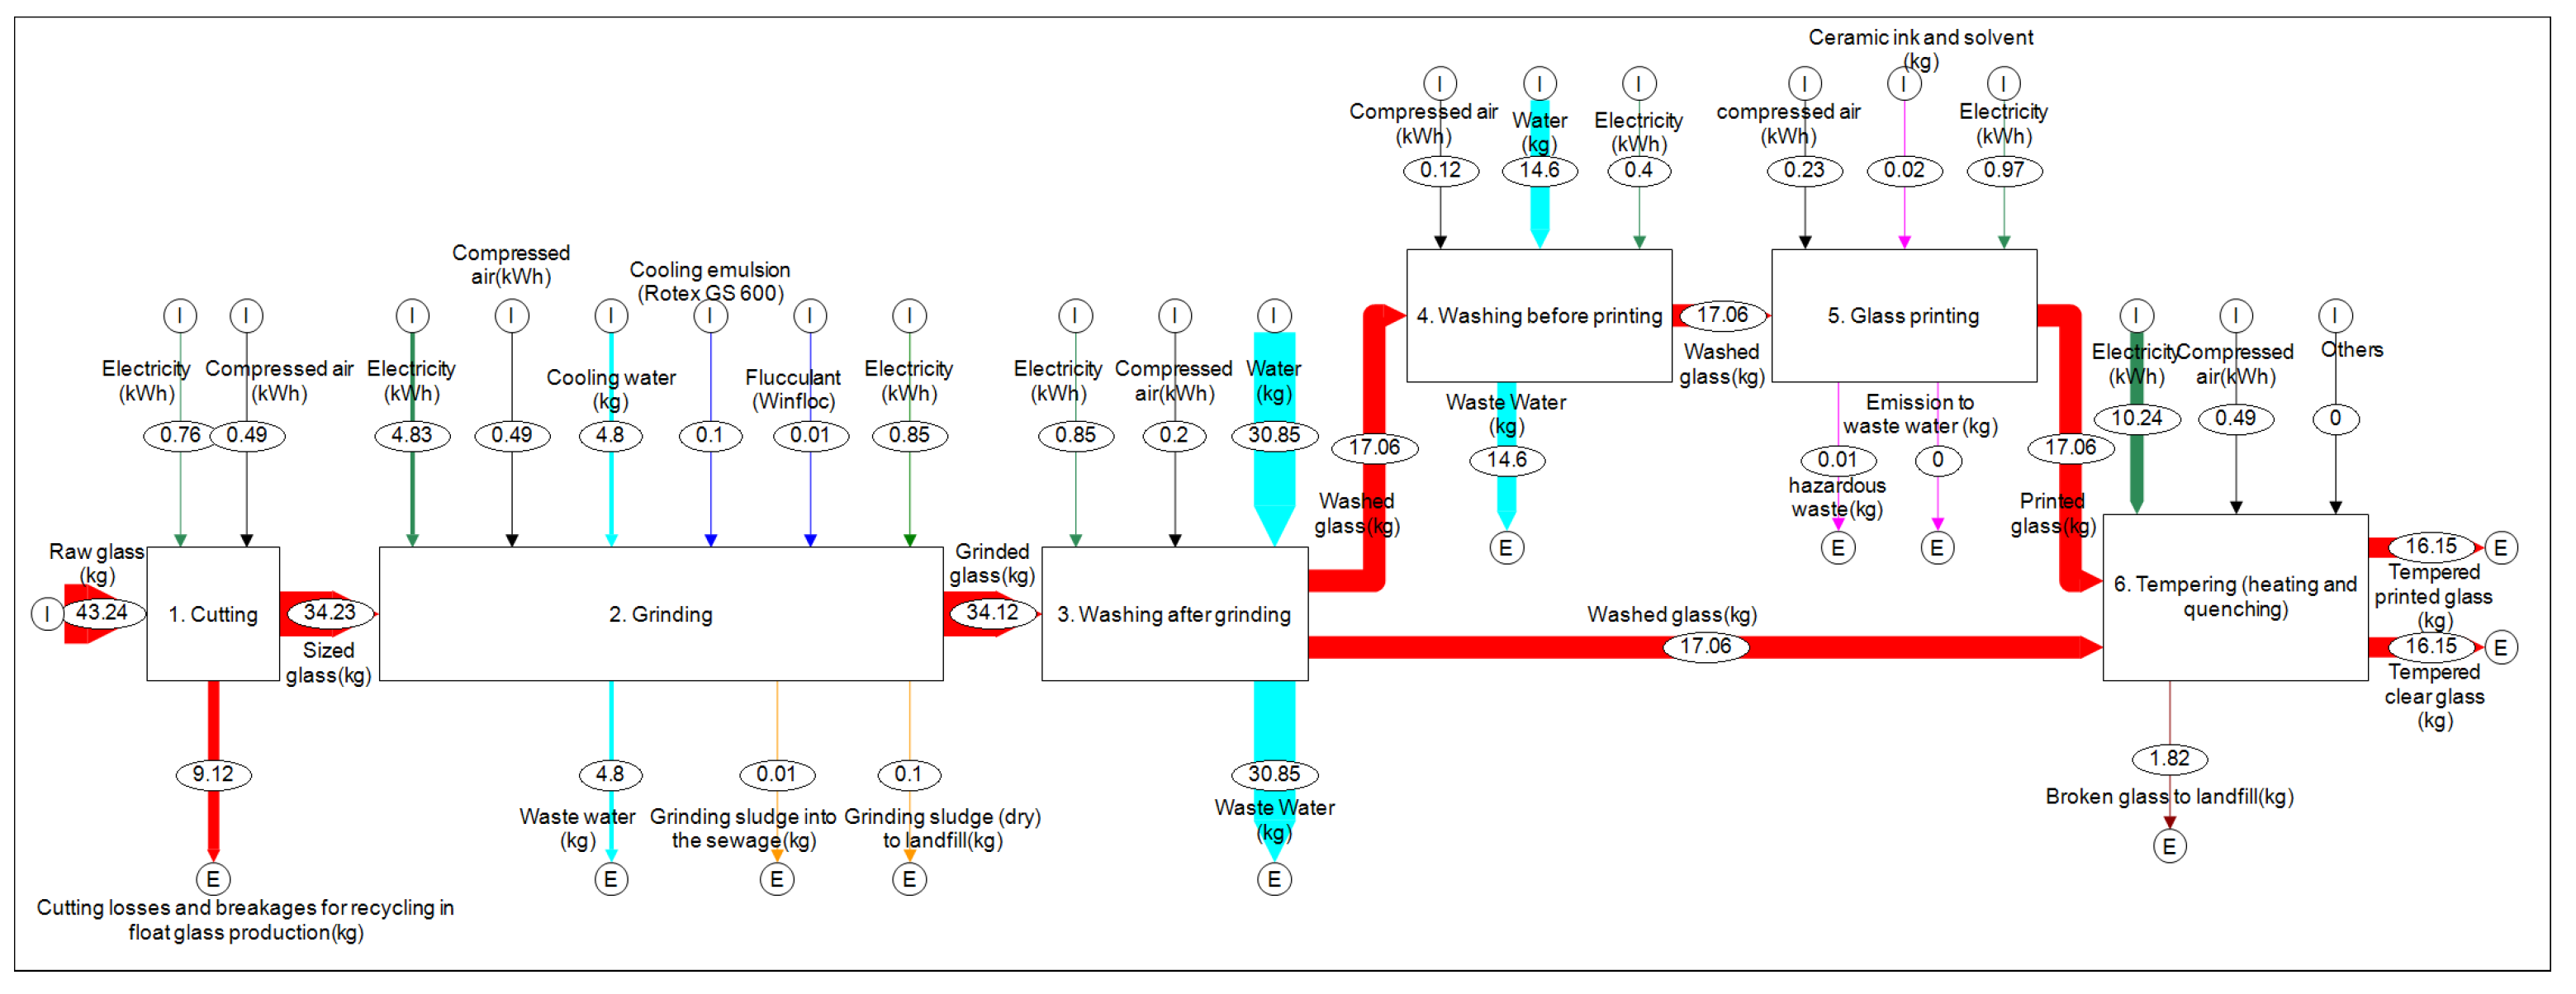
2.3.2. LCI of Solar Glass

Solar glass is made from float glass, i.e., floated on molten tin to obtain a flat and polished surface [28]. The LCI for float glass in Ecoinvent 3.4 was itemised with material flow data from two European float glass manufacturers [29,30].
The energy consumption for the final solar glass production was obtained from the Swiss manufacturer (personal communication P. Schaad, Glas Trösch AG, 25.05.2018). The resulting material and energy flows for the processes to produce 1.615 m 2 of clear and multi-coloured solar glass sheets are shown in Figure 4 and Table S1 (supplementary material). The company produces multiple glass types of different sizes, which run through different process steps. Consequently, the production is not optimised for solar glass. This implies higher energy stand-by losses in continuous production flows as well as material losses. Energy flows (electricity and compressed air) are expressed in kWh, while those for the material are expressed in kg. The thickness of an arrow corresponds to the quantity of material flow.
The production of clear solar glass requires four main processes: Cutting the raw material (i.e., float glass) to the desired size; bevelling (grinding the edges); washing off grinding sludge and drying; and finally tempering to increase the strength of the solar glass. Losses and breakages from the raw glass at cutting are about 20%. The cullet is recycled directly in float glass production, which reduces the quantity of the primary raw material. Breakages at tempering and quenching of the solar glass are about 5%. To produce 32.30 kg of two final glass sheets, 43.24 kg of raw float glass are consumed. Coloured solar glass needs two additional passes before tempering: A second washing and drying step immediately following the first (on the same washing machine), and digital printing with ceramic ink on the clear glass, followed by tempering. The total electricity consumption in production adds up to 19 kWh.

2.3.3. LCI of PV Laminate

The front and back glass are transported from the Swiss glass manufacturer to a PV laminate manufacturer in Germany. The production the glass-glass PV laminate (Figure 5) requires four main processes: Cleaning the glasses in a washing machine (closed water cycle); cutting the EVA foil; brazing crystalline silicon cell strings (by an external supplier) and connecting tap wires; laminating under pressure and heat; cutting EVA leftovers; and final mounting and test.
The total electricity consumption in production adds up to 6.05 kWh. When using crystalline silicone cells with active wires instead of 3 busbars, the total amount of copper in the PV laminate increases from 219 g to 229 g by 4%.

2.3.4. LCI of Further Processes and Components

The data sources for the LCI of other processes and components considered in the LCA are listed in Table 4.

2.4. Life Cycle Impact Indicators Selected for This Study

Impact categories and indicators commonly used in LCA of photovoltaic system are presented in [23] (Table 3.2). For this study, the five indicators in Table 5 were selected.
In this study, the LCIA of solar glass, photovoltaic laminate, and façade system mainly use the ecological scarcity as indicator (expressed in eco-points), while the electricity generated by the PV façade is assessed with CED and EPBT, which are commonly used indicators to compare energy generation systems, along with GWP.

3. Results

This chapter presents the results of the Life Cycle Impact Assessment (LCIA) according to the sequence of the supply chain described in Figure 3. First, the environmental impact of the production of the front and back glass for a PV laminate is presented in terms of eco-points. Subsequently, the eco-points of the production of PV cells and laminates and of an architecturally integrated PV façade installation are detailed. Finally, the EBPT of the system will be presented along with the eco-points and GWP of 1 kWh of generated electricity at different façade orientations compared to the current impact of the Swiss low voltage electricity grid.

3.1. Production of Multi-Coloured and Clear Glass

Figure 6 shows the eco-points of a multi-coloured front glass sheet (1.615 m 2 ) by components and processes, which adds up to a total of 34.2 kPt. The eco-point of an unprinted back sheet adds up to 33.2 kPt. Consequently, the total eco-points (Figures S1 and S2) for the front and back glass of a PV laminate is 67.4 kPt. The eco-points for the clear solar glass (33.2 kPt) in this study are 47% higher than those from Ecoinvent (22.6 kPt). This is because the reference data for float glass used in this study [29] has different input materials from that of Ecoinvent. As mentioned in Section 2.3.2, this is further attributed to the high glass losses and breakages in cutting and tempering.
The raw float glass input incurs a major contribution (79%) to the total eco-points of the multi-coloured glass sheet production. This is attributed to the energy and CO 2 intensive, which has a strong weighing in eco-points, float glass production process and the losses and breakages in the solar glass production. The electricity and digital printing account for only 12% and 3%, respectively. The European electricity mix contributes to not just GWP and eco-points but also the category nuclear waste.

3.2. Production of Crystalline Silicon Cells

The LCIA results for the production of the 60 m-Si and s-Si cells for a PV-laminate (1.615 m 2 ) using the latest published data (see Section 2.3.1) that deviate from those in Ecoinvent 3.4 for the same cell types. The eco-points for the m-Si cells increase by 22% from 311 to 380 kPt, while those for s-Si cells are reduced by 5% from 524 to 496 kPt.

3.3. Production of PV Laminate

The front and back glass from the Swiss glass manufacturer are transported by road to the German PV laminate manufacturer. The crystalline silicon cells, EVA foil for lamination and the electric components (bus wire, tap wires, junction box and the connecting cable), as well as packaging material, are purchased on the international market. When smart wires [10] are used instead of triple busbars as wiring technology for the c-Si cells, the total amount of copper in the PV laminate increases by 4%, which has a negligible effect on its total eco-points.
Figure 7 shows the eco-points for three different types of PV laminate. In the production of an MCGG m-Si PV laminate (Figure S3), the multi-coloured front and clear back glass accounts only 15% of the total eco-points (460 kPt). For s-Si MCGG PV, the glass contributes 10% to the total eco-points (673 kPt). The impact of printing is negligible. By contrast, the impact of the PV cells is significant; PV glass laminates using s-Si cells have a 46% higher impact in eco-points compared to laminates with m-Si cells, while the electric components contribute 7% and 10%, respectively. The impact of these components stems from the copper. The reference (m-Si glass-foil PV laminate) has lower eco-points than an m-Si glass-glass PV laminate due to the lower contribution from the backsheet foil compared to the glass sheet. The proportion of eco-points for take-back and recycling at the PV laminate’s end of life is 3% and included in the Others category.

3.4. Installation of an Architecturally Integrated Photovoltaic Façade

For the installation of the façade in Switzerland, 140 modules are delivered by road. The BOS (inverter, mounting system, electric components) are purchased from the international market. The LCIA of the installation of the architecturally integrated photovoltaics façade considers these system components: The transportation, 1% of rejected PV laminates at the construction site, replacement of 2% of PV laminates due to early end of life during operation, a one-time replacement of the inverter during the operating lifespan, and furthermore the electric energy for mounting.
The eco-points for the façade with s-Si cells and clear glass is 141,000 kPt. For m-Si cells, it is 22% lower (110,000 kPt). The solar glass and the mounting system can be excluded from the system boundary and allocated to the building, e.g., if an existing rain cladding glass façade approaches the end of its useful life and needs to be replaced, or the multi-coloured solar glass assumes a function of the building. In this case, the eco-points decrease by 25% to 83,000 kPt for the m-Si configuration, and by 19% to 114,500 kPt for the s-Si configuration.
Figure 8 shows the breakdown of the eco-points for façade configurations consisting of 24.6 kWp m-Si and 28 kWp s-Si MCGG PV laminates, and 30.8 kWp conventional clear glass-foil PV laminates, containing 140 modules of each component in ratio. The major contributors are the wafers in all three façades, making up 41% (glass-glass) and 42% (glass-foil) for m-Si, and 54% for s-Si. Front and back glass contributes 9% (m-Si) and 7% (s-Si) for the glass-glass PV façade. By contrast, the foil-glass façade contributes only 5% for the front glass, and 1% for the foil. Lastly, the mounting system contributes 13% resp. 10%, while the inverter contributes 12% resp. 9% for the glass-glass PV façade.

3.5. Electricity Generation Based on Façade Orientation

All environmental impact of the façades are allocated to electricity generated, so the percentage of eco-points contributions of the façades (Figure 8) also can be applied to 1 kWh electricity. A recommended functional unit for the LCA of the electricity generating system is 1 kWh, facilitating comparisons irrespective of size and capacity. The environmental impact of 1 kWh electricity can be decreased if that of any contributors are decrease. For example, to decrease the impact by 10%, the following options are viable:
  • Increase electricity production by 3% (for example, by improving c-Si cell efficiency)
  • Reduce impact during façade installation by 3% (for example, mounting system with lower eco-points)
  • Reduce impact during lamination processes by 4% (0.04 × 0.6 = 2.4%, since 140 laminates contribute 60% of the total eco-points) (for example, reducing electricity consumption)
  • Decrease solar glass impact by 20% (0.2 × 0.09 = 1.8%, since glass contributes 9% to the total) (for example, reducing loss and breakage)
In the same way, magnitude of the uncertainty of data in each contributor affecting to 1 kWh of electricity also calculated. For example, 20% of uncertainty of solar glass data affects 1.8% of impact (eco-points) of 1 kWh electricity. The float glass contributes 79% of the solar glass, so 20% of float glass reduction reduces the total impact of electricity by 1.4%.
Depending on the façade orientation, the amount of electricity generated by a PV system varies, along with its environmental impact per kWh. Therefore its orientation is considered when comparing the façade to the Swiss low voltage electricity grid as reference. The reference electricity has an impact of 0.273 kPt per kWh. In this study, this is derated by 6% to 0.257 kPt to account for the grid loss of electricity generated by the façade. Thus, the environmental impact of the reference electricity is decreased instead of reducing the amount of electricity generated by the façade.
The GWP and eco-points per kWh generated according to façade orientation are shown in Figure 9. In terms of eco-points, all configurations facing south are superior to the reference. In the façade facing east/west, only the m-Si configurations are viable. In general, GWP indicates less favourable results than eco-points compared to the Swiss low voltage electricity grid. Consequently, the discussion that follows focuses on the former indicator.
The Swiss grid electricity mix (GWP of 0.13 kg CO 2 eq), used as reference in this study, has a lower share of carbon-based electricity, but a higher share of nuclear and hydro power than the European electricity mix. This contrasts with the German grid electricity mix (GWP of 0.61 kg CO 2 eq) used as reference in [20], which is dominated by high-impact coal sources. Almost all the façade configurations in Figure 9, except s-Si multi-coloured facing north, outperform the German electricity mix. Furthermore, the figure reveals that:
  • The north facing façade has the 2–5-fold GWP of the reference, and is unsuitable in any configuration. The worst-case GWP is infact comparable to that of coal power plants. The best-case GWP is, on the other hand, comparable to that of gas power plants.
  • S-Si cells (with an efficiency of 17% in this study) are unsuitable under all conditions. They produce 13% more electricity than m-Si, but their GWP is also 54% higher. (see Table A1).
  • Multi-coloured PV systems are superior to the Swiss low voltage electricity grid only when the laminates replace part of an existing rain cladding system. In this case, the GWP decreases by 36%: Solar glass (13%); the mounting system (19%); glass take-back and transportation (4%); and printing (0.4%).
  • Clear glass m-Si photovoltaic on south facing façade is superior to the reference even when all the environmental impact is allocated to it.
Jayathissa [20] estimated GWPs of 0.144 to 0.331 kg CO 2 eq per kWh of electricity generated by a façade installation in Germany using different BIPV technologies (thin film and crystalline), disregarding the energy load of the building. In contrast, the GWP of all BIPV façade components in Table A1 of this study lies between 0.114 and 0.194 kg CO 2 eq per kWh, which reduces to 0.072–0.148 kg CO 2 eq per kWh when replacing the rain cladding. However, in relating these results, we note the following constraints, which only permit an indirect comparison:
  • Different datasets (Ecoinvent 3.1 vs. 3.4)
  • Lifespans of 20 years instead of 30 in this work.
  • Annual yield of 855 kWh/m 2 (irradiation) × 0.11 (efficiency) ≈ 94 kWh/m 2 vs. annual yield of 700 kWh (facing south) × 24.6 kWp/252 m 2 68 kWh/m 2 .
Figure 10 shows the non-renewable CED per kWh of electricity generated by the façade. It decreases over time from its initial value of ca. 900 GJ prior to electricity production, which is the total CED of the m-Si façade. After a projected 30-year lifespan, this is reduced to 1.92 MJ/kWh. The EPBT of the south-facing multi-coloured PV system is 8 years, but when replacing a part of a rainscreen wall system, this drops to just 5.3 years. Other EPBT results are summarised below.
  • EPBT m-Si: The EBPT of a PV façade facing south with clear and coloured glass is 6 and 8 years, respectively. Facing east/west, this increases to 8 and 11 years, respectively, while facing north, the EBPT exceeds 20 years.
  • EPBT s-Si: The EBPT of a PV façade facing south with clear and coloured glass is 8.4 and 10.6 years, respectively. Facing east/west, this increases to 11.2 and 14 years, respectively, while facing north, the invested energy does not pay off at all.

4. Conclusions

To achieve the goal of the Swiss energy strategy, namely to increase contribution of PVs to the national electricity supply by up to 20% by 2050, BIPVs need to be aesthetically appealing for visual integration while generating electricity with a lower environmental impact than that of the existing Swiss low-voltage grid. These results compare favourably with those of a similar study using the German grid electricity as reference [20].
The primary aim of this study was to support the BIPV industry by providing previously unavailable and updated LCI data and LCA results of a glass-glass PV laminate as a reference. This reference can be used in the future to assess the environmental impact of novel BIPV laminates. The secondary aim of this study was to provide a holistic view of the entire life cycle and supply chain of BIPV and relevant information to each involved party, by presenting the LCA results and LCI data in an organised manner suitable for upstream building industries.
The LCA was carried out based on the latest published data of crystalline silicon cell production (currently omitted in LCI databases), the actual material and energy flow data from the glass and PV laminate suppliers, and lastly a realistic façade use case suitable for practical installation planning to identify a viable application as electricity generation system.
The most obvious findings to emerge from the LCA is that printing on glass is negligible as it accounts for less than 0.2% of the total impact (in eco-points) of a PV façade and 1 kWh of electricity generated. By contrast, the impacts of the PV cells are significant, making up 41% for m-Si and 54% for s-Si. Single crystalline cells are not suitable in general cases as s-Si types contribute 68% higher eco-points than m-Si, while their efficiency is only 13% higher. Moreover, a north-facing PV façade generates far too little electricity to justify its environmental impact compared other façade orientations, as well as the Swiss low voltage electricity grid as reference.
The itemised LCA results revealed enormous optimisation potential in future glass production processes, for instance by reducing the idle time and losses, ideally due to increased demand and production volume. The dominant contributor to the impact of solar glass production in terms of eco-points is the float glass input with 79%. Lesser contributors are cutting and breakage losses with 25% of the input, while electricity consumption contributes 12% to the total eco-points.
Overall, the results support the notion that an itemised LCA can contribute to the building industry by presenting a holistic view to identify aggregated optimisation potential in the context of an individual BIPV product or a process in terms of its location and influence. However, to achieve progressive optimisation requires an iterative approach to LCA. The fragmented nature of the building industry hinders the gathering and arranging of data towards a collective effort. This therefore necessitates a systematic, inter-organisational approach to LCA.
The biggest limitation of the study may lie in the uncertainties inherent in LCA. Their quantitative effect is indicated by the exemplary options to reduce the environmental impact of the façade presented in Section 3.5: A relatively large deviation of 20% in solar glass production, for example, only affects 1.8% of the total. These interactions need to be further investigated in a systematic analysis. However, such an analysis is hampered by the lack of directly comparable data to confirm its veracity, which further emphasises the importance of a systematic LCA for the building industry.

Supplementary Materials

The following are available online at https://www.mdpi.com/2075-5309/9/1/8/s1, Figure S1: Environmental impact (eco-points) of multi-coloured solar glass production, Figure S2: Figure S1 with impact of glass suppressed to highlight that of other flows, Figure S3: Eco-points (kPt) to produce a multi-coloured glass-glass PV laminate, Table S1: Itemised energy and material flows for the production of a clear and multi-coloured solar glass.

Author Contributions

S.W. initiated this research, supported it with consultations, devised the use case, and wrote the abstract. D.H. gathered the LCI data, modelled and advised on the LCA, ran the software calculations and wrote the relevant sections. J.P. reviewed and compiled the inventory data, visualised and interpreted the results, and wrote the relevant sections comprising the bulk of the paper. All authors reviewed the publication.

Funding

This research was supported by the Swiss National Science Foundation as part of the projects ACTIVE INTERFACES—Holistic strategy to simplify standards, assessments and certifications for building integrated photovoltaics (#153849) and ACTIVE INTERFACES - Holistic strategy for PV adapted solutions embracing the key technological issues (#153762).

Acknowledgments

Roland Schregle reviewed the paper. Peter Schaad (Glas Trösch AG, Bützberg, Switzerland) provided the LCI for the solar glass. Joachim Höhne (GES Gebäude- und Energiesysteme GmbH, Korbußen, Germany provided the LCI for the PV laminates.

Conflicts of Interest

The authors declare no conflict of interest.

Appendix A. BIPV Façade Results

Table A1. Lifetime electricity production and environmental impact by system configuration and orientation. If a configuration outperforms the reference (the Swiss grid electricity mix), it is marked in red.
m-Sim-Sis-Sis-Si
Clear GlassMulti-ColouredClear GlassMulti-Coloured
Capacity [kWp]
Laminate0.220.1760.250.2
System30.824.643528
Lifetime electricity generation [kWh]
South (700 kWh/kWp)582,054465,643661,425529,140
East/West (530 kWh/kWp)440,698352,559500,793400,635
North (200 kWh/kWp)166,301133,041188,979151,138
Environmental Impact of all system components
GWP [kg CO 2  eq]66,50366,620102,758102,876
UBP [kPt]110,062110,202140,926141,065
CED [MJ]899,456901,8651,353,8561,356,286
Environmental impact for rain cladding replacement (without glass, mounting system and transport)
GWP [kg CO 2 eq]41,96541,96578,22178,221
UBP [kPt]83,63483,634114,497114,497
CED [MJ]599,128599,1281,053,5331,053,533
GWP [kg CO 2 eq/kWh (%)] for all components vs. reference (0.123 kg CO 2 eq)
South0.114 (−7.1%)0.143 (16%)0.155 (26%)0.194 (58%)
East/West0.151 (23%)0.189 (54%)0.205 (67%)0.257 (109%)
North0.399 (225%)0.501 (307%)0.544 (342%)0.681 (453%)
Eco-points [kPt/kWh (%)] for all components vs. reference (0.256 kPt)
South0.189 (−26%)0.237 (−7.7%)0.213 (−17%)0.267 (4.0%)
East/West0.250 (−2.6%)0.313 (22%)0.281 (9.8%)0.352 (37%)
North0.662 (158%)0.828 (223%)0.746 (191%)0.933 (264%)
GWP [kg CO 2 eq/kWh (%)] for rain cladding replacement vs. reference
South0.072 (−41%)0.090 (−27%)0.134 (9.3%)0.148 (20%)
East/West0.095 (−23%)0.119 (−3.2%)0.178 (44%)0.195 (59%)
North0.252 (105%)0.315 (157%)0.470 (283%)0.517 (321%)
Eco-points [kPt/kWh (%)] for rain cladding replacement vs. reference
South0.144 (−44%)0.180 (−30%)0.197 (−23%)0.216 (−16%)
East/West0.190 (−26%)0.237 (−7.4%)0.260 (1.4%)0.286 (12%)
North0.503 (96%)0.629 (145%)0.689 (169%)0.758 (196%)

References

  1. Kaufmann, U. Schweizerische Statistik der Erneuerbaren Energien, Ausgabe 2016. Technical Report 2017.1002.01. Bundesamt für Energie BFE, 2017. Available online: http://www.bfe.admin.ch/php/modules/publikationen/stream.php?extlang=de&name=de_729286095.pdf (accessed on 30 August 2018).
  2. Swiss Federal Office of Energy SFOE—Nuclear Energy. Available online: http://www.bfe.admin.ch/themen/00511/index.html?lang=en (accessed on 7 November 2018).
  3. Wittkopf, S. Architektonische Veredelung von Photovoltaik für die Gebäudeintegration. In Proceedings of the 16th Nationale Photovoltaik-Tagung, Bern, Switzerland, 19–20 April 2018; Available online: https://www.swissolar.ch/fileadmin/user_upload/Tagungen/PV-Tagung_2018/Praesentationen/PVT18_5.2_Stephen_Wittkopf.pdf (accessed on 3 September 2018).
  4. Ballif, C.; Perret-Aebi, L.E.; Lufkin, S.; Rey, E. Integrated Thinking for Photovoltaics in Buildings. Nat. Energy 2018, 3, 438–442. [Google Scholar] [CrossRef]
  5. Wittkopf, S. Coloured Cover Glass for Photovoltaic Module. Patent DE 102016001628 A1, 2017. Available online: https://patents.google.com/patent/DE102016001628A1/en (accessed on 19 October 2018).
  6. Schregle, R.; Krehel, M.; Wittkopf, S. Computational Colour Matching of Laminated Photovoltaic Modules for Building Envelopes. Buildings 2017, 7, 72. [Google Scholar] [CrossRef]
  7. Schregle, R.; Wittkopf, S. An Image-Based Gamut Analysis of Translucent Digital Ceramic Prints for Coloured Photovoltaic Modules. Buildings 2018, 8, 30. [Google Scholar] [CrossRef]
  8. Masson, G.; Kaizuka, I. Trends 2017 in Photovoltaic Applications—Survey Report of Selected IEA Countries between 1992 and 2016. Technical Report IEA PVPS T1-32:2017. International Energy Agency Photovoltaic Power Systems Programme, 2017. Available online: http://www.iea-pvps.org/fileadmin/dam/public/report/statistics/IEA-PVPS_Trends_2017_in_Photovoltaic_Applications.pdf (accessed on 30 October 2018).
  9. Green, M.A. Commercial progress and challenges for photovoltaics. Nat. Energy 2016, 1, 15015. [Google Scholar] [CrossRef]
  10. Söderström, T.; Papet, P.; Ufheil, J. Smartwire Connection Technology. In Proceedings of the 28th European Photovoltaic Solar Energy Conference and Exhibition, Paris, France, 30 September–4 October 2013; pp. 495–499. [Google Scholar] [CrossRef]
  11. Chown, A.; Brown, W.; Poirier, G. Evolution of Wall Design for Controlling Rain Penetration. Construction Technology Update 1997, No 9. Available online: https://pdfs.semanticscholar.org/7b84/6cc2d5d7d5fbcd0f7244a454b4f9b2ab5445.pdf (accessed on 10 September 2018).
  12. CPD 10 2017: Glass Rainscreen Cladding Systems. Available online: https://www.building.co.uk/cpd/cpd-10-2017-glass-rainscreen-cladding-systems/5088631.article (accessed on 13 September 2018).
  13. Ayres, R.U. Life Cycle Analysis: A Critique. Resour. Conserv. Recycl. 1995, 14, 199–223. [Google Scholar] [CrossRef]
  14. Passell, P. The Garbage Problem: It May Be Politics, Not Nature. The New York Times. 26 February 1991. Available online: https://www.nytimes.com/1991/02/26/science/the-garbage-problem-it-may-be-politics-not-nature.html (accessed on 5 November 2018).
  15. Technical Committee ISO/TC 207/SC 5. Environmental Management—Life Cycle Assessment—Principles and Framework. Technical Report ISO 14040:2006(en). International Standards Organisation ISO, 2006. Available online: https://www.iso.org/obp/ui/#iso:std:iso:14040:ed-2:v1:en (accessed on 7 November 2018).
  16. Technical Committee ISO/TC 207/SC 5. Environmental Management—Life Cycle Assessment—Requirements and Guidelines. Technical Report ISO 14044:2006(en). International Standards Organisation ISO, 2006. Available online: https://www.iso.org/obp/ui/#iso:std:iso:14044:ed-1:v1:en (accessed on 7 Novermber 2018).
  17. Wang, Y.; Tian, W.; Ren, J.; Zhu, L.; Wang, Q. Influence of a building’s integrated-photovoltaics on heating and cooling loads. Appl. Energy 2006, 83, 989–1003. [Google Scholar] [CrossRef]
  18. Baljit, S.; Chan, H.Y.; Sopian, K. Review of building integrated applications of photovoltaic and solar thermal systems. J. Clean. Prod. 2016, 137, 677–689. [Google Scholar] [CrossRef]
  19. Zhang, T.; Wang, M.; Yang, H. A Review of the Energy Performance and Life-Cycle Assessment of Building-Integrated Photovoltaic (BIPV) Systems. Energies 2018, 11, 34. [Google Scholar] [CrossRef]
  20. Jayathissa, P.; Jansen, M.; Heeren, N.; Nagy, Z.; Schlueter, A. Life cycle assessment of dynamic building integrated photovoltaics. Sol. Energy Mater. Sol. Cells 2016, 156, 75–82. [Google Scholar] [CrossRef]
  21. Ng, P.K.; Mithraratne, N. Lifetime performance of semi-transparent building-integrated photovoltaic (BIPV) glazing systems in the tropics. Renew. Sustain. Energy Rev. 2014, 31, 736–745. [Google Scholar] [CrossRef]
  22. Quintana, M.; King, D.; McMahon, T.; Osterwald, C. Commonly observed degradation in field-aged photovoltaic modules. In Proceedings of the Conference Record of the 29th IEEE Photovoltaic Specialists Conference, New Orleans, LA, USA, 19–24 May 2002; pp. 1436–1439. [Google Scholar] [CrossRef]
  23. Frischknecht, R.; Heath, G.; Raugei, M.; Sinha, P.; de Wild-Scholten, M. Methodology Guidelines on Life Cycle Assessment of Photovoltaic Electricity, 3rd Edition. Technical Report IEA-PVPS T12-08:2016. International Energy Agency Photovoltaic Power Systems Programme, 2016. Available online: http://www.iea-pvps.org/fileadmin/dam/public/report/technical/Task_12_-_Methodology_Guidelines_on_Life_Cycle_Assessment_of_Photovoltaic_Electricity_3rd_Edition.pdf (accessed on 6 November 2018).
  24. Frischknecht, R.; Itten, R.; Sinha, P.; de Wild-Scholten, M.; Zhang, J.; Fthenakis, V.; Kim, H.C.; Raugei, M.; Stucki, M. Life Cycle Inventories and Life Cycle Assessments of Photovoltaic Systems. Technical Report IEA-PVPS T12-04:2015. International Energy Agency Photovoltaic Power Systems Programme, 2015. Available online: http://www.iea-pvps.org/fileadmin/dam/public/report/technical/IEA-PVPS_Task_12_LCI_LCA.pdf (accessed on 30 September 2018).
  25. Wernet, G.; Bauer, C.; Steubing, B.; Reinhard, J.; Moreno-Ruiz, E.; Weidema, B. The Ecoinvent Database Version 3, Part I: Overview and Methodology. Int. J. Life Cycle Assess. 2016, 21, 1218–1230. [Google Scholar] [CrossRef]
  26. Allocation at the Point of Substitution–Ecoinvent. Available online: https://www.ecoinvent.org/database/system-models-in-ecoinvent-3/apos-system-model/allocation-at-the-point-of-substitution.html (accessed on 6 November 2018).
  27. De Wild-Scholten, M. Life Cycle Assessment of Photovoltaics Status 2011, Part 1: Data Collection. Technical Report. SmartGreenScans: Groet, The Netherlands, 2014. Available online: http://smartgreenscans.nl/publications/SmartGreenScans-2014-Life-Cycle-Assessment-of-Photovoltaics-Status-2011-Part-1-Data-Collection--Sample-Pages.pdf (accessed on 7 November 2018).
  28. Pilkington, L.A.B. Review Lecture: The Float Glass Process. Proc. R. Soc. Lond. A 1969, 314, 1–25. [Google Scholar] [CrossRef]
  29. ift Rosenheim GmbH. Umweltdeklaration (EDP) für Flachglas, Einscheibensicherheitsglas, Verbundsicherheitsglas. Technical Report M-EPD-FEV-002005. Euroglas GmbH, 2017. Available online: https://www.glastroesch.ch/fileadmin/content/euroglas/Deutsch/Service/Zertifizierungen/EPD/2018-03-20_Euroglas_M-EPD_FG_ESG_VSG__002_.pdf (accessed on 16 September 2018).
  30. Usbeck, V.C.; Pflieger, J.; Sun, T. Life Cycle Assessment of Float Glass. Technical Report. Glass for Europe, 2010. Available online: https://www.agc-yourglass.com/agc-glass-europe/au/de/pdf/lca/LCA.pdf (accessed on 7 November 2018).
  31. Tschümperlin, L.; Stolz, P.; Wyss, F.; Frischknecht, R. Life Cycle Assessment of Low Power Solar Inverters (2.5 to 20 kW). Technical Report 174-Update Inverter_IEA PVPS_v1.1; Swiss Federal Office of Energy SFOE, 2016. Available online: http://www.treeze.ch/fileadmin/user_upload/downloads/Publications/Case_Studies/Energy/174-Update_Inverter_IEA_PVPS_v1.1.pdf (accessed on 7 November 2018).
  32. Wambach, K. Life Cycle Inventory of Current Photovoltaic Module Recycling Processes in Europe. Technical Report IEA-PVPS T12-12:2017. International Energy Agency Photovoltaic Power Systems Programme, 2017. Available online: http://www.iea-pvps.org/index.php?id=369&eID=dam_frontend_push&docID=4239 (accessed on 26 October 2018).
  33. Intergovernmental Panel on Climate Change. Anthropogenic and Natural Radiative Forcing. In Climate Change 2013—The Physical Science Basis; Cambridge University Press: Cambridge, UK, 2014; pp. 659–740. [Google Scholar] [CrossRef]
  34. Frischknecht, R.; Büsser Knöpfel, S. Ökofaktoren Schweiz 2013 gemäss der Methode der ökologischen Knappheit—Methodische Grundlagen und Anwendung auf die Schweiz. Technical Report UW-1330-D; Bundesamt für Umwelt BAFU, 2013. Available online: https://www.bafu.admin.ch/bafu/de/home/themen/wirtschaft-konsum/publikationen-studien/publikationen/oekofaktoren-2015-knappheit.html (accessed on 30 August 2018).
Figure 1. Layers comprising a multi-coloured glass-glass photovoltaic laminate. A translucent multi-coloured motif (layer 2) is printed on the inner surface of the front glass sheet [3].
Buildings 09 00008 g001
Figure 2. Rainscreen wall system: Glass cladding installed on the outside of a building (a) and a rainscreen cladding sub-construction (b) [12].
Buildings 09 00008 g002
Figure 3. Configuration of an architecturally integrated 24.6 kWp photovoltaic (PV) façade facing south consisting of 140 multi coloured glass-glass (MCGG) laminates generating 466 MWh over 30 years. While a 30 kWp inverter is installed, its data is derived from that of a 20 kWp inverter scaled by a factor of 1.5. Product systems with grey background were specified from industrial data, while those with white background were derived from literature values and estimates.
Buildings 09 00008 g003
Figure 4. Material (kg) and energy (kWh) flows to produce 1.615 m 2 of a multi-coloured and a clear solar glass sheet with 4 mm thickness at a Swiss glass supplier. Arrowheads labelled I denote import flow, indicating an input material or energy, while those labelled E denote export flow, indicating a product, waste, or loss. The data was derived from the material and energy balance as well as the measured electricity consumption of the production steps and support processes. These were obtained from the Swiss glass manufacturer (courtesy of Glas Trösch AG, 2017).
Buildings 09 00008 g004
Figure 5. Material (kg) and energy (kWh) flows to produce 1.615 m 2 of a multi-coloured glass-glass PV laminate with 60 crystalline silicon cells, a junction box, and connecting cable. Arrowheads labelled I denote and import flow, indicating an input material or energy, while those labelled E denote an export flow, indicating a waste or loss. Data was derived from literature [27] and updated with material balance data and measured electricity consumption of the production steps and supporting processes provided by a German PV module manufacturer (courtesy of GES Gebäude- und Energiesysteme GmbH, 2018).
Buildings 09 00008 g005
Figure 6. Per-process and component breakdown of eco-points for 1.615 m 2 of multi-coloured glass for a PV laminate modelled in this study. The total (34.2 kPt) is 51% higher than that of tempered solar glass (22.6 kPt) in Ecoinvent. The printing step to obtain the multi-coloured glass only contributes 3% to the total impact.
Buildings 09 00008 g006
Figure 7. Eco-points for the production for various glass-glass PV laminate configurations. The reference data is for a 1.615 m 2 glass-foil.
Buildings 09 00008 g007
Figure 8. Percentile breakdown of eco-points for various façade configurations consisting of 140 PV modules: 24.6 kWp m-Si (a) and 28 kWp s-Si (b) multi-coloured glass-glass, and 30.8 kWp traditional foil-glass (c).
Buildings 09 00008 g008
Figure 9. Environmental impact of 1 kWh of electricity generated from each configuration and orientation of the PV façade in terms of global warming potential (GWP) (a) and eco-points (b).
Buildings 09 00008 g009
Figure 10. Cumulative energy demand (CED) non-renewable of an MCCG, m-Si PV façade over time, and energy pay-back time (EPBT) compared to Swiss low voltage electricity grid as reference.
Buildings 09 00008 g010
Table 1. Abbreviations and terminology used in this paper.
TermDefinition
ACAlternate current
BIPVBuilding integrated photovoltaics
BOSBalance of system
CEDCumulative energy demand
c-SiCrystalline silicon cell
EPBTEnergy pay-back time
EVAEthylene-vinyl acetate
GWPGlobal warming potential
ISOInternational Organization for Standardisation
IPCCIntergovernmental Panel of Climate Change
LCALife cycle assessment
LCILife cycle inventory
MCGGMulti coloured glass-glass
m-SiMulti crystalline silicon cell
PVPhotovoltaics
s-SiSingle crystalline silicon cell
Table 2. Typical specifications of a photovoltaic laminate considered in this study.
ParameterBasic ConfigurationVariants
Dimension of PV laminate1.00 m × 1.615 m
Weight of PV laminate35.47 kg
Glass thickness4 mm × 2 = 8 mm
Glass weight16.15 kg × 2 = 32.3 kg
Glass typemulti-coloured (80% performance)clear glass
Type of cells60 m-Si cells (220 Wp)60 s-Si cells (250 Wp)
Thickness of cell0.2 mm
Wiring technology for cells3 busbar tap wirings36 active(smart) wirings [10]
Table 3. Façade installation considered in this study as use case for photovoltaic (PV) laminates.
ParameterBasic ConfigurationVariants
PV typem-Si (15% efficiency)
multi-coloured
s-Si (17% efficiency)
Laminate capacity
(System capacity)
176 Wp (24.6 kWp)m-Si clear glass: 220 Wp (30.8 kWP)
s-Si clear glass 250 Wp (35 kWp)
s-Si coloured glass 200 Wp (28 kWP)
Number of laminates140
Laminates used over lifetime144.23 (1% rejected in construction
of façade, 2% replaced due to early
end of life)
Façade dimension21 m × 12 m = 252 m 2
Projected lifetime30 years
Annual yield/kWp installed
before degradation according
to façade orientation
Facing south: 700 kWh/kWp
Facing east/west: 530 kWh/kWp
Facing north: 200 kWh/kWp
Degradation of PV0.69 % per year from the first year,
total 20 % for 30 years
Lifetime yield according to
façade orientation
Facing south: 582 MWh
Facing east/west: 440 MWh
Facing north:166 MWh
Table 4. Data sources for the elaboration of the life cycle inventory (LCI) for other processes and components.
Processes and ComponentsRemark, Source/Reference
30 kWp inverterLCA of low power solar inverters (2.5 to 20 kW) [31]
Mounting and electric systemEcoinvent 3.4 [25]
InstallationTransportation and electricity for mounting, Ecoinvent 3.4
Cleaning and maintenanceWater consumption and waste water treatment, Ecoinvent 3.4
Take-back & recycling of laminate
with one glass sheet
Energy consumption for shredding was adapted to the higher glass
quantity in a glass-glass laminate. It is assumed the quality of the
glass cullet is too low for recycling in float glass production [32].
Table 5. Indicators selected for the life cycle impact assessment (LCIA) in this study.
NameUnitRemark
Global warming potential
(GWP)
Grams CO 2 -equivalents [g CO 2 eq]Contains Intergovernmental Panel of Climate
Change (IPCC) climate change factors for a
timespan of 100 years [33]
Cumulative energy demand
(CED)
MJ-equivalents [MJ eq]Contains the energy content of renewable and
non-renewable primary energy [23]. In this study,
only non-renewable primary energy is considered.
Ecological Scarcity 2013Eco-points [EP]Eco-points reflect both the actual emission situation
and the national or international emission targets
pursued by Switzerland [34].
Energy Payback Time
(EBPT)
YearsTime required to generated enough electricity, so
that Non-renewable CED/kWh becomes the same
as one of the reference electricity [23]. Refers to
the efficiency of the Swiss low voltage electricity
grid at the consumer end (9.43 MJ/kWh acc. to
Ecoinvent 3.4)

