1. Introduction
Underground traffic systems in cities, particularly subway tunnels, are being increasingly developed [
1,
2,
3]. Subway tunnels are commonly built under existing structures [
4,
5,
6,
7,
8]. The development of subway tunnels has inevitably resulted in the construction of metro tunnels and various engineering structures [
9,
10,
11]. For example, industrial and civil buildings are often built in the upper parts of a subway, and excavations are conducted near subways when constructing various structures [
12]. The influence of engineering construction activities on the upper part of existing subway tunnels should be investigated. Engineering activities in the upper part of subway tunnels can be defined as loading and unloading processes of soil in the upper part of subway tunnels [
13]. These loading and unloading processes of soil in the upper part of subway tunnels have different effects on subway tunnels with varying cross-sections [
14,
15,
16,
17].
Many scholars have carried out research on the mechanics of newly built tunnels passing under existing structures. Ratan Dasa [
17] conducted a numerical simulation of a shallowly-buried, two-way, asymmetric tunnel in India, and studied the ground settlement and formation stability problems that may be caused by the subterranean construction. Wan [
18] used Beijing Metro Line 7, which passes under the existing Shuangjing Station on Line 10, as a case study. The construction of Line 7 was carried out using different construction methods, such as the full-section method, the bench method and the CRD method. The deformation and stress of the existing structure under different excavation modes were analyzed according to the simulation results, and the specific parameters of the auxiliary method were simulated to further determine the suitable reinforcement range and reinforcement length. Fang and Kenneally [
19] conducted similar experimental studies on an expressway tunnel underpass under a coal mine. Their test focused on the influence of the distance between the tunnel and the dislocation interfaces and dip of the inclined coal seam.Zheng, Y and Qiu, W and others studied the section of the Changchun Light Rail that passes under a section of railway. The centrifuge of the subgrade settlement caused by the construction was studied using a model of water injection and waterproofing to simulate the formation loss caused by the tunnel construction.
This study analyzes the impact of the anti-uplift protection measures of metro tunnels on the protection effect for different tunnels within the Shuangjie River gallery project in Shenzhen. ABAQUS was used to simulate the unloading conditions in the upper section of the subway tunnels with different sections.
2. Project Overview
2.1. Engineering Background
This study is based on the Shuangjie River water gallery project in Shenzhen, and the specific layout planning of the project is shown in
Figure 1. The project mainly aims to transfer the main channel of the existing double-boundary river toward the south by 35 m. The water gallery will intersect with the Qianhai car access road after the transfer, as shown in
Figure 2.
2.2. Metro Protection Program
The excavation project adopts a staged construction method with a length of 10 m. The first excavation of the ground elevation control is above an elevation of 1.0 m (within 5 m), which forms a temporary construction platform. Bored piles (the pile top elevation is approximately −2.0 m) are set on both sides of the tunnel (with a 3.5 m interval). The diameter of a pile is 1.2 m, and its spacing is 3–4 m. The piles exhibit a pull-up effect. The soil below the elevation of −2.0 m is grouted and reinforced, and the second excavation is conducted. The location of the second excavation reaches the design of the main groove bottom elevation (approximately −2.0 m elevation). The reinforced concrete cover is poured on top of the cast-in-place pile, and the cast-in-place pile is consolidated with the cover to reduce bulge deformation. A typical section of the subway is shown in
Figure 3.
3. Numerical Simulation
3.1. Numerical Simulation Program
The numerical analysis software used was ABAQUS, an international large-scale finite element analysis software. ABAQUS simulated the water gallery of the right parking and exit intersection areas of the Qianhai parking lot. The left and right exits are mainly the cross-sections of different forms. The left side of the parking lot is a circular cross-section, whereas the right side is a square cross-section. Therefore, the numerical simulation mainly investigates the protective effect of the metro tunnel anti-uplift protection measures on metro tunnels with different sections and their mechanisms.
The tunnel anti-uplift protection measures of the parking access lines are shown in
Figure 4 and
Figure 5.
3.2. ABAQUS Numerical Model
To analyze the influence of the water gallery construction on the safety performance of the existing subway tunnel under the designed protection scheme, the initial numerical simulation model considers the geological conditions of the tunnel in the Qianhai parking lot before excavation. In particular, the parking lot’s entrance and exit were first simulated during the construction process, and then the construction of the water gallery was simulated.
In order to reduce the influence of the boundary effect, the model size needed to be extended to the tunnel boundary size. According to the principle of numerical analysis and general processing experience, the influence range of the foundation pit excavation in the horizontal direction was 3~5 times the excavation depth, and the influence range in the vertical direction was 2~4 times the excavation depth. In order to study the influence of foundation pit excavation on tunnel structure and reduce the boundary effect, the length, width and height of the model were set to 110 m, 60 m and 50 m, respectively.
The vertical direction of the model was constrained for horizontal displacement. The bottom surface was constrained for displacement in three directions, and the upper surface boundary was free. The strata distributed in the calculation model were mainly fill layer, silt, stone filling and weathered granite. As for the finite element mesh division, the mesh was related to the calculation accuracy. However, a dense grid will increase the computing time, and the cells should be divided reasonably. The total number of model units established was 96,885. The intersection models of the Qianhai parking tunnel and water gallery are shown in
Figure 6 and
Figure 7.
3.3. Numerical Simulation Analysis Steps
The numerical simulation analysis was basically the same as the actual construction procedure. The specific analysis steps are listed in
Table 1.
3.4. Material Parameters
In the numerical simulation, the Mohr–Coulomb model was used for rocks and soil, whereas the elastic model was adopted for the support of uplift piles, cover plates, and subway tunnels. The specific parameter values are provided in
Table 2.
4. Analysis of Results
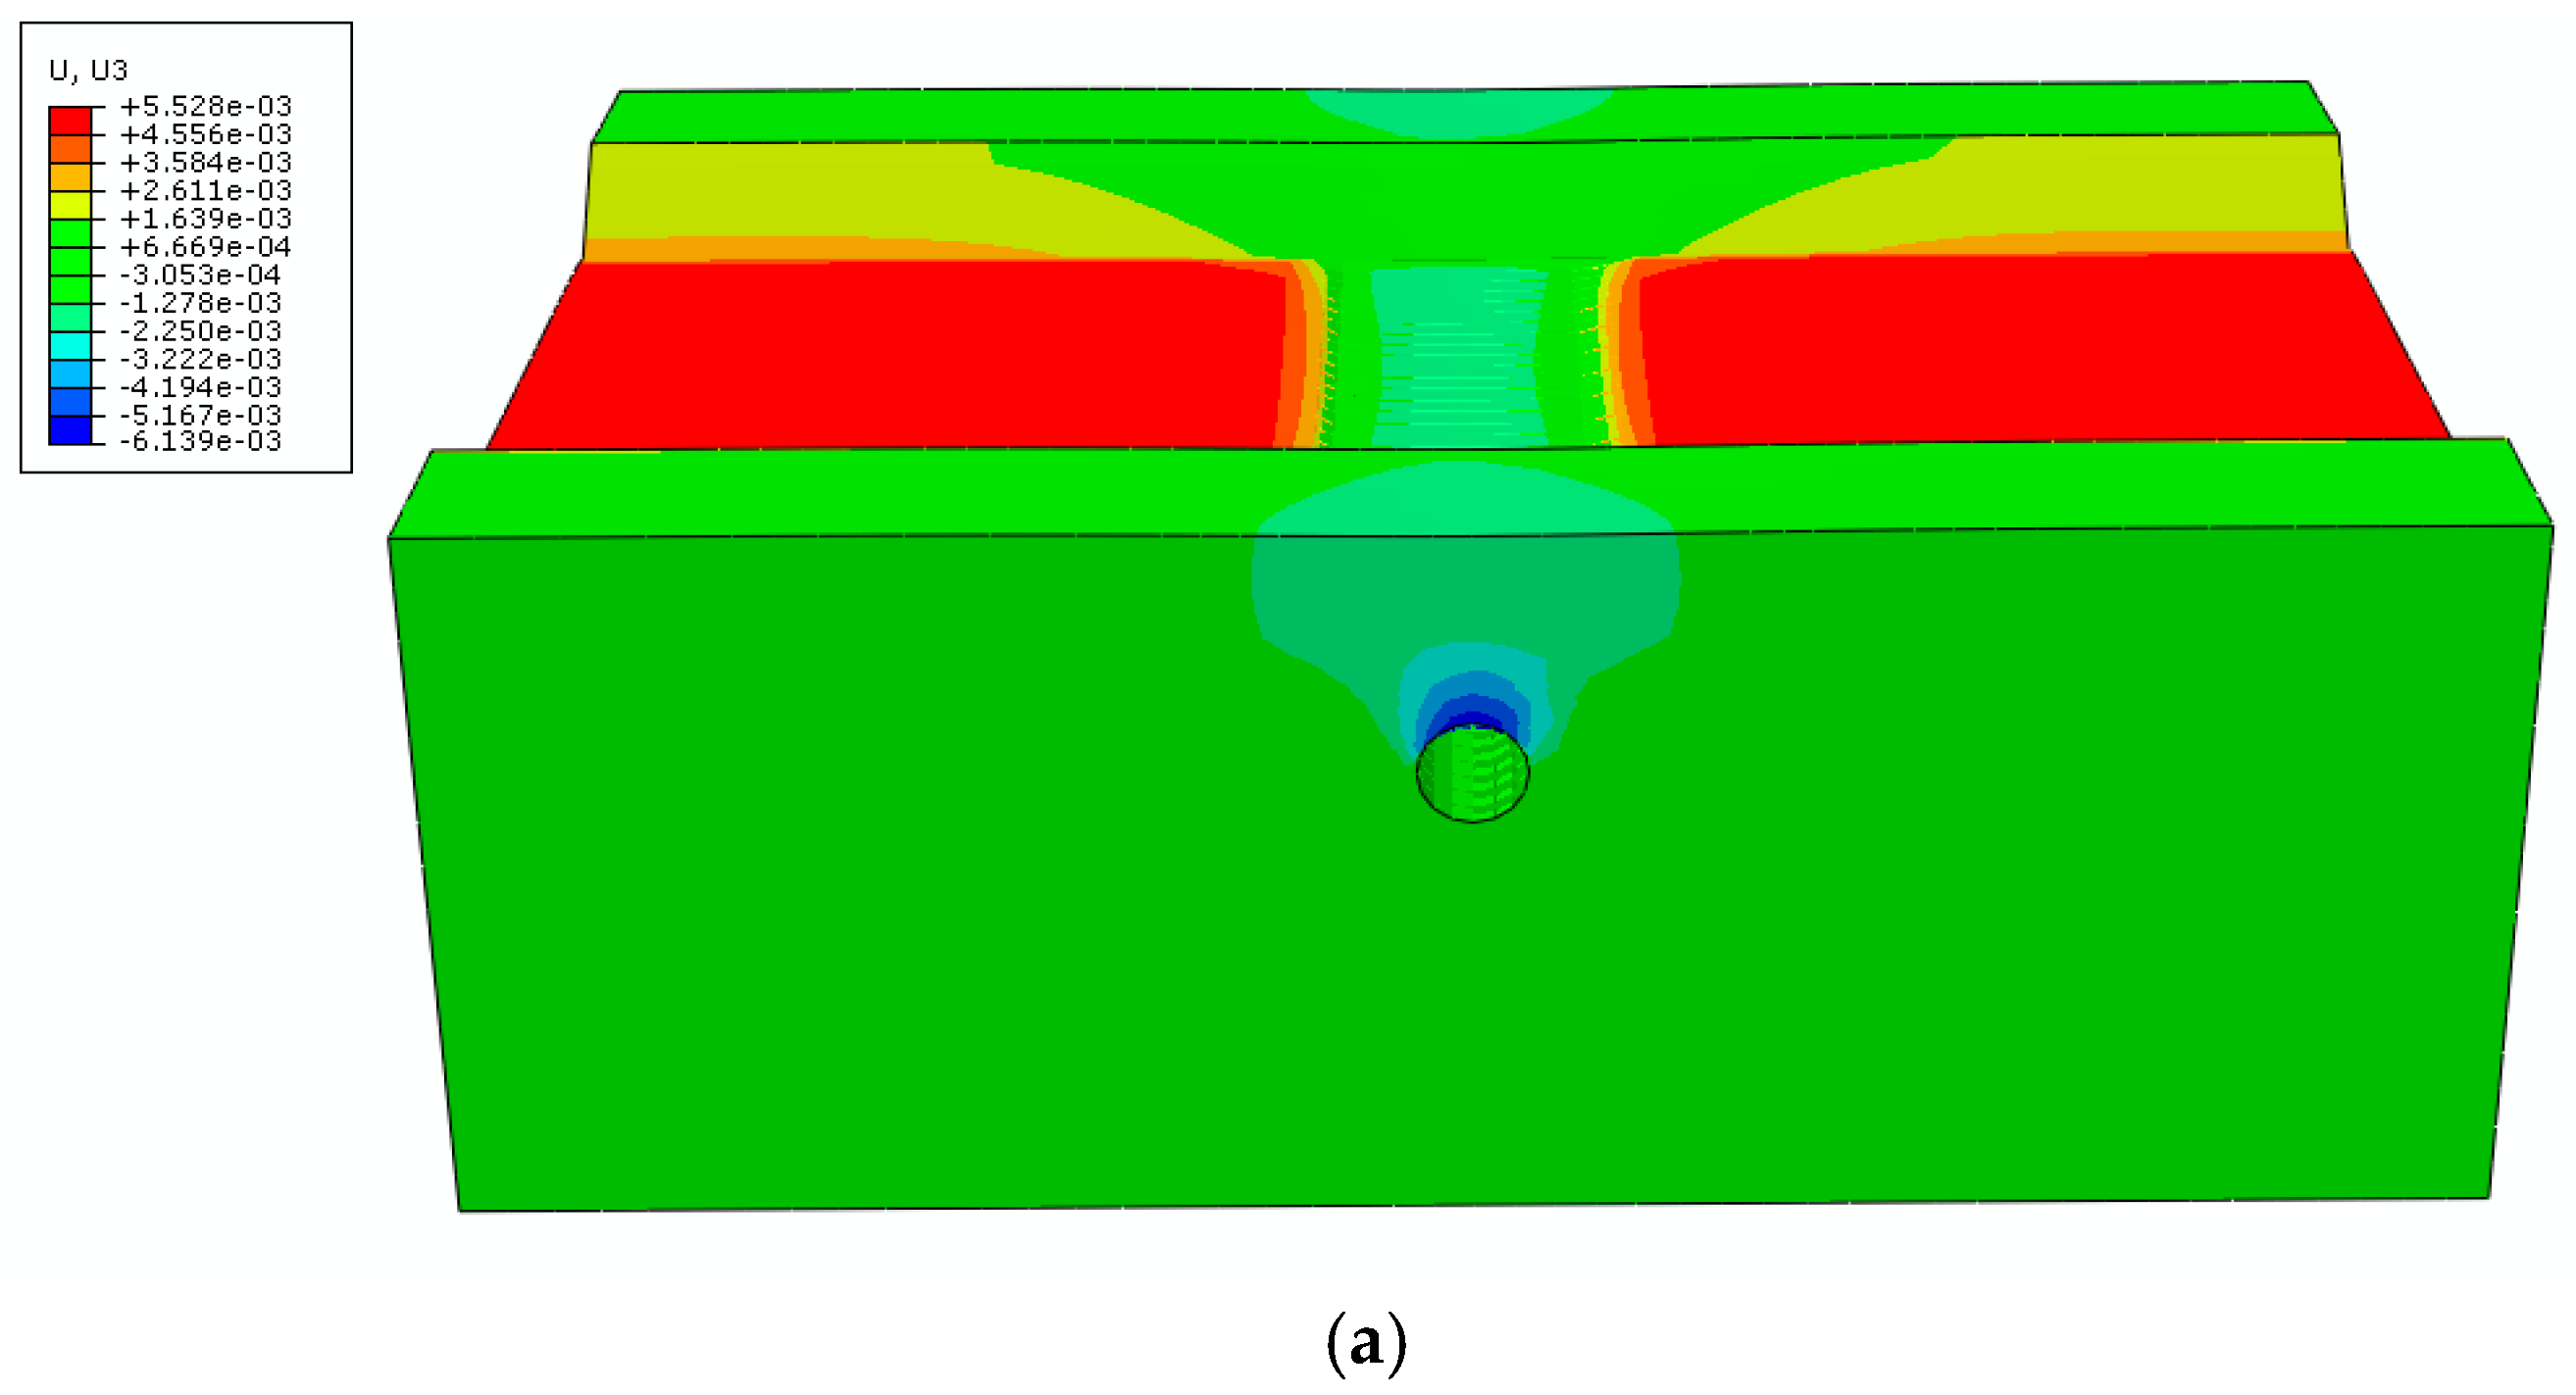
The vertical deformation of the subway tunnel of the parking access line and water gallery after construction was completed is shown in
Figure 8.
To investigate the protective effect of the anti-uplift protection measures for the subway tunnels on the cross-sections of different subway tunnels, the stress and strain of the cover and maintenance piles were analyzed separately. The amount of dome bump in the subway tunnel was analyzed comparatively to obtain the difference between the two sections.
4.1. Covered Plate
The cover, which uses reinforced concrete material for subway tunnel protection, has a thickness of 600 mm. The left lane of the parking lot was 2.83 m from the underside of the reinforced concrete deck. The right tunnel dome was 3.43 m from the underside of the deck. To analyze the cover deformation, three typical cross-sections of the cover were used, as shown in
Figure 9. The deformation curves of the three sections of the upper tunnel cover are shown in
Figure 10 and
Figure 11.
As shown in
Figure 10, bumps appeared on both sides of
Section 1 of the upper left circular cross-section of the tunnel. The maximum bump size was 1 mm. Subsidence occurred in the middle section and the maximum settlement was 1.45 mm.
Section 2 also increased on both sides, with a maximum value of 3.45 mm. Subsidence occurred in the middle section, and the maximum value was 1.65 mm. The deformations of
Section 3 and
Section 2 were basically similar. The maximum uplift was 3.5 mm, and the maximum settlement was 1.75 mm.
Section 1 is under control due to the soil being restrained along the banks of the water gallery. Therefore, the deformation amount was relatively smaller than that of
Section 2 and
Section 3. In addition, the maintenance of the two sides of the cover limits the bulge in the cover deformation and passes its own shear force to the cover. The cover is subjected to an axial force, and the final forms of stress are axial force (pressure), shear force, and the bending moment. In the initial stage, the retaining pile suffered from vertical upward deformation, during which both sides of the cover plate were tilted. Simultaneously, axial pressure was applied, during which the middle part of the cover plate was deflected downward to cause vertical downward deformation. This deformation exhibited good resistance to the bulge of the dome of the subway tunnel to a certain extent and prevented the excessive bulge deformation of the dome.
As shown in
Figure 11,
Section 1 had a vertical downward deformation on the upper cover of the right-angled, square section subway tunnel. The vertical deformation of the two sides was 0.6 mm, and the middle deformation was the largest at 5.1 mm. The two sides of
Section 2 present an uplift deformation. The maximum uplift was 1.1 mm, the middle section had a settlement deformation, and the maximum settlement was 5.85 mm.
Section 2 and
Section 3 had the same deformation curve.
Section 1 was located at the junction of the cover plate and water gallery slope. The position of the cover plate and the excavation of the soil above it caused the slope of the water gallery bank to sink downward. The lower part of the cover tended to form a vertical bulge. The two sides of
Section 1 subsided slightly due to the constraint of this section and the bank slope. Compared with the left circular tunnel of the parking lot, the uplift of the upper cover of the right square tunnel was relatively small and its settlement was relatively large. Thus, the capacity of the square section of the subway tunnel to accommodate the upper load was considerably weaker than that of the circular tunnel.
4.2. Retaining Pile
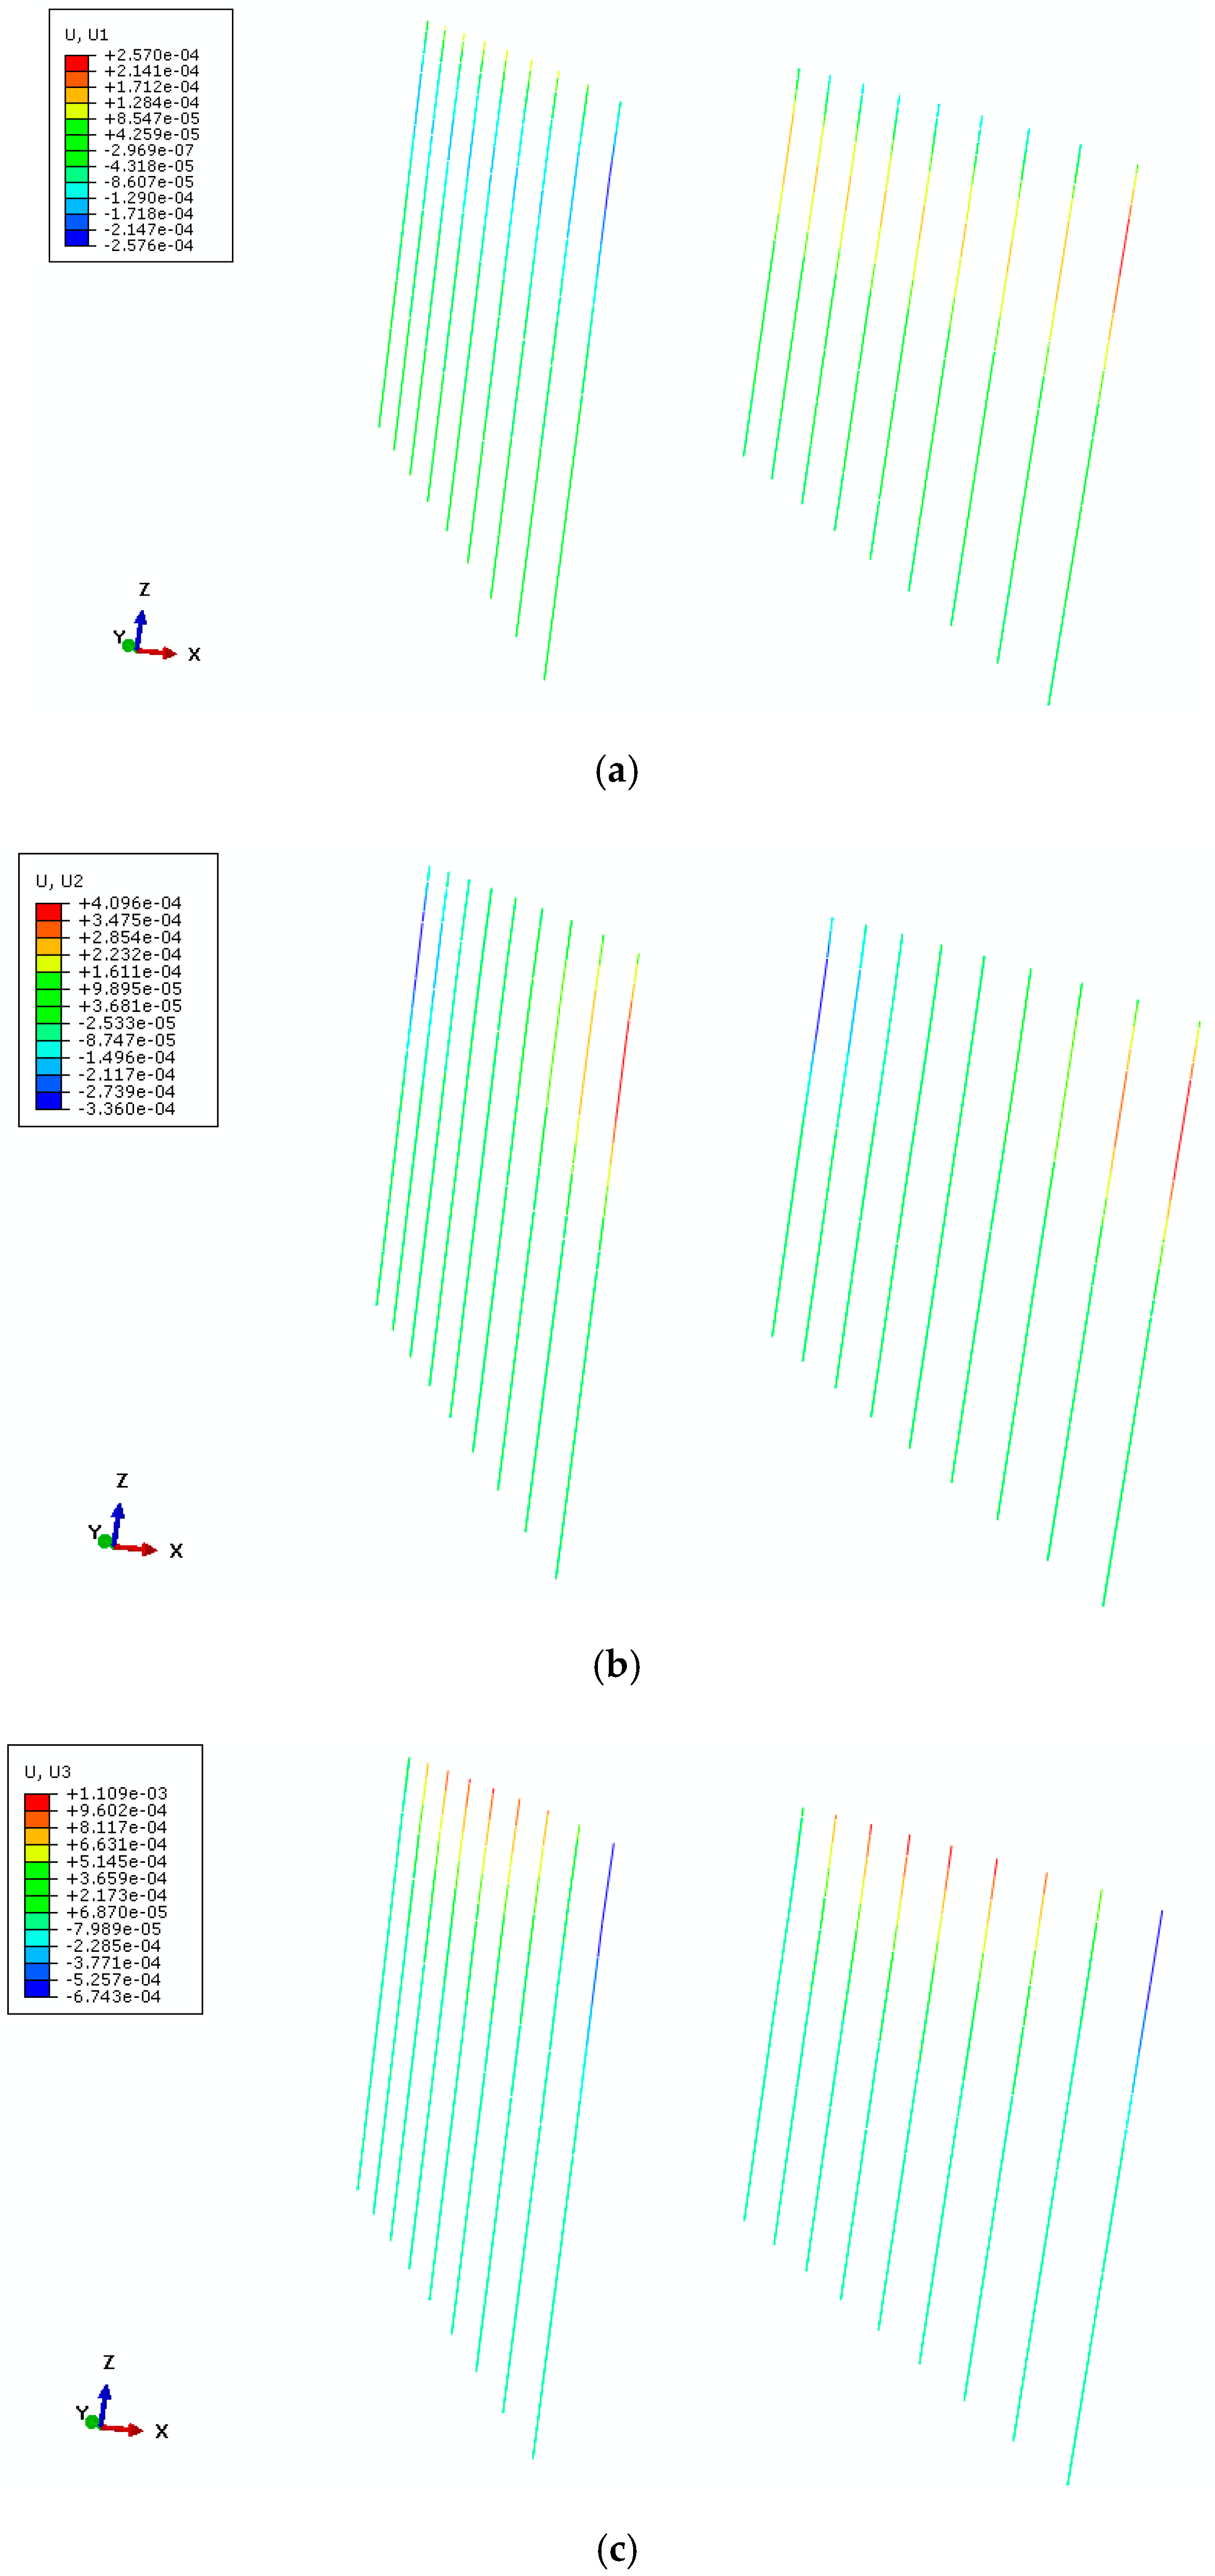
The length of the retaining pile on both sides of the tunnel was 16 m, and was a circular section with a diameter of 1.2 m. The deformation maps of the retaining pile in three directions after the excavation of the water gallery was completed are shown in
Figure 12 and
Figure 13. The shear cloud of the retaining pile is shown in
Figure 14. The shear force curve of a typical retaining pile with depth is shown in
Figure 15.
As shown in
Figure 14 and
Figure 15, the maximum deformation of the retaining pile in the
x direction on both sides of the left line was 1.2 mm, and the direction was a vertical tunnel. The maximum deformation of the retaining pile on both sides of the right line in the
x direction was 0.26 mm. The direction was from the tunnel to both sides of the radiation, which is contrary to the deformation direction of the circular tunnel retaining pile. As shown in
Figure 15, the combination of the upper cover of the square tunnel and the retaining pile provided the stress value to the retaining pile via the Earth’s pressure in the upper part of the tunnel dome, which was smaller than that of the circular tunnel. The maximum deformation of the retaining pile on both sides of the left circular subway tunnel in the
y direction was 0.76 mm, and the direction was from the middle of the water gallery to both sides of the water gallery. The maximum deformation of the retaining pile in the
y direction on both sides of the right line was 0.41 mm, and the direction was from the middle point of the water gallery to both sides of the water gallery. The maximum deformation of the retaining pile on both sides of the left tunnel in the
z direction was 3.5 mm, and the direction was vertically upward. The maximum deformation of the retaining pile on both sides of the right tunnel in the
z direction was 1.1 mm, and the direction was also vertically upward. The displacement of the retaining pile of the left lane tunnel was larger than that of the right lane, thereby indicating that the upper cover of the square tunnel was working efficiently.
As shown in
Figure 14 and
Figure 15, the maximum shear force value of the retaining pile on both sides of the left circular cross-section subway tunnel was 1.35 MPa and appeared at a position approximately 1 m above the tunnel dome. Two evident cases of shear force sign mutation were observed. The mutation location depended on the center of the circular section, and the maximum value after the mutation depended on the bottom of the circular section. The maximum shear value of the retaining pile on both sides of the right tunnel was 0.49 MPa, and the maximum value appeared in the position where the direction tunnel vault was located. A clear two-value shear force sign mutation was observed on the right line, for which the first mutation was located at the level of the square tunnel center. When the curves of the shear forces on the two sides of the two retaining sections were compared, the shear force of the retaining columns beside the square tunnel was found to be considerably smaller than that of the circular tunnel. The maximum shear value of the retaining pile on both sides of the square tunnel was 36.3%. Therefore, the existing protective measures were safer and more suitable for square tunnels than for circular tunnels, in terms of the shearing force of the retaining pile.
4.3. Subway Tunnel Vault
Figure 16 presents the vertical deformation curve of the subway tunnel vault along the tunnel under the influence of the water gallery construction. As shown in the figure, the maximum uplift of the arch of the left circular tunnel was 0.029 mm, and was located at the intersection of the water gallery shore and the left tunnel. The middle position had an evident straight section, and the length of the straight section was the same as the length of the cover plate. The minimum bulge in the straight section was 0.025 mm. This condition shows evident inhibition of the tunnel vault cover. The maximum uplift of the right tunnel vault was 0.05 mm, this was also located at the intersection of the water gallery bank and the left tunnel. An evident concave section was observed in the reinforced concrete cover position. The minimum amount of bulge in the middle of the square tunnel was 0.005 mm, which is considerably lower than the minimum bulge of the straight section of the circular tunnel. This shows that the inhibition of the reinforced concrete cover of the square tunnel uplift was better than that of the circular tunnel. This finding is attributed to the fact that the shape of the cover was the same as that of the square tunnel, and that the force synergy was better than that of the circular tunnel. In addition, the crown of the square tunnel vault that covered the edge location of the uplift was considerably larger than that of the circular tunnel. Therefore, the cover plate should be embedded into the interior of both sides of the water gallery to ensure the anti-raising effect of the cover plate and retaining pile in the actual engineering design and construction.
5. Conclusions
(1) In the upper part of the subway tunnel, the cover, which serves as the anti-uplift protection measure of the tunnel, should withstand axial pressure, shear force, and the bending moment. Under the combined action of these forces, warping deformation occurred on both sides of the cover plate, and vertical downward deformation occurred in the middle section. The vertical deformation on the upper deck of the square section tunnel was larger than that of the circular tunnel.
(2) Retaining piles, which are part of the anti-uplift protection system for metro tunnels, resist pull and are able to bear shear forces. The shear strength values of the retaining piles on both sides of the circular and square tunnels exhibited two evident sign mutations, and their maximum shear values were all located near the horizontal plane where the tunnel vault was located. In addition, the maximum shear force of the retaining pile on both sides of the square tunnel was considerably smaller (by 36.3%) than that of the circular tunnel retaining pile.
(3) The protective effect of the current anti-uplift protection system on the circular and square tunnel domes is evident. In addition, the vertical deformation curve of the subway tunnel dome showed that the circular tunnel had a straight segment and the square tunnel had a concave segment, thereby indicating that the current anti-uplift protection system had a better effect on the square tunnel than on the circular tunnel. A considerable amount of bulge was found on both sides of the cover, which suggests that the embedding length of the cover on both sides of the water gallery should be increased in the actual project.


