Article

Assessing the Solar Radiation Quantity of High-Rise Residential Areas in Typical Layout Patterns: A Case in North-East China

1
School of Architecture, Harbin Institute of Technology, Harbin 150006, China
2
Key Laboratory of Cold Region Urban and Rural Human Settlement Environment Science and Technology, Ministry of Industry and Information Technology, No.66 Xidazhi St., Harbin 150006, China
*
Author to whom correspondence should be addressed.
Buildings 2018, 8(11), 148; https://doi.org/10.3390/buildings8110148
Submission received: 6 September 2018 / Revised: 26 October 2018 / Accepted: 30 October 2018 / Published: 2 November 2018

Abstract

:
With the development of energy-saving and emission-reduction, solar energy as a clean energy with excellent characteristics has bright prospects for development and application in residential environment with high energy consumption. With the intensification of land use, there are more and more high-rise residential areas in the city. If the residential construction becomes more compact, the solar radiation of the buildings will be in loss. Therefore, there may exist some restrictive relationship between the residential layout patterns and the solar radiation quantity. Through the multiple response frequency analysis method of SPSS, the study summarizes three typical high-rise residential layout patterns, which are parallel determinant, non-parallel determinant and three-sided enclosure. The Autodesk Ecotect is used to simulate the solar radiation quantity of each building roof and south facade. Last, obtain the relationship between the residential layout index and the solar radiation quantity. The results show that there actually exists certain correlativity between solar radiation quantity and floor area ratio, building density and building height; meanwhile, each annual solar radiation quantity changed by residential layout index has its own variable curve. The results also indicate that three-sided enclosure layout pattern has greater solar radiation potential than parallel determinant and non-parallel determinant. By summarizing the corresponding conclusions, the optimal mode of high-rise settlements with high solar radiation is explored, which can provide reference for further residential planning.

1. Introduction

The 13th Five-Year Plan on energy strategy [1] of the People’s Republic of China has put forward energy-saving and emission-reduction into an important strategic stage. Solar energy is an excellent clean energy which is not geographically restricted and inexhaustibly used. Utilizing solar energy is safe and efficient with broad development prospects. According to relevant regulations of code for classification of urban land use and planning standards of development land in China, the proportion of residential land to urban construction land is 25.0–40.0% [2]. Urban settlements built on residential land are the main part of energy consumption in urban construction and they are greatly depleted in terms of electric energy, water energy and natural gas. The rational development and utilization of solar energy in urban settlements can not only reduce the excessive exploitation of traditional fossil fuels but also inhibit the deterioration of the environmental quality of residential areas, ensuring the living ecology of urban settlements.
With the continuous deepening studies of solar energy in the disciplines of architecture and urban planning, Chinese scholars’ research objects on solar energy have gradually expanded from architectural units to urban areas in the aspect of urban photovoltaic research [3]. Ecotect and PVsyst are used to simulate the solar radiation quantity of building. Ecotect is an analytical software which can be used to obtain building energy consumption, light environment analysis, wind environment analysis and so on, while PVsyst is a photovoltaic system auxiliary design software. And then PV optimal configuration is carried out from the aspects of photovoltaic panel installation angle, arrangement model, environmental benefits and economic benefits [4,5]. Through the study of the micro-configuration of one single building, the effective development and utilization of solar energy has been realized. Chinese scholars focus on the level of urban residential areas with large energy consumption, summarizing different types of settlements and studying the relationship between solar radiation quantity and the orientation and layout of buildings in urban settlements in different scales [6,7,8,9]. However, the application of solar photovoltaics should not end at the residential level. With the technological advancement and industrial upgrading of solar energy research, the potential of photovoltaic utilization has gradually expanded to regional scale. By establishing a regional physical model that reflects the three-dimensional shape of the city, the solar energy utilization potential has been more accurately estimated [10,11]. Foreign researches on solar energy utilization tend to be large-scale, using remote sensing systems to obtain data on land, buildings, population and so forth and calculating the solar radiation quantity in the available areas. Then obtain specific installation accessories indicators for photovoltaic systems in different regions and environments [12,13,14,15,16,17]. In addition, some other relevant software is also used to calculate the PV utilization potential of the urban regional environment. The building can be well planned according to the actual geographic information with the most solar radiation quantity [18,19,20,21,22,23]. In the aspect of urban photothermal research, the optimization and improvement of urban photothermal system gradually extends from individual family to residential group. Through calculating solar radiation quantity, the abundant summer solar energy will be stored by solar collector and vacuum insulation storage container. Then the loop system for residential users provides directly heat or pump system further heating lower temperature solar heat transform the energy to the residents to use again. One study has concluded that through 15 m3 storage tank can provide 41% of the solar direct heating demand for homes and direct heating system efficiency is 51% under its relevant system [24]. In addition, through SWH (Solar water heating) system simulating the household domestic hot water demand, the study changes the solar energy collector area, storage tank volume and other components to optimize heating circulation system and collector parameters so as to adjust the solar energy reception rate in the best circumstance. According to the study, the solar energy obtained through the simulation system can be supplied to households with 83−97% and 30−62% hot water demand in summer and winter respectively [25]. By studying the solar hot water system of different urban residential group to maximize the solar energy, scholars analyze the transmission pipeline heat loss deeply to make the best of solar energy. At last, they design a new circulation system that can provide the user for 38° constant temperature hot water, at the same time saving auxiliary energy and electric energy for running equipment [26]. The optimal configuration of various solar thermal systems is similar in the solar collector as the starter device, which maximizes the solar radiation quantity.
In summary, the research regarding the relationship between residential layout indicators and solar radiation quantity still has new aspects to study. China’s urban construction land is tight. And the urban population is increasing. High-rise residential areas can alleviate the shortage of land use while meeting a large number of residential needs, which is more common in residential construction. Utilizing solar radiation received by buildings in high-rise settlements for photovoltaic and photothermal development is an effective use of renewable energy. And it is also a full use of high-rise residential building space, which has practical significance.
If the residential construction becomes more compact, the solar radiation of the buildings will be in loss. Therefore, there may exist some restrictive relationship between the residential layout patterns and the solar radiation quantity. Some studies have focused on the relationship between the solar radiation and urban pattern. Mostly, these studies have compared different urban blocks pattern/overall urban pattern with corresponding solar radiation. Rhinoceros is the common simulation software.
This study summarizes the typical high-rise settlement model, calculates the relevant residential layout indicators, uses Autodesk Ecotect to simulate the solar radiation quantity of residential buildings and summarizes the relationship between the high-rise residential layout indicators and solar radiation. Combining the solar radiation quantity as a scientific quantitative indicator with the Harbin residential planning, summarizing the residential layout planning method with solar radiation as the influencing factor, providing a quantitative reference basis for residential planning. This study is focusing on exploring the relationship between solar radiation quantity and residential layout patterns to determine the optimal residential layout pattern with higher solar radiation. The difference between the previous studies and this study is that the previous study compared several different urban layout patterns, while this study will compare several different building conditions with the same residential area layout pattern and will compare 2 residential area layout patterns with the relative same condition. Through these results, it will be helpful for planners and real estate to come up with more rational and scientific design strategies in different layout patterns.

2. Research Area and Data Source

2.1. Research Area

Harbin, the northeast city in China, located in 126.8° E, 45.8° N, has been selected as the investigation site of the study with total area of 53,523.5 m2. The residential types in the urban area are diverse. This study selects Nangang District, Daoli District, Daowai District, Xiangfang District, Songbei District, Pingfang District and Hulan District in the central urban area, as the research area, covering 4300.9 m2 in the administrative area. Randomly select new high-rise residential areas constructed within nearly 10 years in the urban area as the research object.

2.2. Data Source

There are three main ways to obtain data in this paper: access to literature, open data and field research.
Through the above three ways, the basic information and planning and design indicators of the residential area will be investigated. The basic information of the settlement includes the urban location of the settlement, the name of the settlement, the construction of the settlement and the opening time; The planning and design indicators of the settlement include the residential property category, layout pattern, building category, building height and number of floors, building area, floor area ratio, building orientation, building spacing and so forth.
The study mainly analyzes the relationship between floor area ratio, building density, building height and solar radiation quantity in three different residential layout patterns. Floor area ratio is the ratio of a building’s total floor area to the size of the piece of land upon which it is built. It is relevant to the control of settlement density at city overall level. And it is a planning indicator for the intensity of land development. Building density is the ratio of the total basement area of the building to the area occupied by the building within a certain range. It refers to the coverage rate of the building, reflecting the open space rate and building density within a certain land use range. Building height refers to the vertical height of the building, which is one of the technical and economic indicators of the design and is the parameter of urban planning control. These three parameters, floor area ratio, building density and building height, affect each other closely; meanwhile, they are also related to each other. Exploring the relationship between one of the above three planning indicators and the solar radiation quantity, it will have a comprehensive correlation with the change of the other two planning indicators. The detailed explanation has been shown in Figure 1.
(1)
Access to literature: Through reviewing relevant studies [6,27,28], the high-rise residential areas in Harbin are summarized and selected. The existing studies on the investigation of high-rise settlements in Harbin have been done until 2016 by the research group of HIT. The survey will supplement the basic data of new high-rise residential areas in Harbin from 2017 to 2018. Finally, form the database of new high-rise residential areas in Harbin from 2008−2018.
(2)
Open data: The basic information of the residential area, planning and design indicators and the visual image of the residential layout pattern can be obtained through the Internet website Fang.com (it is a website that can provide basic residential planning index, such as building density, building height and so on) and Google Earth satellite map until 2018.
(3)
Field research: Field research is an auxiliary means for the incomplete access to open data information. Through targeted field settlements, the missing information can be supplemented.

3. Method

3.1. Typical Pattern Determination

3.1.1. Model Selection

Through the above three methods, 123 new high-rise residential areas in the downtown area of Harbin in the past 10 years were randomly investigated, selected and summarized. Through the multiple response frequency analysis method of SPSS, the selection and statistics of 123 high-rise residential buildings are classified, the number of typical floors in the high-rise residential area of Harbin is determined and the building floor range of the residential area model is determined with 8F–35F. Through the statistical analysis of the layout pattern of residential areas, it is concluded that the layout patterns of high-rise residential areas in Harbin are more common in the parallel determinant, non-parallel determinant and enclosure. The most common type of enclosure layout pattern is the three-sided enclosure.
Based on the floor range and typical layout pattern of the above-mentioned high-rise residential areas, the typical residential patterns determined of this study are the parallel determinant (8 Floors–35 Floors), the non-parallel determinant (8 Floors–35 Floors) and the three-sided enclosure (8 Floors–35 Floors).

3.1.2. Model Establishment

Through field research on Harbin residential areas, it is found that high-rise residential buildings are mostly panel buildings. Therefore, it is determined that the vertical wall is 60 M, the gable is 15 M and each floor height is 3 M of one single building model. According to the relevant regulations of the Harbin Urban and Rural Planning Regulations [29], the residential area model is constructed with the planning standard of the residential vertical wall spacing distance L ≥ 1.2 H. In addition, since Harbin is located in the northern hemisphere, most buildings are oriented north and south to acquire the largest sunlight. Therefore, the buildings in the study are all established southward.
The study takes high-rise residential group as an example to explore the relationship between residential indicators and solar radiation quantity. The nine determinant buildings and 11 enclosed buildings are the basic building group model. The boundary line of the block is based on the urban branch road level, which is extended by 10 M on the basis of the outermost building facade from east, west, north and south. Finally, the relevant residential indicators such as floor area ratio, building density and building height of each model are obtained.
After determining the basic size and number of the building, AutoCAD is used to draw the plan of the typical residential area model. The high-rise residential models of the parallel determinant, non-parallel determinant and three-sided enclosure are set up in corresponding scale. Import the completed buildings plan into SketchUp, create 3D models with 8F–35F and store the file in 3DS format for simulation analysis in Ecotect. At the same time, number the building blocks, building roofs (R1–R9) and south facade of building (S1–S9) within each layout pattern in sequence, as shown in Figure 2.

3.2. Simulation

3.2.1. Environmental Parameters

To study the solar radiation quantity in the high-rise residential areas of Harbin, it is necessary to load the meteorological data of Harbin and select the CSWD meteorological data certified by Energy Plus. After loading the Harbin_CSWD.wea meteorological data file into Ecotect, the meteorological parameters automatically loaded into Harbin are 126.8° east longitude, 45.8° north latitude and the time zone east 8 district.

3.2.2. Season and Time

The study explores the changes of total solar radiation in the whole year and each four season respectively in typical high-rise residential areas in Harbin. The spring simulation month is from March to May, the summer simulation month is from June to August, the autumn simulation month is from September to November and the winter simulation month is from December to February in next year. Harbin is located in the northern hemisphere. The sun runs to the tropic of Capricorn on the day of winter solstice. At that day, the sunrise time is the latest and the sunset time is the earliest. During the whole year, the effective sunshine time of the winter solstice is the shortest. The time of sunrise is later than spring equinox, summer solstice and autumnal equinox, while the time of sunset is earlier than spring equinox, summer solstice and autumnal equinox. Therefore, according to winter solstice’s time of sunrise and sunset, determine the starting and ending time of simulation. In the Autodesk Ecotect, select the winter solstice day in China (22 December) for Sun-Path Diagram. And then obtain the result of sunrise and sunset time. The winter solstice sunrise time in Harbin is 7:11 and the sunset time is 15:57. To make the analysis convenient, the starting time of the simulation is determined to be 8:00. Since the time from sunset to fainting is 24 min, the ending time of the simulation is determined to be 16:00.

3.2.3. Computing Process

The established 3D residential area model is imported into Ecotect. The building has five surfaces: roof, east facade, west facade, south facade and north facade. The building surface with high solar radiation is building’s roof and south facade. The solar radiation quantity of south facade is about 2.4 times higher than north facade and about 1.6 times higher than east facade and west facade [7]. Because the number of simulations is very large, the study only chooses to simulate the solar radiation quantity of building’s south facade and roof as representative. Load Harbin_CSWD.wea meteorological data, build Analysis Grid on the south facade and roof, perform Solar Access Analysis, select Incident Solar Radiation, select the spring, summer, autumn and winter seasons respectively and the time from 8:00 a.m. to 16:00 p.m. and finally select Percentage Contours in the Report Generator to export the corresponding Excel simulation data in the report web page.

4. Results and Discussion

4.1. Analyze the Solar Radiation Quantity of the Roof and the South Facade

4.1.1. Roof Analysis

The solar radiation simulations of the three typical residential areas (8F–35F) were carried out in spring, summer, autumn and winter. According to the data, solar radiation quantity of the building roof is unrelated to the layout pattern of the residential building. The spring solar radiation quantity of all the roof with different layout patterns and building height is 337 kWh, summer is 351 kWh, autumn is 227 kWh and winter is 141 kWh. The summer solar radiation quantity is the most among four seasons, which is about 1.04 times the amount of spring, about 1.55 times the amount of autumn and about 2.49 times the amount of winter.

4.1.2. South Facade Analysis

Simulate the south facade of the three typical models (8F−35F), average the total solar radiation quantity of each south facade from 8F to 35F in each layout pattern and compare the solar radiation quantity of each south facade in three patterns. The result is shown in Figure 3. The study finds that the south facade’s solar radiation quantity of the non-parallel determinant and the three-sided enclosure is generally higher. Because S10 and S11 in the three-sided enclosure are gables in the south direction, they are not analogous to other south facades; thus, S10 and S11 are not analyzed in the study.
Among the three typical layout patterns, the most south-facing #7, #8, #9 buildings are unobstructed, so the south facades’ radiation level of these three buildings is higher in each respective layout pattern. Among the south facades with the same area, #2 and #5 buildings are affected by the occlusion of the surrounding environment, which are the south facades that receive less solar radiation under the same conditions. In three layout patterns, the south facades that can receive the maximum solar radiation quantity are the same, all of which are S9; while the south facades that can receive the minimum solar radiation quantity are also the same, all of which are S2. The results of the S9 and S2 facade variation are shown in Table 1. Due to the relatively large building spacing distance, the three-sided enclosure type has a larger variation range in the solar radiation quantity among different south facades, followed by the non-parallel determinant and the parallel determinant.

4.2. Analyze the Solar Radiation Quantity of Each Season in Three Residential Typical Patterns

4.2.1. Parallel Determinant

Adding the building roof and south facade solar radiation quantity of spring, summer, autumn and winter together with each different floor area ratios, the quantitative relationship between the radiation quantity and each season is compared. The result is shown in Figure 4. The four seasonal changing trends and the floating range are roughly the same, both of which are high stable, low stable and back to high stable. The floating range in spring and summer is more obvious, while in autumn and winter is weaker.
It is calculated that the average solar radiation quantity in summer is 4584 kWh, spring is 4393 kWh, autumn is 2877 kWh and winter is 1680 kWh. It can be concluded that in parallel determinant, the summer radiation is about 1.04 times the amount of spring, about 1.59 times the amount of autumn and about 2.73 times the amount of winter.

4.2.2. Non-Parallel Determinant

Adding the building roof and south facade solar radiation quantity of spring, summer, autumn and winter together with each different floor area ratio, the quantitative relationship between the radiation quantity and each season is compared. The result is shown in Figure 5. The solar radiation quantity in spring, summer and autumn become gradually decreased with the increasing floor area ratio. Among these three seasons, the spring and autumn solar radiation perform accelerating decreased and then decelerating decreased. However, the winter solar radiation quantity becomes increased with the increasing floor area ratio which has better performance in solar radiation utilization.
It is calculated that the average solar radiation quantity in summer is 5891 kWh, spring is 5575 kWh, autumn is 3626 kWh and winter is 2136 kWh. It can be concluded that in non-parallel determinant, the summer radiation is about 1.06 times the amount of spring, about 1.62 times the amount of autumn and about 2.76 times the amount of winter.

4.2.3. Three-Sided Enclosure

Adding the building roof and south facade solar radiation quantity of spring, summer, autumn and winter together with each different floor area ratio, the quantitative relationship between the radiation quantity and each season is compared. The result is shown in Figure 6. The solar radiation in the four seasons become gradually decreased with the increasing floor area ratio. When the floor area ratio is more than 4.37, the solar radiation quantity will be slowly increasing.
It is calculated that the average solar radiation quantity in summer is 7087 kWh, spring is 6669 kWh, autumn is 4335 kWh and winter is 2587 kWh. It can be concluded that in three-sided enclosure, the summer radiation is about 1.06 times the amount of spring, about 1.63 times the amount of autumn and about 2.74 times the amount of winter.

4.3. Relationship between Floor Area Ratio and Solar Radiation Quantity

The floor area ratio and the solar radiation quantity of the three layout patterns are summarized. The result is shown in Figure 7. Under the same number and height of buildings, the floor area ratio of the non-parallel determinant is smaller than the parallel determinant. When the floor area ratio is the same, the solar radiation quantity of the parallel determinant is larger than that of the non-parallel determinant. Among the building roof and south facade simulated in three layout patterns constructed, the three-sided enclosure has two more roofs and two more gables solar radiation quantity than the parallel determinant and the non-parallel determinant but the average solar radiation quantity of the three-sided enclosure is about 1.2 times the amount of the other two determinant patterns with an obvious advantage.

4.3.1. Parallel Determinant

According to the simulation data of the parallel determinant, it can be seen that when the floor area ratio is in the range of 2.20–3.06, the solar radiation is relatively stable; the sudden drop is at 3.12 and the rise is at 3.18. When the floor area ratio is between 3.23 and 3.60, the solar radiation quantity is decreased stably. The average decreased ratio is about 4.68%. When the floor area ratio is 3.57, the solar radiation quantity is the lowest. At 3.63, there is a sudden increase. While at 3.66, there is a sudden drop. When the floor area ratio is at 3.68, it shows a mitigating trend. It can be seen that when the floor area ratio of the parallel determinant is 3.12, 3.23–3.60, 3.66, the solar radiation quantity is not high. When the floor area ratio is 2.20–3.06, 3.18, 3.63, 3.68–3.73, the solar radiation quantity can get higher.

4.3.2. Non-Parallel Determinant

According to the simulation data of the non-parallel determinant, it can be seen that with the increase of the floor area ratio, the solar radiation quantity is gradually reduced with the average decreasing ratio 0.76%. When the floor area ratio is in the range of 1.87–2.67, the solar radiation quantity is gradually decreasing. It is slightly floating in the range of 2.71–2.89 and gradually decreasing in the range of 2.91–3.05.

4.3.3. Three-Sided Enclosure

According to the simulation data of the three-sided simulation, it can be seen that with the increase of the floor area ratio, the solar radiation quantity is gradually reduced. When the floor area ratio is 3.27, the solar radiation comes up with a sudden drop. And then rebound and continue to decrease. When the floor area ratio is more than 4.36, the solar radiation quantity becomes slowly rising.

4.4. Relationship between Building Density and Solar Radiation Quantity

The building density and solar radiation quantity of the three layout patterns are summarized. The result is shown in Figure 8. When the building density is in the range of 11.43–17.34%, the solar radiation quantity is unstable. At the same time, the non-parallel determinant solar radiation quantity is larger than the parallel determinant of this range of building density. In addition to the above building density, the parallel determinant of solar radiation quantity is larger than the non-parallel determinant. Since the residential building has a width of 60 m, the two residential buildings #10 and #11 are laid out in the north-south building space, resulting in the three-sided enclosure under 8F~28F layout modes with the same spacing distance of 100 m between the middle row buildings and the side row buildings. The basement area of building under 8F–28F layout modes is the same, as well as the plot area; thus, the building density is all 15.57% under 8F–28F layout mode of three-sided enclosure. With the increase of the building height, the mutual occlusion effect among buildings is obviously, so the solar radiation quantity of 8F–28F residential area shows a decreasing trend. The three-sided enclosure has two more roofs and two more gables solar radiation quantity than the parallel determinant and the non-parallel determinant but the average solar radiation quantity of the three-sided enclosure is about 1.2 times the amount of other two determinant patterns.

4.4.1. Parallel Determinant

THE building density index of the parallel determinant residential area of 8F–35F is converted. And the corresponding solar radiation quantity is extracted. It is found that when the floor area ratio becomes larger, the building density becomes smaller in parallel determinant. The building density of 8F’s parallel determinant is the largest, which is 27.53%. While the building density of 35F’s parallel determinant is the smallest, which is 10.65%. In the parallel determinant, the solar radiation quantity in the whole year shows short stable-sudden drop stable-long stable trend as the building density increasing.

4.4.2. Non-Parallel Determinant

The building density index of the non-parallel determinant residential area of 8F–35F is converted. And the corresponding solar radiation quantity is extracted. It is found that when the floor area ratio becomes larger, the building density becomes smaller in the non-parallel determinant. This phenomenon is the same as parallel determinant. The building density of 8F’s non-parallel determinant is the largest, which is 23.36%. While the building density of 35F’s parallel determinant is the smallest, which is 8.71%. It is founded that the larger building density it is, the higher solar radiation quantity it will be. When the building density is 13.37%, the solar radiation will come up with a sudden increase.

4.4.3. Three-Sided Enclosure

The building density index of the three-sided enclosure residential area of 8F–35F is converted. And the corresponding solar radiation quantity is extracted. It is found that when the floor area ratio becomes larger, the building density becomes smaller in the three-sided enclosure. These three layout patterns have the same phenomenon. The three-sided enclosure building density of 8F–28F is the same, which is 15.57%. The building density of 35F in three-sided enclosure is the smallest, which is 13.01%. It is founded that the larger building density it is, the higher solar radiation quantity it will be.

4.5. Relationship between Building Height and Solar Radiation Quantity

The annual solar radiation quantity of typical residential layout pattern at different building height is extracted. The result is shown in Figure 9. Since the simulated building roof and south facade of the three-sided enclosed building model are more than parallel determinant and non-parallel determinant, the three-sided enclosure layout pattern solar radiation quantity is about 1.2 times the amount of those two patterns. Under the same building height, the three-sided enclosure layout has an advantage in receiving solar radiation.
The parallel determinant and the non-parallel determinant are the same 9 building group layout patterns and all the building floor is 24 M−105 M; thus, the solar radiation quantity of these two patterns is comparable.
It is found that the solar radiation quantity of the parallel determinant of 24 M−57 M (except 54 M) and 93 M−105 M (except 96 M) is higher than the non-parallel determinant. And the solar radiation quantity of the non-parallel determinant of 54 M, 96 M, 60 M−90 M is higher than the parallel determinant.

5. Conclusions

  • The study summarizes three typical layout patterns of high-rise residential area and explores the relationship between residential indicators and solar radiation quantity. According to the simulation results, there actually exists certain correlativity between solar radiation quantity and floor area ratio, building density and building height. In addition, solar radiation quantity of three layout patterns in different seasons has each characteristic.
  • In the three residential layout patterns studied, each annual solar radiation quantity changed by floor area ratio has its own variable curve. The annual solar radiation quantity shows stable-sudden drop stable-back stable trend with increasing floor area ratio in the parallel determinant. In addition, the annual solar radiation quantity shows decreased trend with the increasing floor area ratio in the non-parallel determinant and three-sided enclosure.
  • In the three residential layout patterns studied, each annual solar radiation quantity changed by building density has its own variable curve. The annual solar radiation quantity shows temporary stable-sudden drop stable-lasting stable trend with increasing building density in the parallel determinant. In addition, the annual solar radiation quantity shows increased trend with increasing building density in the non-parallel determinant and three-sided enclosure.
  • Under the same condition on building height and numbers, the solar radiation quantity of the parallel determinant with 24 M–57 M (except 54 M) and 93 M–105 M (except 96 M) is higher than that of the non-parallel determinant. While the solar radiation quantity of the non-parallel determinant with 54 M, 96 M, 60 M–90 M is higher than that of the parallel determinant.
  • In high-rise residential area of parallel determinant, non-parallel determinant and three-sided enclosure, the solar radiation quantity of the building roof is irrelevant with the layout pattern. The building roof solar radiation of summer is about 1.04 times the amount of spring, about 1.55 times the amount of autumn and about 2.49 times the amount of winter.
  • In the three residential layout patterns studied, the quantitative relationship between the four seasons are approximately equal. In the parallel determinant, the solar radiation quantity of summer is about 1.04 times the amount of spring, about 1.59 times the amount of autumn and about 2.73 times the amount of winter. In the non-parallel determinant, the solar radiation quantity of summer is about 1.06 times the amount of spring, about 1.62 times the amount of autumn and about 2.76 times the amount of winter. In the three-sided enclosure, the solar radiation quantity of summer is about 1.06 times the amount of spring, about 1.63 times the amount of autumn and about 2.74 times the amount of winter.
Based on the above conclusions, the optimal residential planning indicators and the optimal solar radiation quantity of each residential layout pattern are sorted out which can refer Table 2.
The study takes high-rise residential group as an example to analyze the solar radiation quantity of building roof and south facade. And then obtain a series of conclusions. The residential area planning indicators such as floor area ratio, building density and building height are suitable to the application of residential land development in urban regulatory plan, which can ensure solar energy construction in residential areas under the premise of high solar energy quantity. The solar radiation utilization potential of high-rise settlements is large. And the residential space development future is promising. The rational use of solar energy in residential areas will not only solve the energy flow within its living system but also improve the residential environment. Therefore, it is of practical significance to study the solar radiation quantity of high-rise residential area. In the analysis figure between the planning indicators and the solar radiation quantity, there actually exist some mutation points or turning points, which provides new ideas for further research. In addition, an in-depth study of the specific linear relationship between the layout pattern and the solar radiation quantity is also a further research content in the future. By obtaining a linear relationship, the corresponding residential indicators and solar radiation quantity can be derived to provide reasonable reference data for the initial stage of residential planning.

Author Contributions

The paper was a collaborative effort among the authors. M.L. provided the research direction; Y.Z. was involved in data collection and building model; Y.Z. and M.L. designed and performed the simulations; Y.Z. and J.X. analyzed the data. Y.Z. and W.M. drew the analysis pictures and edited the manuscript. All the authors mentioned above have concluded the scientific findings.

Funding

This study was funded by National Natural Science Foundation of China (No. 51438005), Key Science and Technology Program of Heilongjiang Province (No. GZ15A508) and Scientific Research Project of the Ministry of Housing and Urban-Rural Development (No. 2016-K1-011).

Conflicts of Interest

The authors declare no conflict of interest.

References

  1. Nation Development and Reform Commission (NDRC) People’s Republic of China. Policy Release. Available online: http://www.ndrc.gov.cn/ (accessed on 2 March 2018).
  2. Ministry of Housing and Urban-Rural Development of the People’s Republic of China (MOHURD). Code for Classification of Urban Land Use and Planning Standards of Development Land, 3rd ed.; China Architecture & Building Press: Beijing, China, 2012; p. 56.
  3. Lu, M.; Fu, J.W.; Du, J.T. Urban Planning and Research Process of Solar City in Europe. Urban Plan. Int. 2018, 33, 112. [Google Scholar] [CrossRef]
  4. Zhang, H. Research on BIPV Application Potential in the New Campus of Tianjin University. Master’s Thesis, Tianjin University, Tianjin, China, 2013. [Google Scholar]
  5. Yan, L. Research on Building-Integrated Photovoltaics Technology Application in College Campus—Take Huaqiao University Xiamen Campus as Example. Master’s Thesis, Huaqiao University, Quanzhou, China, 2016. [Google Scholar]
  6. Bai, Y. Optimization of Layout and Morpgology of Residential Block in Severe Cold Area Based on Solar Energy Utilization Potential. Master’s Thesis, Harbin Institute of Technology, Harbin, China, 2017. [Google Scholar]
  7. Chen, S.X. Optimization Research on Layout of Harbin High-Rise Residential Area Based on Dynamic Analysis of Solar Radiation. Master’s Thesis, Harbin Institute of Technology, Harbin, China, 2013. [Google Scholar]
  8. Lu, M.; Du, J.T. Assessing the daylight and sunlight availability in high density residential areas a case in North-East China. Arch. Sci. Rev. 2012, 11, 1–15. [Google Scholar] [CrossRef]
  9. Li, D.P.; Liu, G.; Liao, S.M. Solar potential in urban residential buildings. Sol. Energy 2015, 111, 225–235. [Google Scholar] [CrossRef]
  10. Liao, W.; Xu, S.; Lin, B.J. Prototype study of the solar building large-scale application: Simulation study of the urban form and solar availability. Huazhong Arch. 2013, 4, 64–66. [Google Scholar]
  11. Lv, Y.; Zhang, X.F.; Liu, Y. Estimation and assessment of the urban building-scale solar energy potential. Acta Sci. Nat. Univ. Pek. 2013, 49, 650–656. [Google Scholar]
  12. Sun, Y.W.; Hof, A.; Wang, R. GIS-based approach for potential analysis of solar PV generation at the regional scale: A case study of Fujian Province. Energy Policy 2013, 58, 248–259. [Google Scholar] [CrossRef]
  13. Peng, J.Q.; Lu, L. Investigation on the development potential of rooftop PV system in Hong Kong and its environmental benefits. Renew. Sustain. Energy Rev. 2013, 27, 149–162. [Google Scholar] [CrossRef]
  14. Verso, A.; Martin, A.; Amador, J.; Dominguez, J. GIS-based method to evaluate the photovoltaic potential in the urban environments: The particular case of Miraflores de la Sierra. Sol. Energy 2015, 117, 236–245. [Google Scholar] [CrossRef]
  15. Izquierdo, S.; Rodrigues, M.; Fueyo, N. A method for estimating the geographical distribution of the available roof surface area for large-scale photovoltaic energy-potential evaluations. Sol. Energy 2008, 82, 929–939. [Google Scholar] [CrossRef] [Green Version]
  16. Redweik, P.; Catita, C.; Brito, M. Solar energy potential on roofs and facades in an urban landscape. Sol. Energy 2013, 97, 332–341. [Google Scholar] [CrossRef]
  17. Huld, T.; Suri, M.; Kenny, R.P.; Dunlop, E.D. Estimating PV performance over large geographical regions. In Proceedings of the IEEE International Conference on Photovoltaics, Orlando, FL, USA, 3–7 January 2005. [Google Scholar]
  18. Kanters, J.; Wall, M.; Dubois, M.C. Typical Values for Active Solar Energy in Urban Planning. Energy Procedia 2014, 48, 1607–1616. [Google Scholar] [CrossRef] [Green Version]
  19. Kanters, J.; Horvat, M. Solar energy as a design parameter in urban planning. Energy Procedia 2012, 30, 1143–1152. [Google Scholar] [CrossRef]
  20. Khan, J.; Arsalan, M.H. Estimation of rooftop solar photovoltaic potential using geo-spatial techniques: A perspective from planned neighborhood of Karachi-Pakistan. Renew. Energy 2016, 90, 188–203. [Google Scholar] [CrossRef]
  21. Karteris, M.; Theodoridou, I.; Mallinis, G. Facade photovoltaic systems on multifamily buildings: An urban scale evaluation analysis using geographical information systems. Renew. Sustain. Energy Rev. 2014, 39, 912–933. [Google Scholar] [CrossRef]
  22. Priya, S.S.; Iqbal, M.H. Solar Radiation Prediction using Artificial Neural Network. Int. J. Comput. Appl. 2015, 16, 28–31. [Google Scholar]
  23. Lobaccaro, G.; Frontini, F. Solar Energy in Urban Environment: How Urban Densification Affects Existing Buildings. Energy Procedia 2014, 48, 1559–1569. [Google Scholar] [CrossRef]
  24. Kalder, J.; Annuk, A.; Allik, A.; Kokin, E. Increasing Solar Energy Usage for Dwelling Heating, Using Solar Collectors and Medium Sized Vacuum Insulated Storage Tank. Energies 2018, 11, 1832. [Google Scholar] [CrossRef]
  25. Hobbi, A.; Siddiqui, K. Optimal design of a forced circulation solar water heating system for a residential unit in cold climate using TRNSYS. Sol. Energy 2009, 83, 700–714. [Google Scholar] [CrossRef]
  26. Valdiserri, P. Evaluation and control of thermal losses and solar fraction in a hot water solar system. Int. J. Low-Carbon Technol. 2018, 13, 260–265. [Google Scholar] [CrossRef]
  27. Chen, Y. Present Situation Analysis and Optimization Strategies of Residential Solar Access Rights in Harbin. Master’s Thesis, Harbin Institute of Technology, Harbin, China, 2016. [Google Scholar]
  28. Li, C. Research on Spatial Analysis and Potential of Photovoltaic Utilization in Harbin High-Rise Residential Area. Master’s Thesis, Harbin Institute of Technology, Harbin, China, 2017. [Google Scholar]
  29. Harbin Urban and Rural Planning Bureau. Policy Analyzing. Available online: http://www.upp.gov.cn (accessed on 17 March 2018).
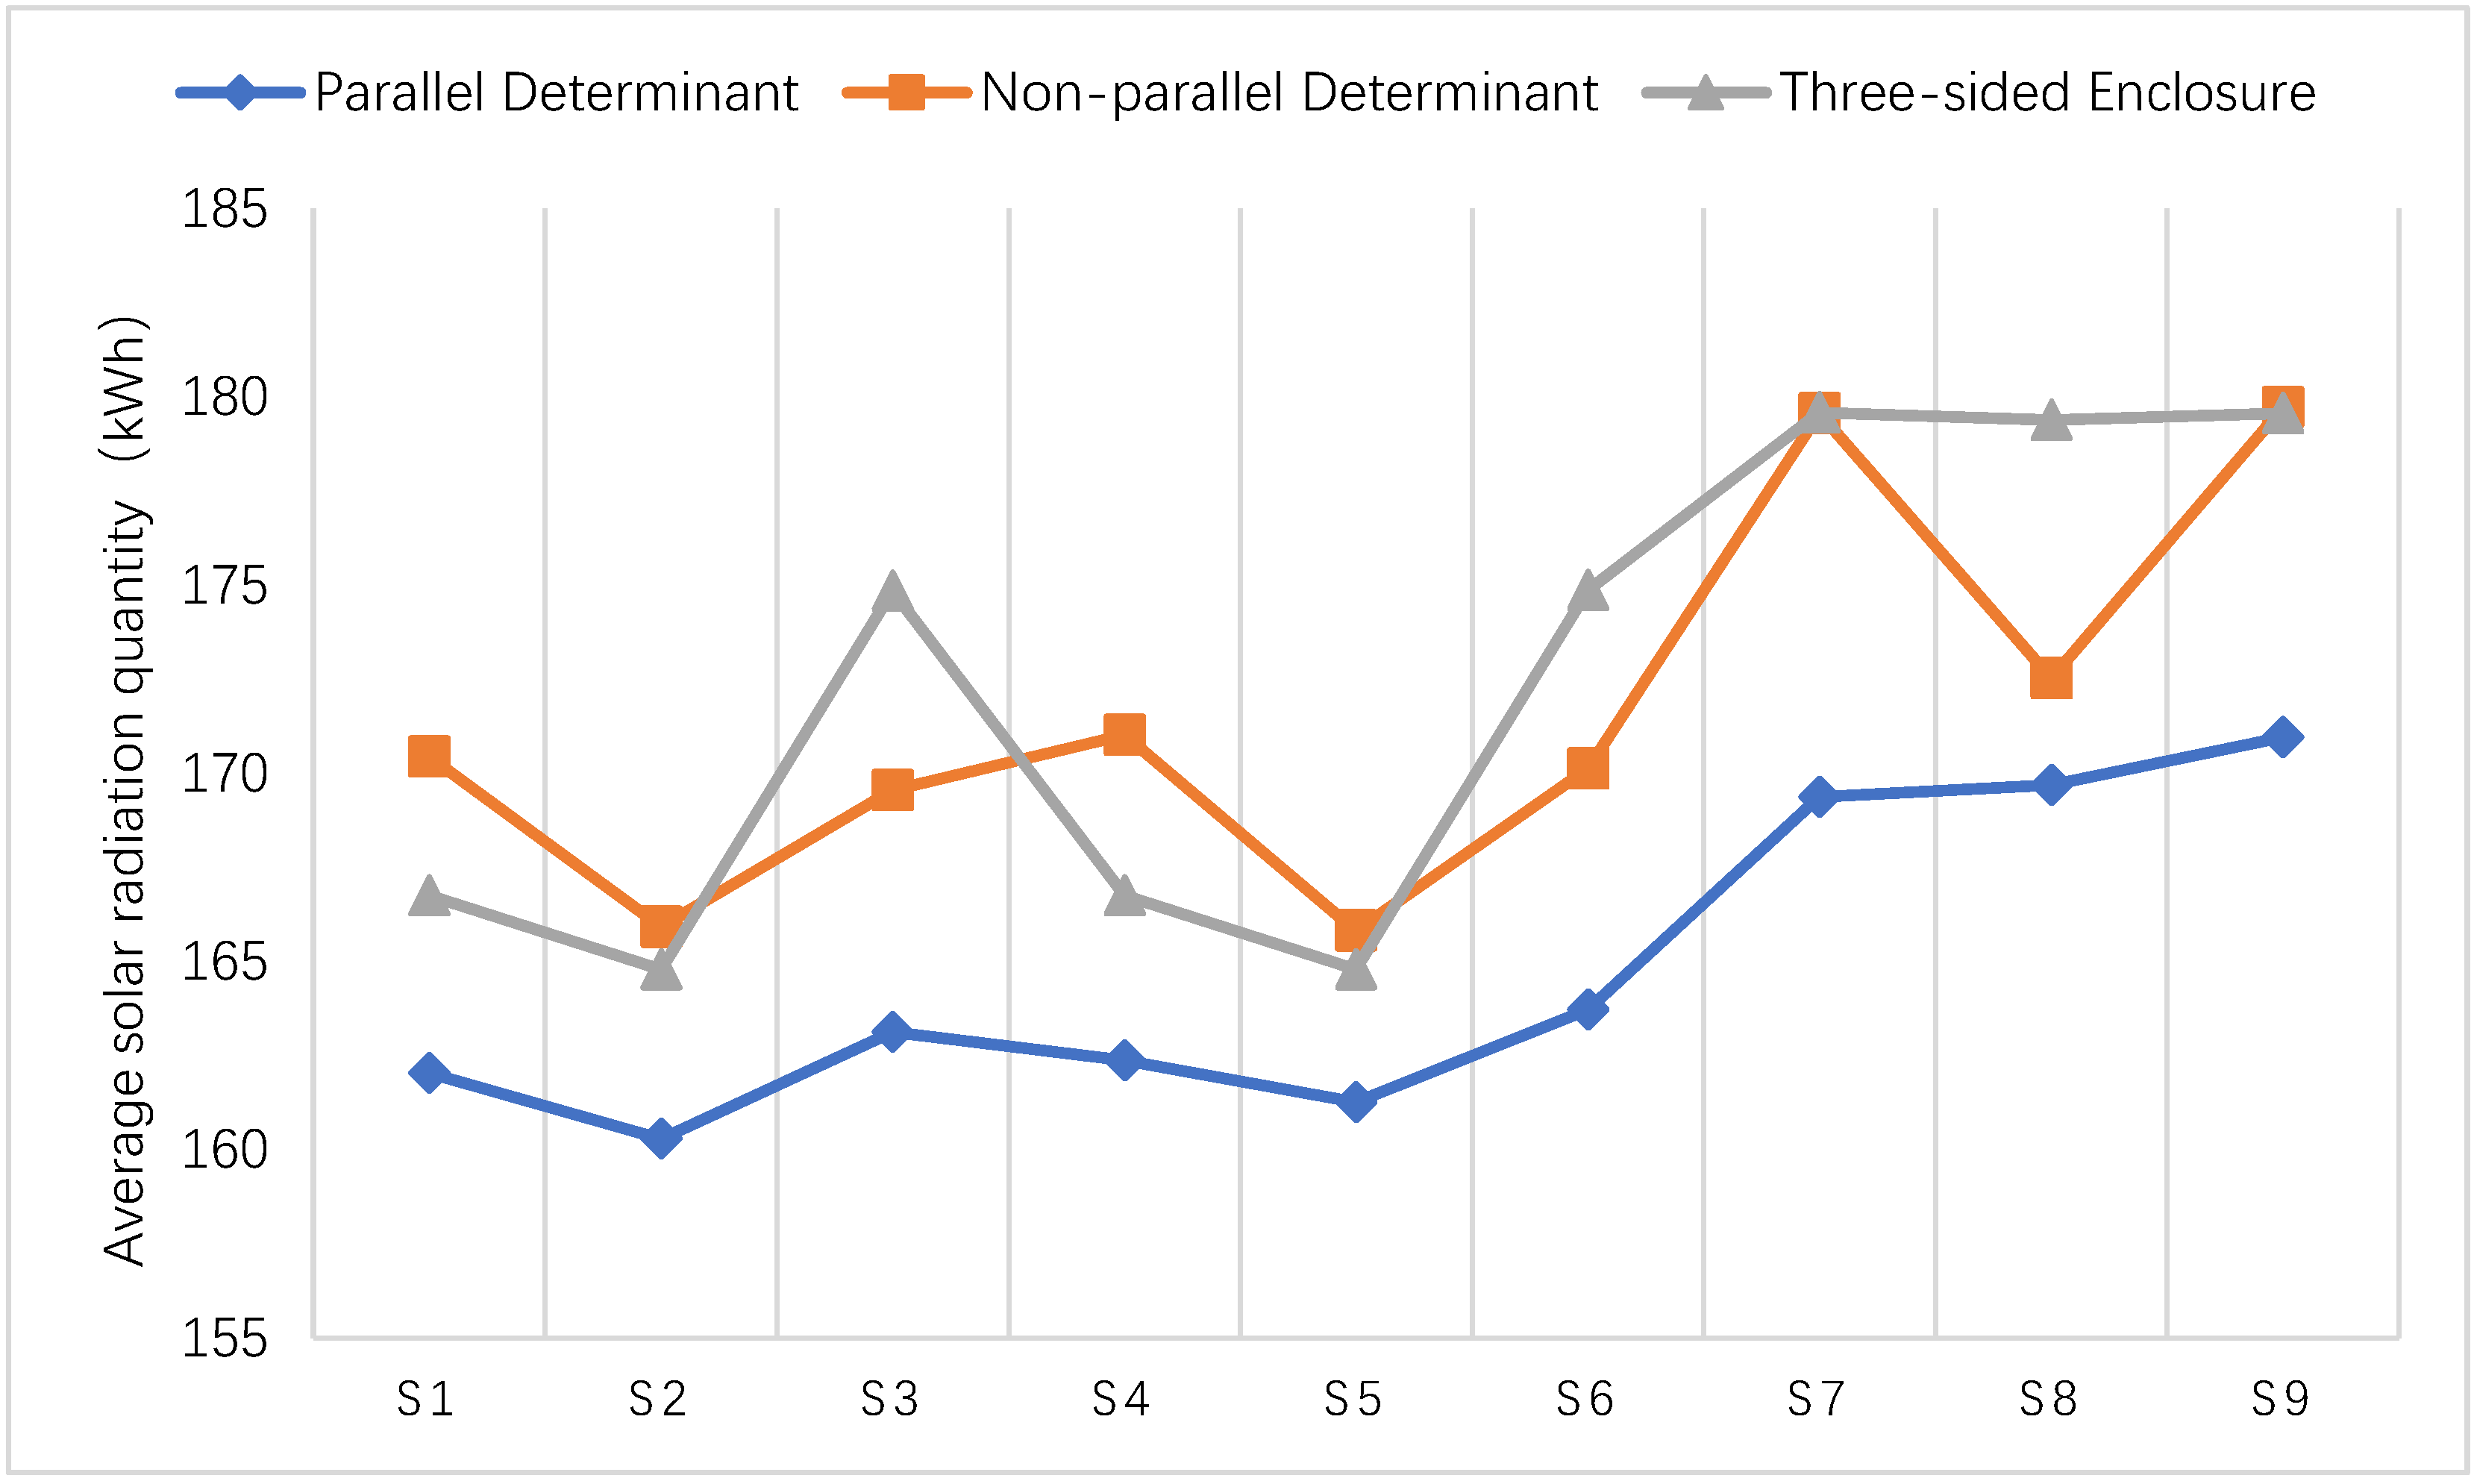
Figure 1. Indicator illustration.
Buildings 08 00148 g001
Figure 2. Three typical residential layout patterns (take 18 Floor as an example).
Buildings 08 00148 g002
Figure 3. Solar radiation quantity of south facade S1–S9.
Buildings 08 00148 g003
Figure 4. Solar radiation analysis of each season.
Buildings 08 00148 g004
Figure 5. Solar radiation analysis of each season.
Buildings 08 00148 g005
Figure 6. Solar radiation analysis of each season.
Buildings 08 00148 g006
Figure 7. Relationship between floor area ratio and solar radiation quantity.
Buildings 08 00148 g007
Figure 8. Relationship between building density and solar radiation quantity.
Buildings 08 00148 g008
Figure 9. Relationship between building height and solar radiation quantity.
Buildings 08 00148 g009
Table 1. Changing range of south facades.
Layout PatternS9S2Changing Range
Parallel Determinant171 kWh160 kWh6.24%
Non-parallel Determinant180 kWh166 kWh7.74%
Three-sided Enclosure180 kWh165 kWh8.23%
Table 2. Optimal combination on residential indicators of three layout patterns.
Layout PatternFloor Area RatioBuilding DensityBuilding HeightSolar Radiation Quantity
Parallel determinant2.2010.65%24 M17,311 kWh
2.3410.89%27 M17,313 kWh
2.4611.15%30 M17,316 kWh
2.6711.71%36 M17,322 kWh
3.6322.29%93 M17,342 kWh
3.6824.64%99 M17,337 kWh
3.7026.00%102 M17,360 kWh
3.7327.53%105 M17,370 kWh
Non-parallel determinant1.878.7%24 M17,162 kWh
↑Optimal↓Optimal↑Optimal——
3.0423.36%105 M17,293 kWh
Three-sided enclosure1.2513.01%24 M21,319 kWh
1.4013.32%27 M21,276 kWh
1.5613.63%30 M21,231 kWh
1.7113.96%33 M21,185 kWh
1.8614.31%36 M21,138 kWh
2.0214.68%39 M21,091 kWh
2.1715.07%42 M21,040 kWh
4.3715.57%87 M20,342 kWh

