1. Introduction
In 1969, Fazlur Khan [
1] first classified the structural system for designing tall buildings. At that time, the rigid frame was the most dominant structural system that prevailed in that era for the design of tall buildings. Khan first introduced a new structural system named
tubular structural system and designed the Sears Tower. At 108 stories high, it was world’s tallest building with this system at that time.
Again, in 2007, this structural system was re-classified by Ali and Moon [
1]. These structural systems are classified depending upon the height of the building selected for design. Other parameters like loading conditions, architectural requirements, site conditions and functional requirements are also imperative. For high rise buildings, he classified them as framed tube structures, diagrid building structural systems, outrigger structures, bundled tubes, tube in tube and frame with shear wall,
etc.This paper presents a detailed discussion about the shear lag effect, a major phenomenon that controls the design of tall building of the tube structural system. Tube in tube with façade bracing system is used for designing buildings 120 stories high. The objective of this study is to study the shear lag effect and its correlation with stiffness based design in tube structural systems.
In tube structural systems, buildings are designed considering a hollow concrete box projecting out of the ground, designed as a cantilever beam. As such, façade columns are spaced closer and connecting beams are considerably deep, making for a hollow box like structure which supports the lateral loads [
1,
2,
3]. This idea also comes from the nature of the Bamboo tree which is very tall and thin. At each node, Bamboo is stiff enough resembling the stiffened diaphragm of a building [
4].
While attempting the design of a 120 story high building, it is found that one tube around the outer periphery of the plan area is not sufficient to give enough rigidity to control the lateral deflection limit of H/500 as an engineering decision [
5]. So, another core at the center is provided with a total of 25% of plan area [
3,
6,
7].
2. Correlation between Shear Lag and Stiffness of Structure
Loads on tall buildings can be divided into two vertical or gravity loads and lateral loads. Tubular structure is the most efficient structural system that utilizes both kinds of loads for designing a tall building. Providing column free area between the core and the perimeter columns maximizes gravity loads coming on outer columns which increase the building’s stability in overturning.
With the application of lateral load, column deflects in lateral direction and beam deflects in bending. This provides rotation of the beam column joints. Because of the rotation of beam column joints, shear lag effect is induced in a building. Shear lag effect can be observed in any hollow box like structural system which is loaded laterally. An example can be a hollow box girder that is used in the design of bridges.
Motivation of this study stems from the thinking that perhaps shear lag effect influences the design of tall buildings with tubular structural systems. Controlling the shear lag can perhaps control the lateral deflection of the building. Theoretically, if the limit of the beam column joint rotation which is set at zero is reached, the panel starts behaving like a shear wall.
In this paper, shear lag effect is studied and is correlated with stiffness of the building. Studies are also done for the different patterns of bracing systems. For convenience and to make comparisons of shear lag effect, cross-sectional dimensions of beam and columns, their alignments (column) and the material properties are not changed with height of the building.
3. Literature Review
Khan [
2] in 1961 first had the idea of a tube structural system. He first designed a 43-story DeWitt-Chestnut Apartment Building in Chicago. After that, he designed the world’s tallest building, the Seas Tower, with nine bundled tubes in Chicago. As the building becomes tall, say more than 60 stories, tubular structure itself becomes inefficient for withstanding lateral loads because of shear lag. It starts behaving much more like a rigid frame structure. As such, bending deflection in beams and columns becomes high, consequently increasing the shear lag. To control these deflections and hence to increase the building’s stiffness, he suggested three different methods. One of these methods is by providing additional tubes inside the building plan called the
tube in tube structural system. The second one is by providing bundled tube [
1]. Third way of increasing the lateral stiffness of the structure is by providing a bracing system which efficiently reduces the shear lag and increases the building performance to support the lateral loads.
In 2007, Leonard [
8] presented his studies on shear lag effect in a diagrid building structural system. He studied the shear lag effect in 60 story high buildings by varying diagrid angles. He found that shear lag effect was increased as the angle of diagrid changes from 31° to 90°. In his studies top lateral deflection was the smallest for the diagrid angle of 63.4° to 71.6°.
In 2007, Moon [
9,
10,
11] studied methods of designing diagrid building structural systems. Theoretically, he proved that for maximum shear rigidity of diagrid, optimal angle should be falling near 35° but for maximum bending rigidity it should be at 90° from horizontal. So, optimal angle should fall between these two values,
i.e., 35° and 90°. In the analysis, he discovered that optimum diagrid angle for building of height from 60 to 20 stories falls between 53° and 76°. He also concluded that this optimal angle of diagrid decreases as the height of the building decreases.
Moon [
12] again carried out his studies on braced tube structural system of a 100 story high building with various diagonal configurations. In his studies, he found that diagonal angle of bracing between 35° and 55° is the best possible structural configuration for material saving design.
4. Shear Lag Effect
Shear lag effect in a building can be best understood with the help of
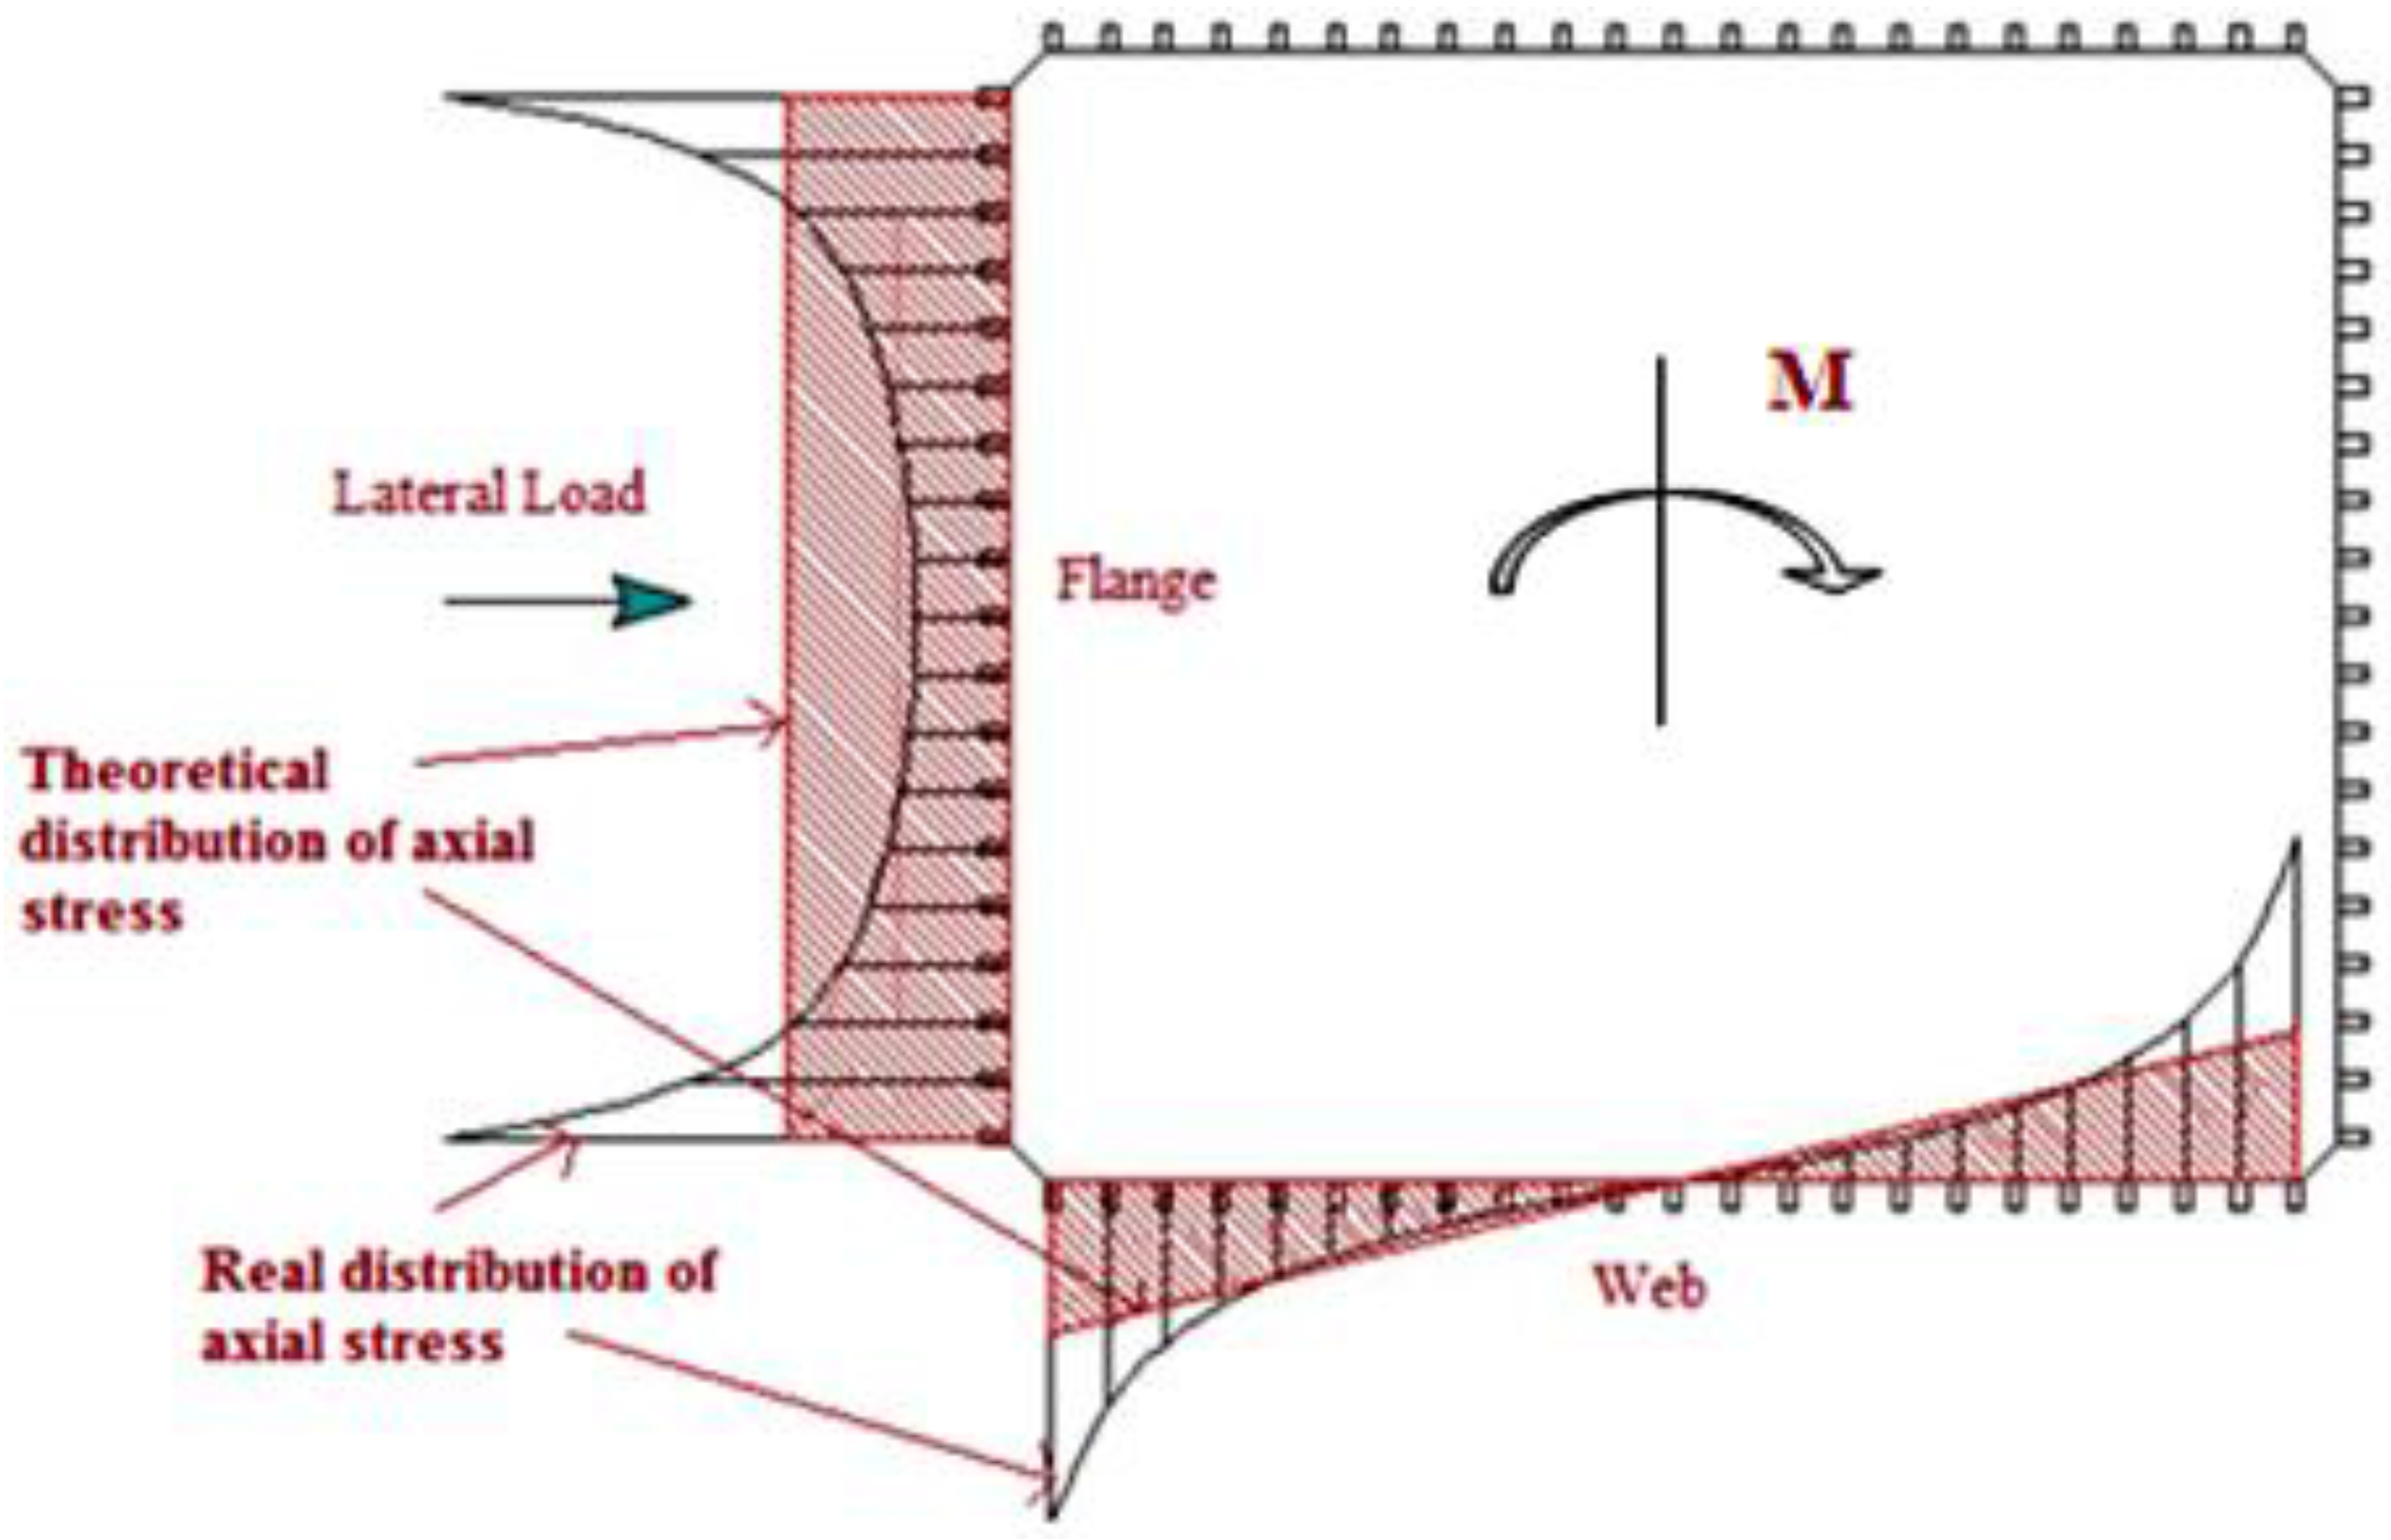
Figure 1. In this figure, cross-section of a building is shown in which a moment is induced because of the application of lateral load.
Figure 1 shows the theoretical and real distribution of axial stresses in peripheral columns. Now considering the whole structure as a cantilever beam, axial stress generated in the columns of outer periphery are the bending stresses. This statement follows the theory of bending.
Again with the theory of bending, variation of these stresses along any panel (flange or web) must be varying linearly. Real distribution of these axial stresses in panels can be observed in the figure which is not linear. In the flange panel, magnitude of axial stress at the corner side is high in comparison to the columns of the middle panel. So, in the flange panel middle columns, axial stress lags behind that of the corner columns. The same kind of nonlinear distribution of axial stress can also be observed in the web panels. This kind of nonlinear distribution of axial stress along the flange and the web panels is called the shear lag effect.
Figure 1.
Axial stress distribution in the columns of the building in web as well as in flange panels.
Figure 1.
Axial stress distribution in the columns of the building in web as well as in flange panels.
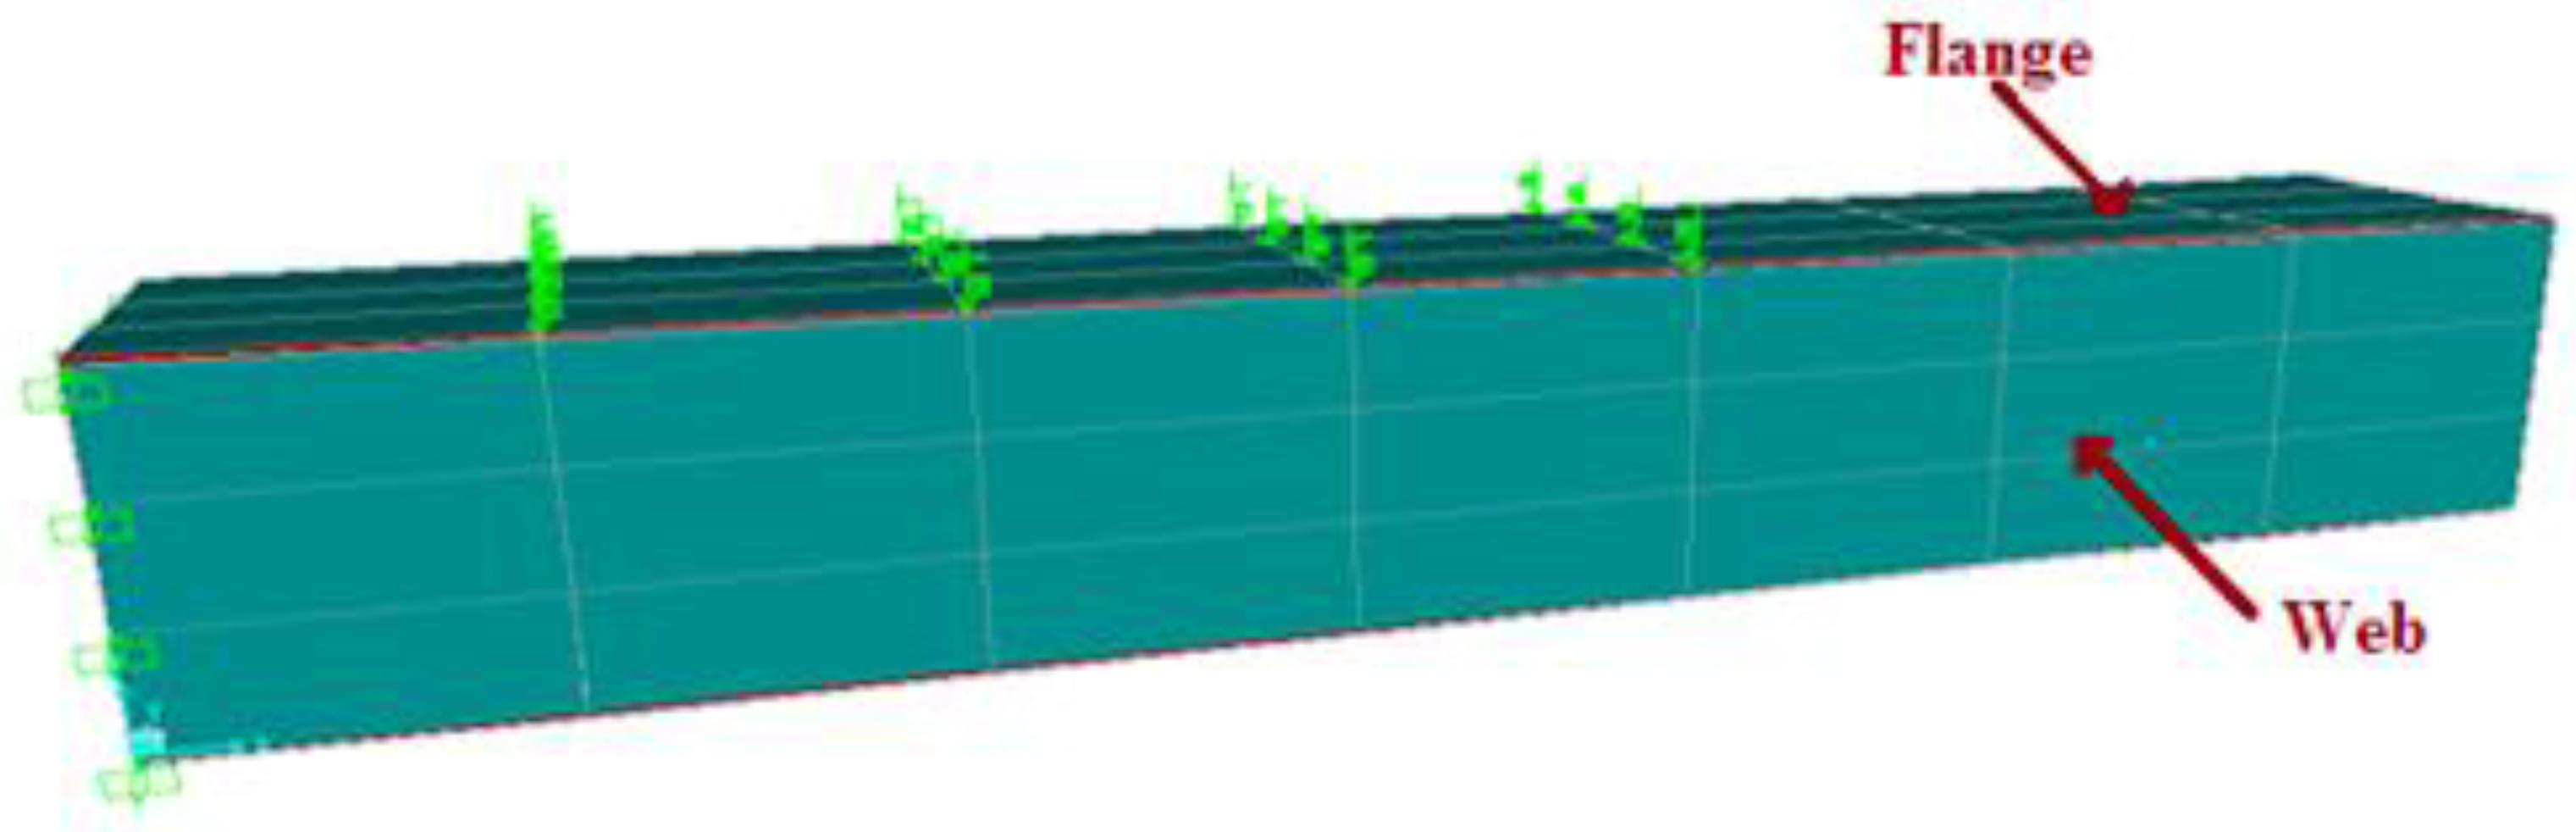
To further illustrate this, a three dimensional model of a cantilever beam of hollow square cross section resembling a tube is modeled with thin shell element in SAP 2000 (
Figure 2). The beam is three meters long and cross sectional dimensions are 0.5 m × 0.5 m. This beam is loaded with uniformly distributed load acting approximately until the middle of its length, as shown in
Figure 2.
Figure 2.
Three dimensional view of the Finite Element model of the cantilever beam 3 m long loaded with UDL until 1.71 m length from the fixed end.
Figure 2.
Three dimensional view of the Finite Element model of the cantilever beam 3 m long loaded with UDL until 1.71 m length from the fixed end.
The type of loading resembles the kind of wind load that is typically considered to act at each node laterally. Results are displayed for the loading till mid length of the beam for better demonstrating the concept of positive and negative shear lag [
8].
After running the analysis, the beam displayed the deformed shape. As stress is directly proportional to strain, so studying the deformed shape demonstrate the stress distribution in the beam.
In
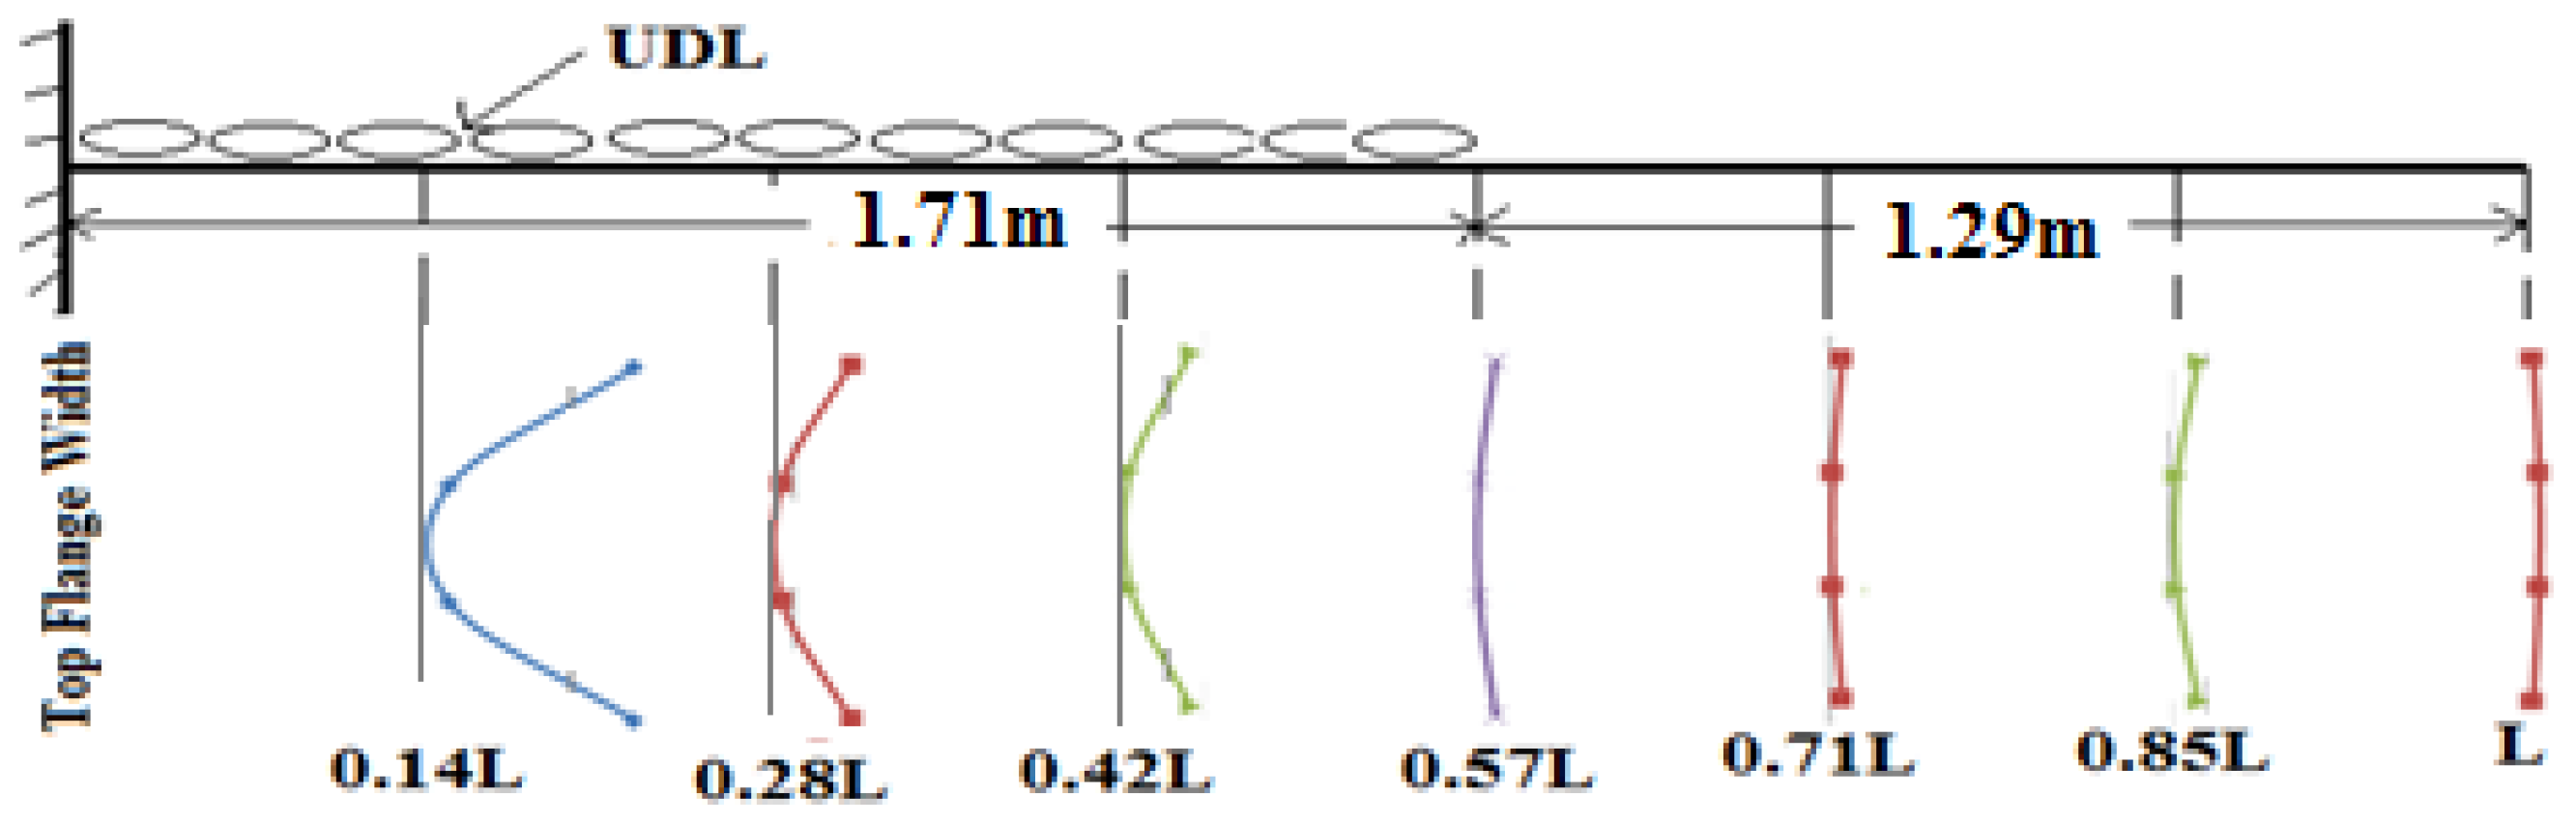
Figure 3, its top flange deformation along the width is shown. These deformations are shown at regular intervals along the length of the beam. These deformations are magnified for better understanding. It can be observed that till the length 0.85
L deformation in the corner part is more than the deformation in the mid part of the flange. For further length, the mid portion of the flange is showing more deformation in comparison to the corner part.
Figure 3.
Top flange deformation in the longitudinal direction.
Figure 3.
Top flange deformation in the longitudinal direction.
5. Positive and Negative Shear Lag, Shear Lag Ratio
Near the fixed end of the cantilever beam, along the flange width, stresses are high at the corner side in comparison to the middle of the panel. This type of shear leg effect is called positive shear leg. Towards the free end, in the middle part of the flange, stresses are high in comparison to the corner part of the flange. This type of shear lag is called negative shear lag.
Shear lag ratio is introduced to measure the magnitude of shear lag effect. It is the ratio of stress of maximum stress at the corner side of the flange panel to the middle of the panel where stress is least. This ratio tells the effect of shear lag in the panel.
Less than one value of shear lag ratio describes the negative shear lag. Table 1 shows variation of shear lag ratio along the length of this beam.
Table 1.
Shear lag ratio in beam.
Table 1.
Shear lag ratio in beam.
| Beam Location from Fixed Support (m) | Shear Lag Ratio |
|---|
| 0.14L | 1.252 |
| 0.28L | 1.054 |
| 0.42L | 1.039 |
| 0.57L | 1.010 |
| 0.71L | 1.001 |
| 0.85L | 1.002 |
| L | 0.999 |
6. Building Modeling
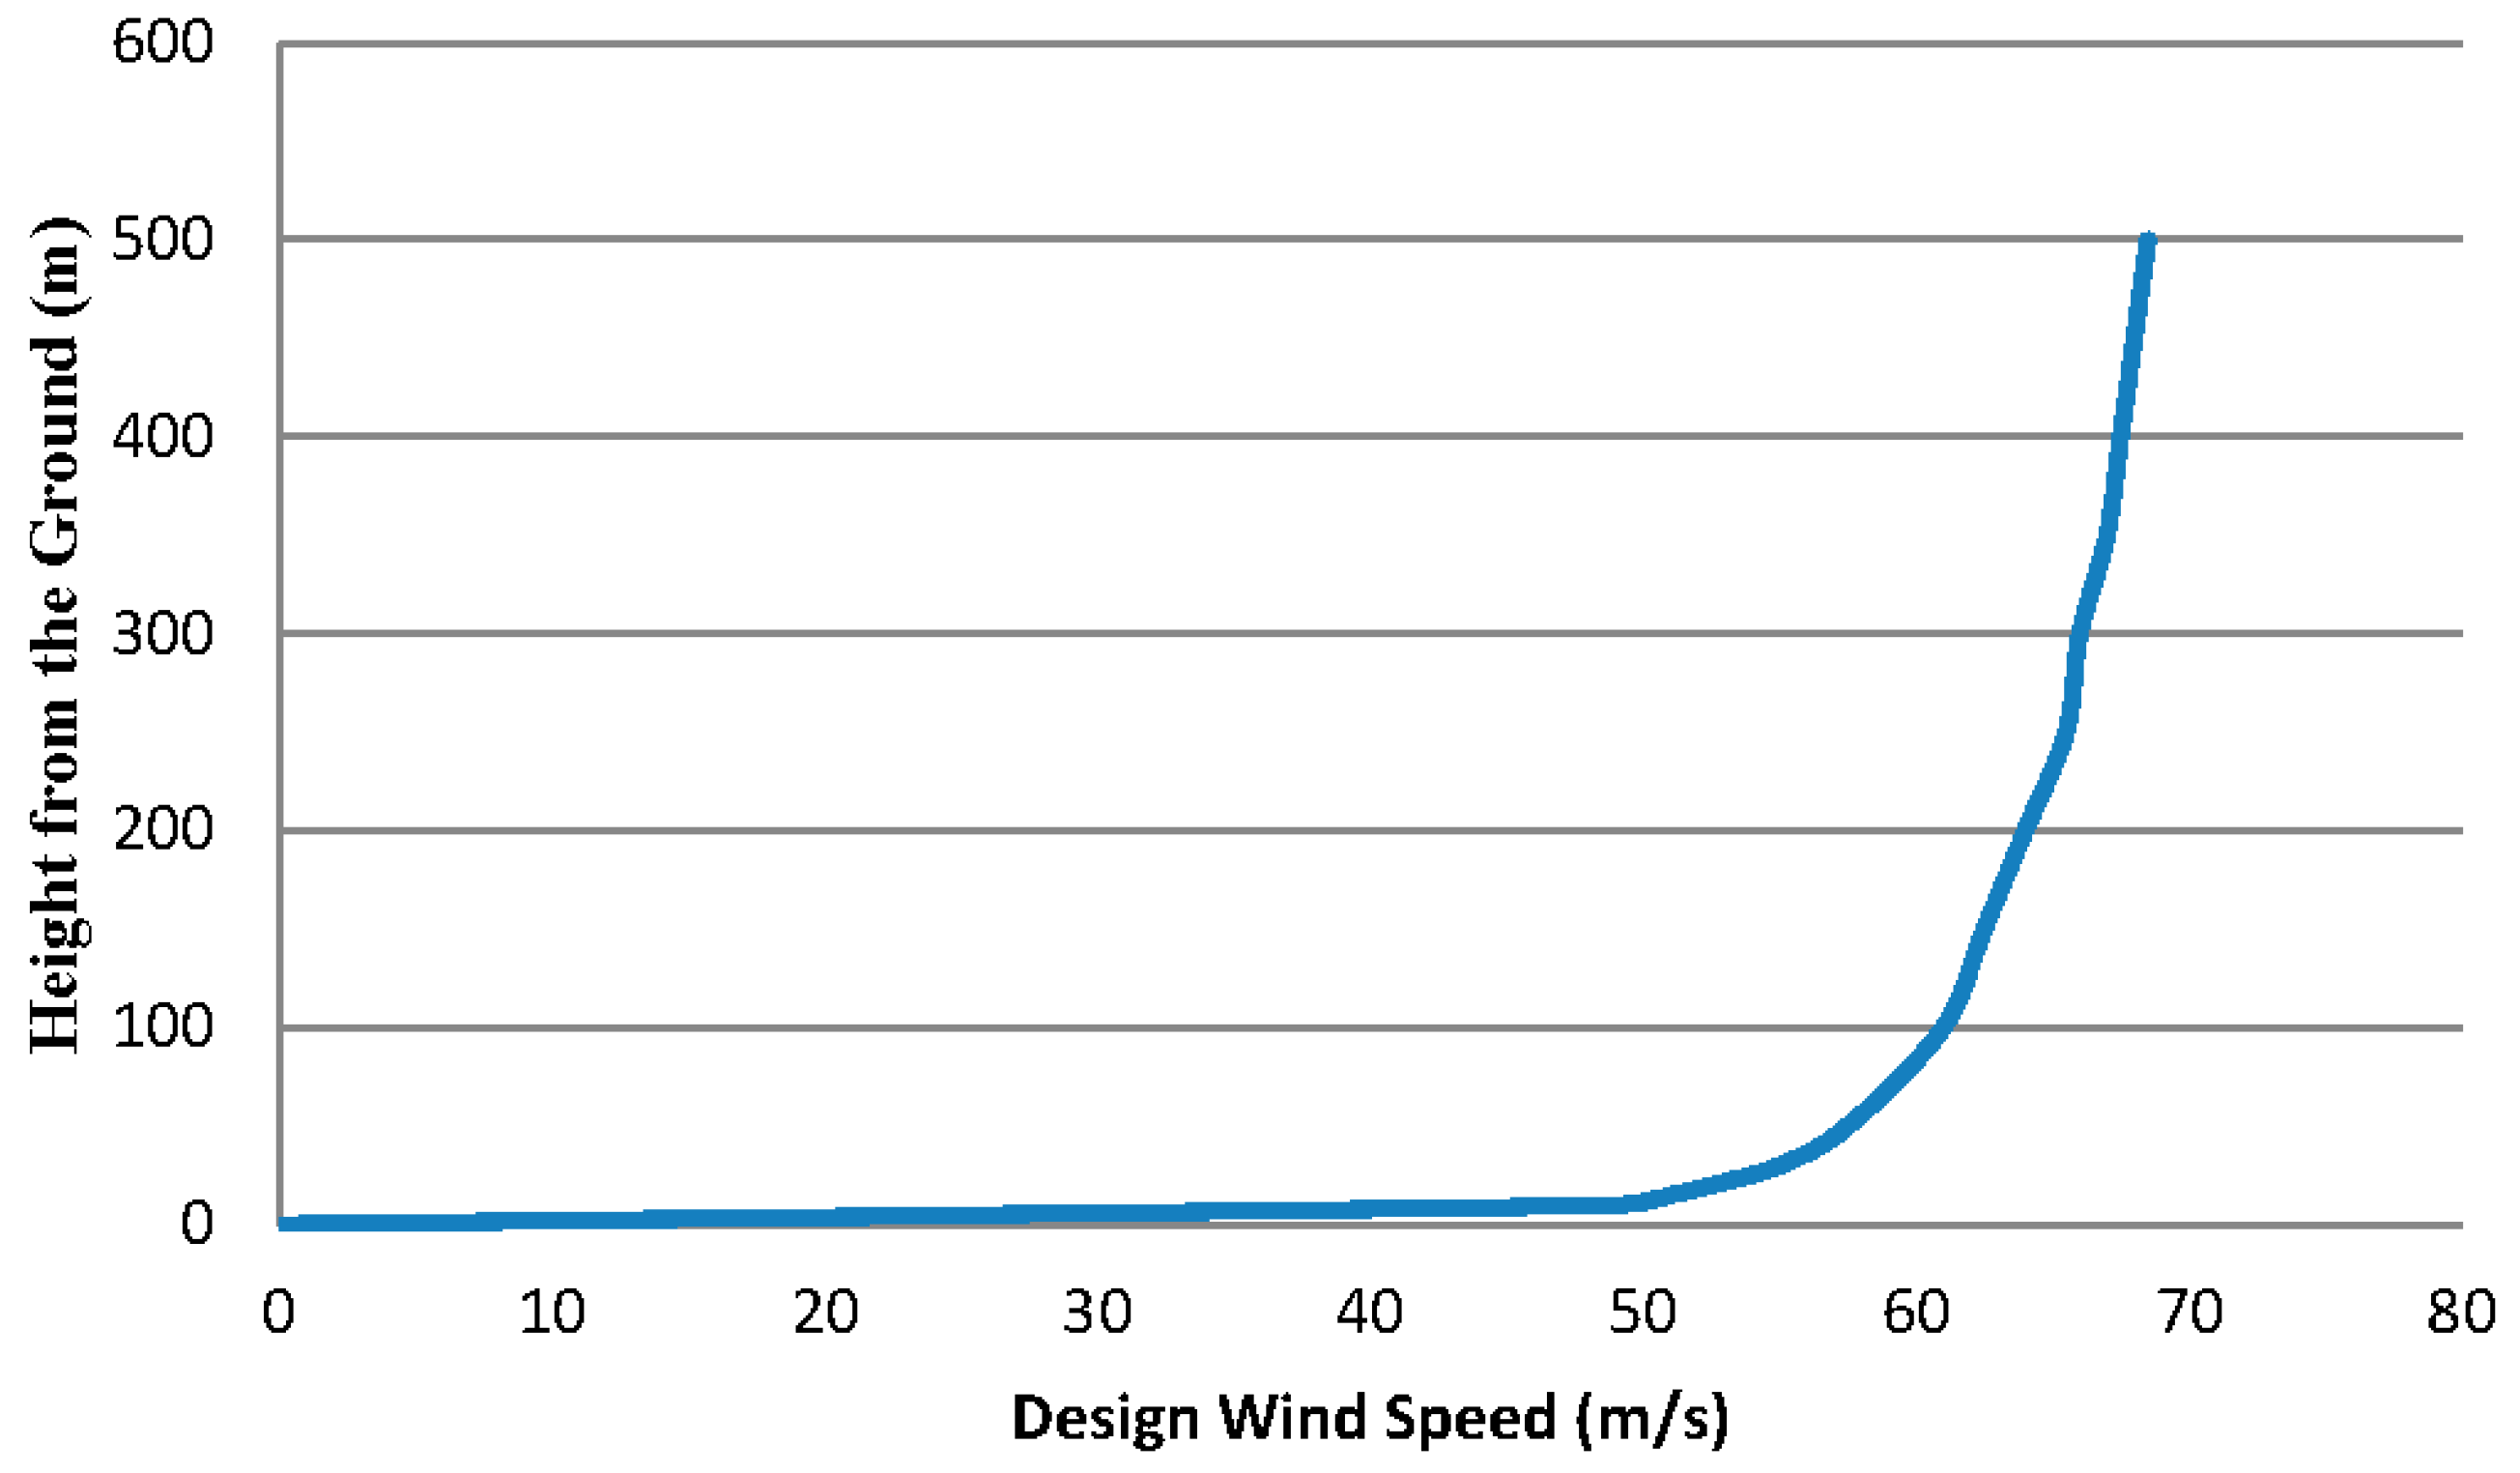
For all buildings, building plan area is 42 m × 42 m. Columns are spaced at 3.5 m center to center, and floor height is set as 3.5 m each. For the heights of 120 stories, a central core also has to be provided to control the lateral deflect limit. A building’s façade beam–column connections are moment connections. Central core area is 25% of the total plan area. Area between central core and building façade is column free which spans 10.5 m. This area intentionally left column free which increases the chances for the gravity loads to transfer to façade columns hereby increasing building’s resistance in overturning. Inner core column are connected with rigid diaphragm with outer peripheral columns. Each diaphragm is modeled rigid in its plane, which means plane deformation is negligible, whereas for out of plane or in bending, the diaphragm is free to bend. Now, in this tube in tube structure, the diaphragm being rigid, the entire lateral load is carried by the perimeter and inner core columns only. For wind load, basic wind speed is taken as 50 m/s and applied according to IS: 875, Part 3. Depending upon several factors like place, category of the terrain and class of structure, the design wind speed according to Indian Standard code of practice is given in
Figure 4 [
13]. Building bracing systems are also connected with pined connections. Cross-sectional dimensions of 120 story high buildings are shown in
Table 2.
Figure 4.
Design wind speed according to IS 875 for calculation of lateral load on building model.
Figure 4.
Design wind speed according to IS 875 for calculation of lateral load on building model.
Table 2.
Dimensions of the members for 120-story high building.
Table 2.
Dimensions of the members for 120-story high building.
| Name of the Panel | Size (m2) |
|---|
| Beam | 0.5 × 1.25 |
| Column | 1 × 3 |
| Cornor Columns | 1.5 × 1.5 |
7. Shear Lag Effect in a Building
The objective of this paper is to study the shear lag for different heights of buildings and to investigate it for different possible geometric patterns of bracing systems.
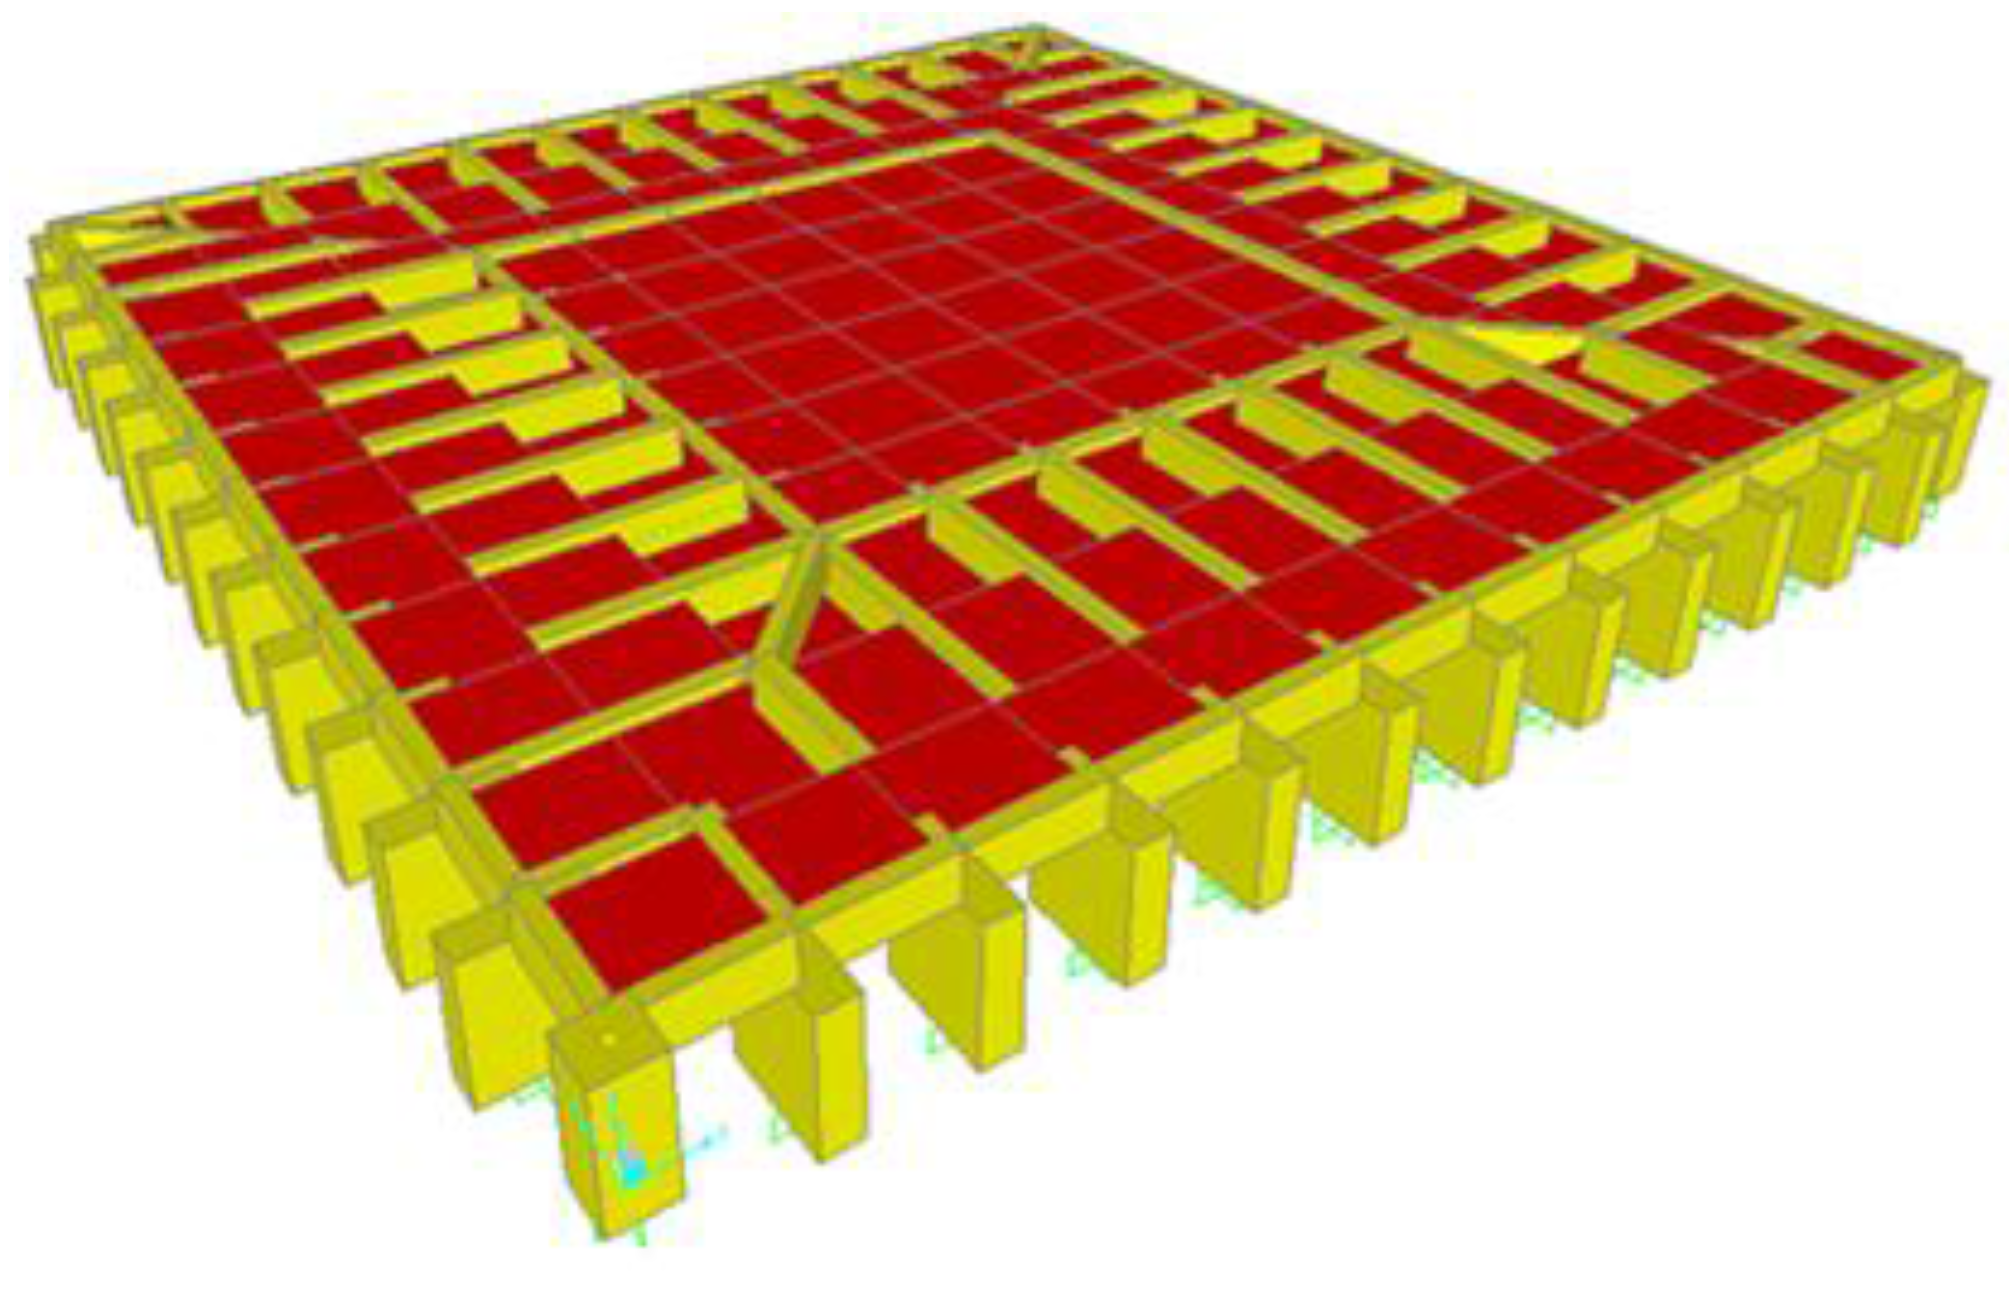
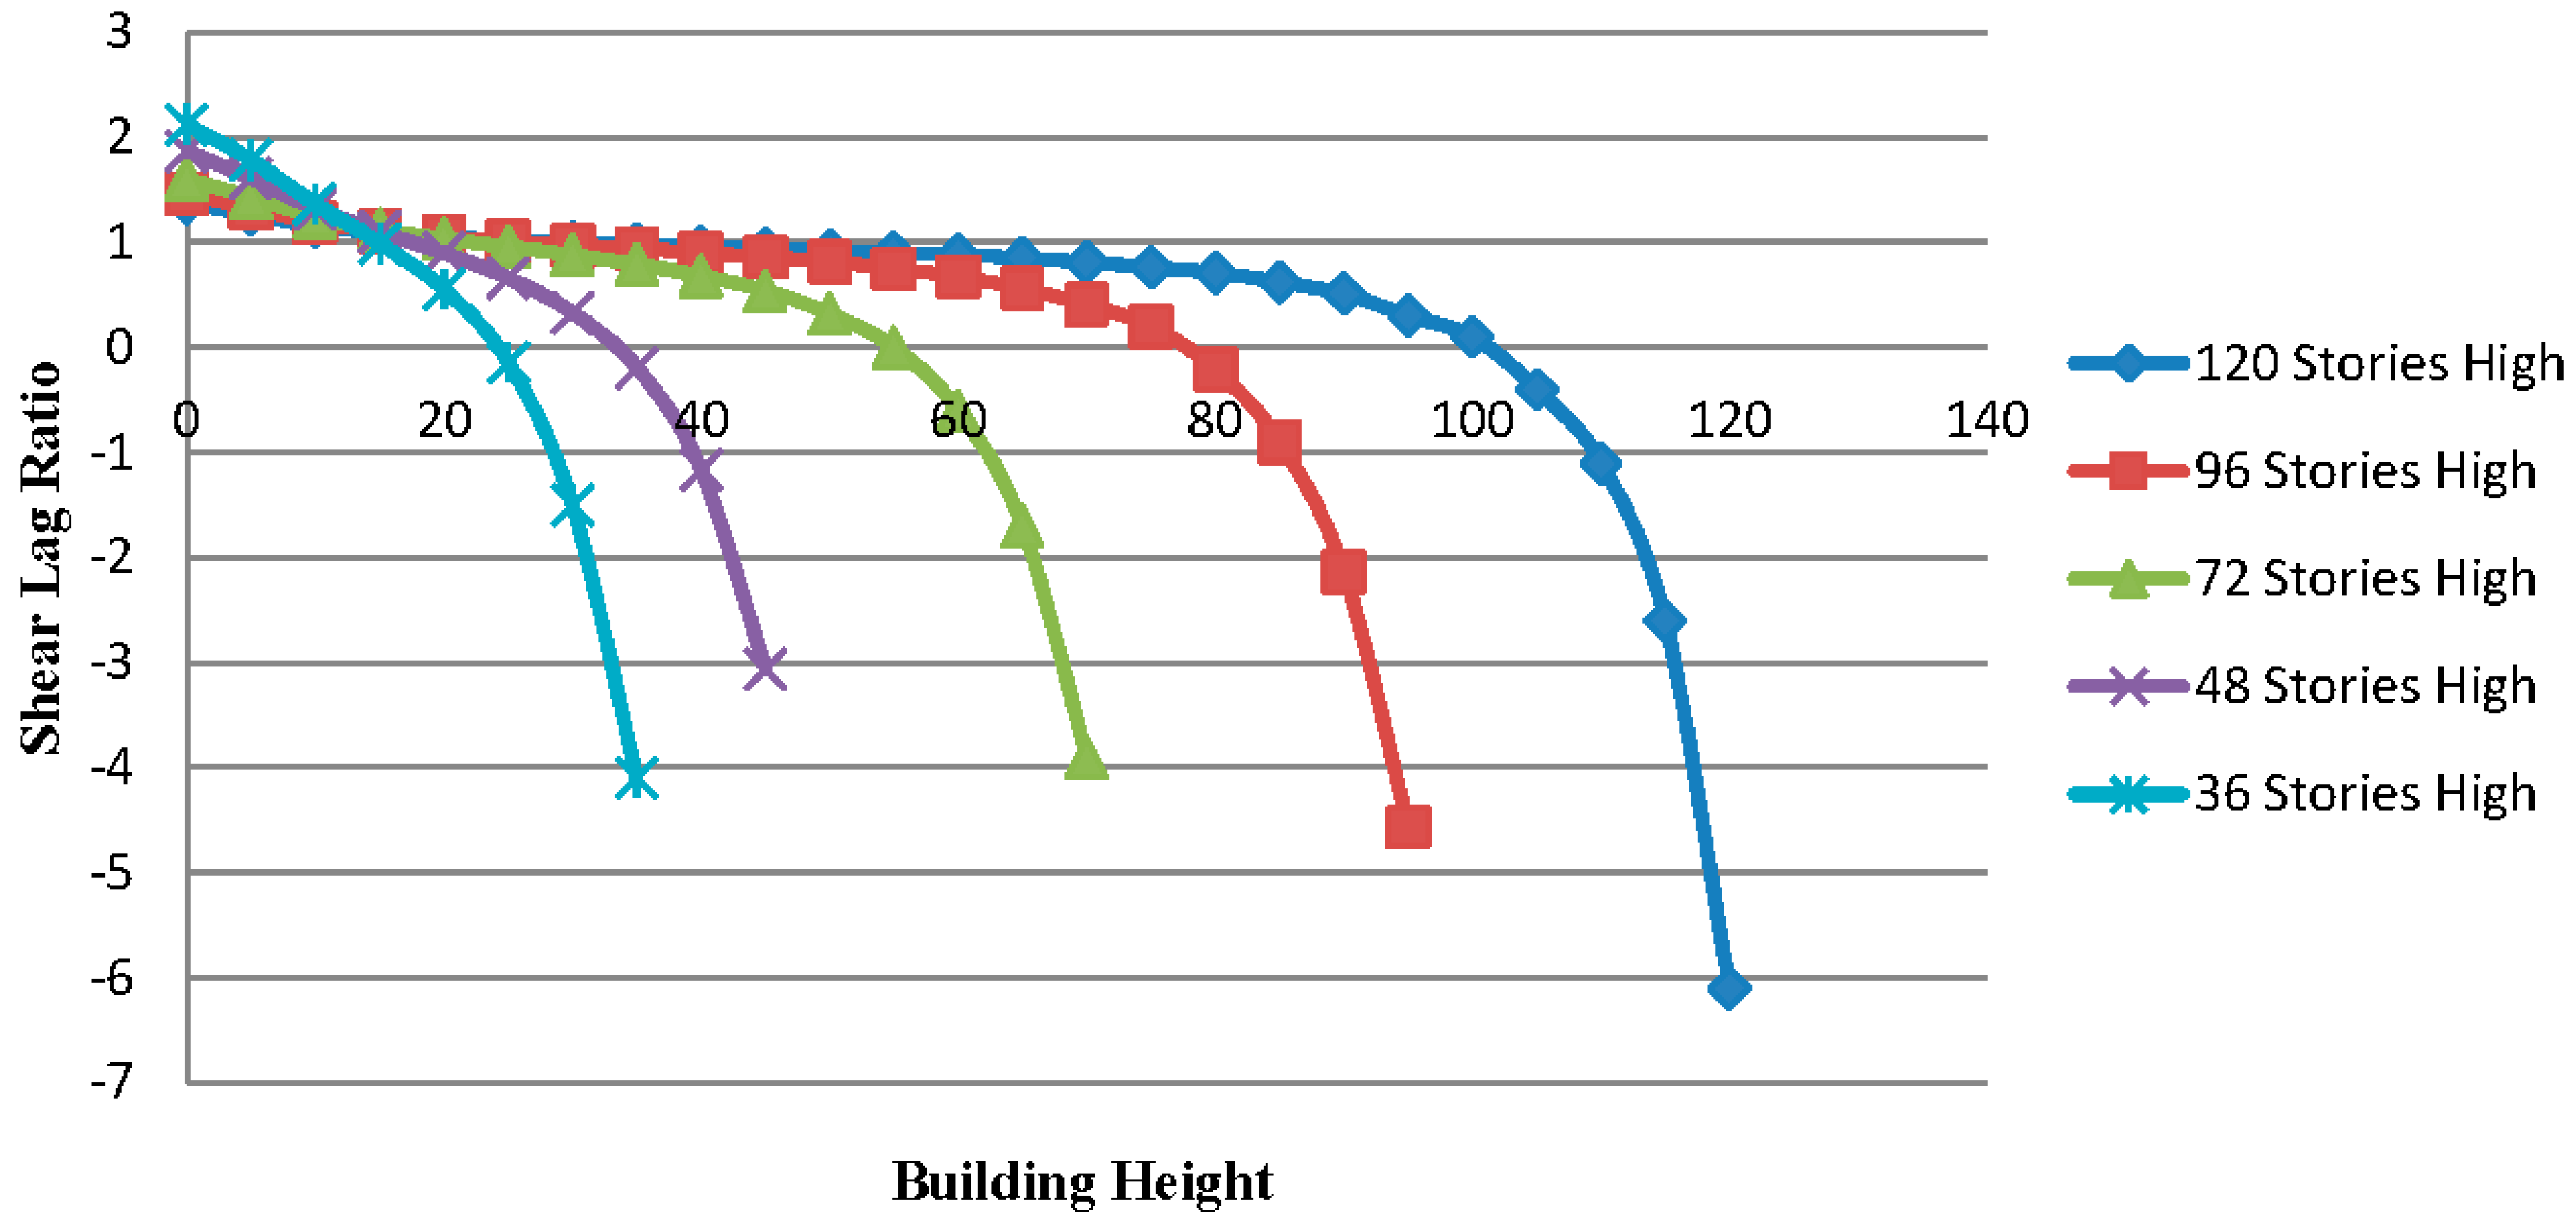
Figure 5 shows the shear lag effect in a 120 story high framed tube in tube structural building. It can be seen in this building that at the bottom of the building there is a positive shear lag effect. With increasing height, it continues to decrease till it becomes zero. For further height, it converts to negative shear lag (
Figure 6).
Figure 5.
Perspective view of the ground story.
Figure 5.
Perspective view of the ground story.
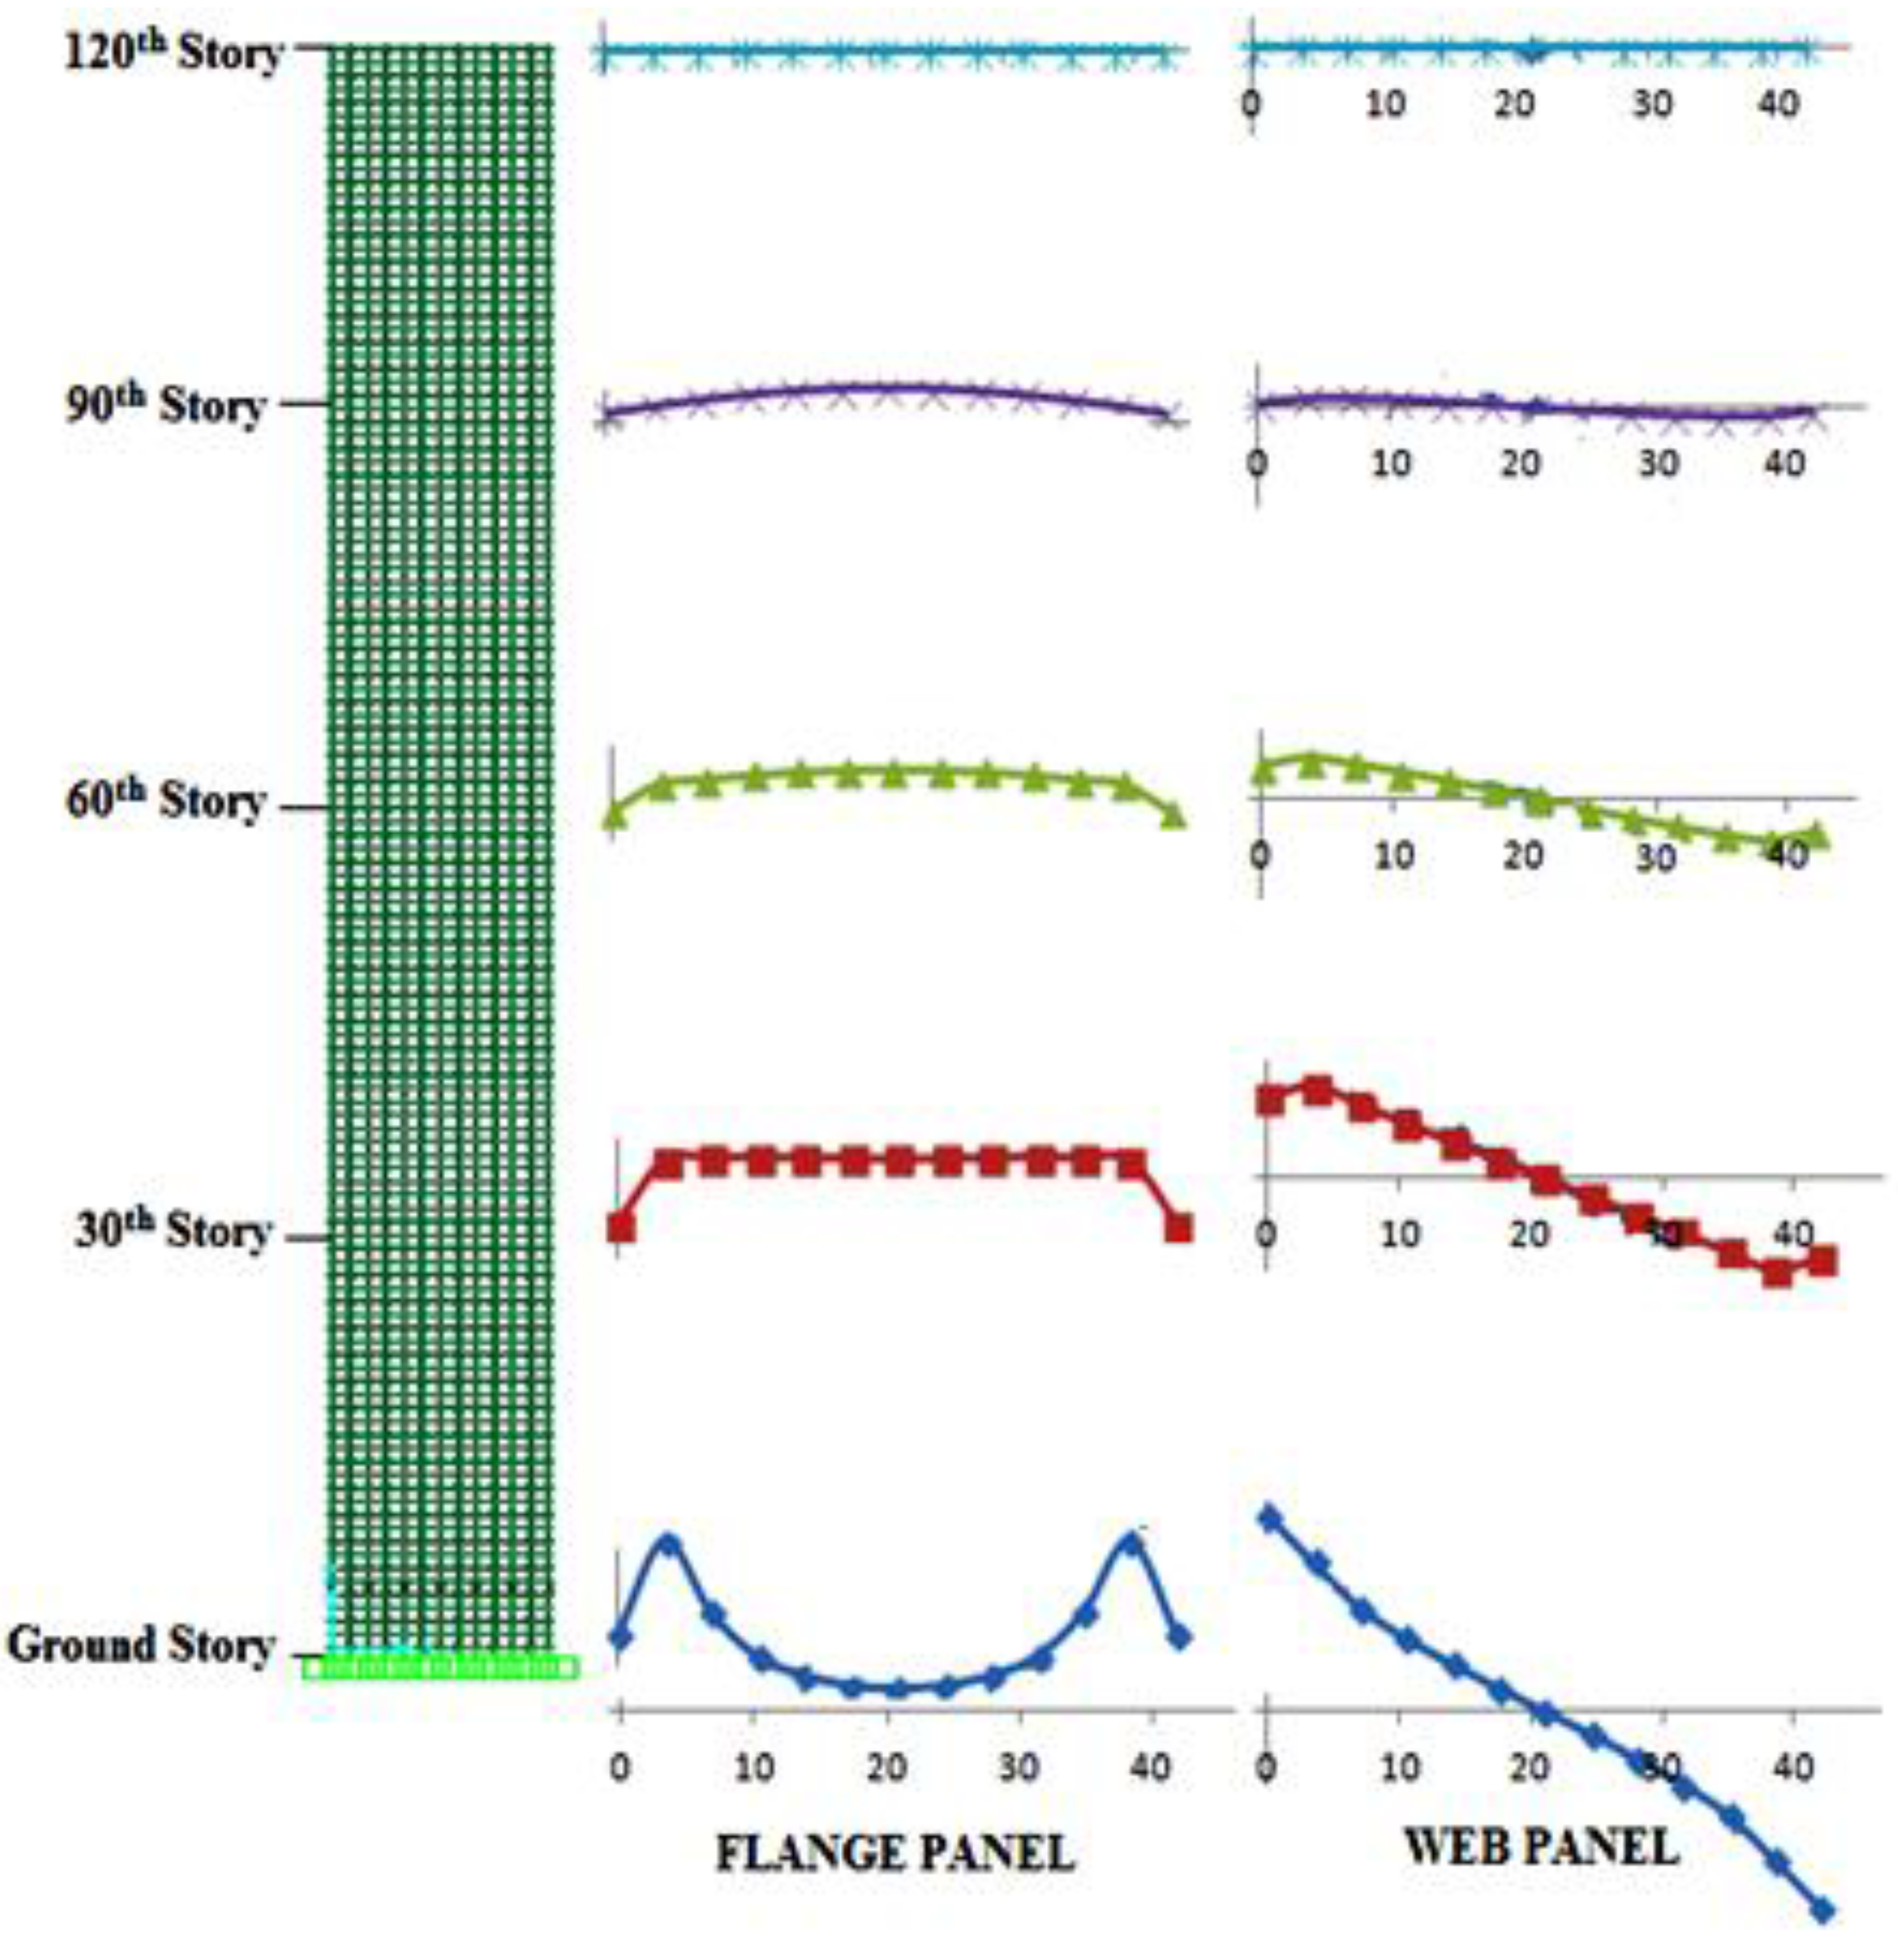
Figure 6.
Shear lag effect in 120-story high building. Flange and web panel are shown.
Figure 6.
Shear lag effect in 120-story high building. Flange and web panel are shown.
In these results, it is found that for 120-story high buildings, value of shear lag ratio starts changing from positive to negative at around the 30th story. For 96-story high buildings, this change comes at around the 25th story. For 72-story high buildings, it is at 20th story and for 48- and 36-story high buildings, it is at around the 15th story.
8. Problem Statement
For reducing shear lag, Fazlur Khan suggested one possible method is by providing a bracing system in panels. These inclined bracing systems with their axial action reduce the flexibility of beam column joints which in turn increases the stiffness of the whole panel for withstanding lateral loads.
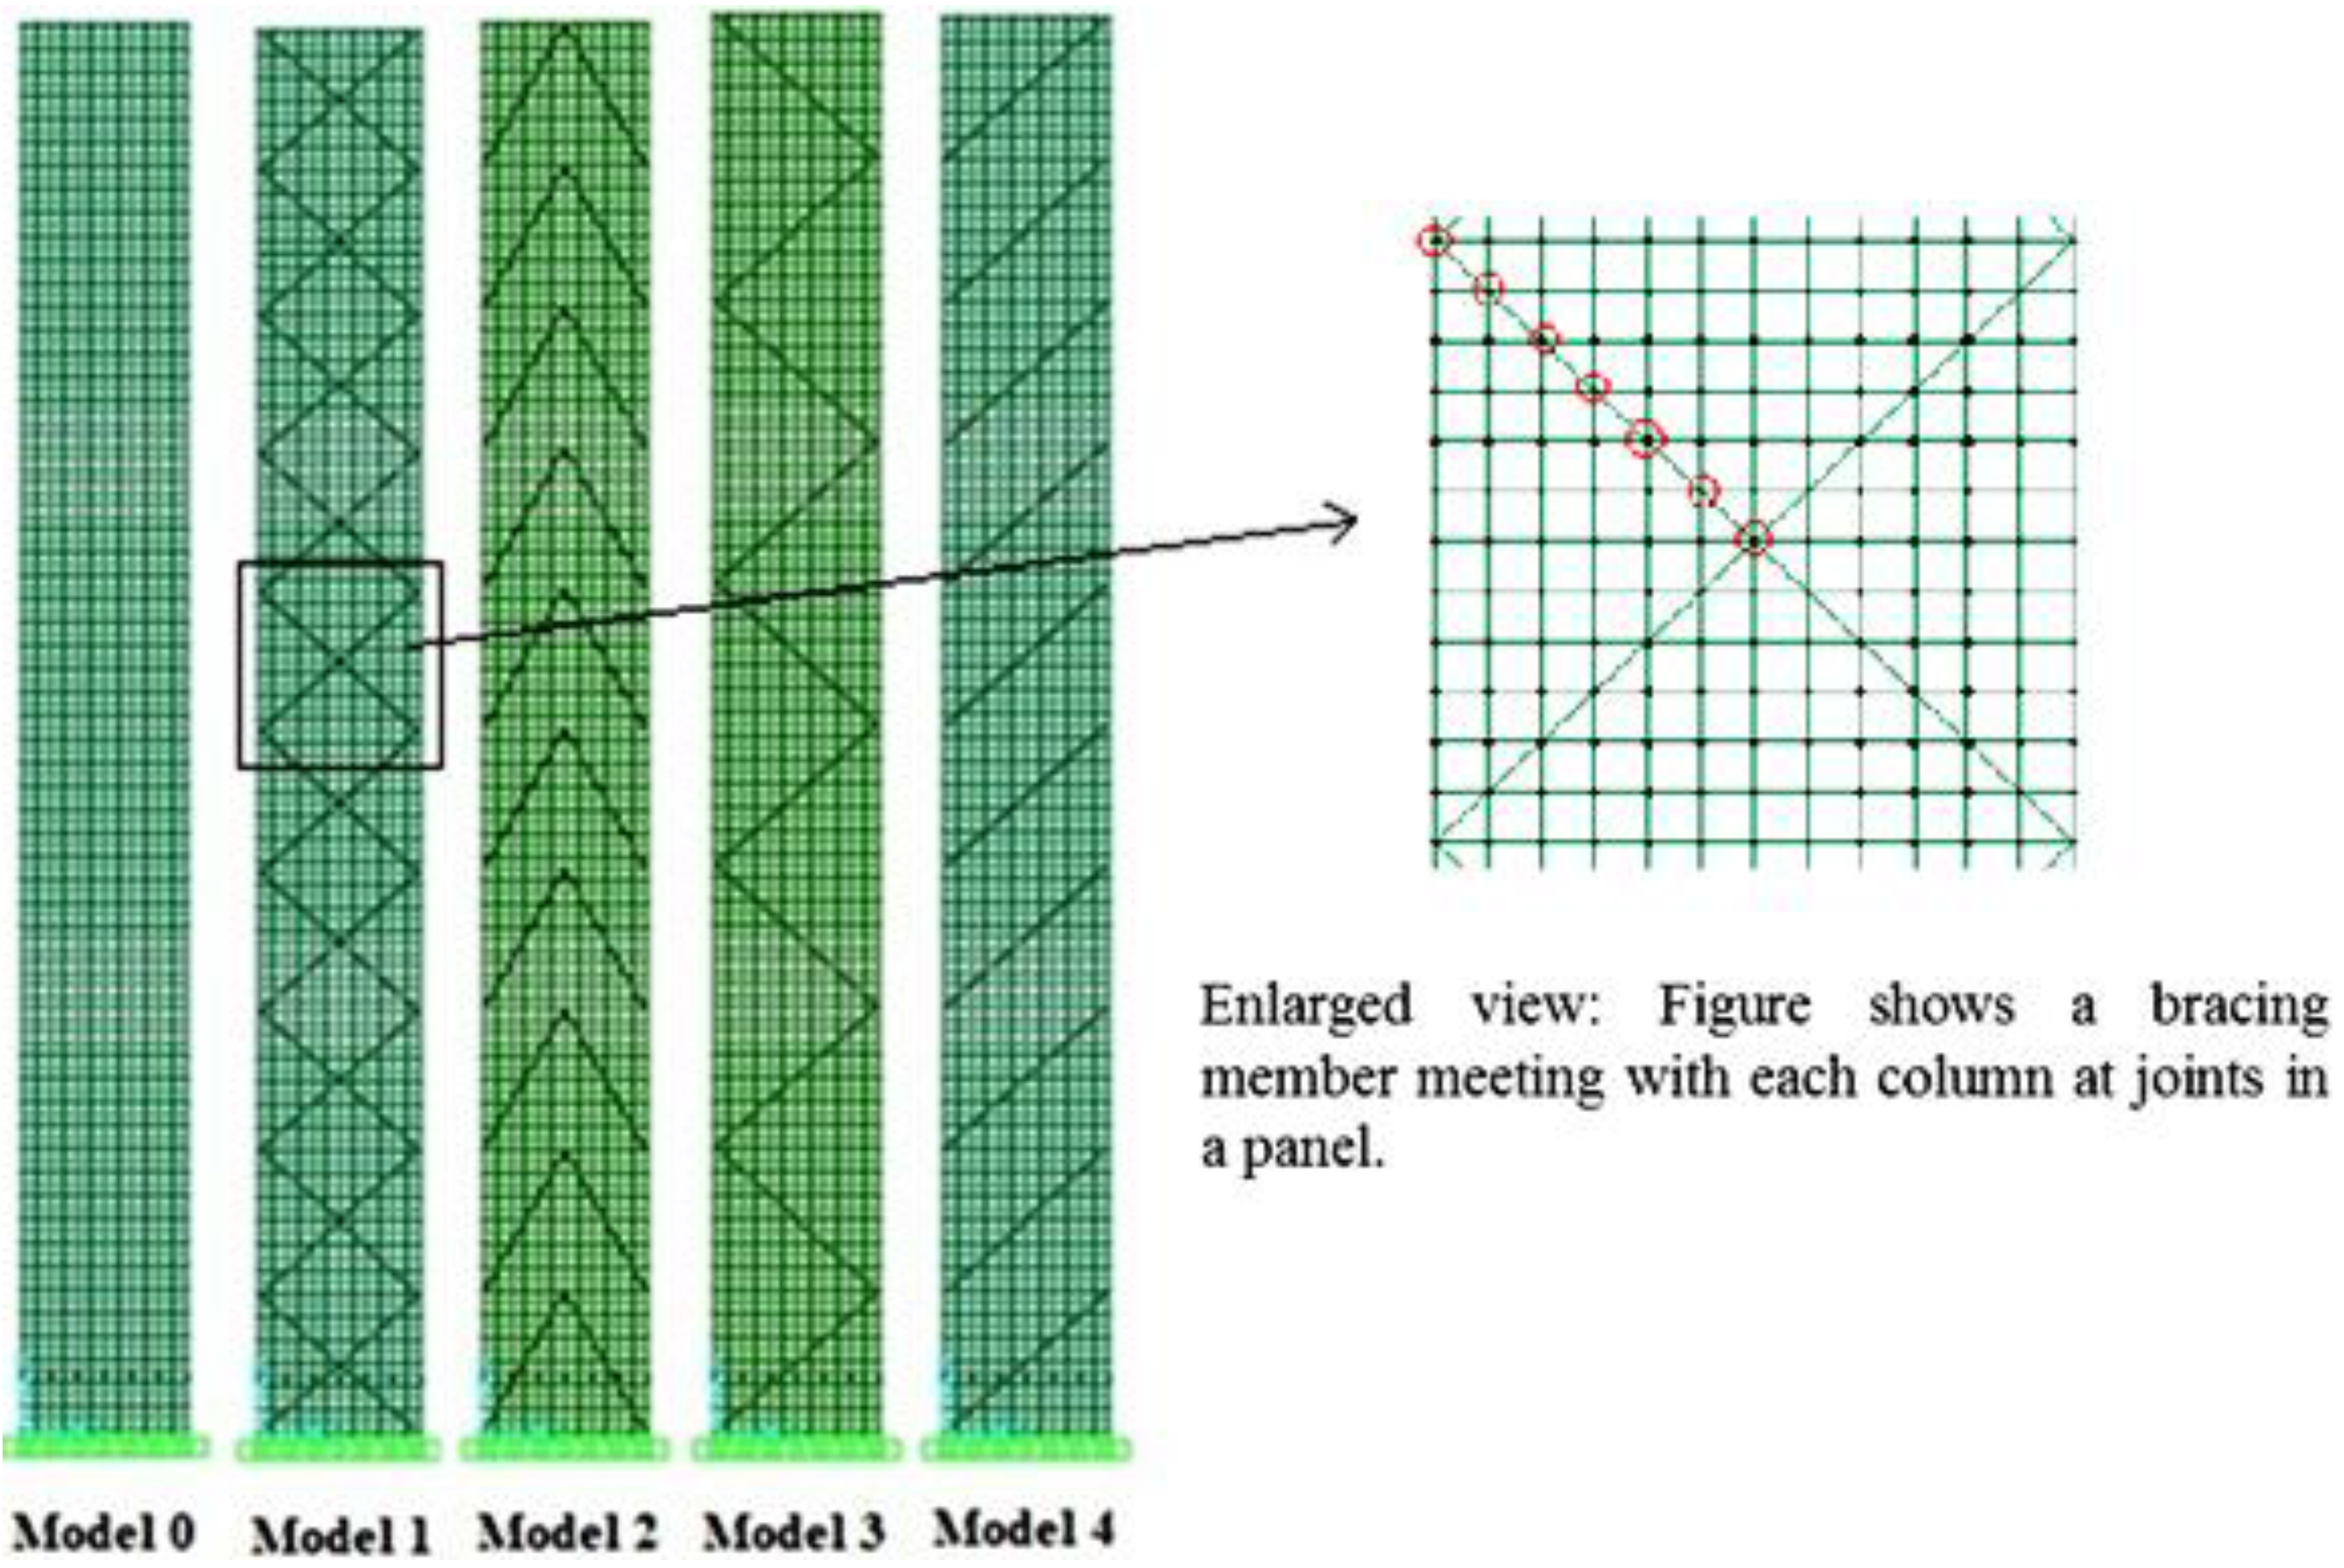
Fulfilling the geometric requirement of the building, bracings are provided with an inclination of 45°, 63.43°, 71.56°, 75.96°, 80.53°and 84.28° from horizontal. With these geometric angles, each diagonal member meets each column at the beam column joints (
Figure 7 and
Figure 8) in a panel. Buildings without braces are considered to have a 0° angle. All possible geometric configurations of bracing systems are considered in this study (
Figure 9).
Short buildings with low aspect ratio are expected to deform in shear whereas tall buildings of high aspect ratio are expected to deform by bending action. So, as the height of the building increases, its optimal angle of bracing system is also expected to increase. It lies between 35° and 55° for 100 story high buildings as discovered by Moon in his studies [
12].
Figure 7.
Bracing systems of different patterns considered in this study. Bracing angle is 45° from horizontal. Only 120 story high buildings are shown.
Figure 7.
Bracing systems of different patterns considered in this study. Bracing angle is 45° from horizontal. Only 120 story high buildings are shown.
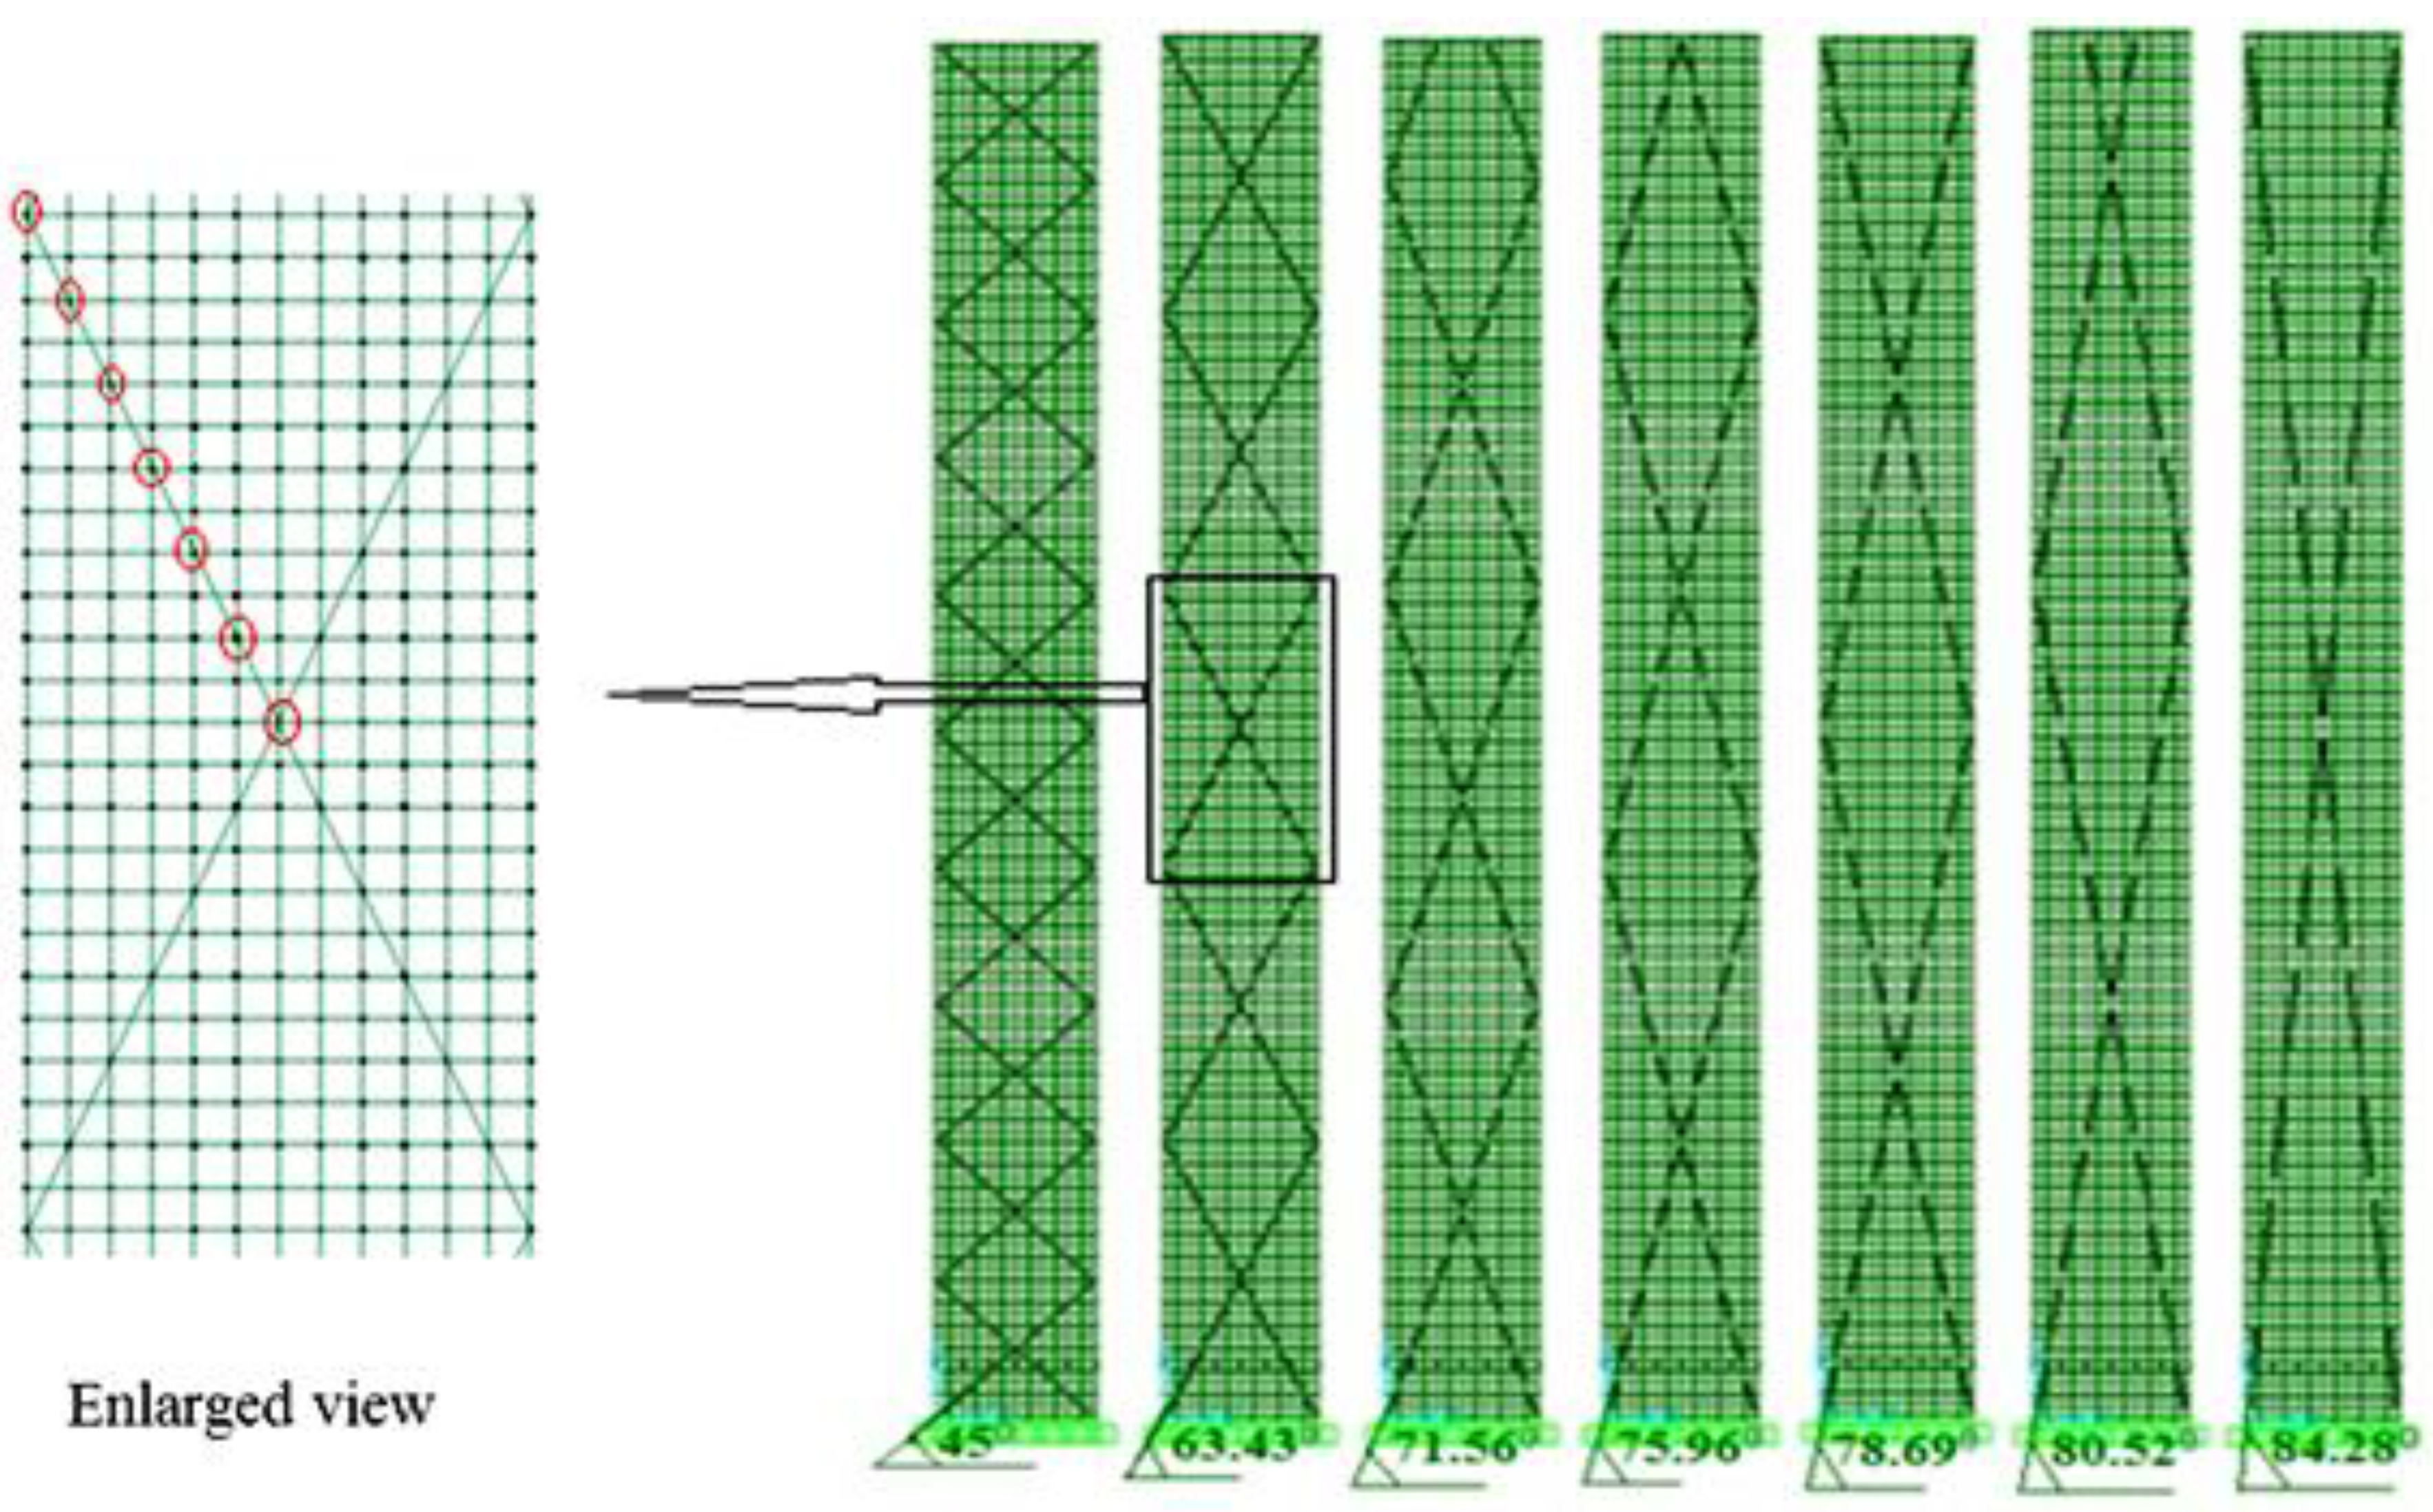
Figure 8.
Buildings of Model 1. Different alignments of bracings in 120-story high buildings are shown.
Figure 8.
Buildings of Model 1. Different alignments of bracings in 120-story high buildings are shown.
Figure 9.
Variation of shear lag ratio vs. the number of stories.
Figure 9.
Variation of shear lag ratio vs. the number of stories.
Optimum Design Strategy
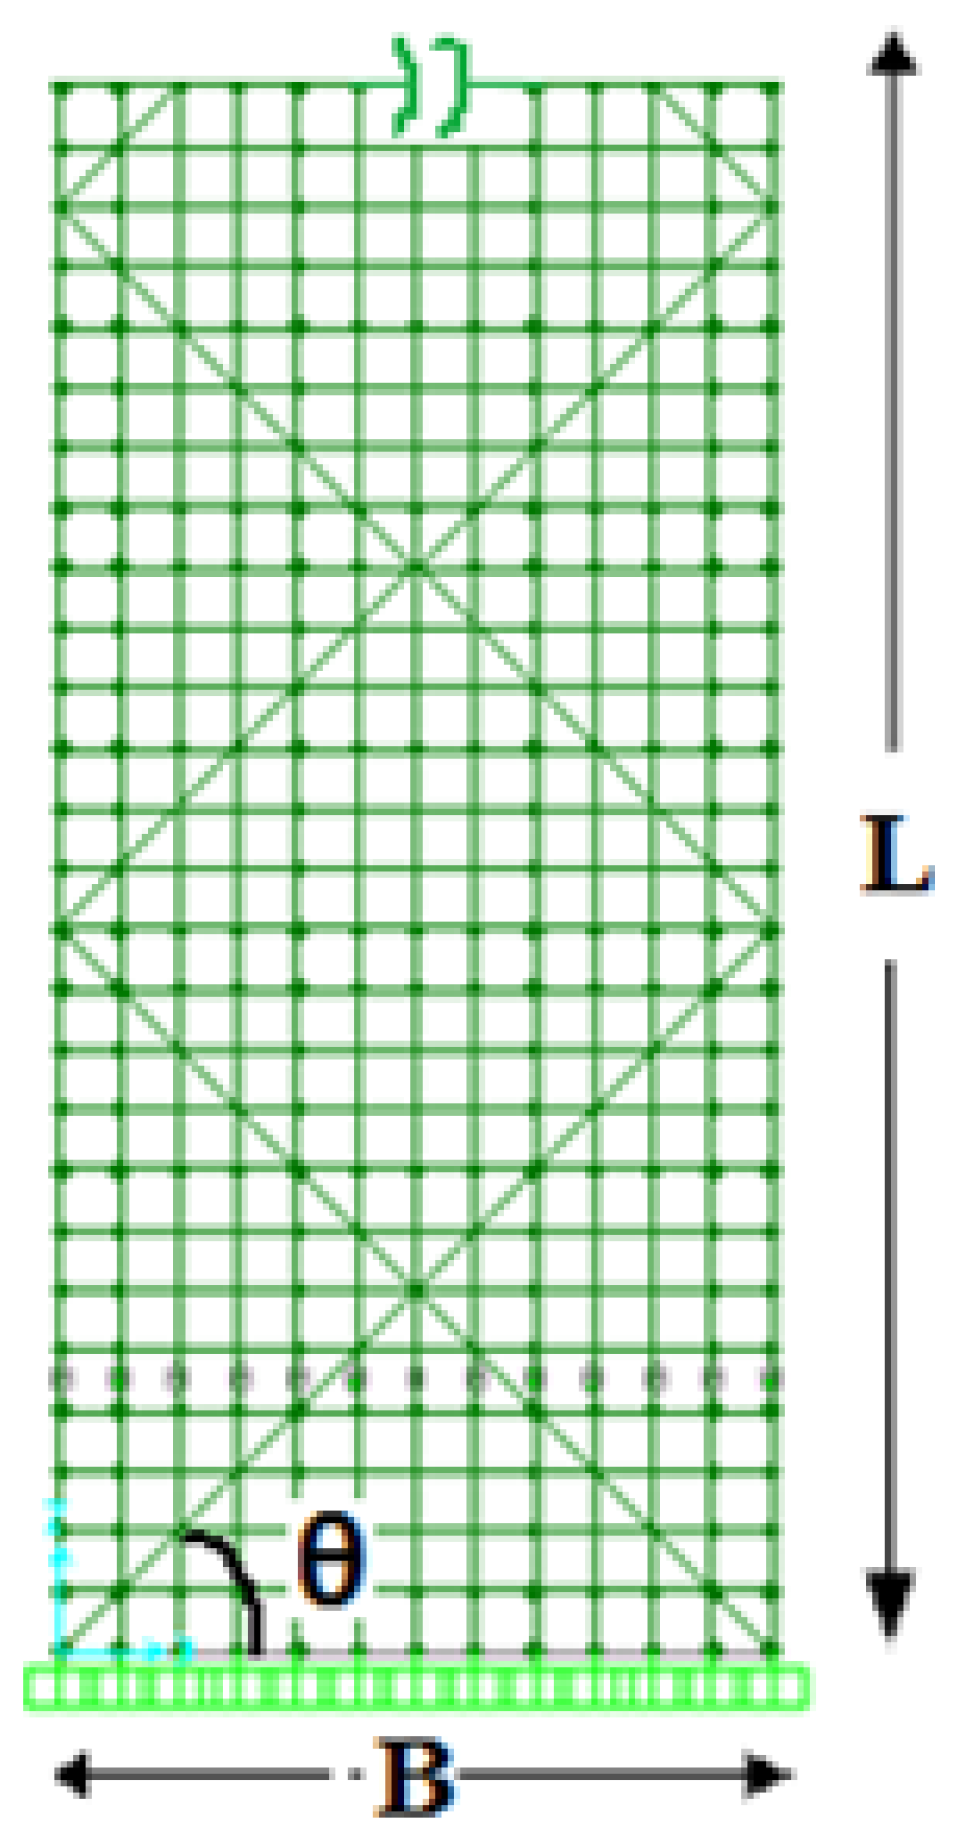
Suppose
B and
L is the width and height of the building, respectively. With bracing angle θ from horizontal, total length of one bracing becomes
L/sin(θ) (
Figure 10).
Figure 10.
Figure shows length and width of the building along with the bracing angle θ.
Figure 10.
Figure shows length and width of the building along with the bracing angle θ.
If A is the cross-sectional area of bracing element, then total volume of steel used for one single brace becomes A × L/sin(θ). Taking example of buildings of Model 1, there are two bracing members in a panel and there are four such panels in a building. So, total volume of steel used in this type of model is 4 × 2 × A × L/sin(θ).
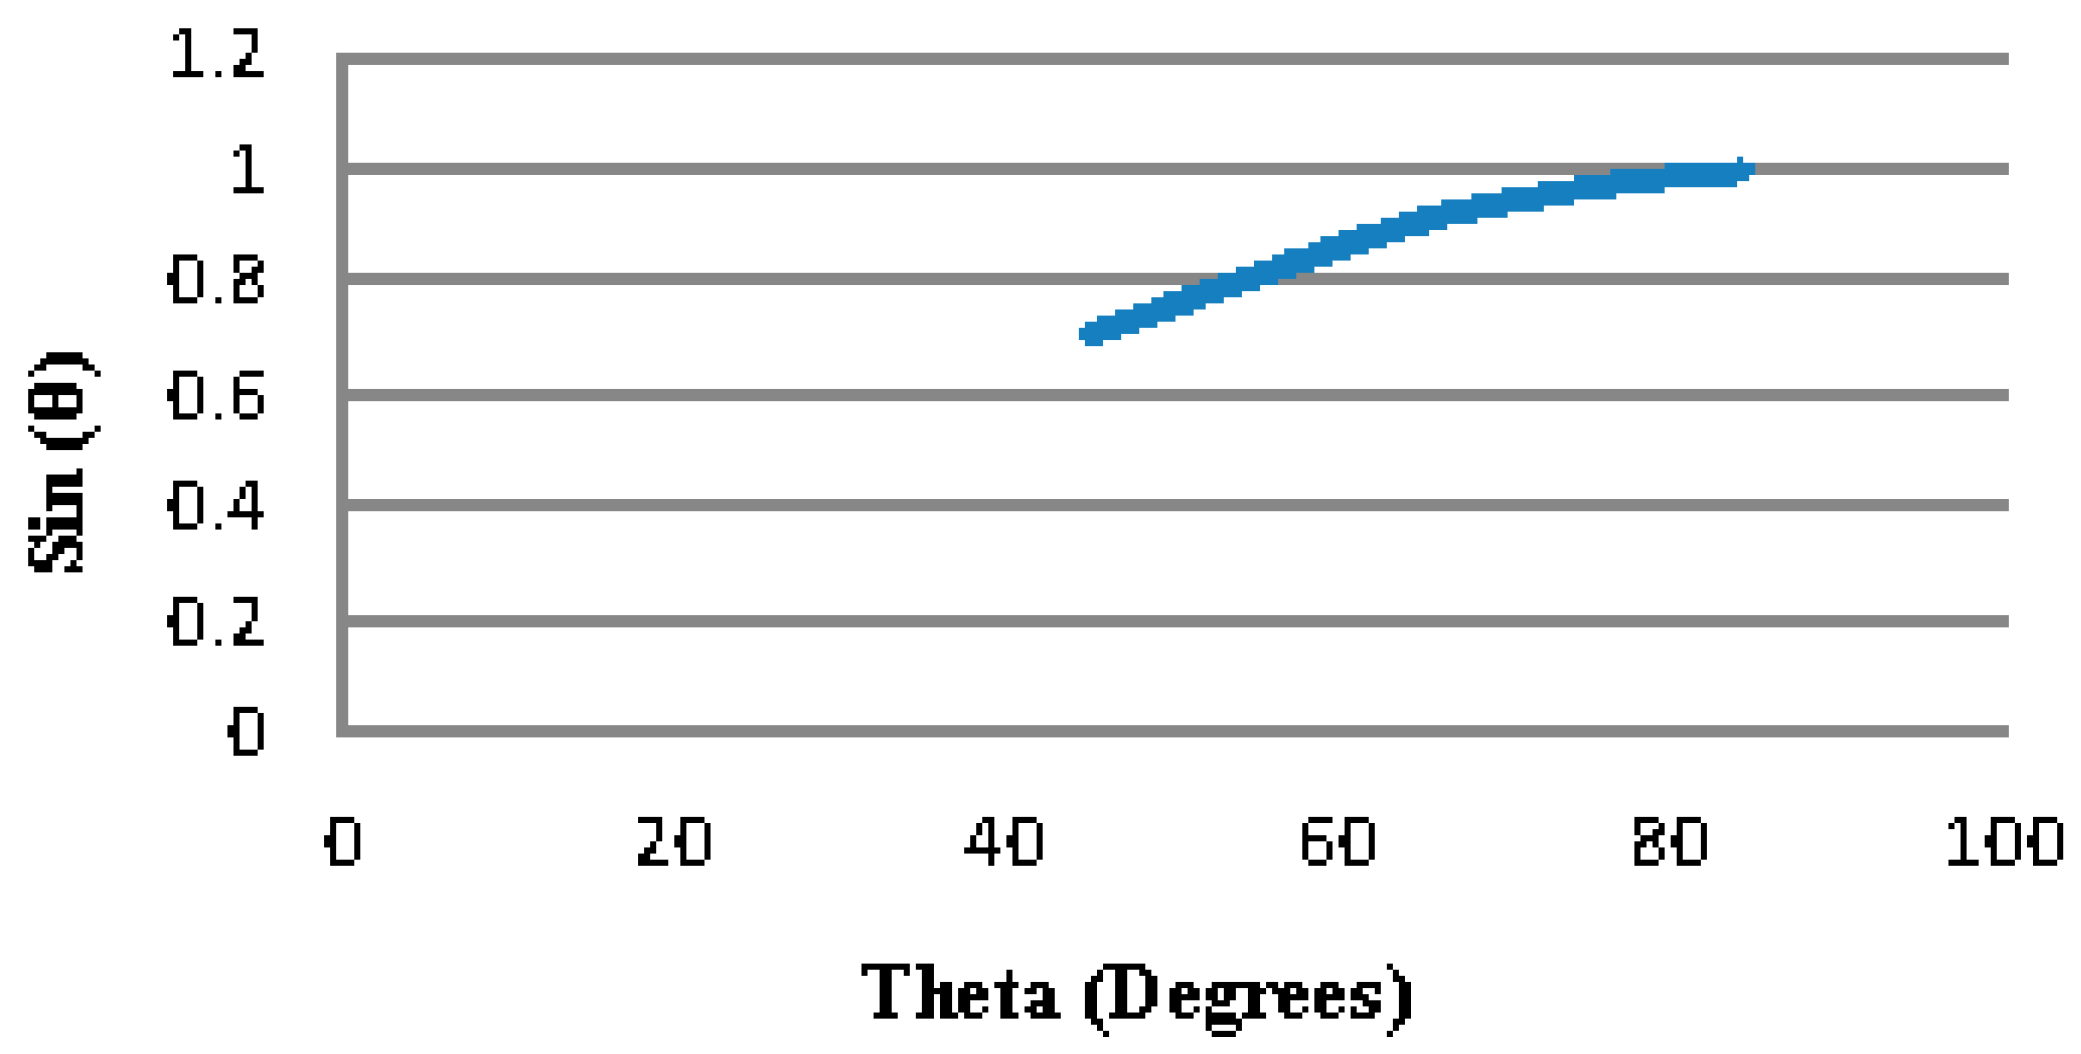
As length of the building (L) as well as member cross sectional area (A) remains the same for a particular height, this volume of steel depends on the bracing angle θ only.
As angle changes from zero to 90°, value of sin(θ) increases as can be observed in
Figure 11. Hence, volume of steel used decreases with increasing values of θ.
Figure 11.
Variation of sin(θ) with varying θ from 45° to 90°.
Figure 11.
Variation of sin(θ) with varying θ from 45° to 90°.
So, material usage is minimum for bracing angle 84.28° and maximum for 45° but can be said as optimum for the angle for which lateral deflection of building is minimum.
9. Results and Discussion
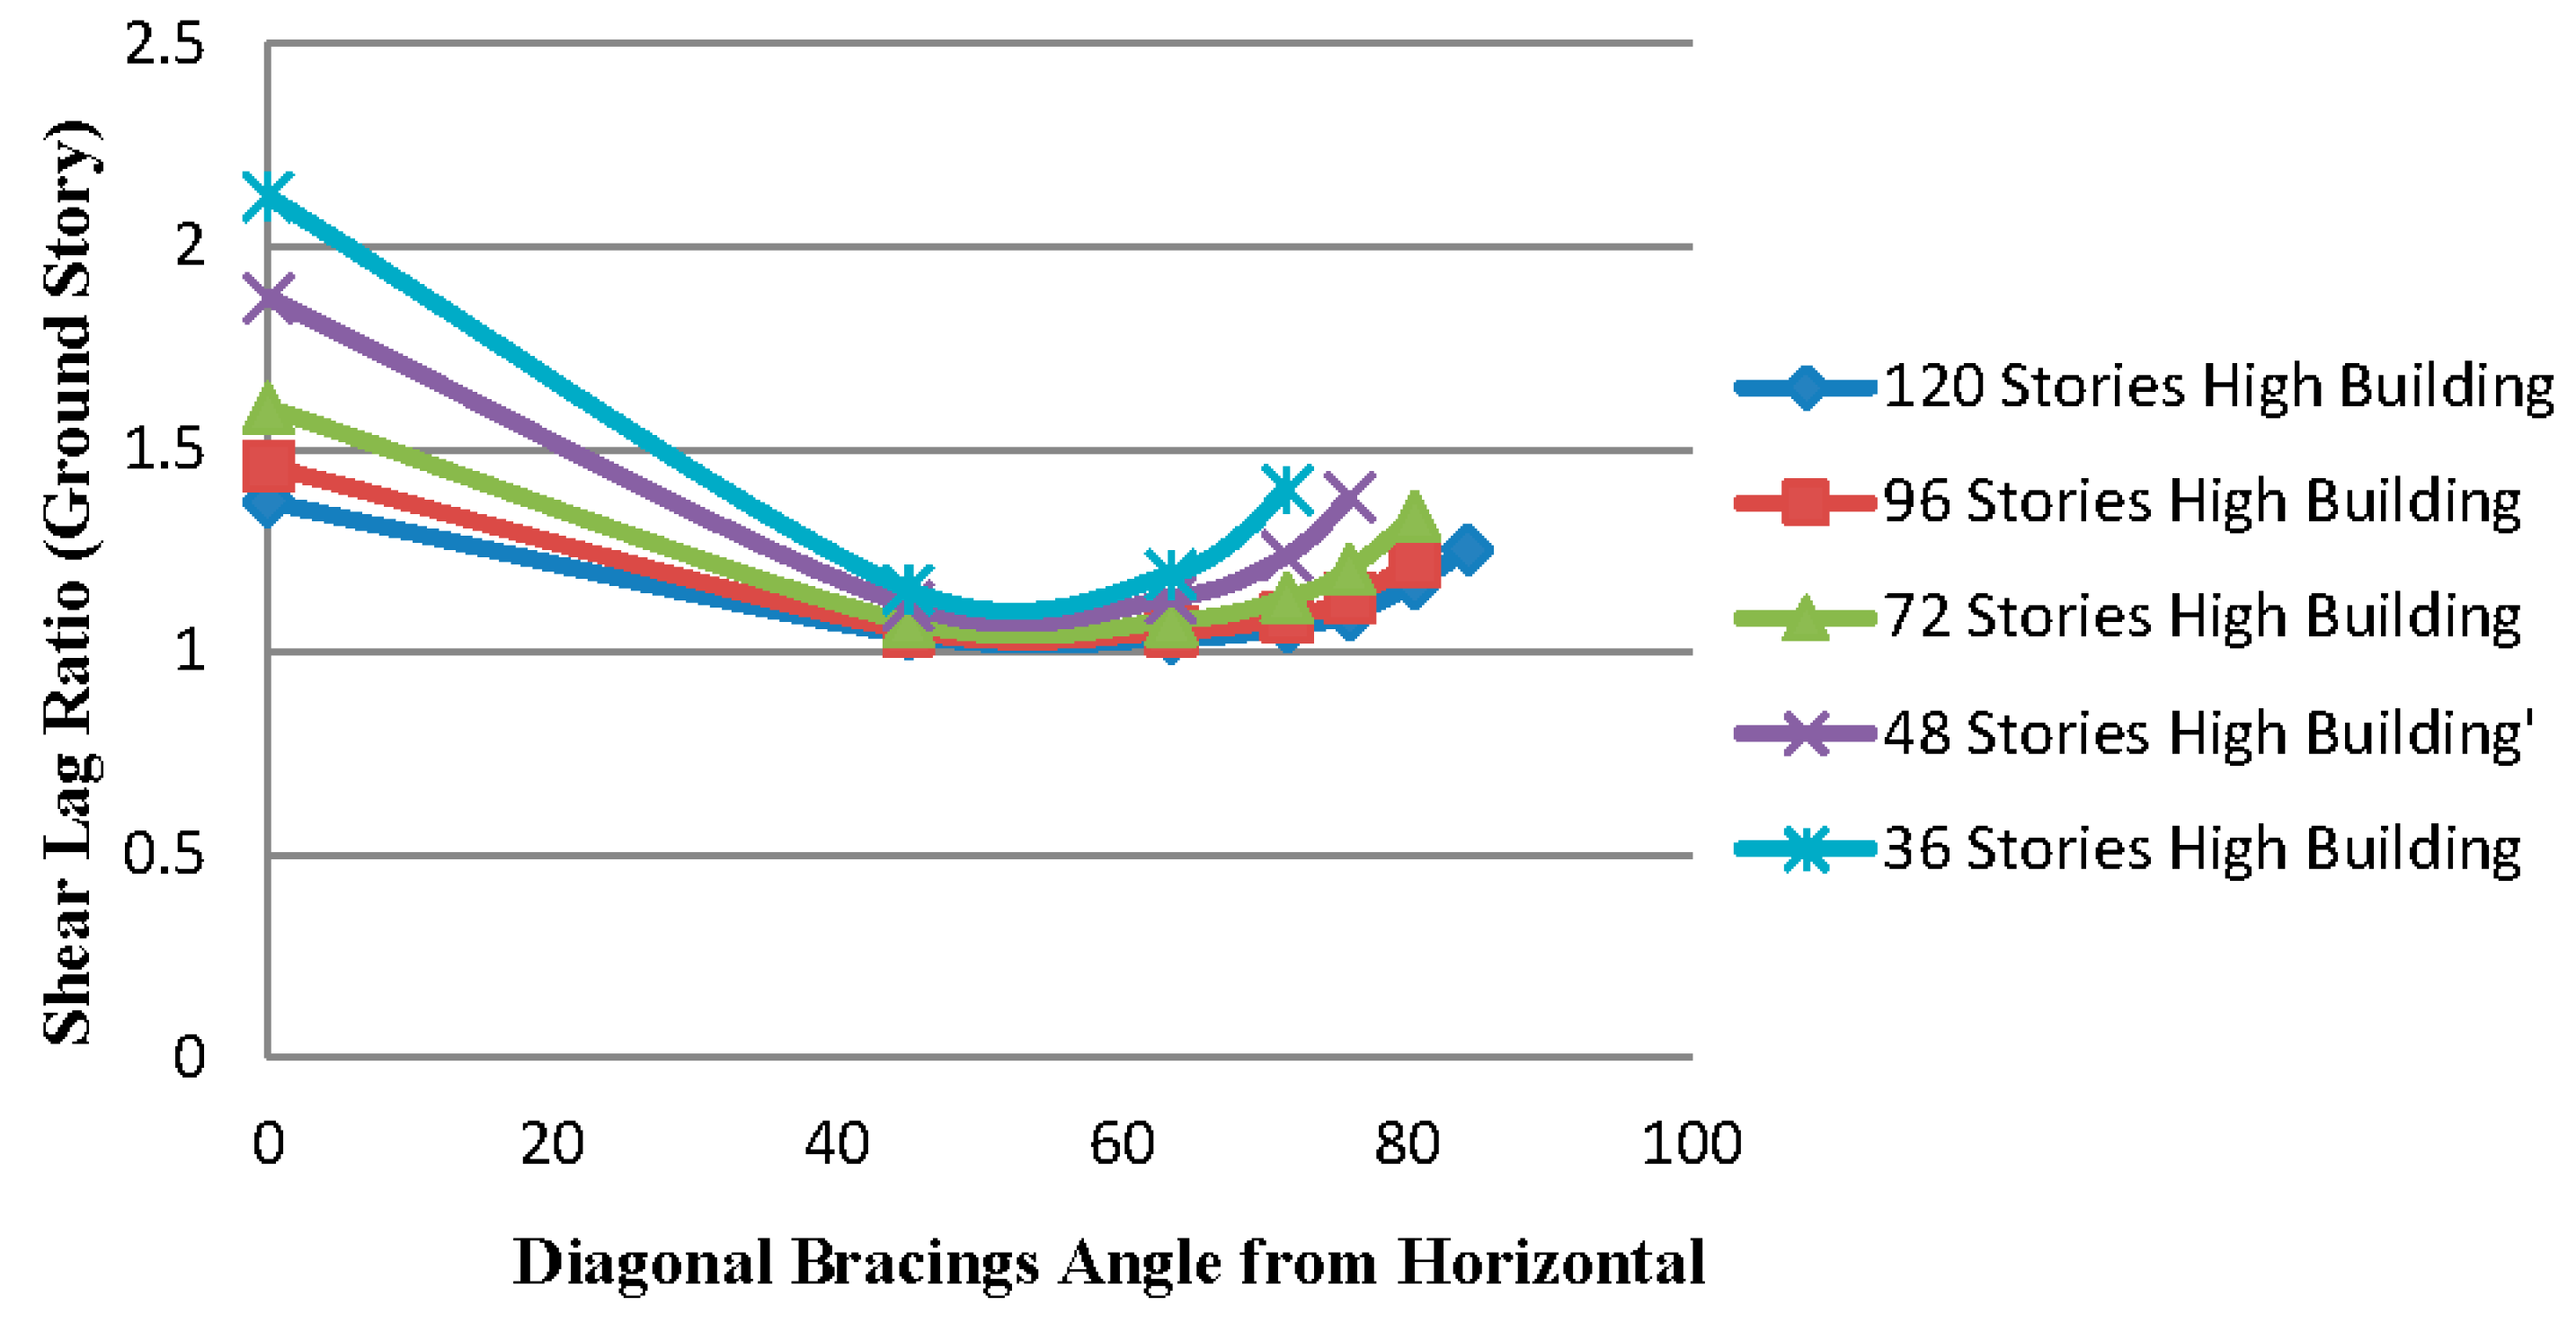
In a building, at the ground story columns, shear lag effect is most dominant and most influential because of a large magnitude of axial stresses. For further analysis and comparison purposes, shear lag ratio at ground story is considered for all heights and for all models.
9.1. Results for Buildings of Model 1
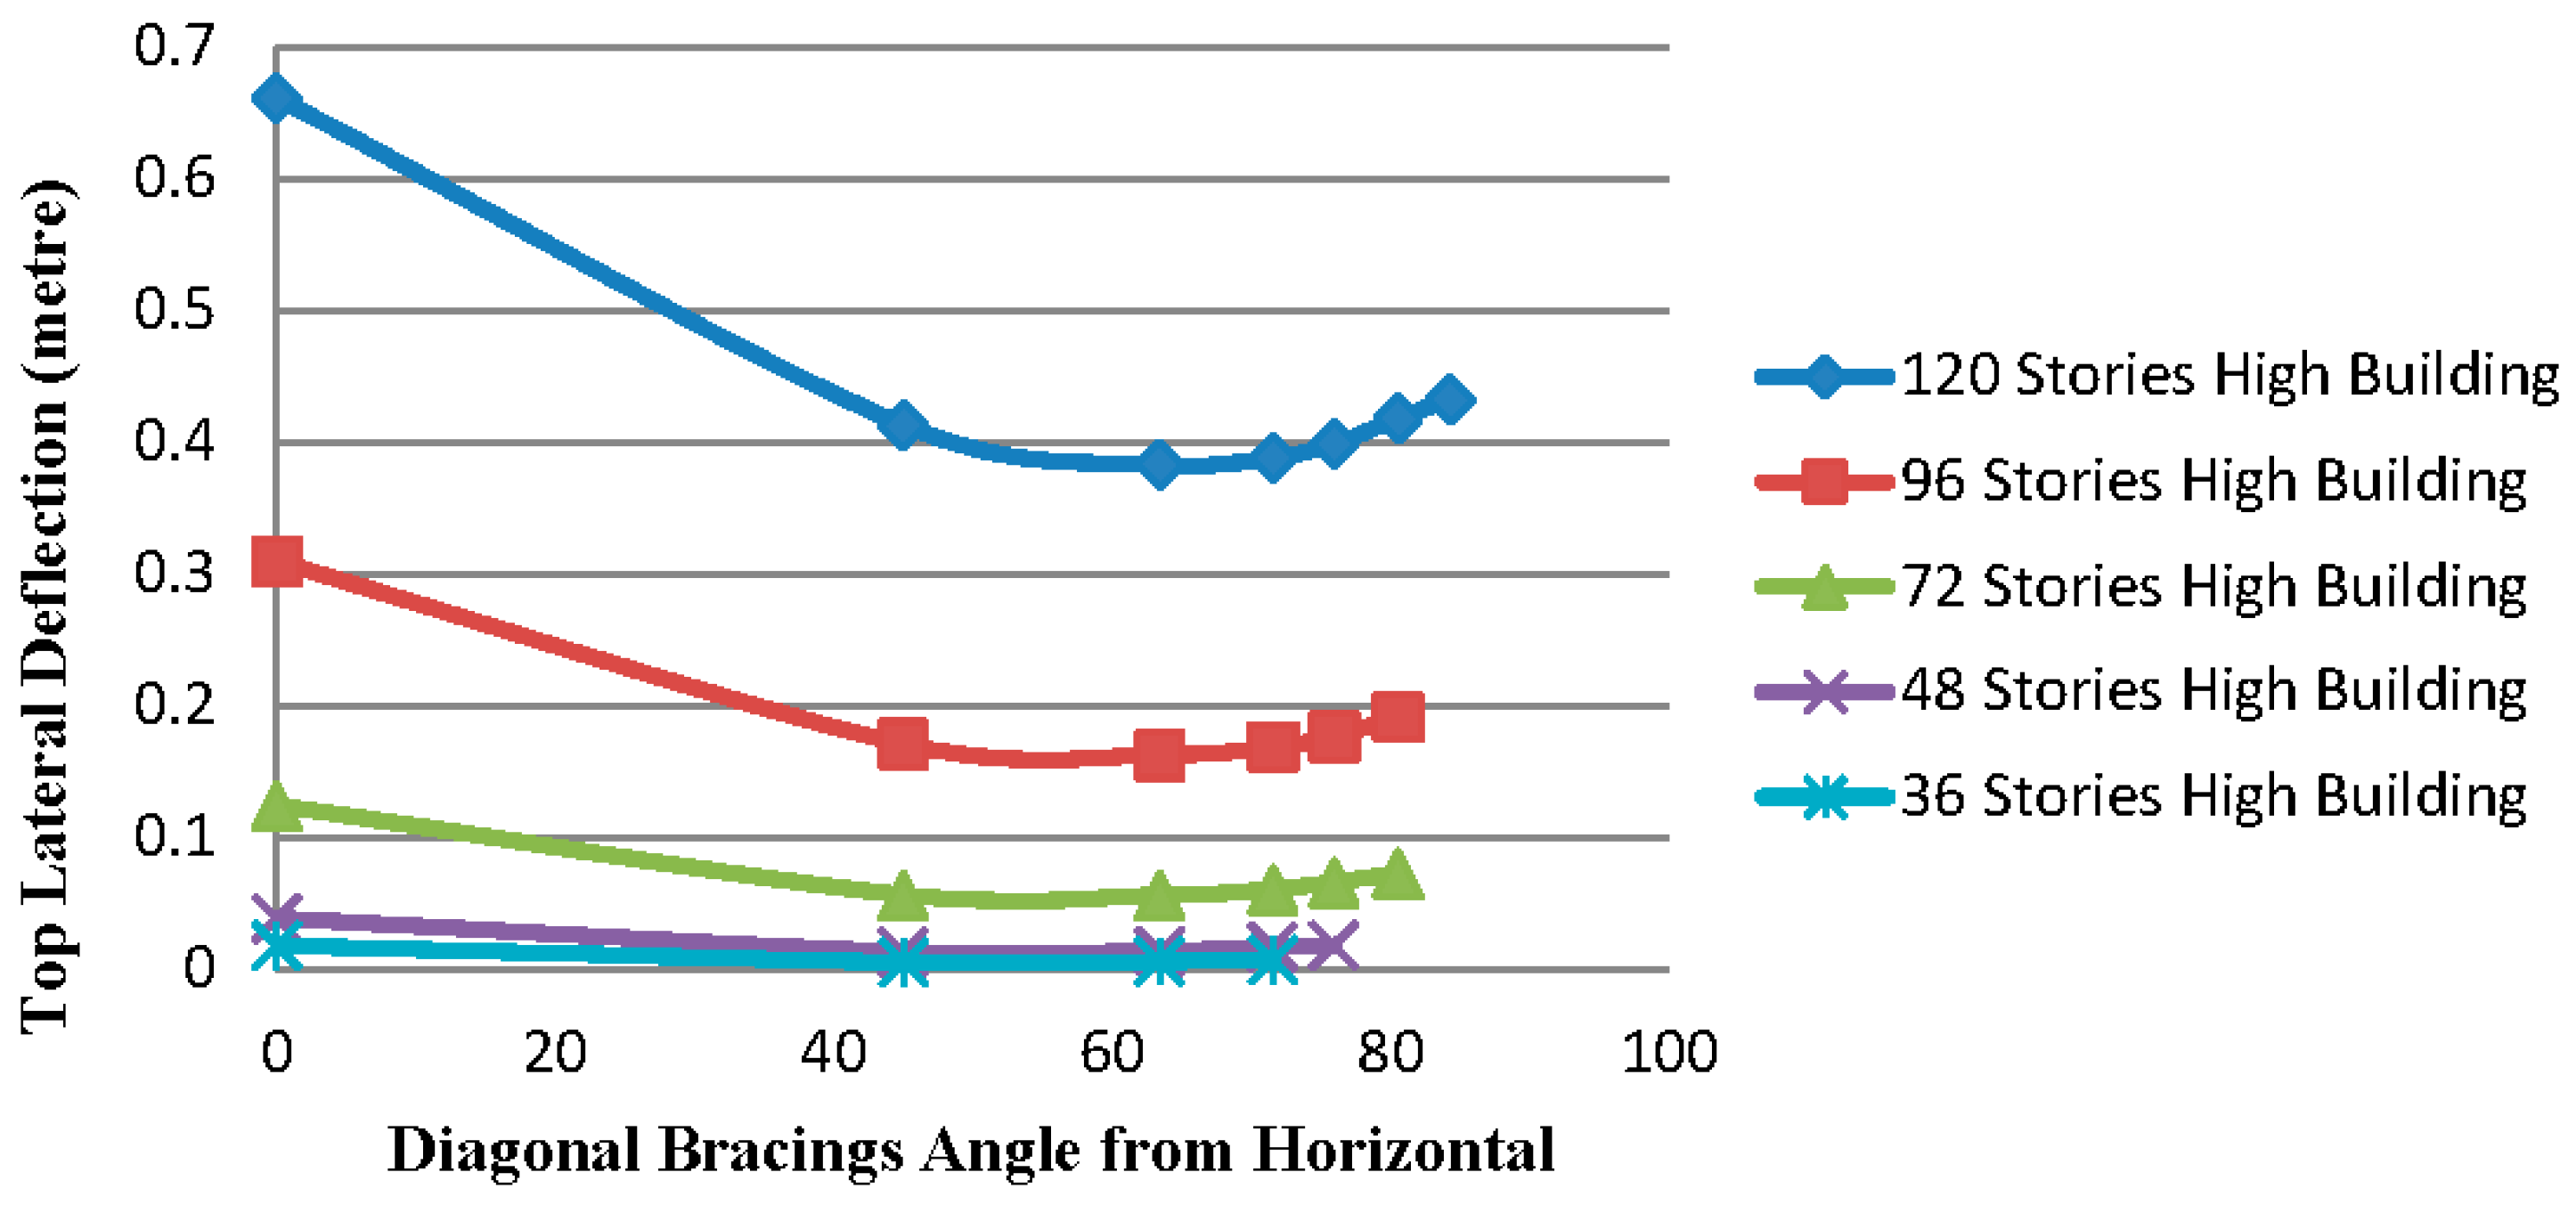
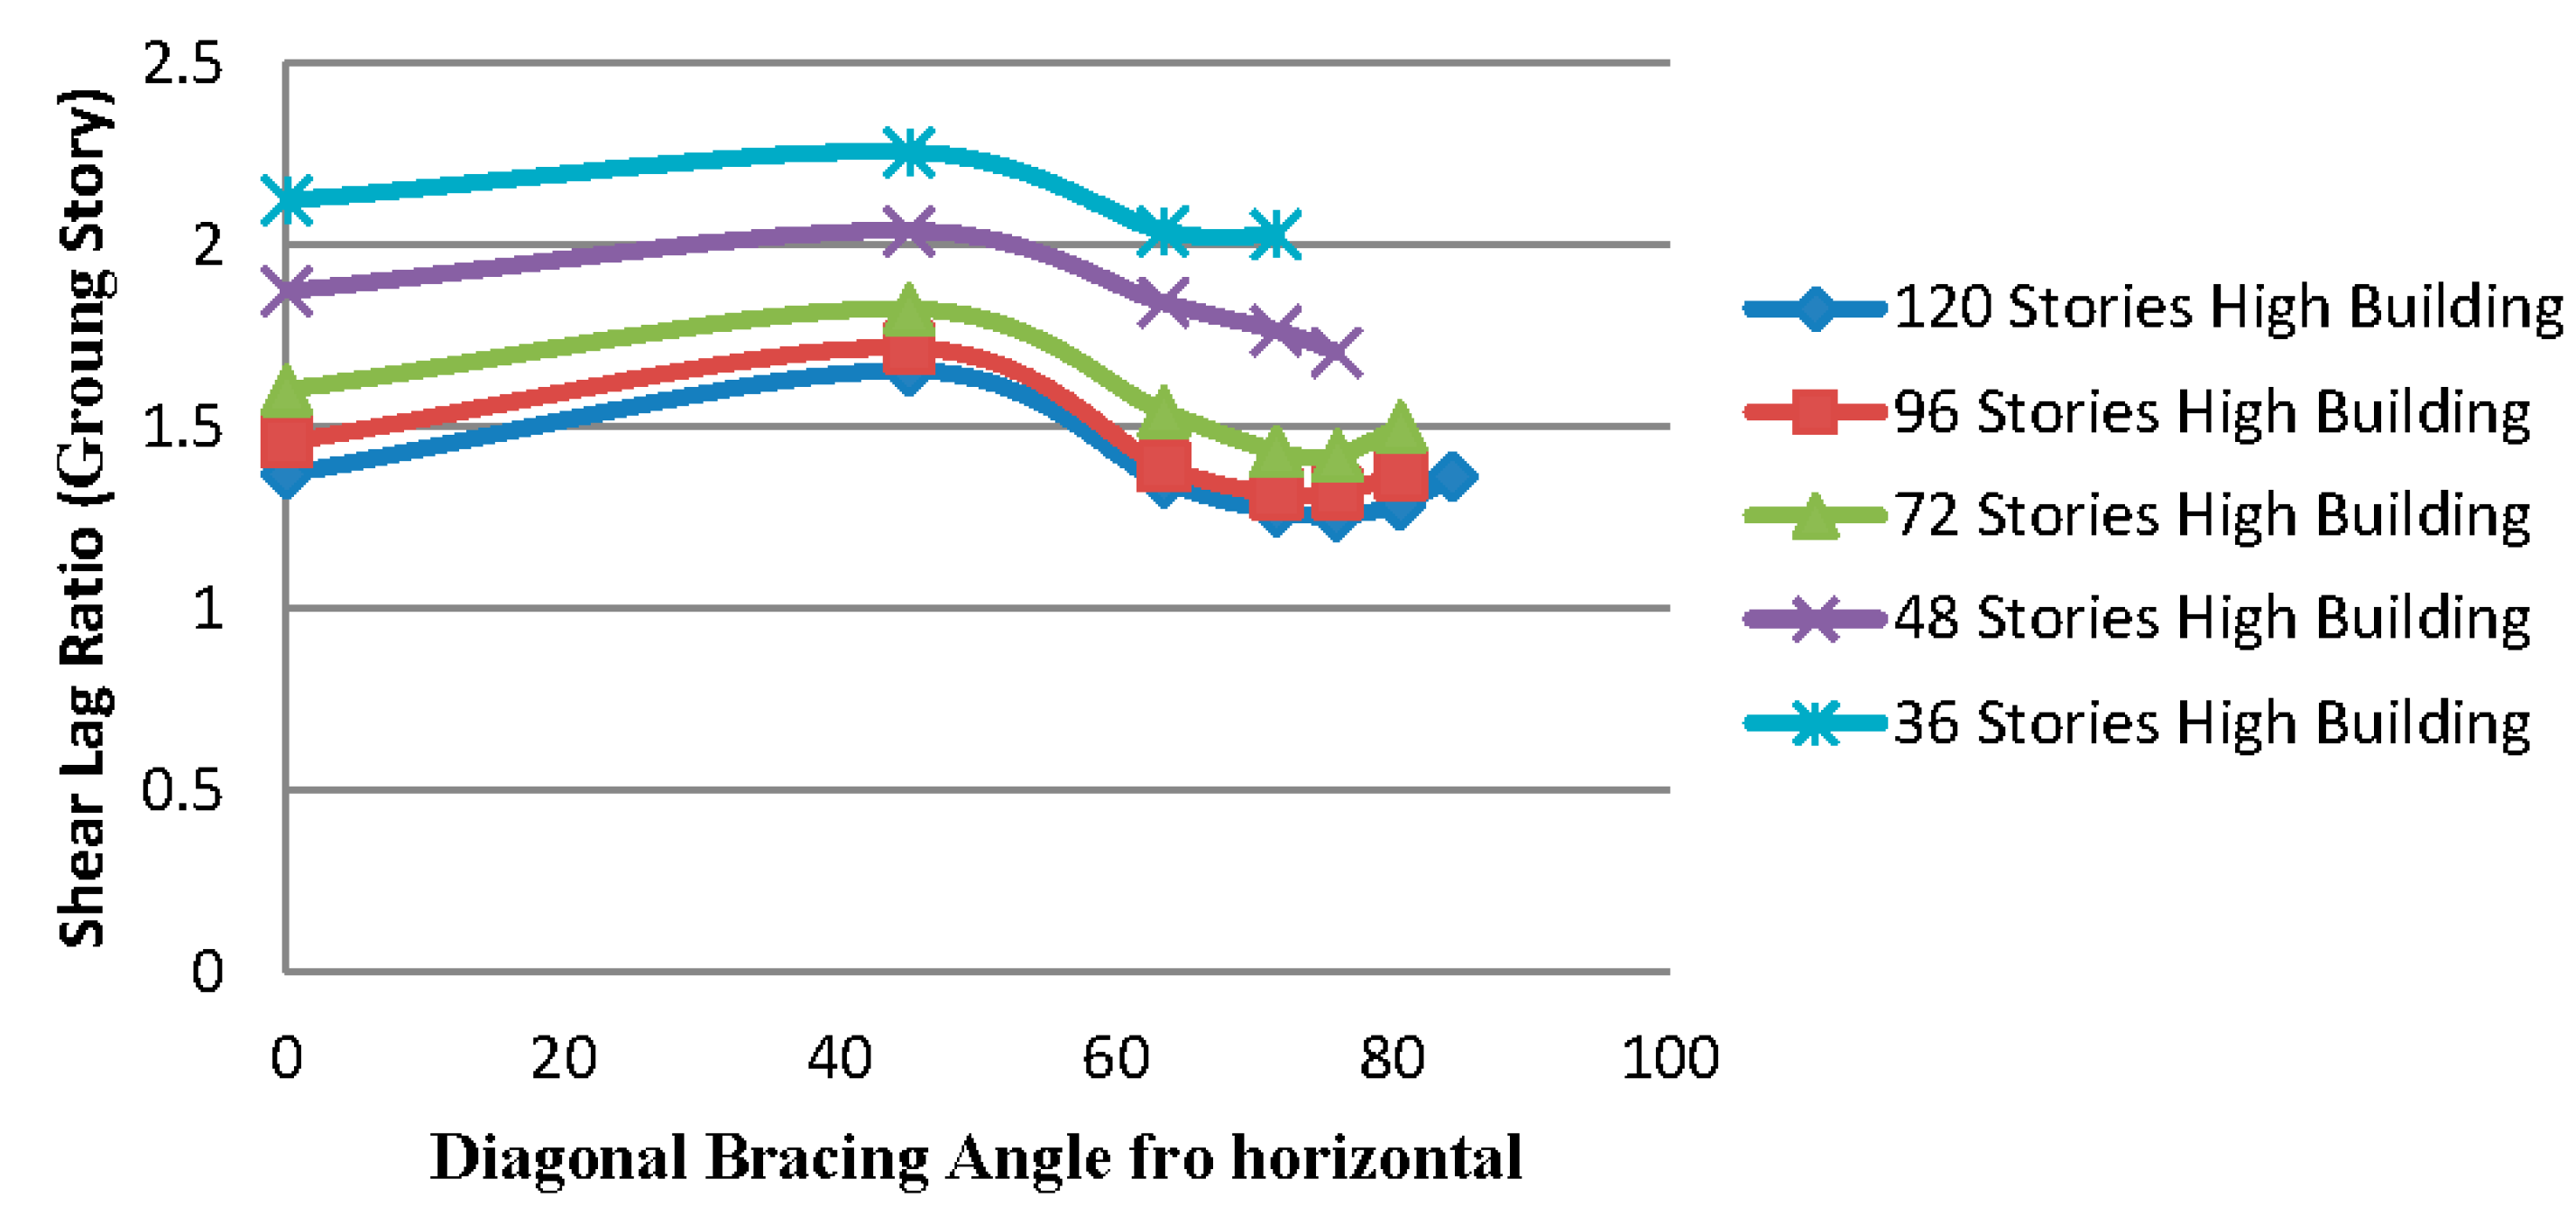
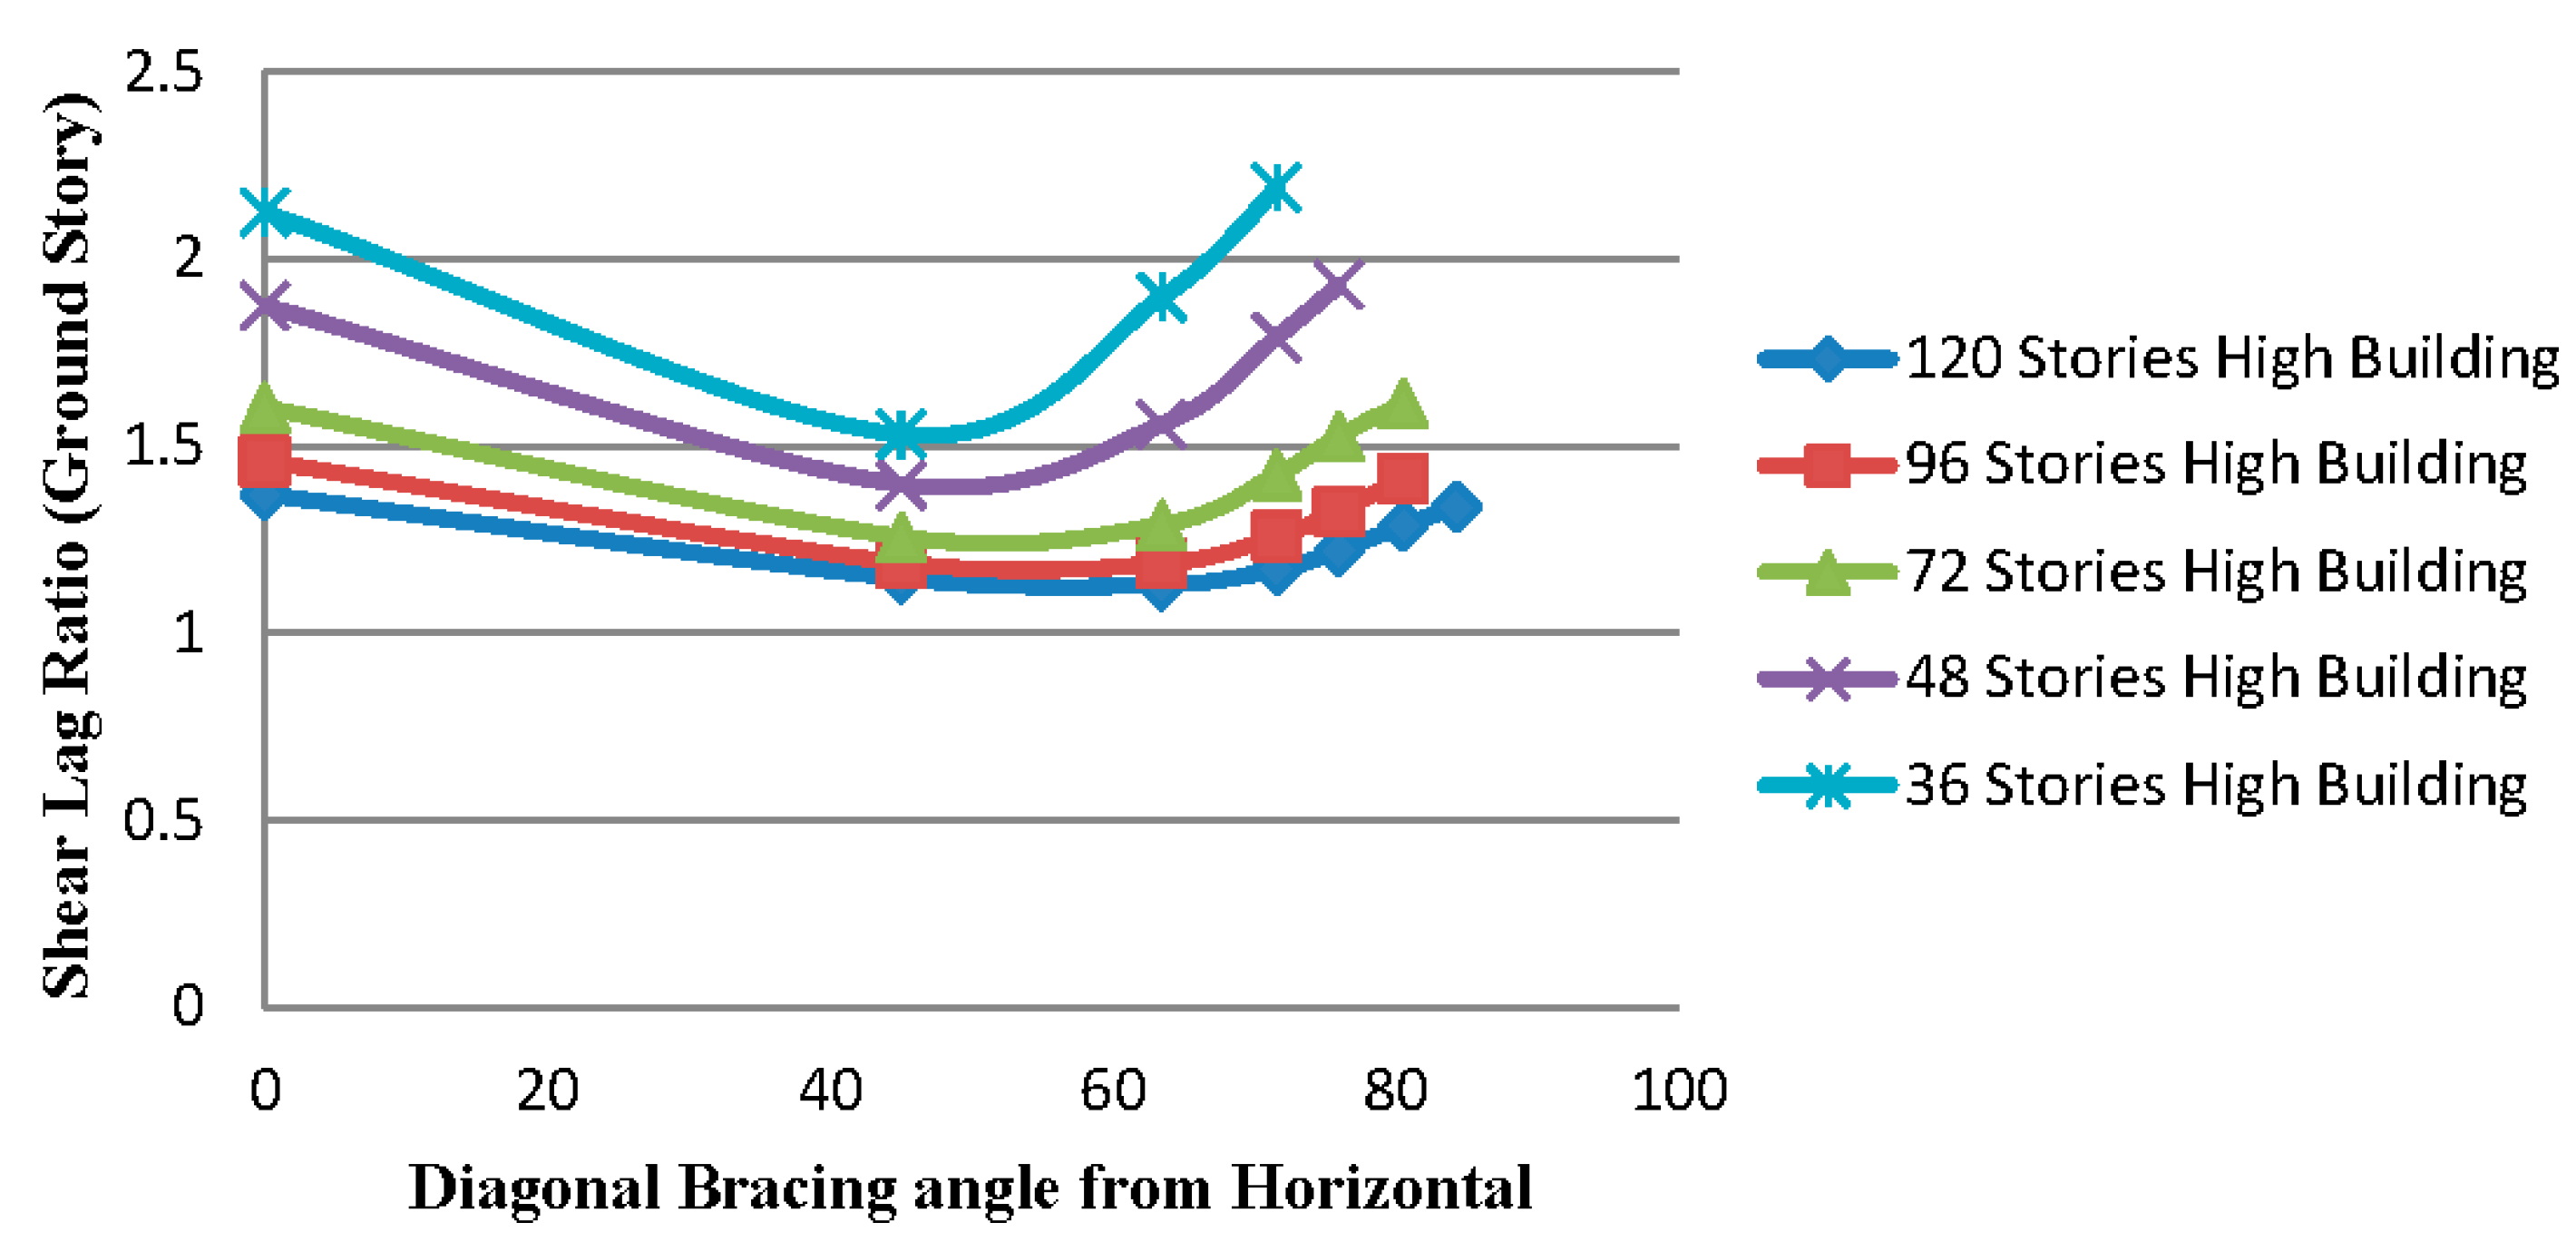
For this kind of bracing pattern, optimal angle for shear lag ratio lies between 45° and 63.43° for all heights of buildings. For 120, 96 and 72 stories high buildings, 63.43° is the optimal angle and for 84 and 36 stories high buildings, 45° is the optimal angle.
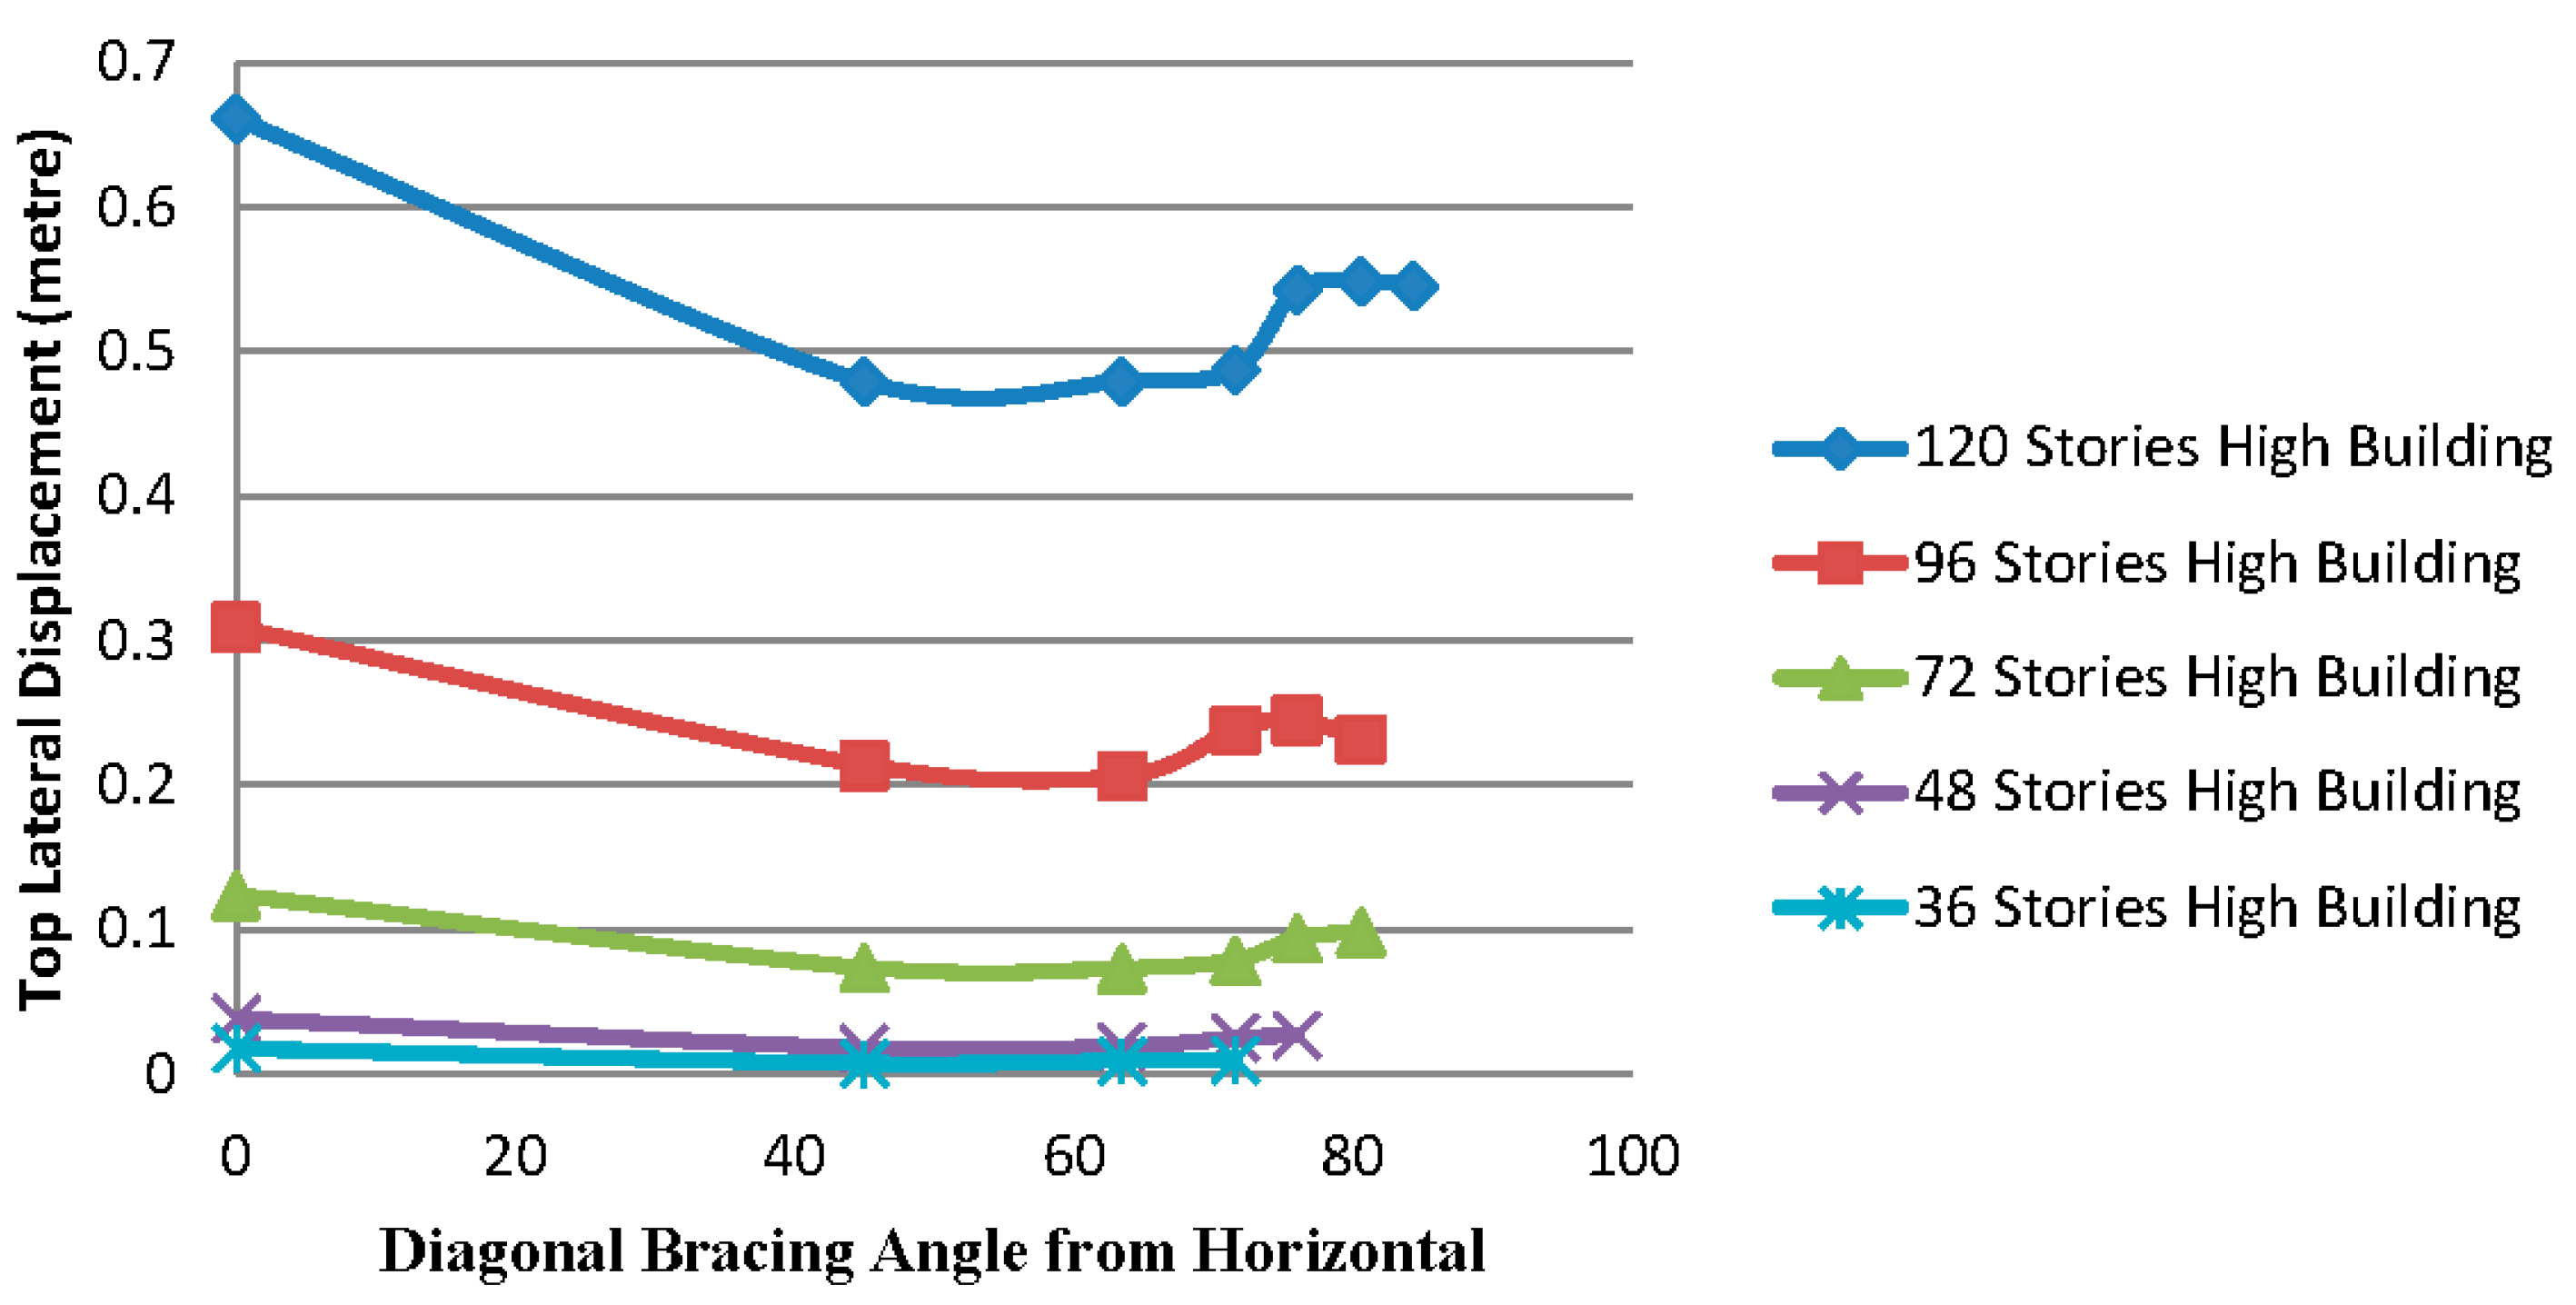
Now considering the graphs of
Figure 12 and
Figure 13 in which shear lag ratio and top lateral deflection respectively are varying
vs. the bracing angle. Comparing these variations, there seems to be an almost parallel variation among the two. It means that by providing this geometric pattern of bracing system, the building’s stiffness varies the way shear lag varies in a building.
Figure 12.
Variation of shear lag with varying angle of bracing system for buildings of Model 1.
Figure 12.
Variation of shear lag with varying angle of bracing system for buildings of Model 1.
Figure 13.
Top lateral deflection vs. varying angle of bracing system for buildings of Model 1.
Figure 13.
Top lateral deflection vs. varying angle of bracing system for buildings of Model 1.
Looking closely to the geometric pattern of this bracing, at any cross section of a panel there are two bracing members and each goes through the panel from one end to another. In this type of geometric pattern, load transfer path continues to the ground.
9.2. Results for Buildings of Model 2
In this type of bracing pattern, diagonal members do not continue through the panel and instead in the middle of it. This way, load transfer path does not continue through to the ground.
At the joint where two of the bracing members are meeting, axial load distributes among the bracing members thereby decreasing the axial force in the middle of the column. At the other end, in the corner columns, this axial force increases.
Shear lag ratio is nothing but the ratio of maximum to minimum axial stress in flange panel. This geometry has a stronger effect for shorter lengths or for small inclinations, whereas this effect decreases with increasing inclination. So, shear lag ratio is supposed to be high for small inclinations of bracing angle and is supposed to decrease as the angle of inclination increases. This variation can be observed in graphs of
Figure 14.
Figure 14.
Variation of shear lag ratio with varying angle of bracing system for buildings of Model 2.
Figure 14.
Variation of shear lag ratio with varying angle of bracing system for buildings of Model 2.
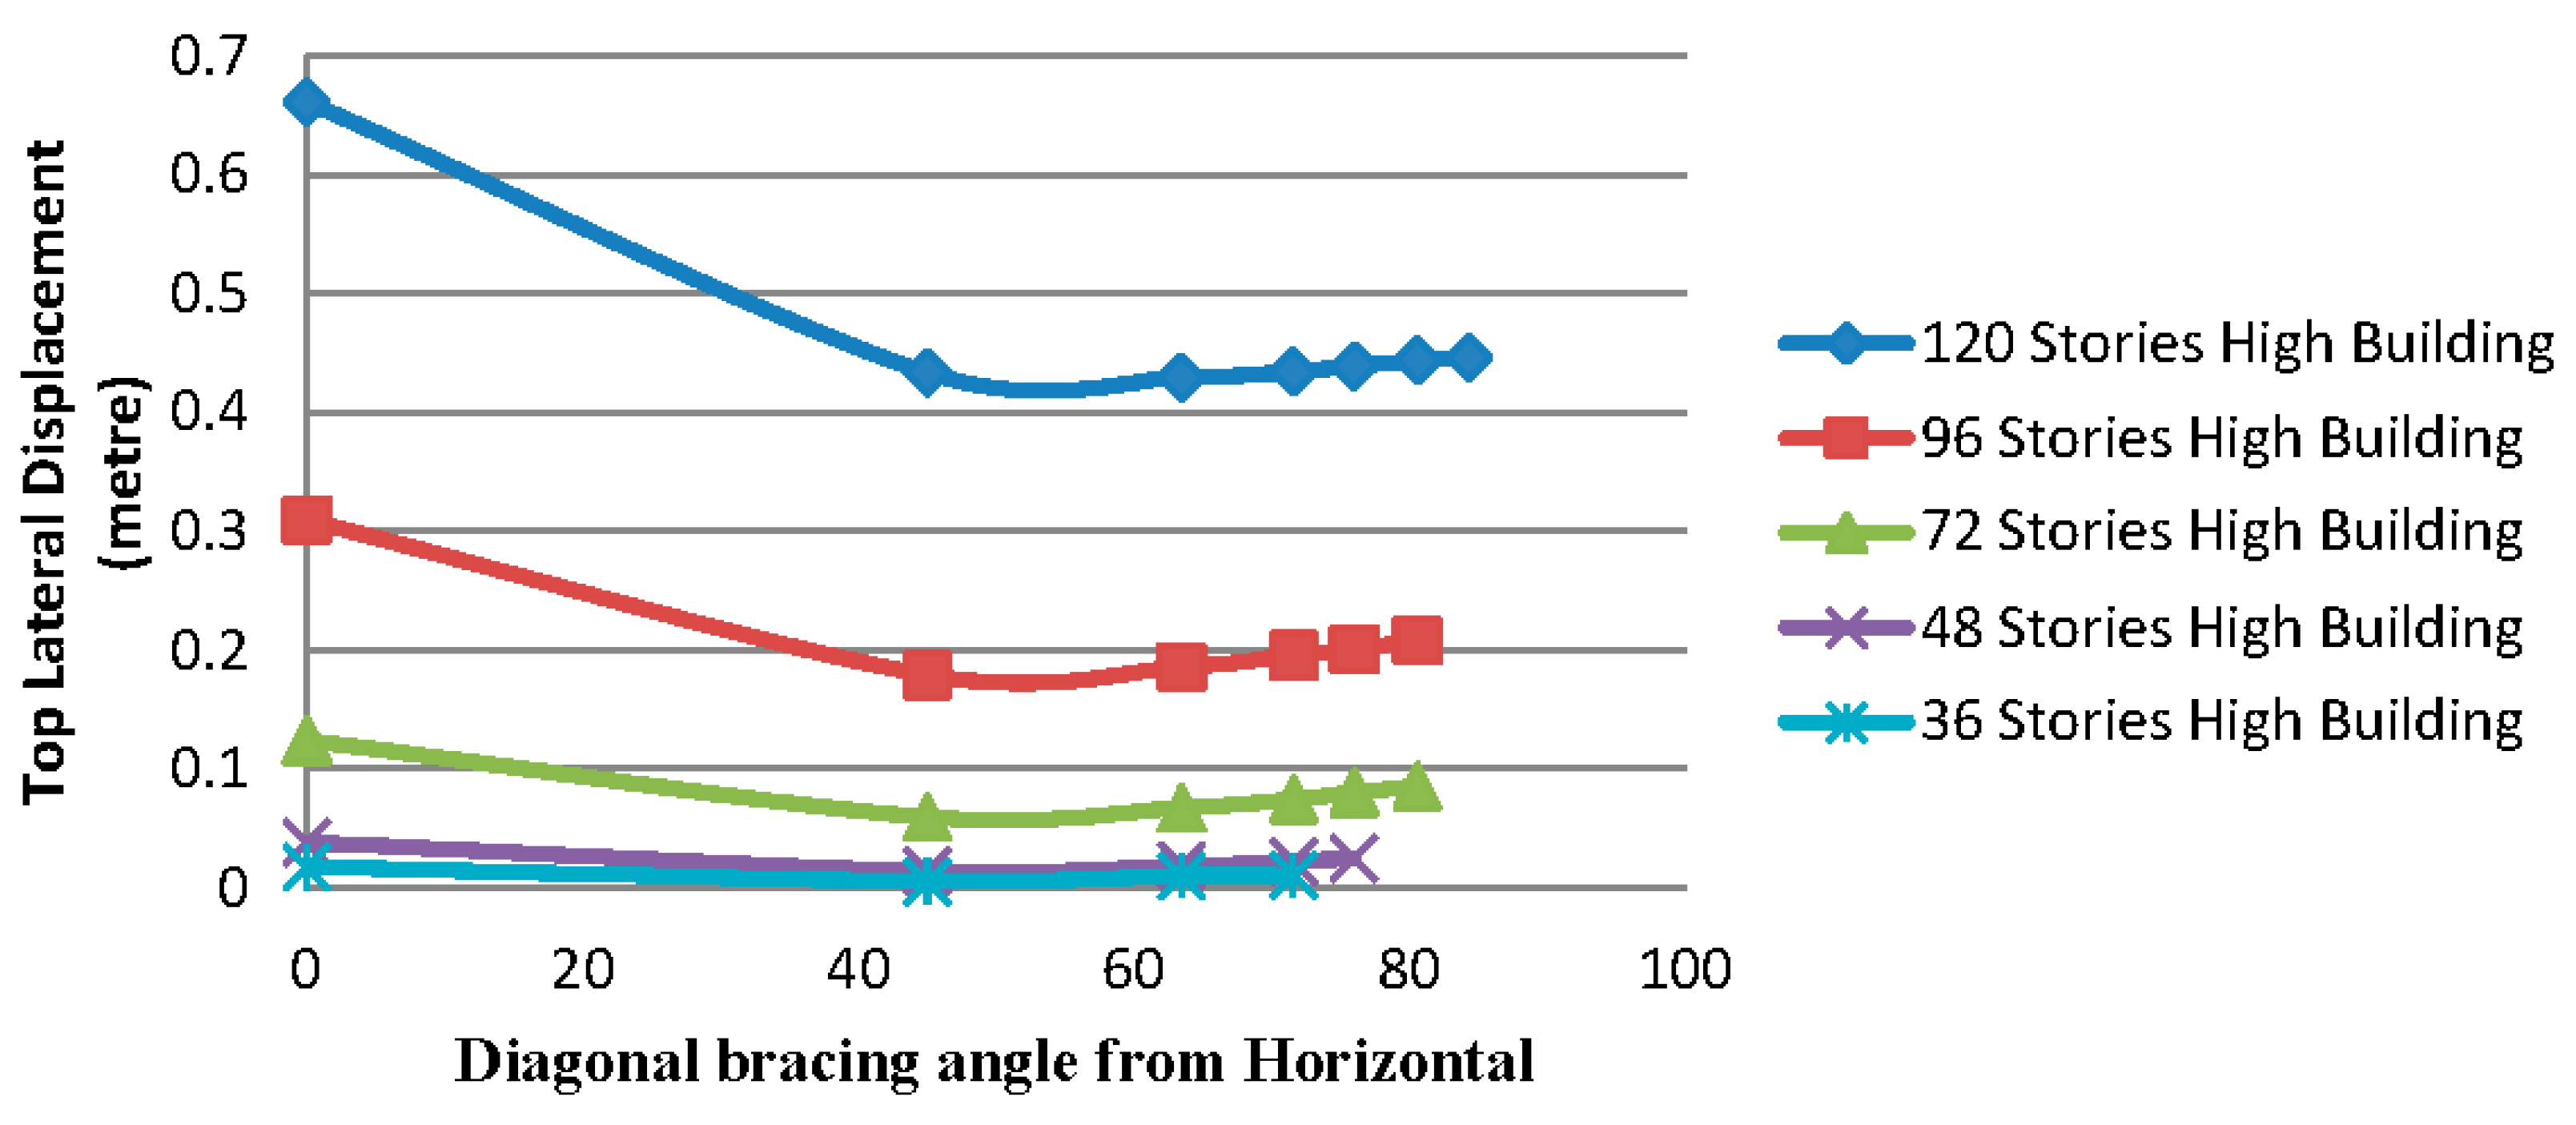
For 120 story high building, 63.43° is the optimal angle and for the other heights, 45° is the optimum angle (
Figure 15). Although, for this kind of bracing pattern, optimum angle is again between 45° and 63.43° but variation of shear lag ratio does not follow the path of building’s stiffness (
Figure 14 and
Figure 15).
Figure 15.
Top lateral deflection vs. varying angle of bracing system for buildings of Model 2.
Figure 15.
Top lateral deflection vs. varying angle of bracing system for buildings of Model 2.
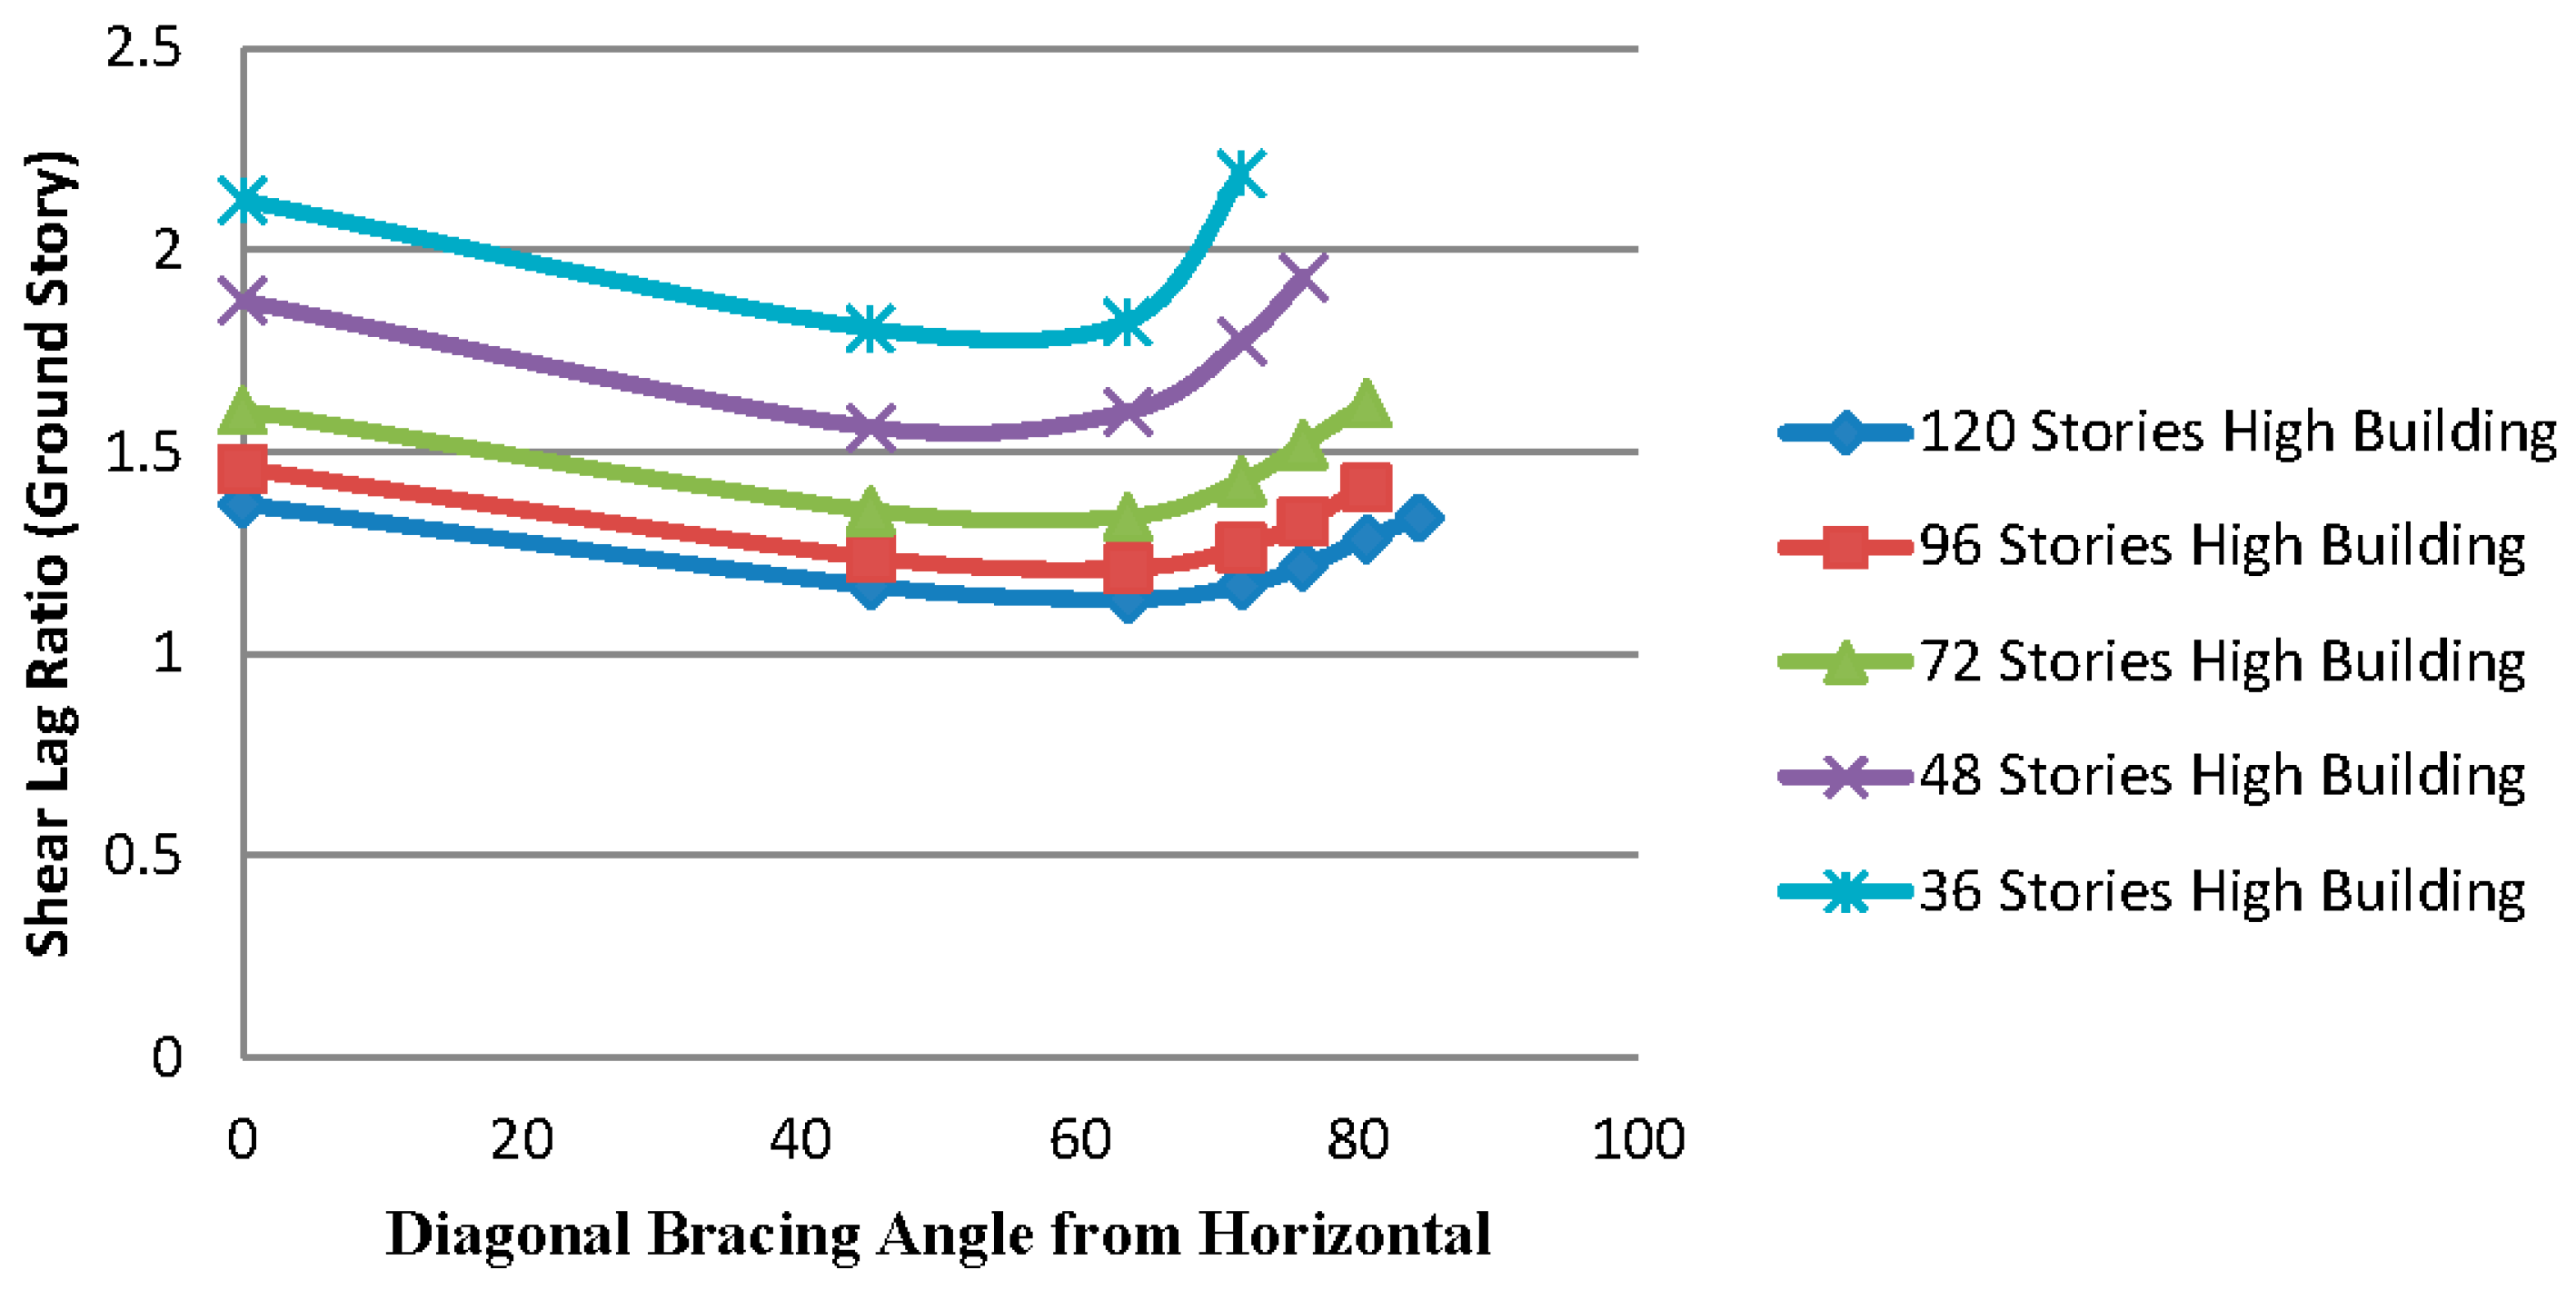
9.3. Results for Buildings of Model 3
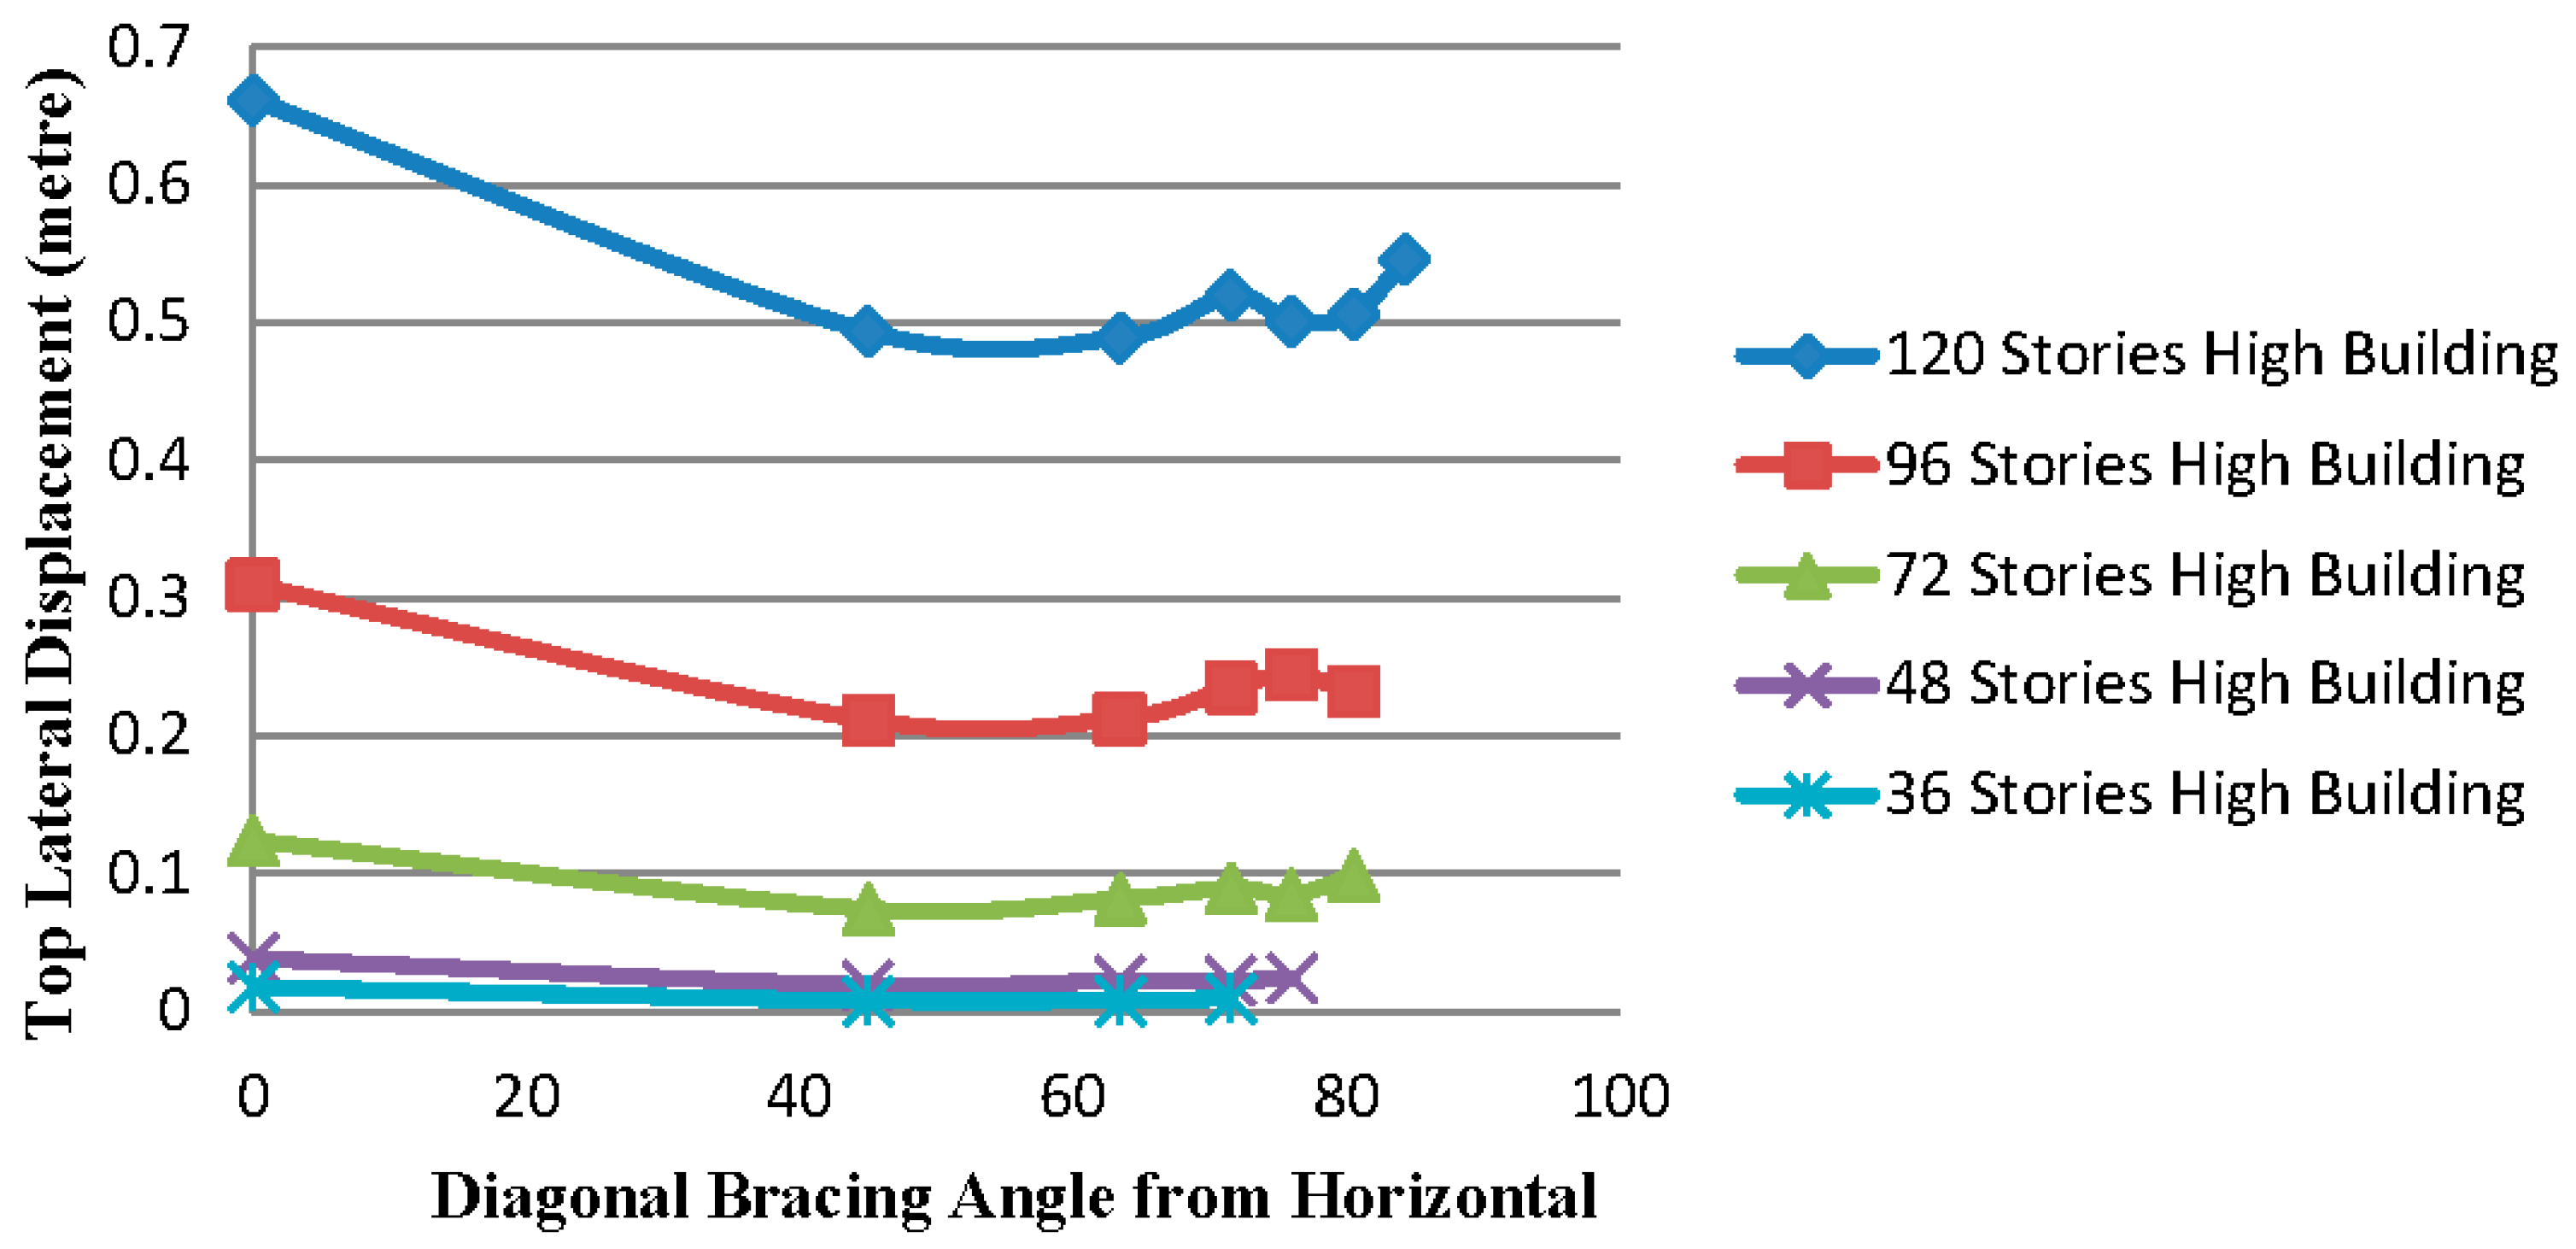
For this kind of bracing pattern, 63.43° is the optimal angle for the heights of 120 stories and for the other heights, 45° is the optimum angle of diagonal bracings (
Figure 16).
Shear lag ratio is minimum for bracing angle of 63.43° for heights of 120 and 96 stories and for the rest of the heights, 45° is the minimum angle (refer to
Figure 17).
For this kind of pattern, results show that for the bracing angle of 75.96° and higher, buildings’ stiffness is not varying in a regular path with the further increase of bracing angle. It increases once and decreases again.
Figure 16.
Top lateral deflection vs. varying angle of bracing system for buildings of Model 3.
Figure 16.
Top lateral deflection vs. varying angle of bracing system for buildings of Model 3.
Figure 17.
Variation of shear lag with varying angle of bracing system for buildings of Model 3.
Figure 17.
Variation of shear lag with varying angle of bracing system for buildings of Model 3.
9.4. Results for Buildings of Model 4
For this kind of pattern, buildings 120, 96 and 72 stories high, a 63.43° bracing angle is the optimum angle, and for 48 and 36 story high buildings, 45° is the optimal angle (
Figure 18).
Alike building Model 3, shear lag ratio is minimum for bracing angle 63.43° for heights of 120 and 96 stories and for the rest of the heights, 45° is the minimum angle (
Figure 19).
Figure 18.
Top lateral deflection vs. varying angles of bracing systems for buildings of Model 4.
Figure 18.
Top lateral deflection vs. varying angles of bracing systems for buildings of Model 4.
Figure 19.
Variation of shear lag with varying angles of bracing systems for buildings of Model 4.
Figure 19.
Variation of shear lag with varying angles of bracing systems for buildings of Model 4.
It can also be observed in the graphs of
Figure 18 that, beyond a bracing angle of 63.43°, variations in stiffness of buildings follows a sporadic path.
10. Conclusions
Looking closely at the results of all building models together, except for building Model 2, all buildings of whatever height, bracing angle between 45° and 63.43° is the critical variation which is giving the least value of lateral deflection as well as of shear lag ratio. For building Model 2, shear lag ratio is not minimal in this variation only.
It is found that for all building models, bracing angle of 63.43° is showing the least lateral deflection for 120-story high building and for 48 and 36 stories high buildings, least top lateral deflection is achieved for the bracing angle of 45° for all heights. For the heights between 120 and 48 stories, least lateral deflection is fluctuating among the values 63.43° and 45° for all models.
Again, building Models 1 and 2 have two bracing elements in a cross section of any panel whereas Models 3 and 4 have only one bracing element in a panel. Therefore, for a material saving design perspective, it is not possible to compare all four models together but can be done separately.
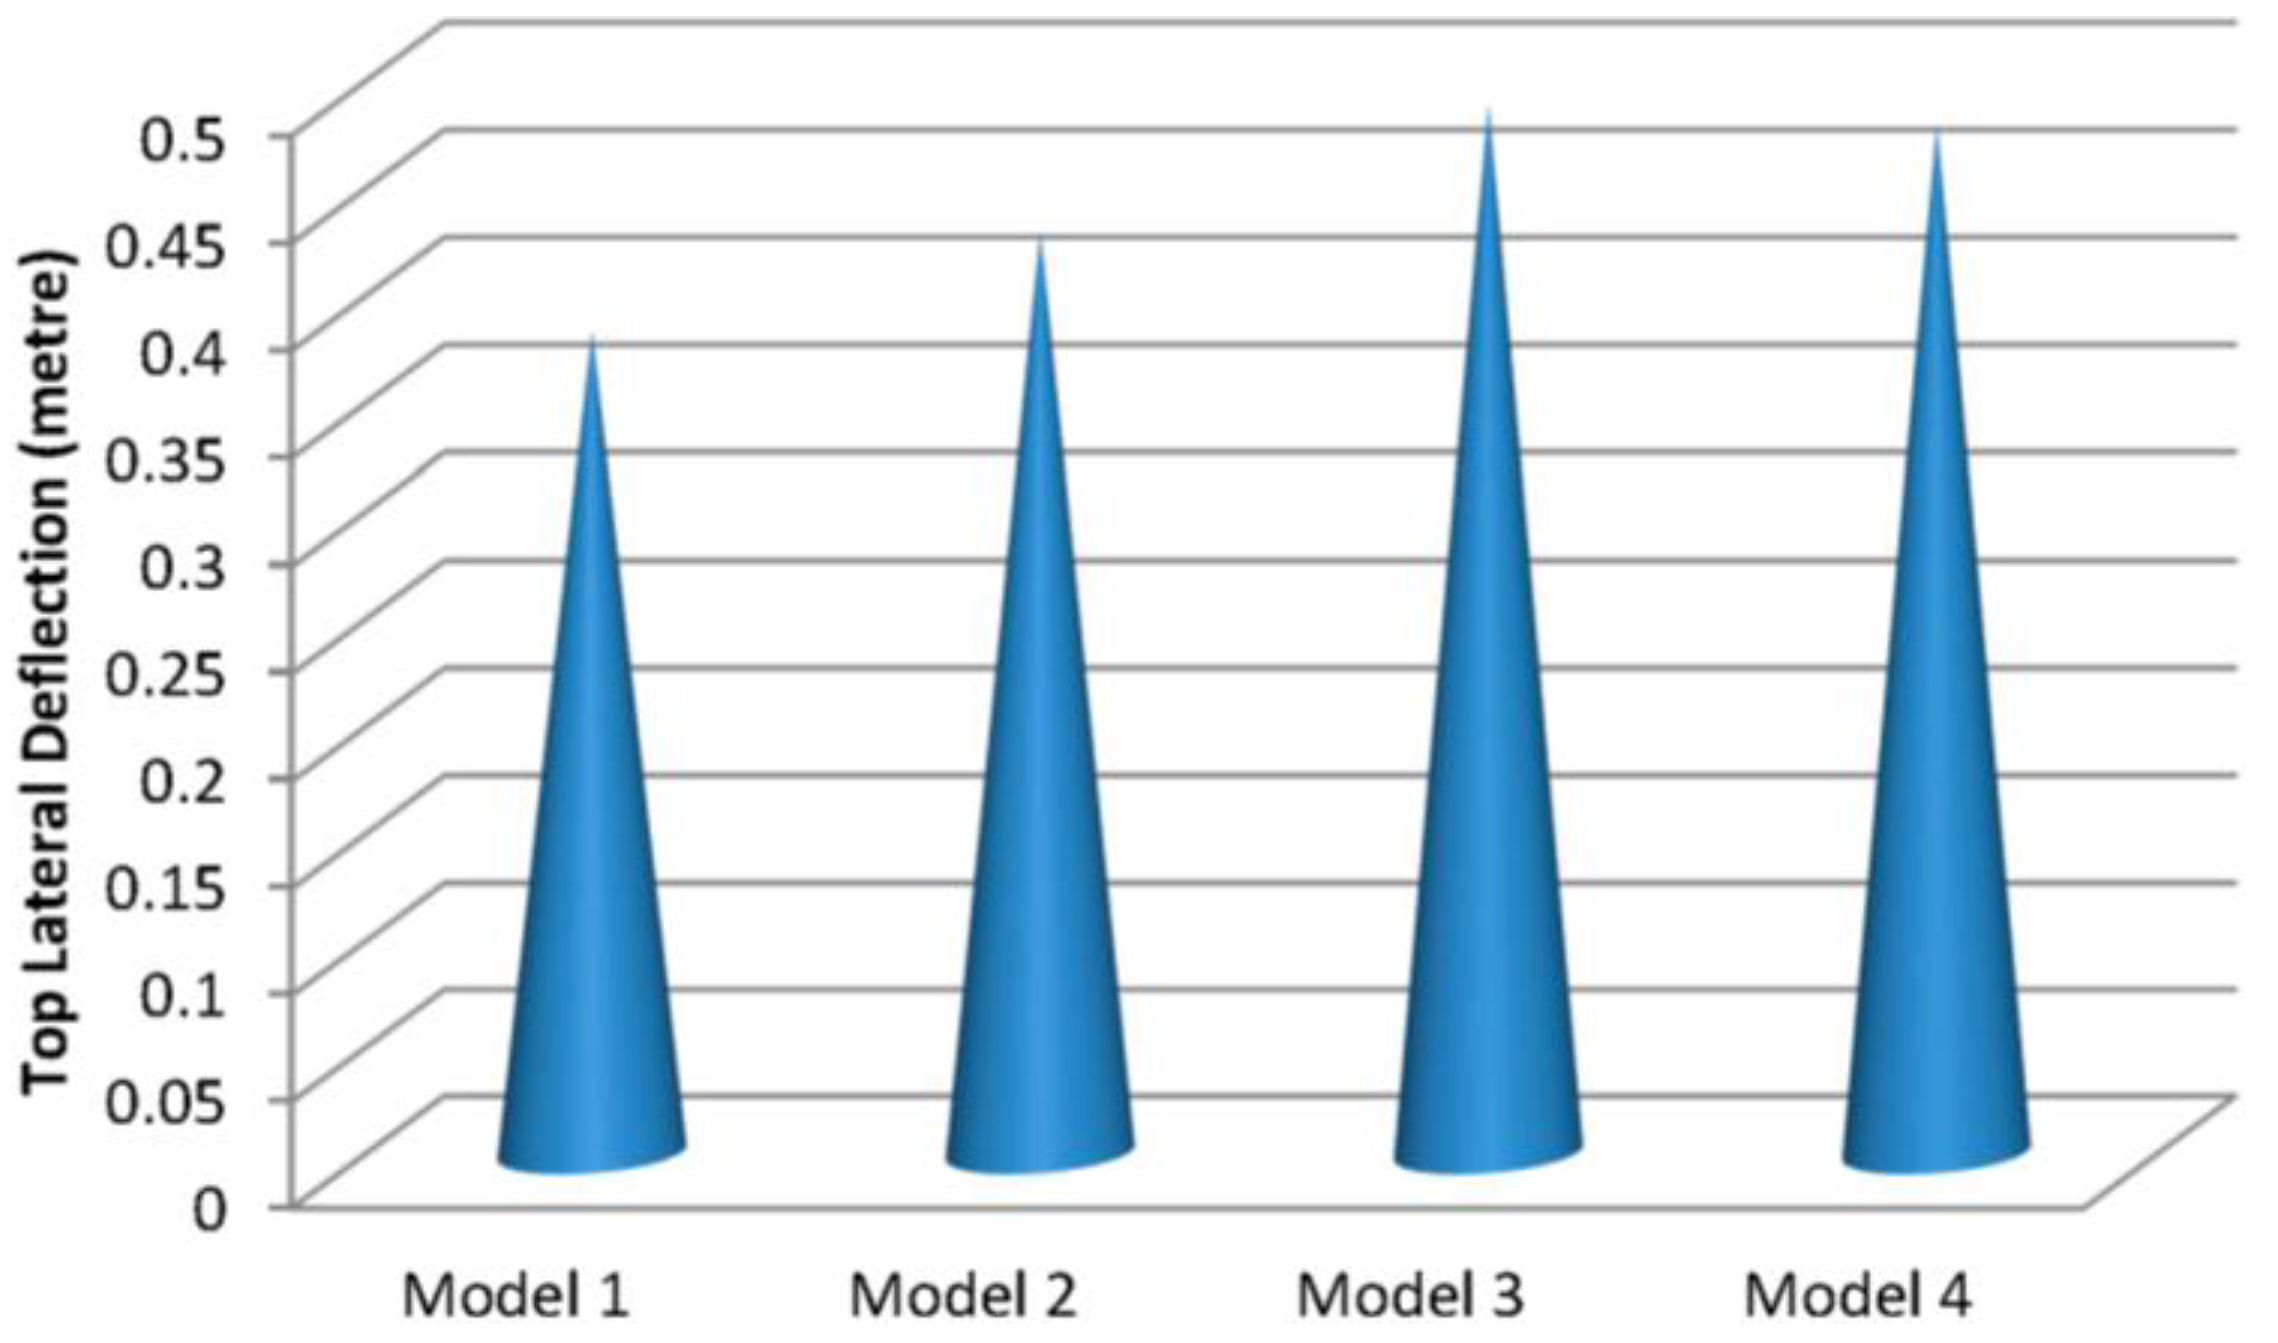
Among all models, the lateral deflection of 120-story high buildings with bracing angle of 63.43° is taken and compared (
Figure 20). It can be concluded with this comparison that the bracing pattern of building Model 1 is the best selection among Models 1 and 2 and building Model 4 is best selection among Models 3 and 4.
Among all building models, it is found that for buildings of Model 1, shear lag varies in line with variations in a building’s stiffness. Although providing other configurations of bracing in a building does not seem to have a negative effect, the bracing configuration of Model 1 was found to be the best selection among all models.
Figure 20.
Top lateral deflection of buildings 120 stories high with bracing angle of 63.43° for all models.
Figure 20.
Top lateral deflection of buildings 120 stories high with bracing angle of 63.43° for all models.


