Article

Impact of Electronic Waste Glass on the Properties of Cementitious Materials

by
Jurgita Malaiškienė
* and
Karolina Bekerė
Laboratory of Composite Materials, Institute of Building Materials, Vilnius Gediminas Technical University, 10223 Vilnius, Lithuania
*
Author to whom correspondence should be addressed.
Buildings 2024, 14(5), 1218; https://doi.org/10.3390/buildings14051218
Submission received: 28 March 2024 / Revised: 11 April 2024 / Accepted: 20 April 2024 / Published: 25 April 2024
(This article belongs to the Special Issue Study on Concrete Structures)

Abstract

:
The article analyses the impact of two different types of dispersive glass on cement hydration and compressive strength at 7 and 28 days. The study employed dispersive glass from various LCDs (TV sets, computer monitors, smart phones), characterised by a composition of approximately 8% SrO, and dispersive glass from washing machines, which consists mainly of SiO2, Na2O, and CaO. The chemical composition and particle-size distribution of different types of dispersive glass were analysed. The study compares the effect of electronic waste glass on cement hydration by evaluating the amount and rate of heat released during the process. In addition, the results of X-ray diffraction (XRD), thermogravimetric analysis (TG), and scanning electron microscopy (SEM) are provided. Different types of glass were determined to have a similar effect on the physical and mechanical properties as well as the mineral composition of cementitious samples: density and UPV decrease up to 6% and compressive strength decreases by about 30%, when 5–20% of cement was replaced by glass waste. However, more prominent differences were observed in the workability of the mixtures: the waste glass from home appliances increased the spread by up to 25%, while the waste glass from electronic devices decreased the spread compared to the reference sample by approximately 20%. The mixtures modified with the waste glass of electronic devices had a higher degree of early hydration (96%) due to the higher water absorption of the mixtures compared to the waste glass of home appliances (88%).

1. Introduction

The rapid development of industry and technological change in the last decades along with increasing consumerism result in a growing amount of obsolete electronic devices and household appliances [1,2,3]. Liquid crystal glass from the displays of electronic devices contains a variety of chemical elements that may have toxic effects on the environment [2,4]. The possibilities of recycling LCD glass and other types of waste glass are researched in order to reduce environmental pollution. The construction industry, being one of the largest industries in the world [5,6,7], has a great potential for recycling electronic waste glass. Crushed glass waste can be mixed with cementitious materials to reduce the need for cement or natural aggregates and also improve the properties of mortar or concrete [8,9]. Glass waste can come from a wide range of electronic devices (LCD), household appliances, the food packaging industry, or old buildings [10]. Different types of glass are of different chemical composition. Glass that is not suitable for recycling must be sorted and stored separately in landfills [11].
Researchers Islam et al., 2017 [12] identified the chemical composition of container glass, which mainly consists of 68% SiO2, 14.5% CaO and 12.2% Na2O, and lower amounts of BaO and other elements. The chemical analysis of LCD glass showed that it may contain approx. 65% of organic compounds, approx. 25% SiO2, 5–10% Al2O3, 3% CaO, and other elements, such as arsenic, zinc, strontium, barium, phosphorus, potassium, iron, titanium, and copper [13]. Kim and Yang, 2021 [14] found that organic-free LCD glass contains approx. 61% SiO2 and that the total amount of SiO2, Al2O3, and Fe2O3 is more than 85%. This composition meets the ASTM C618 [15] requirements for pozzolanic materials (SiO2 + Al2O3 + Fe2O3 > 70%). Jiang et al., 2022 and Nassar and Soroushian, 2012 [16,17] studied ordinary container glass (soda-lime glass), which mainly contains 11.8% CaO and 72.7% SiO2, while the sum of oxides SiO2, Al2O3, Fe2O3 in the chemical composition amounts to 85.3%.
The analysis of the mineral composition of LCD glass revealed a wide hall between 15° and 35° of 2θ, indicating the existence of amorphous phases [13,14] in this type of glass, as in many other types of glass, e.g., automotive and building glazing [18]. The higher pozzolanic activity of glass, which causes the formation of a higher amount of calcium hydrosilicates (CSH) in cement reactions [19], can be related to the amorphous crystal phases identified in the XRD curves. The XRD analysis of LED glass showed the existence of crystal components, such as SiC and SiO2, in the form of quartz, in addition to the amorphous phase at 18°–28° [20].
The analysis of the possibilities of using waste glass of different chemical and mineral composition in cement-based materials revealed two lines of experimental research: (1) substitution of cement with dispersive glass and (2) substitution of fine aggregate with crushed glass. When 10% and 20% of cement in concrete is replaced with LCD glass having an average particle size of 13.1 µm, the early compressive strength of the concrete decreases by 17%. However, at 28 days, the compressive strength of the samples modified with LCD glass was 6% higher [21]. The increase in strength after longer curing is explained by the ability of LCD glass particles with silica bonds to form a denser microstructure during the pozzolanic reaction with portlandite (CH) and to build a higher amount of CSH gel, which increases strength during the later phase of hydration [22]. It was also found that 10% of glass makes the mortar structure denser due to the higher amount of CSH formed. As a result, modified cement-based materials gain better resistance to chemical attacks. According to the findings of [19], LCD glass (average particle sizes of 11 µm and 37 µm) can increase the freeze–thaw resistance of concrete and also increases the resistance to carbonation and sulphate corrosion. LCD glass with an average particle size below 45 µm, added to the mix at 5% by weight of cement, reduces the chloride diffusion and water absorption by 35%. The alkali–silica reaction (ASR) test at 14 days showed that the reference sample expanded by 0.16%, whereas the expansion of the samples modified with 20% glass was reduced to 0.05% [23].
Kim et al., 2017 [21] analysed the effect of LCD glass (particle size LGP5-FM = 4.46; LGP12-FM = 2.73) on the physical and mechanical properties of concrete. Samples were dried at higher temperatures of from 80–120 °C in order to boost the activity of alkaline materials. The strength tests showed that at the early drying phase of 3 days, the modified samples with 15% and 20% LGP12 glass had a compressive strength 4.9% and 8.2%, respectively, lower than the reference sample, while all other samples had a slightly higher compressive strength. In later stages of drying, all samples modified with LCD glass had a higher compressive strength compared to the reference sample. The best results of compressive strength at 28 days were obtained from the sample in which 10% of cement was replaced with LGP5 glass; the compressive strength was 15.7% higher compared to the reference sample. LGP5 5% and LGP12 10% had similar strength values. The tensile strength tests showed that all samples modified with LCD glass had higher strength values than the reference sample. Similar results were obtained by other researchers [23], who replaced 5% of cement with glass. They recorded 20%, 28%, and 36% higher tensile strength compared to the reference sample (without LCD glass) after 7, 28, and 56 days, respectively. The flexural strength also increased by 5.7%. References [19,22] noted, however, that early strength of concrete decreased at higher LCD glass content.
When cement was replaced with LED glass powder, which is harmful waste and has a high content of SiO2, Al2O3, and SiC compounds and particles ranging between 1 µm and 20 µm, the strength activity index was 95.3–106.5% at 3 days, 113.9–122.8% at 7 days, and 126.7–141.9% after 28–90 days, compared to reference samples [20]. These results show that even though the strength activity index was low at an early age, it increased at later concrete curing stages. It was also noted that the activity index increased with the fineness of LED glass. The intensity of the XRD curves showed that CH content increased in the early stage of curing in particular and CSH peak values increased with time, whereas C3S peak values decreased, because C3S is used in hydration reactions and subsequently CH and then CSH contents increase.
When cement is replaced by 10% and 20% of automotive glass waste [18], the compressive strength of the concrete slightly reduces, but the resistance to alkali and sulphate corrosion almost doubles. A study [5] on the replacement of cement in concrete mixes by waste glass added at 10%, 15%, 20%, and 25% (fineness modulus FM = 3.01) reports that at 56 days the compressive strength of all modified samples was lower than the strength of reference samples, but at 90 days the strength of all modified concrete samples, except for the samples with the highest glass content of 25%, exceeded the strength of the reference sample [17].
Bonding-strength tests with the samples containing soda–lime glass with an average particle size of 18.2 µm showed a 2–5% decrease in strength when the glass content in the samples increased from 10% to 30%. However, the results of the same measurement with the samples heated up to 800 °C showed that the samples modified with waste glass had 14–37% higher bonding strength. At 28 days, the SEM analysis showed the prevalence of CH in the reference sample. The glass waste added to the mix caused the development of a SiO2 layer on the surface of this particle and the formation of CSH in the CH reaction. An interfacial transition zone is visible between the glass and the cementitious matrix, which could be the reason for the reduced strength of the samples containing waste glass [16,17]. Furthermore, the addition of glass (20%) increased the workability of the concrete due to the low water-absorption properties of the glass. Soda–lime glass, as other types of glass, also increased the resistance to chloride diffusion and resistance to freeze–thaw cycles as a result of the pore-filling effect caused by the pozzolanic reaction of dispersed waste glass [17].
Tests in the second line of research into cementitious materials, where the aggregate was replaced by waste LCD glass (0%, 10%, 20%, 30%, with FM = 3.37) [24,25], showed that the slump flow of concrete increased with the amount of waste LCD glass added. When the aggregate was replaced by glass at 10–30%, the slump flow increased from 20 mm to 100 mm. It is concluded that LCD glass is finer than conventional sand and can better fill the spaces between coarser particles, has a low water-absorption rate and weak bonding between glass particles with a smoother surface and the cement matrix [26]. Compressive strength tests showed that the samples modified with LCD glass and the reference samples had similar strength values. Other studies [1,25,27,28] reported similar results. The samples containing 10–20% of glass had higher compressive strength in comparison with the reference concrete. In terms of water/binder ratio, a decrease in compressive strength was observed with the increase in the w/b ratio [24,28,29]. Flexural strength tests [24] of concrete modified with waste LCD glass (0%, 10%, 20%, 30%, and FM = 3.37) showed that at 7 and 28 days, the samples containing 10% of waste glass performed better than the reference sample; however, the samples with a higher waste glass content did not reach the flexural strength of the reference sample. However, at 90 days, the flexural strength of the samples with 10% of LCD glass was lower than the strength of the reference sample, whereas the samples with a lower LCD glass content showed higher flexural strength values. It should be noted that LCD glass used to replace sand in different proportions of 10%, 20%, 30%, and 40% reduced the shrinkage of concrete, while concrete containing 40% of LCD glass as fine aggregate was more resistant to sulphate corrosion [25].
A study with recycled cathode-ray tube (CRT) funnel glass [30], where sand in concrete was replaced by recycled glass in part (25%, 50%, 75%) and in total, showed that the flexural strength of concrete decreased from 8.2% to 34.5% with a corresponding increase in the glass content in the mix, while the compressive strength decreased from between 5.1% to 16.7%. To reduce the detrimental effect of the alkali–silica reaction (ASR), metakaolin was additionally used. The unacceptable sample expansion value of 0.6% was recorded in the samples containing 10% of metakaolin and 100% of CRT funnel glass. At higher metakaolin contents of 20% and 30%, the expansion was reduced by 72% and 90%, respectively, and was within the permissible limits. These compositions also showed higher sulphate resistance. Similar results were reported by authors [31] when sand was replaced in part (50%) and in full (100%) by two types of waste glass: ground container glass and CRT funnel glass. Waste CRT funnel glass was processed in two ways: ground, and ground and conditioned in sodium acid. At 90 days, the flexural strength of concrete fell by from 13% to 20% due to poor bonding of smooth-surfaced glass and a cementitious matrix. The tests with solar waste sand (SWS) obtained by crushing solar panels and used as a substitute for fine aggregate in concrete showed similar compressive strength values in the modified and reference samples [32].
Substituting 50% of fine or coarse aggregates with untreated glass waste resulted in a notable 29% improvement in the 7-day compressive strength of concrete compared to the control. However, marginal decreases of 13% and 5% were observed in the compressive strength at 28 days when the fine aggregate was replaced with untreated fine glass of 30% and 50%, respectively. Functional chemistry analysis revealed the formation of Ettringite at later stages in silane-treated glass waste concrete, elucidating the decreased compressive strength at 28 days in these mixtures [33].
Analysis of the effects of different types of waste glass on the properties of cementitious materials showed that glass of different chemical and mineral composition and different fineness can have different effects on the properties of cementitious materials. No analysis of the effect of waste glass from household appliances on the properties of cementitious materials was found in scientific papers.
The aim of this paper is to compare the effect of waste glass from electronic devices (LCDw) and household appliances (washing machines WMw) of different chemical composition on cement hydration and the physical and mechanical properties of the binder. The hypothesis of this work is that dispersed waste glass of different chemical composition can affect the hydration of cementitious materials and their physical mechanical properties differently. However, by establishing this effect, in the future it would be possible to use glass mixtures from different electronic waste, thereby reducing landfill areas and implementing greener technologies in concrete production.

2. Materials and Methods

In this study, white cement (Aalborg White, Aalborg, Denmark) and two kinds of dispersed glass waste—(1) from computer monitors, LCD and LED TV screens (LCDw) and (2) washing machines (WMw)—were used. The chemical composition of these materials, determined by the XRF method (Rigaku Primus IV, Tokyo, Japan), is presented in Table 1.
The analysis of the chemical composition of dispersed glass revealed great differences in waste glass from electronic devices and household appliances. Therefore, this kind of waste glass cannot be used as a conventional additive for cementitious materials. For instance, LCDw glass is mainly composed of 57.3% SiO2, 14.0% Al2O3, 7.6% CaO and 7.5% SrO, whereas WMw glass is composed of 68.2% SiO2, 12.2% Na2O and 10.1% CaO. Figure 1 illustrates the size of particles of these two types of glass: LCDw has an average particle size of 33.2 µm, d10 1.9 µm, d50 24,1 µm, and d90 81.2 µm; WMw has an average particle size of 23.3 µm, d10 0.2 µm, d50 12.9 µm, and d90 64.6 µm. The particle-size distribution curves reveal that WMw is easier to grind and the particles obtained are slightly finer; in particular, it contains more fine particles of up to 1 µm (about 15%).
The materials used for the mixes, where 0%, 5%, 10% and 20% of cement was replaced, were at first mixed dry for 2 min and then mixed with tap water for 3 min. The water–binder ratio (W/B) in all mixes was kept constant at 0.35, which indicates that the same amount of water was used in all compositions. The spread was determined according to LST EN 12706 [34] using a metal cone with a diameter of 3 cm and height of 5 cm immediately after the mixing.
The spread results presented in Figure 2 show that the spread decreases at a higher dispersed glass content irrespective of the glass type, because more water is required to wet the surface of very fine particles. However, WMw glass particles, presumably due to the higher content of particles smaller than 1µm compared to LCDw, fill the void space between cement particles better and improve the workability of the mix. The samples modified with 5–10% WMw glass had a higher spread in comparison with the reference samples.
Samples of 40 × 40 × 40 mm3 were moulded after the spread test. The samples were cured for 24 h at a temperature of 20 ± 2 °C and 70% relative humidity. The demoulded samples were kept in water of 20 ± 1 °C for 7 or 28 days until the test. At 7 and 28 days, the density of the concrete samples was tested by measuring the dimensions with a precision of 0.01 mm and weighing with a precision of 0.01 g. Afterwards, the ultrasonic pulse velocity (UPV) was measured according to the method described in [35], and the samples were compressed using the Tinius Olsen H200 KU press (Tinius Olsen, Orlando, FL, USA), according to the requirements of LST EN 196-1 [36]. Three samples of each composition were used for these tests. Additionally, the pozzolanic activity index PAI was calculated according to Equations (1) and (2):
PAI = (CS/CSref)∙100, %
where CS is the compressive strength of each sample, MPa, and CSref is the compressive strength of reference sample (C), MPa.
PAIK = PAI/K, %
where PAIK is the pozzolanic activity index for similar cement amount, %, PAI is the pozzolanic activity index (Equation (2)), %, and K is the mass fraction of cement in the binder (K = 0.8, 0.9, 0.95 and 1.0).
The calorimetry tests of the binder were performed with 100 g of dry material at W/B 0.35. Microcalorimeter ToniCAL III was used for these tests. The evolved heat of hydration was measured at 20 ± 1 °C for 48 h. Furthermore, the degree of hydration (DH) was calculated according to the literature [37]:
DH = (Qt/Q48h)∙100, %
where Qt is the cumulative amount of heat hydration after 12, 24, 36, 48 h for each sample, J/g, and Q48h is the cumulative amount of heat hydration after 48 h for reference sample (C), J/g.
Thermogravimetric analysis (TG, DTG) was performed at 7 and 28 days on the thermal analyser Perkin Elmer TGA 4000 (Perkin Elmer, Waltham, MA, USA). Samples weighing 50–60 mg were placed in a platinum crucible and heated in nitrogen to 1000 °C at a heating rate of 10 °C/min. The CH content in the tested sample was calculated according to the method presented in [35,38]:
mCH = mH2O⋅(RP)/(Rw), %
where mCH is the amount of CH present in the sample that decomposed in the 420–530 °C temperature range during the TG analysis, %, mH2O is the mass loss, in the 420–530 °C temperature range, %, Rp is the relative molecular mass of the CH, and Rw is the relative molecular mass of the water.
Thereafter, the amounts of CH in cement basis (mc) were calculated as follows:
mc = mCH/K, %
where mCH is the amount of decomposed portlandite in the sample (determined using Equation (4)), %, and K is the mass fraction of cement in the binder (K = 0.8, 0.9, 0.95 and 1.0).
At 28 days, the rough surfaces of hardened cement pastes were evaluated by scanning electron microscopy (SEM) in secondary electron mode (SE) using a JEOL JSM-7600F device (JEOL, Tokyo, Japan). The images were obtained from gold-coated surface fractures of the hardened samples by a vacuum evaporation technique. The microscope settings used were voltages of 10 kV and 20 kV at a distance of from 7–10 mm to the sample surface. The interaction zone between the cement matrix and the glass particles was analysed (magnification up to 3000 times). XRD analysis was performed using a DRON-7 diffractometer (Bourevestnik, Saint-Petersburg, Russia) with Cu-Kα (λ = 0.1541837 nm). The test parameters used were as follows: 30 kV voltage, 12 mA current, and a 2θ diffraction angle range from 4° to 60° at increments of 0.02° measured each 0.5 s.

3. Results and Discussion

Calorimetry tests (Figure 3, Table 2 and Table 3) showed that glass of both types retards cement hydration and inhibits the release of heat. Each type of glass had a different effect on cement hydration: the degree of cement hydration in the samples modified with LCDw was 4–6% lower, whereas in the WMw samples it decreased by 12–13%, when 10% and 20% of cement was replaced with waste glass. One more pronounced peak, which illustrates the hydration of C3S, is seen in the samples modified with 10% LCDw glass. When the LCDw content increases to 20%, the second and even sharper peak of C3A hydration appears, and the reaction intensity remains similar to that of cement hydration. Similar trends of hydration reactions were observed in the samples with WMw glass; however, the degree of hydration was lower.
In the LCDw samples, the degree of hydration dropped by approx. 6% when cement content was reduced by 20%. In the samples modified with 10% of WMw, the hydration degree dropped by approx. 12%, i.e., more than the content of replaced cement. This indicates that WMw can retard cement hydration, whereas a high Na2O content (12.2%, Table 1) is insufficient for the activation of cement hydration. When the WMw content in the mix was increased to 20%, the Na2O content in the mix also increased, and the degree of hydration fell by 13% in comparison with the reference sample. Therefore, a higher WMw content can increase the degree of cement hydration. The samples modified with WMw showed a lower degree of cement hydration, and less heat was released, but the time until the maximum heat flow was shorter than in LCDw samples (Table 2). These results can be explained by the greater abundance of aluminate phases, which retard the release of the heat of hydration.
At 7 and 28 days, the densities of hardened cement paste (Figure 4) modified with LCDw and WMw fell by approx. 1.9% to 5.6%. This drop in density could have been caused by the partial replacement of cement with glass with a lower particle density. However, the difference is reduced with longer curing time as a result of the slower reaction of cement with glass.
As a result of the possibly more uniform structure of the samples modified with up to 10% of waste glass, especially WMw, the UPV was similar to or slightly higher than the UPV of reference samples (Figure 5). With the increase in the glass content of up to 20%, the UPV dropped by about 6%.
At 7 days, the compressive strength (Figure 6a) of all samples modified with waste glass was lower than the strength of reference samples. The strength in LCDw samples fell by 9.4%, 36.0%, and 70.0%, whereas in WMw samples it fell by 25.9%, 29.7%, and 56.0%. At 28 days, the difference in strength in comparison with the reference sample (as described in the literature [17,21,22] too), but the difference in strength of LCDw samples (7.4%, 30.5%, 44.8%) was still lower than the difference of WMw samples (17.0%, 38.1%, 40.8%) At 28 days, LCDw samples showed better compressive strength results when they used 5% and 10% of waste. The modification of cement with this type of glass also gave a higher degree of hydration in the early stage (Table 3). The PAI results (Table 4) show that compressive strength for a similar content of cement is lower in all compositions with glass waste (73.5–98%) compared to the reference sample, which indicates that strength decreases not only due to the dilution effect, but due to the retardation of cement hydration. After 28 days, this coefficient increases, compared to 7 days, because of pozzolanic reactions, especially when 20% of glass waste is used.
The highest decrease in strength was recorded when 20% of the mix was waste glass. This can be explained by the reduced cement content, but SEM results also showed that the strength was also reduced due to the agglomeration of very fine glass particles (Figure 7b,d).
This accumulation of glass particles in the entire volume of the sample is specific to the mixture modified with 20% LCDw (Figure 7b) and WMw (Figure 7d) glass. According to the authors Al-Kheetan et al. [39], the surface morphology of the glass powder exhibits a distinct textural irregularity, potentially impeding its efficacy in filling voids within pores. However, partial dissolution of glass particles is also visible in these areas, and the open pores could be gradually filled with new hydration products after a longer time, because finely ground glass promotes enhanced interaction between dissolved silica and calcium in the pore solution. This facilitates the occurrence of the pozzolanic reaction [40]. The authors T. Lia and L. Tier [41] also determined that the glass powder undergoes partial dissolution and causes a reduction in CaO content, resulting in an increase in the Si/Ca ratio. A higher Si/Ca ratio corresponds to greater compressive strength. However, when the authors compared the results at 90 and 28 days, the Si/Ca ratio was found to increase with age, indicating ongoing reactions involving glass powder, although at a slower rate [41,42]. The coarser particles of LCDw and WMw glass mix quite well and adhere firmly to the cement matrix (Figure 7a,c), as do other types of glass particles [42]. Crystal hydrates, common to cementitious materials, form around glass particles.
They were also identified by XRD analysis (Figure 8). Minerals common to cementitious materials—portlandite, calcite and the white cement mineral alite—which had not reacted in full were identified in XRD analyses. The intensities of the main peaks in the reference sample showed that portlandite and alite were the most abundant, as these samples contained 20% more cement. The samples with waste glass had a greater amount of calcite.
Differential thermal analysis was performed to identify the amount of hydration products, especially portlandite. The mass loss (Figure 9 and Figure 10, Table 5) at temperatures between 30 °C and 105 °C is related to water evaporation; in the range from 110 °C to 350°C, the mass loss is caused by the dehydration of cement hydration products, including CSH, CASH, and ettringite; in the range between 420 °C and 530 °C, the mass loss is related to the dissolution of portlandite, while in the range between 610 °C and 770 °C the mass loss is caused by the dissolution of calcium carbonate. Since water loss of several cement hydration products is recorded in the same temperature range (110–350 °C) and mainly depends on the drying conditions prior to the TG analysis [43,44], the phases can only be quantified accurately with well-defined and non-overlapping peaks, i.e., for portlandite and calcium carbonate [37].
The evaluation of portlandite content after 7 days of curing showed similar results for the samples with both types of glass: the replacement of cement at 5% reduced the CH content by 11–15%, but the replacement of 20% of cement with waste glass reduced the CH content in the sample by approx. 40% (Table 5). Conversion of the CH content to an equal cement content showed that the amount of CH was reduced by 10% in the samples modified with 5% LCDw glass, 5% in the samples modified with 5% WMw glass, and 15% in the samples modified with 20% glass waste. Such a drop in portlandite content can be explained by the pozzolanic reaction, during which waste glass reacts with CH to form CSH and CASH. Furthermore, higher amounts of carbonates were identified in the samples modified with glass waste, and these carbonates might be produced in the CH and CO2 reaction. At temperatures from 110–350 °C, the mass loss in the samples modified with waste glass decreased with the increase in waste glass content due to the lower cement content; however, the conversion to equal cement content showed that at 7 days the mass had changed insufficiently (1.7% loss) in this temperature range.
At 28 days, the portlandite content decreased in the samples containing 20% of waste glass due to a significantly lower cement content; however, the conversion into equal cement content showed that all samples modified with waste glass had a higher portlandite content than the reference sample. After 28 days, a greater mass loss was observed in the temperature range of 110–350 °C for the same cement content: LCDw20 samples showed a higher mass loss of 15.5%, while the WMw20 sample had a 6.6% higher mass loss compared to the reference sample, which indicates that the glass used, especially LCDw, has pozzolanic properties, because more CSH and CASH are produced in the reaction with CH. Similar trends were reported in other studies with other types of waste glass. The authors attribute a positive pozzolanic reaction observed in recycled waste glass powder to the increased presence of CSH within the pore structure, which effectively fills and compacts the finer pores [45,46,47,48]. Carbonate content tends to increase in the samples with waste glass, but poorly crystallized calcium carbonate, which can decompose at relatively low temperatures (520–720 °C), was also identified. Higher CO2 emissions from vaterite, aragonite, and calcite at higher temperatures (720–950 °C) [49] were observed in the reference sample. Other authors [50] also found that a higher amount of poorly crystallized calcium carbonate (more than 70%) was formed when part of the cement was replaced with waste glass.

4. Conclusions

  • Both types of waste glass from various displays and washing machines retard cement hydration (from 13.1 h till 15.9 h) and reduce the amount of heat released (from 291.8 J/g to 273.1 J/g with 20% LCDw and 253.3 J/g with 20% WMw). However, different effects were observed when cement was replaced at proportions of 10% and 20%: the degree of hydration decreased by only 4% and 6% in LCDw samples, while in WMw samples it decreased by 12% and 13%, respectively. This indicates that the Na2O present in WMw glass is insufficient to accelerate cement hydration. The time to the maximum heat flow was longer in LCDw samples because more aluminate phases are formed when 20% of LCDw glass is added to the mix, and thus, more heat is released at a later time due to aluminate reactions.
  • At 7 and 28 days, the density of the binder was reduced by approx. 2% to 6% in the samples modified with LCDw and WMw. A more uniform structure of the samples modified with up to 10% of waste glass, especially WMw, produced UPV values similar to or slightly higher than the UPV of reference samples (for example, 3827 m/s of a reference sample and 3829 m/s of WMw10). With the increase in glass content of up to 20%, UPV dropped by about 6%.
  • At 7 days, the compressive strength of all samples modified with waste glass was lower than the strength of the reference samples. The strength in LCDw samples was reduced by 9.4%, 36.0%, and 70.0%, whereas in WMw samples it fell by 25.9%, 29.7%, and 56.0%. At 28 days, the difference in strength in comparison with the reference sample fell, but the decrease in LCDw sample strength of (7.4%, 30.5%, 44.8%) was still lower than the decrease in WMw samples (17.0%, 38.1%, 40.8%). The PAI results show that the recalculated coefficient to the similar amount of cement is from 73.5–98.0%. The strength decrease is caused not only by the reduced cement content but also by retardation of cement hydration, and according to SEM results, it is also due to the agglomeration of ultrafine glass particles, which led to the formation of distinct porous zones throughout the sample, particularly in the samples modified with 20% waste glass.
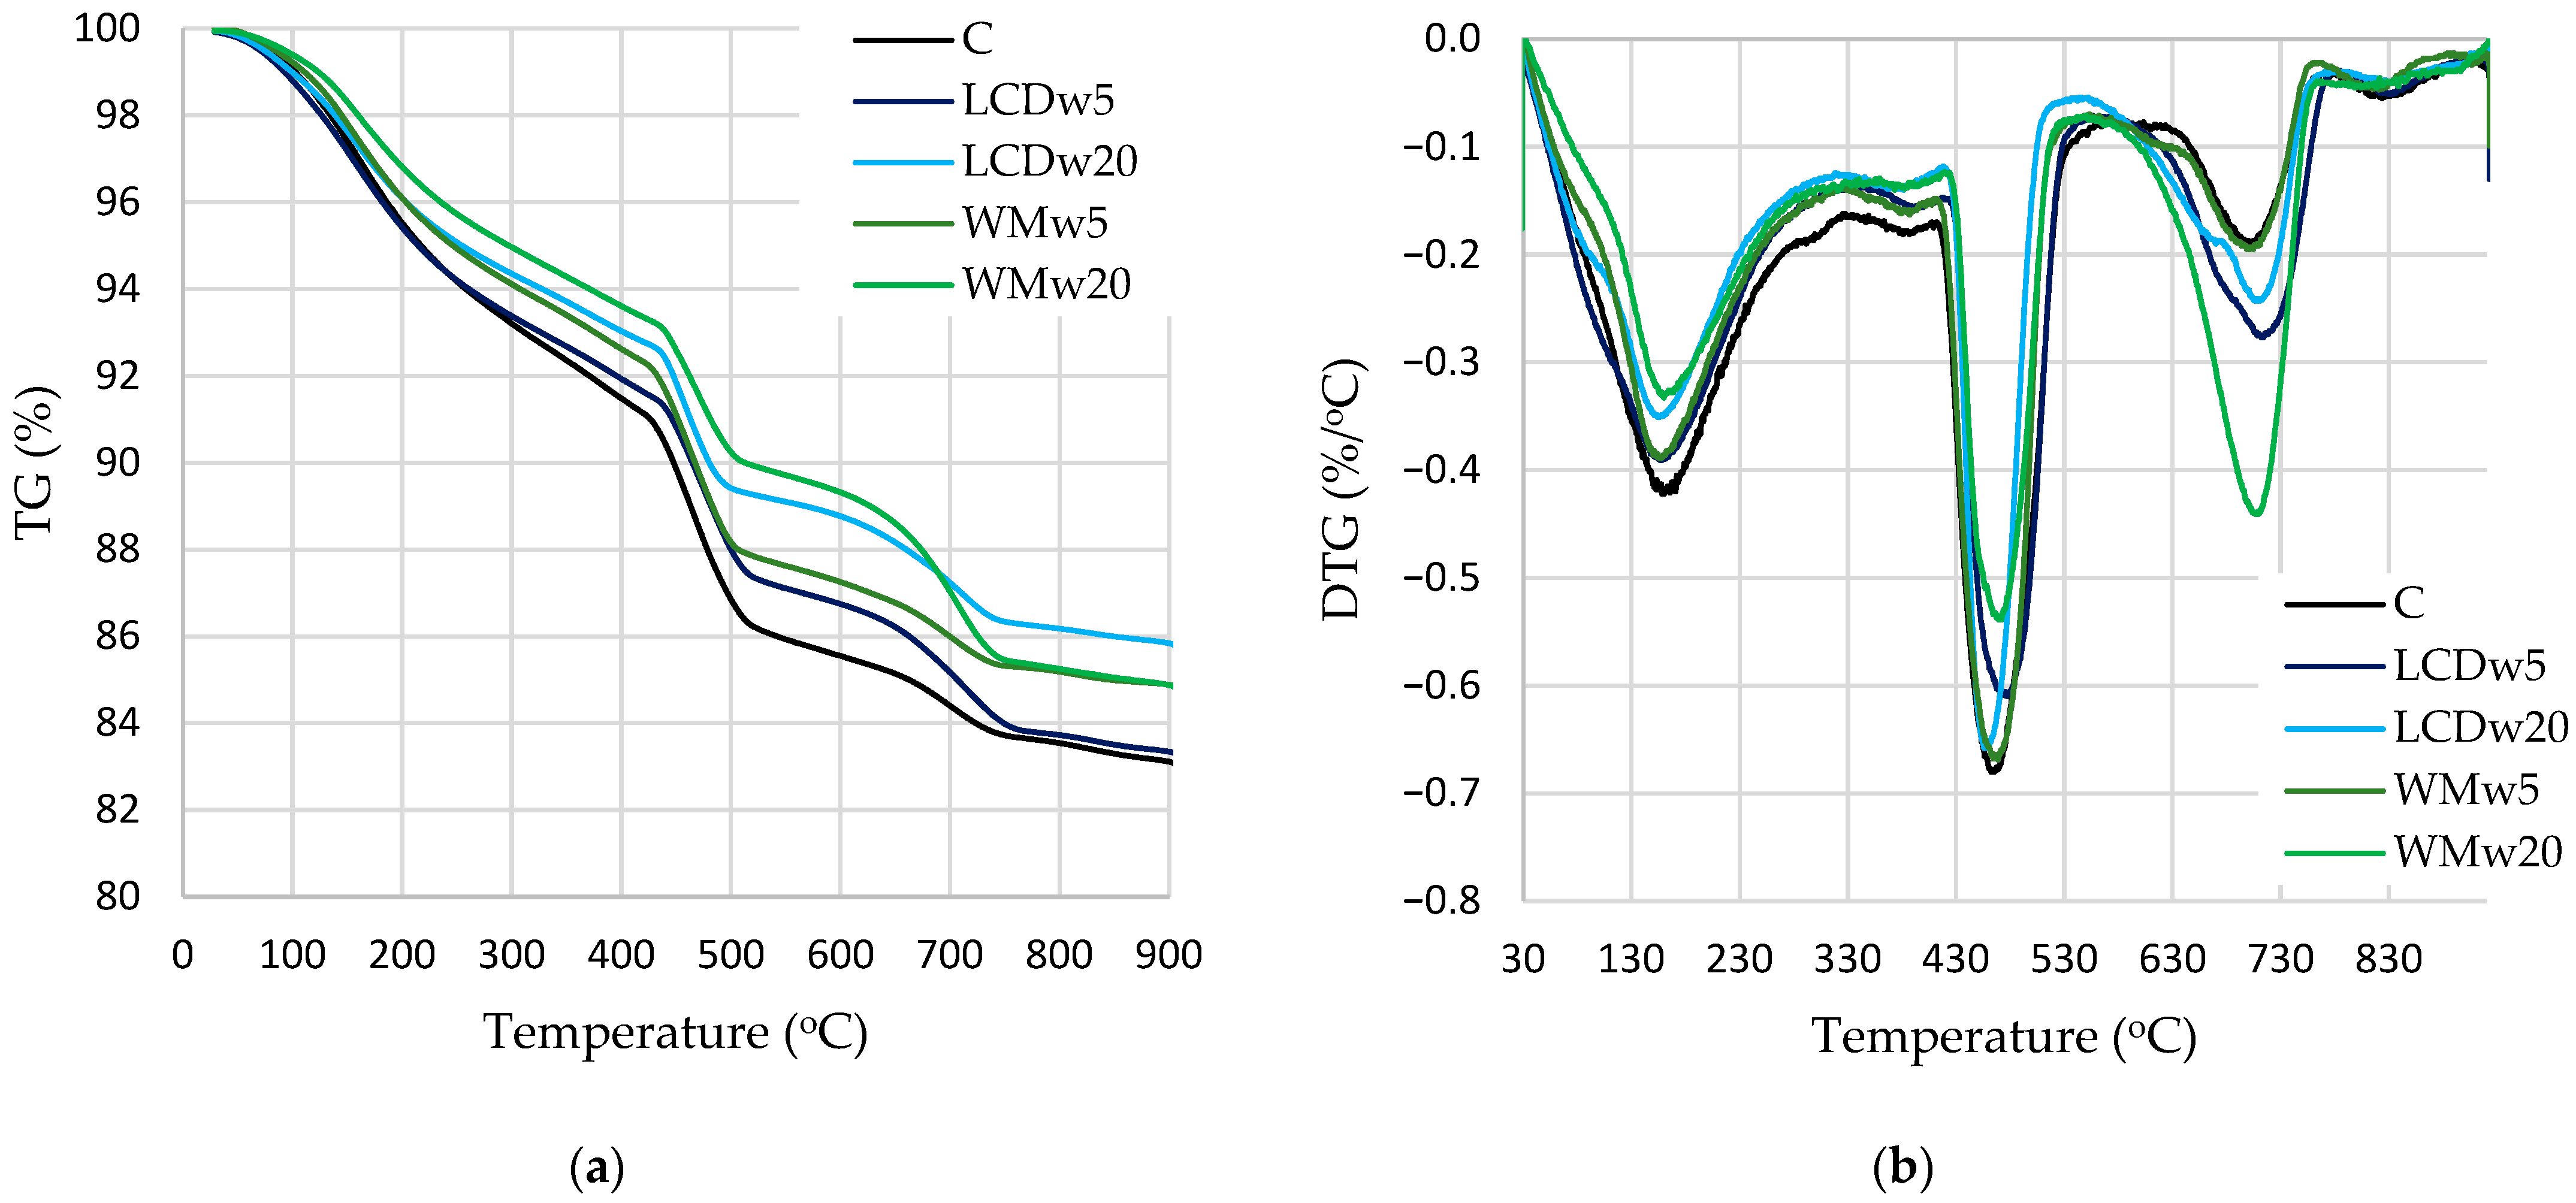
  • XRD and TG analyses showed that reference samples contained the highest amounts of portlandite and alite, whereas the modified samples had a higher content of poorly crystallized calcium carbonate. Conversion into equal cement content showed that, at 7 days, control samples had the highest portlandite content (20.6%, and with glass waste, from 18.0–19.9%), but at 28 days, modified samples with waste had the highest amount of portlandite at 20.5–21.6%, compared to the 19.3% of the reference sample. The same was observed with the change in calcium hydrosilicate content according to mass loss in the 110–350 °C temperature range: at 7 days, for the reference sample 6.1%, and for samples with glass waste, 5.6–5.9%; at 28 days, 7.1 and 6.3–8.4, respectively.
  • Waste glass of different chemical compositions had a similar effect on the physical–mechanical properties and mineral compositions of the modified samples. More significant differences were observed in the workability of the modified mixture, where the WMw glass increased the spread by up to 25%, while the LCDw reduced it by approximately 20% compared to the reference sample. Different types of waste glass also behaved differently in terms of early hydration, where a higher degree of hydration (96.0%) was observed in LCDw samples due to higher water absorption.

Author Contributions

Conceptualization, J.M.; methodology, J.M. and K.B.; validation, J.M.; formal analysis, J.M. and K.B.; investigation, J.M. and K.B.; resources, J.M.; data curation, J.M. and K.B.; writing—original draft preparation, J.M. and K.B.; writing—review and editing, J.M.; visualization, J.M.; supervision, J.M.; project administration, J.M., funding acquisition, J.M. All authors have read and agreed to the published version of the manuscript.

Funding

The equipment and infrastructure of Civil Engineering Scientific Research Center of Vilnius Gediminas Technical University was employed for investigations. This research was supported by the center of excellence project “Civil Engineering Research Centre” (Grant No. S-A-UEI-23-5).

Data Availability Statement

The data are presented in this manuscript.

Conflicts of Interest

The authors declare no conflicts of interest.

References

  1. Badarloo, B.; Lehner, P.; Koubov, L.; Pirizadeh, M. Correlation study of physical and mechanical properties of concretes with crushed LCD glass. J. Clean. Prod. 2023, 385, 135756. [Google Scholar] [CrossRef]
  2. Amato, A.; Rocchetti, L.; Beolchini, F. Environmental impact assessment of different end-of-life LCD management strategies. Waste Manag. 2017, 59, 432–441. [Google Scholar] [CrossRef]
  3. Bereketli, I.; Erol Genevois, M.; Esra Albayrak, Y.; Ozyol, M. WEEE treatment strategies’ evaluation using fuzzy LINMAP method. Expert Syst. Appl. 2011, 38, 71–79. [Google Scholar] [CrossRef]
  4. Tsydenova, O.; Bengtsson, M. Chemical hazards associated with treatment of waste electrical and electronic equipment. Waste Manag. 2011, 31, 45–58. [Google Scholar] [CrossRef]
  5. Meyer, C. The greening of the concrete industry. Cem. Concr. Compos. 2009, 31, 601–605. [Google Scholar] [CrossRef]
  6. Hanein, T.; Galvez-Martos, J.L.; Bannerman, M.N. Carbon footprint of calcium sulfoaluminate clinker production. J. Clean. Prod. 2018, 172, 2278–2287. [Google Scholar] [CrossRef]
  7. Assi, L.; Carter, K.; Deaver, E.; Anay, R.; Ziehl, P. Sustainable concrete: Building a greener future. J. Clean. Prod. 2018, 198, 1641–1651. [Google Scholar] [CrossRef]
  8. Harrison, E.; Berenjian, A.; Seifan, M. Recycling of waste glass as aggregate in cement-based materials. Environ. Sci. Ecotechnol. 2020, 4, 100064. [Google Scholar] [CrossRef]
  9. Jani, Y.; Hogland, W. Waste glass in the production of cement and concrete—A review. J. Environ. Chem. Eng. 2014, 2, 1767–1775. [Google Scholar] [CrossRef]
  10. Kaya, M. Current WEEE recycling solutions. In Waste Electrical and Electronic Equipment Recycling; Vegliò, F., Birloaga, I., Eds.; Woodhead Publishing: Cambridge, UK, 2018; pp. 33–93. [Google Scholar] [CrossRef]
  11. Siddique, R. Waste Glass. In Waste Materials and By-Products in Concrete; Springer: Berlin/Heidelberg, Germany, 2008; pp. 147–175. [Google Scholar] [CrossRef]
  12. Islam, G.M.S.; Rahman, M.H.; Kazi, N. Waste glass powder as partial replacement of cement for sustainable concrete practice. Int. J. Sustain. Built Environ. 2017, 6, 37–44. [Google Scholar] [CrossRef]
  13. Góra, J.; Franus, M.; Barnat-Hunek, D.; Franus, W. Utilization of Recycled Liquid Crystal Display (LCD) Panel Waste in Concrete. Materials 2019, 12, 2941. [Google Scholar] [CrossRef]
  14. Kim, S.K.; Yang, H.J. Utilization of liquid crystal display (LCD) waste glass powder as cementitious binder in mortar for enhancing neutron shielding performance. Constr. Build. Mater. 2021, 270, 121859. [Google Scholar] [CrossRef]
  15. ASTM C618-22; Standard Specification for Coal Fly Ash and Raw or Calcined Natural Pozzolan for Use in Concrete. ASTM International: West Conshohocken, PA, USA, 2022.
  16. Jiang, X.; Xiao, R.; Bai, Y.; Huang, B.; Ma, Y. Influence of waste glass powder as a supplementary cementitious material (SCM) on physical and mechanical properties of cement paste under high temperatures. J. Clean. Prod. 2022, 340, 130778. [Google Scholar] [CrossRef]
  17. Nassar, R.U.D.; Soroushian, P. Strength and durability of recycled aggregate concrete containing milled glass as partial replacement for cement. Constr. Build. Mater. 2012, 29, 368–377. [Google Scholar] [CrossRef]
  18. Matos, A.M.; Sousa-Coutinho, J. Durability of mortar using waste glass powder as cement replacement. Constr. Build. Mater. 2012, 36, 205–215. [Google Scholar] [CrossRef]
  19. Yang, H.J.; Usman, M.; Hanif, A. Suitability of liquid crystal display (LCD) glass waste as supplementary cementing material (SCM): Assessment based on strength, porosity, and durability. J. Build. Eng. 2021, 42, 102793. [Google Scholar] [CrossRef]
  20. Wang, W.J.; Wang, C.D.; Lee, T.C.; Chang, C.C. Characterization of a mortar made with cement and sludge from the light-emitting diode manufacturing process. Constr. Build. Mater. 2014, 56, 106–112. [Google Scholar] [CrossRef]
  21. Kim, S.K.; Kang, S.T.; Kim, J.K.; Jang, I.Y. Effects of Particle Size and Cement Replacement of LCD Glass Powder in Concrete. Adv. Mater. Sci. Eng. 2017, 2017, 3928047. [Google Scholar] [CrossRef]
  22. Wang, H.Y. The effect of the proportion of thin film transistor–liquid crystal display (TFT–LCD) optical waste glass as a partial substitute for cement in cement mortar. Constr. Build. Mater. 2011, 25, 791–797. [Google Scholar] [CrossRef]
  23. Raju, A.S.; Anand, K.B.; Rakesh, P. Partial replacement of Ordinary Portland cement by LCD glass powder in concrete. Mater. Today Proc. 2020, 46, 5131–5137. [Google Scholar] [CrossRef]
  24. Wang, H.Y.; Huang, W.L. Durability of self-consolidating concrete using waste LCD glass. Constr. Build. Mater. 2010, 24, 1008–1013. [Google Scholar] [CrossRef]
  25. Wang, H.Y.; Zeng, H.; Wu, J.Y. A study on the macro and micro properties of concrete with LCD glass. Constr. Build. Mater. 2014, 50, 664–670. [Google Scholar] [CrossRef]
  26. Terro, M.J. Properties of concrete made with recycled crushed glass at elevated temperatures. Build. Environ. 2006, 41, 633–639. [Google Scholar] [CrossRef]
  27. Wang, H.Y. A study of the effects of LCD glass sand on the properties of concrete. Waste Manag. 2009, 29, 335–341. [Google Scholar] [CrossRef] [PubMed]
  28. Her-Yung, W. A study of the engineering properties of waste LCD glass applied to controlled low strength materials concrete. Constr. Build. Mater. 2009, 23, 2127–2131. [Google Scholar] [CrossRef]
  29. Wang, C.C.; Wang, H.Y. Assessment of the compressive strength of recycled waste LCD glass concrete using the ultrasonic pulse velocity. Constr. Build. Mater. 2017, 137, 345–353. [Google Scholar] [CrossRef]
  30. Ling, T.C.; Poon, C.S. A comparative study on the feasible use of recycled beverage and CRT funnel glass as fine aggregate in cement mortar. J. Clean. Prod. 2012, 29–30, 46–52. [Google Scholar] [CrossRef]
  31. Ling, T.-C.; Poon, C.S.; Kou, S.C. Feasibility of using recycled glass in architectural cement mortars. Cem. Concr. Compos. 2011, 33, 848–854. [Google Scholar] [CrossRef]
  32. Zele, S.; Joshi, A.; Gogate, N.; Marathe, D.; Shitole, A. Experimental investigation on utilization of crushed solar panel waste as sand replacement in concrete. Solar Energy 2024, 269, 112338. [Google Scholar] [CrossRef]
  33. Al-Awabdeh, F.W.; Al-Kheetan, M.J.; Jweihan, Y.S.; Al-Hamaiedeh, H.; Ghaffar, S.H. Comprehensive investigation of recycled waste glass in concrete using silane treatment for performance improvement. Results Eng. 2022, 16, 100790. [Google Scholar] [CrossRef]
  34. LST EN 12706; Adhesives-Test Methods for Hydraulic Setting Floor Smoothing and/or Levelling Compounds—Determination of Flow Characteristics. Lietuvos Standartizacijos Departamentas: Vilnius, Lithuania, 2004.
  35. Malaiskiene, J.; Costa, C.; Baneviciene, V.; Antonovic, V.; Vaiciene, M. The effect of nano SiO2 and spent fluid catalytic cracking catalyst on cement hydration and physical mechanical properties. Constr. Build. Mater. 2021, 299, 124281. [Google Scholar] [CrossRef]
  36. LST EN 196-1; Methods of Testing Cement—Part 1: Determination of Strength. Lietuvos Standartizacijos Departamentas: Vilnius, Lithuania, 2016.
  37. Spychał, E.; Stepien, P. Effect of Cellulose Ether and Starch Ether on Hydration of Cement Processes and Fresh-State Properties of Cement Mortars. Materials 2022, 15, 8764. [Google Scholar] [CrossRef]
  38. Lothenbach, B.; Durdzinski, P.; Weerdt, K. Thermogravimetric analysis. In A Practical Guide to Microstructural Analysis of Cementitious Materials, 1st ed.; Scrivener, K., Snellings, R., Lothenbach, B., Eds.; CRC Press: Boca Raton, FL, USA, 2016; pp. 177–212. [Google Scholar]
  39. Al-Kheetan, M.J.; Byzyka, J.; Ghaffar, S.H. Sustainable Valorisation of Silane-Treated Waste Glass Powder in Concrete Pavement. Sustainability 2021, 13, 4949. [Google Scholar] [CrossRef]
  40. Mejdi, M.; Wilson, W.; Saillio, M.; Chaussadent, T.; Divet, L.; Tagnit-Hamou, A. Investigating the pozzolanic reaction of post-consumption glass powder and the role of portlandite in the formation of sodium-rich C-S-H. Cem. Concr. Res. 2019, 123, 105790. [Google Scholar] [CrossRef]
  41. Lia, T.; Tier, L. Microscopic Mechanism Analysis of Glass Powder with Different Replacement Rate on Concrete Performance. Glass Phys. Chem. 2023, 49, 245–255. [Google Scholar] [CrossRef]
  42. Bignozzi, M.C.; Saccani, A.; Barbieri, L.; Lancellotti, I. Glass waste as supplementary cementing materials: The effects of glass chemical composition. Cem. Concr. Compos. 2015, 55, 45–52. [Google Scholar] [CrossRef]
  43. Mostafa, N.Y.; Brown, P.W. Heat of hydration of high reactive pozzolans in blended cements: Isothermal conduction calorimetry. Thermochim. Acta 2005, 435, 162–167. [Google Scholar] [CrossRef]
  44. Mikhailenko, P.; Cassagnabere, F.; Emam, A.; Lachemi, M. Influence of physico- chemical characteristics on the carbonation of cement paste at high reploacement rates of metakaolin. Constr. Build. Mater. 2018, 158, 164–172. [Google Scholar] [CrossRef]
  45. Snoeck, D.; Velasco, L.F.; Mignon, A.; Van Vlierberghe, S.; Dubruel, P.; Lodewyckx, P.; De Belie, N. The influence of different drying techniques on the water sorption properties of cement-based materials. Cem. Concr. Res. 2014, 64, 54–62. [Google Scholar] [CrossRef]
  46. Tahwia, A.M.; Essam, A.; Tayeh, B.A.; Elrahman, M.A. Enhancing sustainability of ultra-high performance concrete utilizing high-volume waste glass powder. Case Stud. Constr. Mater. 2022, 17, e01648. [Google Scholar] [CrossRef]
  47. Serelis, E.; Vaitkevicius, V. Effect of waste glass powder and liquid glass on the Physico-Chemistry of Aluminum-Based Ultra-Lightweight concrete. Constr. Build. Mater. 2023, 390, 131615. [Google Scholar] [CrossRef]
  48. Abellan-Garcia, J.; Khan, M.I.; Abbas, Y.M.; Martínez-Lirón, V.; Carvajal-Muñoz, J.S. The drying shrinkage response of recycled-waste-glass-powder-and calcium-carbonate-based ultrahigh-performance concrete. Constr. Build. Mater. 2023, 379, 131163. [Google Scholar] [CrossRef]
  49. Redondo-Mosquera, J.D.; Sánchez-Angarita, D.; Redondo-Pérez, M.; Gómez-Espitia, J.C.; Abellán-García, J. Development of high-volume recycled glass ultra-high-performance concrete with high C3A cement. Case Stud. Constr. Mater. 2023, 18, e01906. [Google Scholar] [CrossRef]
  50. Liu, G.; Tang, Y.; Wang, J. Recycling and valorization of hydrated cement blends in mortars viasemi-dry carbonation—The role of waste glass, granulated blast furnace slag and fly ash. Constr. Build. Mater. 2023, 401, 132987. [Google Scholar] [CrossRef]
Figure 1. Particle-size distribution in LCDw (black line) and WMw (grey line).
Buildings 14 01218 g001
Figure 2. The effect of waste glass on the spread of cement paste.
Buildings 14 01218 g002
Figure 3. Impact of LCDw and WMw on heat flow (a) and the total heat released (b) by cement.
Buildings 14 01218 g003
Figure 4. Impact of glass waste on cement paste density at 7 (a) and 28 (b) days.
Buildings 14 01218 g004aBuildings 14 01218 g004b
Figure 5. Impact of waste glass content on UPV values at 7 days.
Buildings 14 01218 g005
Figure 6. Impact of waste glass content on compressive strength values at 7 (a) and 28 (b) days.
Buildings 14 01218 g006
Figure 7. SEM images of LCDw20 and WMw20: (a) interaction zone between coarse LCDw and cement matrix, (b) zone of agglomerated LCDw fine particles, (c) interaction zone between coarse WMw and cement matrix, (d) zone of agglomerated WMw fine particles.
Buildings 14 01218 g007
Figure 8. XRD results of samples C, LCDw20 and WMw20 (P—portlandite, C—calcite, A—alite, B—belite).
Buildings 14 01218 g008
Figure 9. TG (a) and DTG (b) curves at 7 days.
Buildings 14 01218 g009
Figure 10. TG (a) and DTG (b) curves at 28 days.
Buildings 14 01218 g010
Table 1. Chemical composition of raw materials.
MaterialsCaOSiO2SO3Al2O3Fe2O3MgOK2ONa2OP2O5SrOTiO2BaOCO2
Cement70.422.82.672.180.290.650.070.200.280.170.06
LCDw 7.5957.30.0714.00.791.360.682.140.027.531.276.10
WMw10.168.20.052.200.121.321.1212.20.010.010.044.53
Table 2. Time and heat of hydration of the tested pastes.
Paste DesignationTime of the Second Maximum (h)Heat after Hours of Hydration (J/g)
12243648
C13.1171.8198.4251.8291.8
LCDw1013.7566.1175.0236.4280.0
LCDw2015.93 64.6181.7233.8273.1
WMw1013.4261.0160.2218.1257.3
WMw2014.2558.3162.6215.8253.3
Table 3. Degree of hydration of the tested pastes, %.
Paste DesignationDegree of Hydration
12243648
C24.668.086.3100
LCDw1022.760.081.096.0
LCDw2022.162.380.193.6
WMw1020.954.974.788.2
WMw2020.055.774.086.8
Table 4. PAI (PAIK) of hardened cement samples, %.
Amount of Replaced Cement, %After 7 DaysAfter 28 Days
LCDwWMwLCDwWMw
591.4 (96.2)79.5 (83.7)93.1 (98.0)85.5 (90.0)
1073.6 (81.8)77.1 (85.7)76.6 (85.1)72.4 (80.4)
2058.8 (73.5)64.1 (80.1)69.1 (86.4)71.0 (88.8)
Table 5. Mass loss, %, in decomposition temperature ranges, and amount of CH after 7 and 28 days curing.
Mark110–170 °C, %180–350 °C, %110–350 °C, % at Equal Cement Content420–530 °C, %CH Content in Sample, %CH Content at Equal Cement Content, %At 610–770 °C, %
After 7 days
C2.23.96.15.020.620.61.8
LCDw52.13.45.84.418.119.12.9
LCDw201.82.95.93.614.818.52.4
WMw52.03.35.64.618.919.91.9
WMw201.63.15.93.514.418.03.9
After 28 days
C2.64.57.14.719.319.32.0
LCDw52.73.96.94.920.121.22.4
LCDw202.74.08.44.016.420.52.9
WMw52.34.06.35.020.621.61.9
WMw202.63.77.64.016.420.52.5
Disclaimer/Publisher’s Note: The statements, opinions and data contained in all publications are solely those of the individual author(s) and contributor(s) and not of MDPI and/or the editor(s). MDPI and/or the editor(s) disclaim responsibility for any injury to people or property resulting from any ideas, methods, instructions or products referred to in the content.

