Article

Structural Behavior of Circular Concrete Columns Reinforced with Longitudinal GFRP Rebars under Axial Load

1
Department of Civil Engineering, Ahvaz Branch, Islamic Azad University, Ahvaz 6134937333, Iran
2
Department of Civil Engineering, Maragheh Branch, Islamic Azad University, Maragheh 5519747591, Iran
3
Civil Engineering Program, Ingram School of Engineering, Texas State University, San Marcos, TX 78666, USA
*
Author to whom correspondence should be addressed.
Buildings 2024, 14(4), 988; https://doi.org/10.3390/buildings14040988
Submission received: 13 February 2024 / Revised: 28 March 2024 / Accepted: 29 March 2024 / Published: 2 April 2024
(This article belongs to the Special Issue Advanced Design & Behavior of Concrete Structures)

Abstract

:
This paper presents experimental and theoretical assessments of the structural behavior of circular steel fiber-reinforced concrete (SFRC) columns reinforced with glass fiber-reinforced polymer (GFRP) bars subjected to a concentric axial compressive load. Laboratory experiments were planned to evaluate and compare the effect of different design parameters on the structural behavior of column specimens based on experiments and finite element (FE) analysis. The experimental variables were (i) concrete types, i.e., conventional concrete (CC) and fiber-reinforced concrete (FC), (ii) longitudinal reinforcement types, i.e., steel and GFRP bars, and (iii) transverse rebar configurations, i.e., tied and spiral with different pitches. Sixteen column specimens were fabricated and categorized into four groups with respect to rebar configurations and concrete types. The results showed that the failure modes and cracking patterns of those four column groups were comparable, particularly in the pre-peak branches of load-deflection curves. Even though the average ultimate load of the columns with longitudinal GFRP bars was 17.9% less than that with longitudinal steel bars, the ductility index (DI) was 10.2% greater than their counterpart on average. The addition of steel fibers (SF) to concrete increased the axial peak load by up to 3.1% and the DI by up to 6.6% compared to their counterpart CC columns without SFs. The DI of specimens was increased by higher volumetric ratios (up to 12%) and spiral types (up to 5.5%). The concrete damage plastic (CDP) model for FC columns was updated in the finite element software ABAQUS 6.14. Finally, a new simple equation was theoretically proposed to predict the axial capacity of specimens by considering the inclusion of longitudinal GFRP rebars, volumetric ratio, and steel spiral/hoop ties. Good agreement between the proposed model predictions and the experimental/numerical results was observed.

1. Introduction

Reinforced concrete (RC) members under axial loading, for example, building columns, bridge piers, and piles, are used to convey compression forces, which are the most critical members of a structure [1]. A fiber-reinforced polymer (FRP) rebar is considered a competitive choice for reinforced columns subjected to flexure/shear/fatigue loads due to its physical and mechanical properties, as well as its corrosion. For those reasons, GFRP rebars can be suitable for reinforcing concrete structures subjected to harsh environments, such as coastal and sea zones [2].
In recent years, many investigations have been conducted on different applications of FRP rebars for RC under different loadings, such as fatigue loads [3]. Nevertheless, the axial compression behavior of FRP-RC elements has not yet been fully understood [4]. ACI 440.1R-15 and CSA S806-12 postulated that using GFRP rebars in compression members (such as concrete columns) does not significantly contribute to the structural capacity. No Australian standard was available on GFRP rebar-reinforced concrete. Also, the code of China technical GB50608-2010 only had provisions for designing FRP rebar-reinforced flexural concrete elements [5,6,7,8]. Previous research studies presented that GFRP rebar’s contribution to the total structural capacity of columns was from 3 to 14% [1,9,10,11,12,13,14,15,16] as compared to 6 to 19% when carbon fiber-reinforced polymer (CFRP) rebars were used [4,17,18] and 12 to 16% when steel rebars were applied [1,14,15,16,17,18]. Some researchers reported that the contribution-to-capacity of FRP rebars in RC columns loaded eccentrically should be ignored [19,20,21], while others portrayed that their contributions were considerable [22,23,24,25]. For instance, Hadhood et al. found an average contribution of 27% of the column’s capacity [10]. Guérin et al. suggested that GFRP rebars in short RC columns contributed to carrying eccentric loads by 3, 5, and 13% with an eccentricity of 10, 20, and 40%, respectively [23]. Few research studies reported that increasing a longitudinal reinforcement ratio improves the ductility of axially loaded GFRP-RC and CFRP-RC columns [1,18]. Transverse rebars with a closer pitch provide more confinement to the core of an RC column and forbid the longitudinal rebars from buckling [1,18,19,26,27]. Moreover, GFRP-high strength concrete (HSC) specimens had further ductility than steel-HSC specimens under eccentric loading [26]. FRP transverse rebars displayed a more noticeable effect on ductility, which was improved by 57 to 208% as the pitch of the spiral rebars decreased from 120 to 40 mm [1,18]. The provisions and requirements are to be comparable for transverse FRP and steel rebars [3,7,8], while they should be justified because of the FRP bar’s lower elasticity modulus than the steel bar’s elasticity modulus [28]. Other research studies claimed that the confinement of CFRP/GFRP spirals further affected the ductility of columns compared to CFRP/GFRP ties [4,18,29].
There is a lack of a robust full-range axial load-strain model for FRP-RC columns, which is fundamental for the design and advanced analysis of FRP-RC structures. Yu-Yi et al. proposed a model for GFRP-RC columns with a circular cross-section made of conventional concrete (CC), which provided satisfactory predictions of the axial load-strain curves of these columns [30]. Saffarian et al. presented a new approach to different types of concrete, and the damage function can calculate concrete behavior for the plastic damage model [31]. Mehmet et al. proposed a finite element model based on compressive strength, tensile strength, and steel fiber (SF) ratio and obtained a methodology to predict crack patterns and failure modes of SFRC corbels [32].
The effect of concrete types on FRP-RC columns is reportedly different. FRP-HSC columns displayed slightly lower load-carrying capacities than steel-HSC columns under low to moderate eccentric loading [11,26,33]. These columns showed further capacities than steel-HSC columns at a large load eccentricity, where the eccentricity-to-diameter ratio (e/d) is 65.6%, indicating the FRP rebar’s ability to provide higher strains in high-eccentricity loading conditions [11]. Steel fiber reinforced concrete (SFRC) is the most practical and valuable in crack control, providing more crack resistance and ductility capacity [34,35]. The volume fraction of fiber (Vf) played an essential role in the compressive load capacity of SFRC. The small Vf was effective in crack control, but non-significant for the compressive load capacity of columns; however, 0.5–1.5% Vf enhanced the compressive load capacity by 4–19% [36]. Wang et al. reported that 1% Vf offered better technical benefits than other Vf [37]. In addition, the length-to-diameter ratio of fibers (l/d) positively affected the compressive load capacity of SFRC [38]. On the other hand, when Vf exceeded a specific threshold, it caused a negative result in the compressive load capacity [39]. Bayramov et al. found that if l/d falls in the range of 55 to 65, the compressive load capacity of SFRC increases for all fiber contents [40]. Several other studies concluded that using hybrid fibers, such as steel and polyvinyl alcohol fibers, improved the ultimate load, confinement, and ductility of concrete columns reinforced with GFRP rebars [33,41,42].
As indicated from the above summary, little research has introduced solutions to compensate for the lower compressive strength of GFRP-RC columns compared to steel-RC columns [24,43,44]. Given the background, this study assesses the structural behavior and response of circular concrete columns strengthened with longitudinal GFRP and transverse steel rebars under axial compressive loading. SFs were added to concrete to enhance columns’ ductility and axial capacity. A total of 16 specimens were fabricated based on the parameters of the conventional and modern materials and various configurations. Test results were compared with different theoretical equations presented in the literature. Finally, a new theoretical equation was proposed, considering axial GFRP rebars as longitudinal reinforcement and steel bars as transverse reinforcement with different spiral and hoop spacing. A modified concrete damage plastic (CDP) model for fiber-reinforced concrete (FC) columns was also proposed. This study will deepen the understanding of the structural behavior and viability of GFRP-RC columns, such as ultimate axial compressive load, ductility index (DI), and load-deflection curves.

2. Materials and Methods

2.1. Materials

2.1.1. Concrete

This study used ASTM C150 [45] Type II Portland cement and crushed coarse aggregate with a maximum size of 10 mm to produce CC and FC. Hooked-end SFs were used to improve the ductility of column specimens, as shown in Figure 1. Table 1 presents the physical and mechanical properties of the SFs used. Plastit®SPC218 (Capco; Mashhad, Iran) was used as a superplasticizer for FC to obtain homogeneous concrete mixtures. The water-to-cement ratio (w/c) was 0.45 for both CC and FC mixtures, as shown in Table 2. Slump values measured as per ASTM C143 [46] were 90 mm and 75 mm for CC and FC, respectively. Three parallel standard cylinders (150 mm diameter × 300 mm height) were fabricated for each batch of CC and FC. Each specimen was loaded at 0.28 MPa/s according to ASTM C39 [47] to obtain average strength at 28 days. The compressive strength obtained for CC and FC were 32.4 and 35.4 MPa, with standard deviations of 2.14 and 2.54 MPa, respectively.

2.1.2. Reinforcement

Steel and GFRP rebars with a diameter of 9.5 mm were used as longitudinal reinforcement. Steel bars with a diameter of 6.4 mm were used as transverse reinforcement of a circular column section. The GFRP rebars were made of E-glass fibers (85% of the volume) impregnated in thermosetting polyester resin, fillers, and additives. Table 3 summarizes the physical and mechanical properties of the steel and GFRP rebars used.

2.2. Specimen Fabrication

Sixteen circular columns were prepared in four different groups: Group I—four GFRP-reinforced conventional concrete (GRCC) specimens, Group II—four GFRP-reinforced fiber concrete (GRFC) columns, Group III—four steel-reinforced conventional concrete (SRCC) columns, and Group IV—four steel-reinforced fiber concrete (SRFC) columns. All the columns were configured laterally by steel rebars in the shape of ties (hoops) or spirals with 40 and 75 mm pitches. Table 4 shows the details of the test specimens. Each column was labeled with letters and numbers. The first letter, G or S, denotes the material type of the longitudinal rebars: GFRP or steel, respectively. The second letter, C or F, stands for the concrete type: conventional or fiber-reinforced concrete, respectively. The third letter, T or P, represents the transversal reinforcement type, tied or spiral, respectively. The number denotes the pitch of the transversal reinforcement in millimeters. These columns were tested to evaluate the effects of steel fiber, longitudinal rebar, confinement type, and transverse pitch on the structural response under a concentric loading condition. All the circular column specimens were produced in 150 mm (diameter) × 600 mm (height). The concrete cover was 25 mm. Figure 2 and Figure 3 illustrate the details of the column configuration with spirals and ties (75 mm pitch) and the cross-section of the columns, respectively. The spirals/hoops were designed to prevent the elastic buckling of longitudinal GFRP bars and the inelastic buckling of longitudinal steel bars [48]. Figure 4 shows all the reinforcement layouts considered in this study.

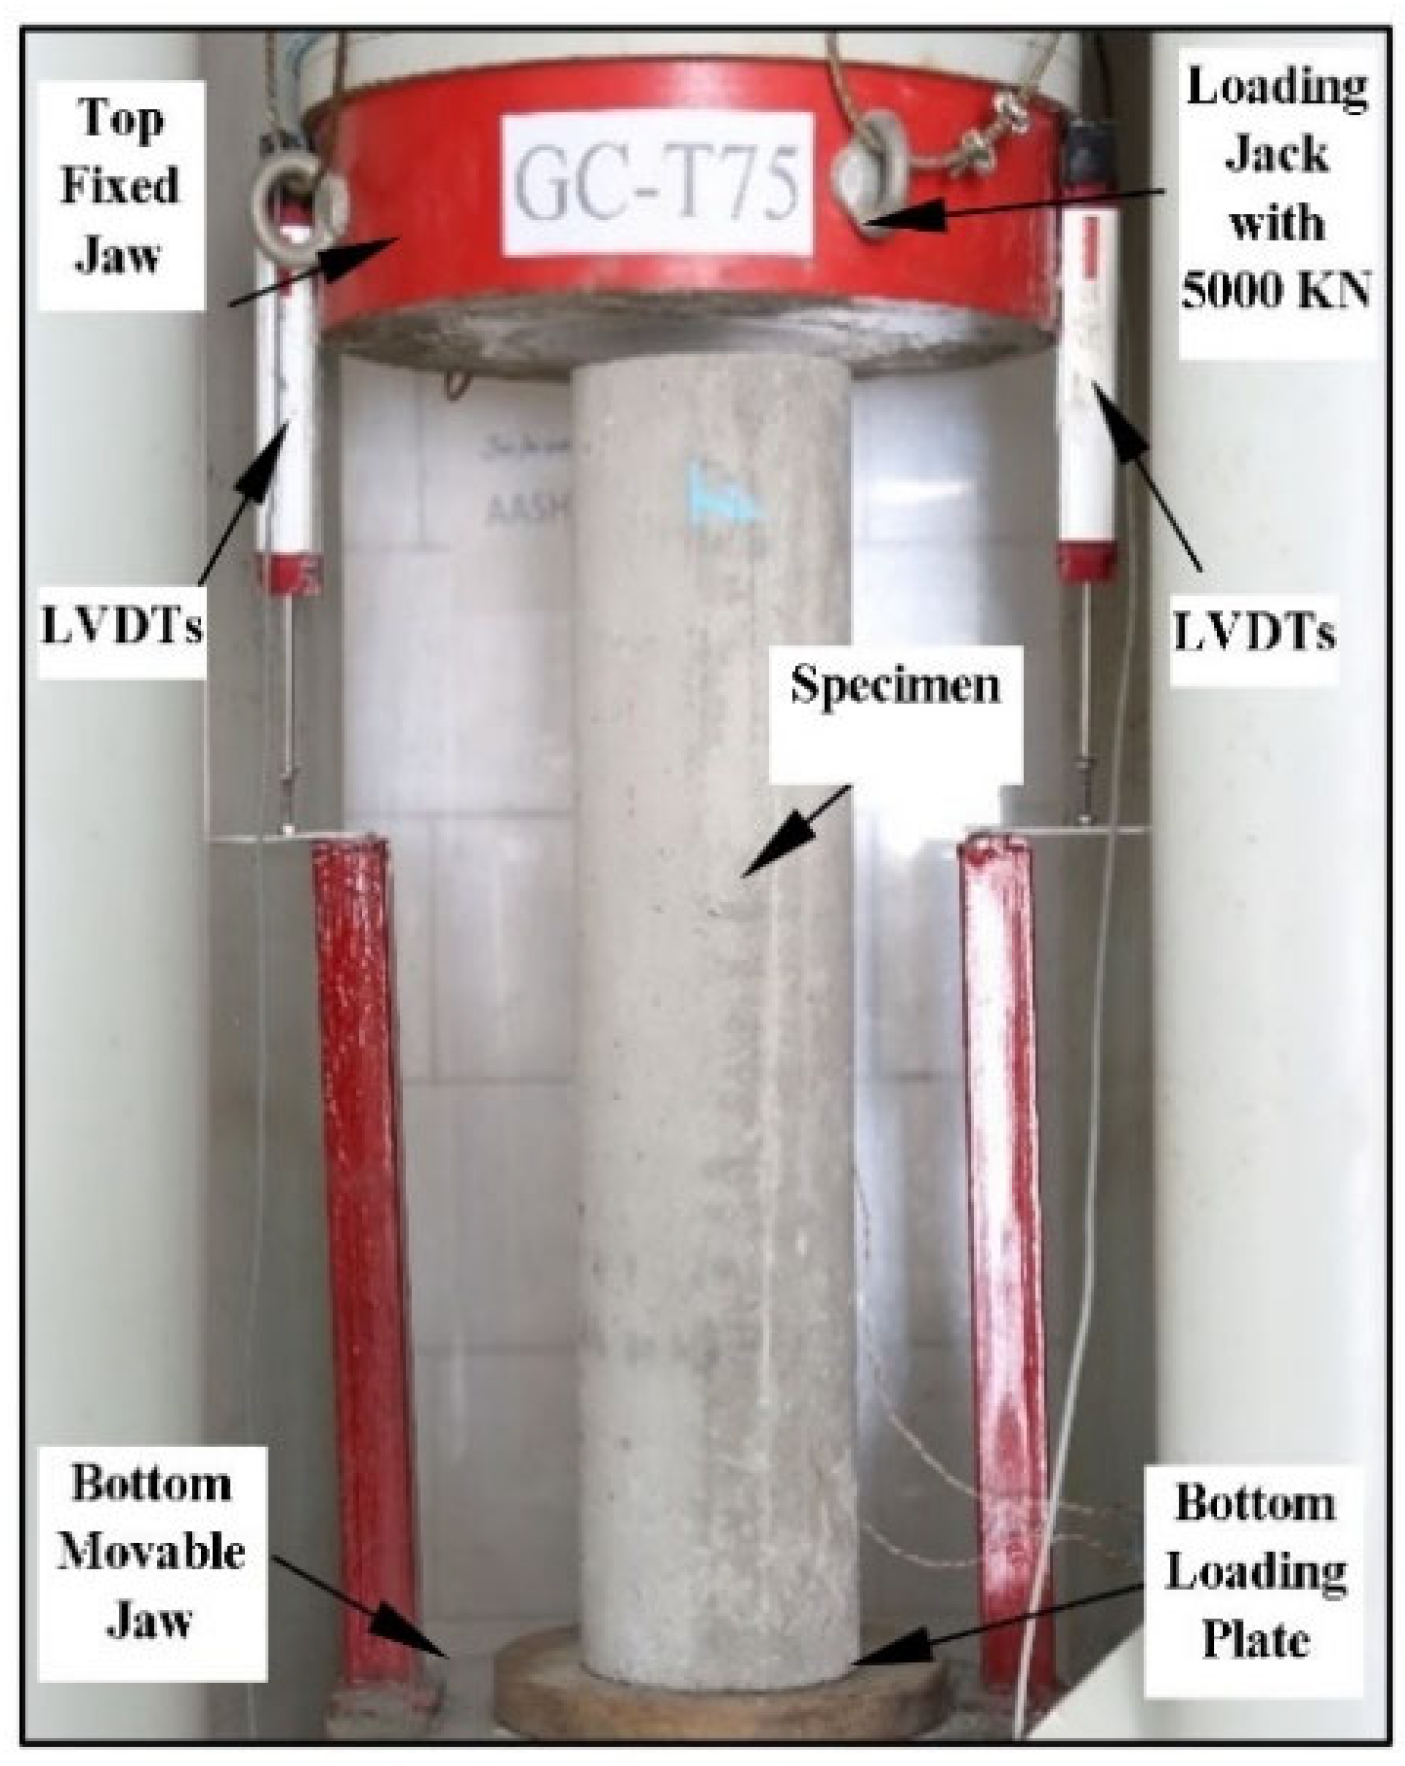
2.3. Test Setup and Instrumentation

The instrumentation included three stain gauges (PFL-20-11, TML; Tokyo, Japan) mounted at the mid-length of the longitudinal GFRP or steel bars. A data logger recorded the strain of the longitudinal bars. Before loading, the top and bottom surfaces of the column were capped with a sulfur compound to apply uniformly distributed loading to the cross-section, as shown in Figure 5. Subsequently, the columns were loaded at a rate of 10 kN/s using a compression tester with a 5000 kN capacity, given the dimensions of the specimen [47]. The lower hydraulic jaw of the testing machine was movable, while the upper one was fixed. Specimens were loaded with a concentric compressive load, as displayed in Figure 6. Two linear variable displacement transducers (LVDTs) were mounted on both sides of the column to monitor the concentric compressive deformation. The concentric load and corresponding column deformation were recorded using a data acquisition system.
Figure 2. Configuration of specimens reinforced with spirals and hoops.
Buildings 14 00988 g002
Figure 3. Reinforcements inside PVC formwork.
Buildings 14 00988 g003
Figure 4. Reinforcement layouts investigated in this study.
Buildings 14 00988 g004
Figure 5. Sulfur capping process.
Buildings 14 00988 g005
Figure 6. Column test setup.
Buildings 14 00988 g006

3. Results and Discussion

3.1. Failure Modes

Figure 7 illustrates the modes and cracking patterns of the columns after failure under axial loading. Up to 85% of the ultimate axial load, all the columns behaved relatively linearly. There was no observation of cracking in the concrete cover up to this point, and the confinement effect of lateral rebars was passive. When the axial load increased above 85% of the ultimate value, tight vertical cracks occurred in the concrete cover, and the crack width became wider as the load increased. After reaching the ultimate axial compressive load (Pu), the axial strain increased at a higher rate. At this phase, the concrete cover was spalled, and the confinement effect due to lateral rebars became activated as the longitudinal rebars yielded for both SRCC and SRFC columns. After achieving up to 75% of the ultimate axial load in the post-peak branches, the transverse steels gained maximum strength. The four groups of columns showed similar processes and modes of failure. The column failure mainly occurred in the upper half region. The longitudinal GFRP bars were fractured in GC-T75, GC-P75, GF-T75, and GF-P75 columns, while the longitudinal steel bars experienced buckling in SC-T75, SC-P75, SF-T75, and SF-P75 columns. The dominant failure modes were the lateral reinforcement rupture and concrete core crushing (GC-T40, GC-P40, GF-T40, GF-P40, SC-T40, SC-P40, SF-T40, and SF-P40).

3.2. Load-Strain Curves of Reinforcement

Figure 8a,b illustrates the load-strain curves of the longitudinal GFRP and steel rebars embedded in the column specimens under compressive axial loading, respectively. The results show that the first branches of load-strain curves were nearly linear, up to almost 85% of f c . The second branch of the curves occurred with the initiation of longitudinal cracks and concrete cover spalling. At this phase, the embedded longitudinal steel bars yielded, and the column’s axial stiffness gradually decreased, presenting a softening response. Based on the observations, the strain of the concrete and longitudinal GFRP/steel bars displayed the same behavior up to 0.25% (2500 µɛ), which is related to the initiation of concrete crushing, as revealed in previous research [4]. The average axial strain of the longitudinal GFRP bars embedded in the GRCC and GRFC columns at the peak load was 6215 µɛ and 7835 µɛ, respectively, whereas that of the longitudinal steel bars in the SRCC and SRFC columns at the peak load was 1597 µɛ and 1724 µɛ, respectively. At 85% of the peak load, the steel bar strain was significantly less than the GFRP bar strain due to the higher modulus of steel than GFRP. The steeper slope of the pre-peak branch of the load-strain curves of steel bars was apparent compared with that of the pre-peak branch of the load-strain curves of GFRP bars. All the four column groups displayed similar failure modes. The failure patterns of the longitudinal GFRP bars were interlaminar degradation in the columns having spirals/hoops with a pitch of 75 mm (GC-T75, GC-P75, GF-T75, and GF-P75). Similarly, the longitudinal steel bars were yielded because of buckling failure (SC-T75, SC-P75, SF-T75, and SF-P75). Also, the reduction of the confinement of concrete by the transverse steel bars due to the increased loading and their yielding caused a decrease in the slope of the second branch of the load-strain curve.

3.3. Ultimate Axial Load and Deformation

3.3.1. Effect of Longitudinal Bars

Table 5 shows the results of the axial compression test measured using strain gauges and LVDTs. The ultimate compressive loads and corresponding deformations of the SRCC columns were higher than those of the GRCC columns. Similarly, the SRFC specimens exhibited higher ultimate compressive load and corresponding deformation than their GRFC counterparts. The SRCC specimens, on average, obtained 19.5% further ultimate loads and 10% higher corresponding deformations compared with the GRCC specimens. Also, the SRFC columns, on average, gained 16.4% higher ultimate loads and 3.5% further corresponding deformations compared with the GRFC columns. As a result, the ultimate compression loads and corresponding deformations of the SRCC and SRFC specimens were obtained at an average of 18% and 6.8%, respectively, further compared with the GRCC and GRFC specimens. In other words, the column Groups I and II, on average, achieved the ultimate compressive loads by values of 477.77 kN and 520.08 kN, respectively, which were less than their counterpart groups, indicating that the longitudinal GFRP bars contributed less to the axial compressive loads compared with the longitudinal steel bars. Also, it showed that the decrease in the pitch of lateral rebars increased the axial compressive load of columns. On the other hand, the columns having a pitch of 40 mm, on average, displayed a 10% higher axial compressive load and a 30% further corresponding deflection compared with their counterparts with a pitch of 75 mm.

3.3.2. Effect of Steel Fibers

As shown in Figure 9, adding SFs increased the axial compressive load and corresponding deformation of the columns. For example, the GF-T75 specimen carried an axial load of 476.7 kN, 6.98% higher than its counterpart; its corresponding deflection was 3.46 mm, 2.97% greater than the GC-T75 specimen. Furthermore, the GRFC specimens, on average, gained 8.8% higher ultimate load and 19.9% higher corresponding deformation compared to the GRCC specimens. Also, the SRFC columns gained 6.2% higher ultimate load and 12.7% further corresponding deformation compared to the SRCC columns. Consequently, on average, groups II and IV achieved 7% more ultimate axial compression load and 16.3% higher corresponding deformation than their counterpart groups I and III. The ultimate axial compressive load of the SRCC and SRFC specimens ranged from 500.5 to 659.1 kN, while those of the GRCC and GRFC columns ranged from 445.6 to 551.6 kN. Among the specimens, the SF-P40 had the highest axial load capacity of 659.1 kN, whereas the GC-T75 exhibited the lowest axial load capacity of 445.6 kN. As anticipated, the FC columns were longitudinally reinforced with steel bars, and more transverse reinforcement (a spiral layout with a shorter pitch) carried more axial compressive load until failure. In comparison, the CC columns longitudinally reinforced with GFRP bars and a lesser volume of transverse reinforcement (a tied layout with a longer pitch) exhibited the lowest axial compressive load.

3.4. Axial Ductility Index

3.4.1. Effect of Longitudinal Bars

The member’s energy absorption capacity after reaching maximum axial compression load is defined as “ductility” [42]. In this study, two different formulas, i.e., Equation (1) proposed in [43,49] and Equation (2), were used to determine the DI of the columns made of CC and FC, respectively:
D I = A 85 % A 75 %
D I = A 85 % A 75 %
where A75% and A75% are the areas under load-deflection curves up to 75% of the Pu and P′u for CC and FC, respectively, which are related to the corresponding deformations δ75% and δ75% at the axial compression loads Pu75% and Pu75% in the elastic ranges, also, A85% and A85% are the areas of under load-deflection curves up to 85% of the Pu and Pu for CC and FC, respectively, which are related to the corresponding deformations δ85% and δ85% at the axial compression loads Pu85% and Pu85% in the post-peak regions of the curves. The axial DIs of all the columns are presented in Figure 10, which were calculated based on the axial load-deflection curves of the four column groups.
The results showed that the DIs of GRCC columns (GC-T75, GC-P75, GC-T40, and GC-P40) were higher than their SRCC counterparts (SC-T75, SC-P75, SC-T40, and SC-P40) by an average of 7.4%, which agreed well with the result of a previous study [43]; for instance, the DIs of GC-P75 and SC-P75 were found to be 4.21 and 3.97, respectively. Similarly, the DIs of GRFC specimens (GF-T75, GF-P75, GF-T40, and GF-P40) were higher in the order of 12.9% than their SRFC counterparts (SF-T75, SF-P75, SF-T40, and SF-P40). In addition, the DI of GF-P75 (4.57) was 0.4 higher than that of SF-P75 (4.17). Overall, longitudinal GFRP rebars were found to further contribute to obtaining higher ductility than longitudinal steel bars. Additionally, as the pitch of spiral or tied rebars decreased, the DI of the columns increased because of the well-confined GFRP and steel rebars and transversal confinement of the concrete core, which helped absorb more energy.

3.4.2. Effect of Steel Fibers

Steel fibers have high tensile strength and proven crack-bridging potential. Such characteristics of the steel fiber can be used to alter the brittle behavior of concrete under stresses to a more ductile behavior. Steel fiber-reinforced concrete was also proven to be much more ductile than normal concrete under axial loads [31,34]. Adding SFs enhanced the post-peak behavior (i.e., more softening branches) of the load-deflection curves, which coincided well with the findings of former studies [50,51]. It is also noted in Figure 10 that the concrete columns with SFs attained greater DIs than their CC counterparts. More specifically, the GRFC columns (GF-T75, GF-P75, GF-T40, and GF-P40) showed 9.2% higher DIs than the GRCC columns (GC-T75, GC-P75, GC-T40, and GC-P40). Similarly, the SRFC specimens (SF-T75, SF-P75, SF-T40, and SF-P40) obtained 4% further DIs than the SRCC columns (SC-T75, SC-P75, SC-T40, and SC-P40). Based on the findings, it is clear that using longitudinal GFRP rebars with a narrower transverse bar pitch and adding SFs in concrete improves axial DIs of columns.
Figure 10. Axial DIs of Group I, Group II, Group III, and Group IV columns.
Buildings 14 00988 g010

4. Numerical Analysis

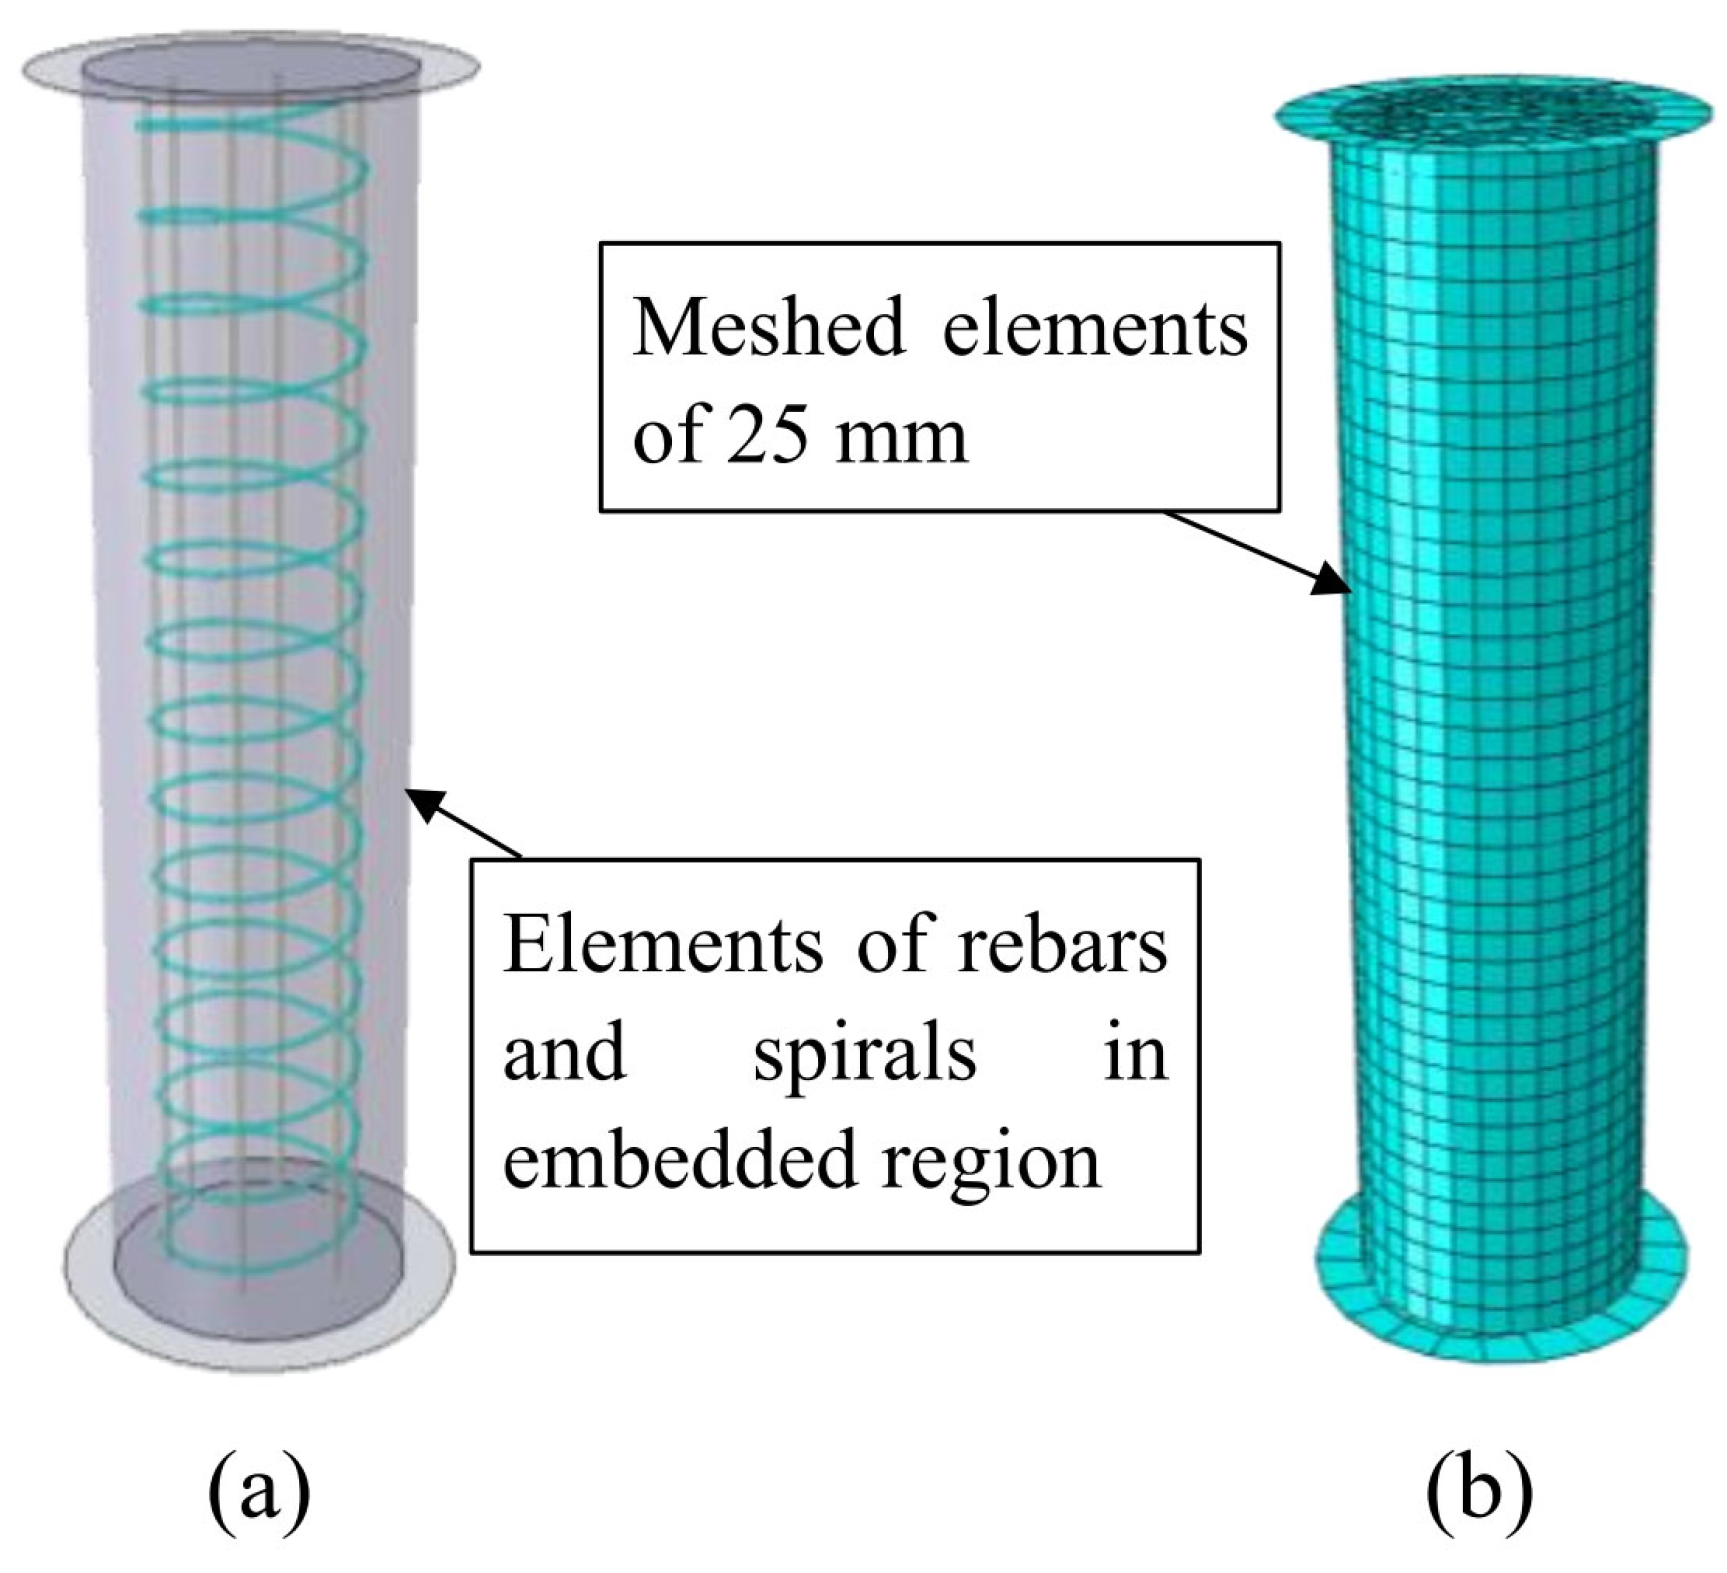
4.1. Modeling Details

A numerical analysis was conducted to assess how the behavior of axially loaded concrete columns is influenced by longitudinal GFRP and steel rebars, types of concrete, and configurations of transverse reinforcement. ABAQUS finite element (FE) software package was used to conduct a nonlinear 3D finite element analysis of the concrete columns. The interaction between the longitudinal GFRP/steel bars and concrete was simulated using the “embedded region” constraint, as depicted in Figure 11a. The concrete section was modeled with 3D solid elements, and the longitudinal bars were represented using deformable 3D truss elements. The concrete was modeled with C3D8R elements, while T3D2H elements were employed for the reinforcements [52,53,54]. All elements were meshed with a 25 mm grid, as shown in Figure 11b. The CDP and modified CDP models were utilized to identify damage patterns in the CC and FC, respectively. The longitudinal GFRP bars were considered to be linear elastic. The column’s bottom was fully restrained, while the column’s top was free to move along the longitudinal axis. To prevent the discontinuity of stress and strain distributions and ensure accurate predictions, a sensitivity analysis of the load-deflection curve of the control model was performed for different mesh sizes. Mesh sizes of 20, 25, 30, and 40 mm were considered, and 25 mm provided the best fitting between the test results and FE predictions. Displacement control was applied by gradually displacing the column top by 8 mm along the longitudinal axis, equivalent to the load rate of 10 kN/s adopted in the experimental program. Discrete rigid plates were modeled for the top and bottom surfaces of the column to apply uniform displacement. The contact between the plate and column was modeled using the “tie” constraint. A Poisson’s ratio of 0.2 was used [55]. The modulus of elasticity was determined using 4734 f c [56], where f c = 32.4 and 35.9 MPa for CC and FC, respectively. The nonlinear and irreversible damaging behavior of concrete was simulated using the CDP and modified CDP models for CC and FC, respectively, considering the isotropic compressive/tensile plasticity and isotropic damage plasticity [53,57].

4.2. Simulation of Reinforcements

The simulation of all rebars in the columns was conducted using 3D truss elements and the embedded region constraint in the software. Various characteristics of GFRP rebars and steel rebars are outlined in Table 3. The Poisson’s ratio was 0.3 for steel rebars [58,59] and 0.25 for GFRP bars [60]. The simulation of the rebar’s compression behavior until failure was defined as linear elastic for GFRP bars [58,60] and elastoplastic for steel rebars [55,61]. The concentric compressive strength of GFRP rebar (ffc) was considered to be half of its tension ultimate strength (ffu) [62]. Stress-strain curves illustrating the behavior of steel and GFRP rebars under tensile loadings are provided in Figure 12.

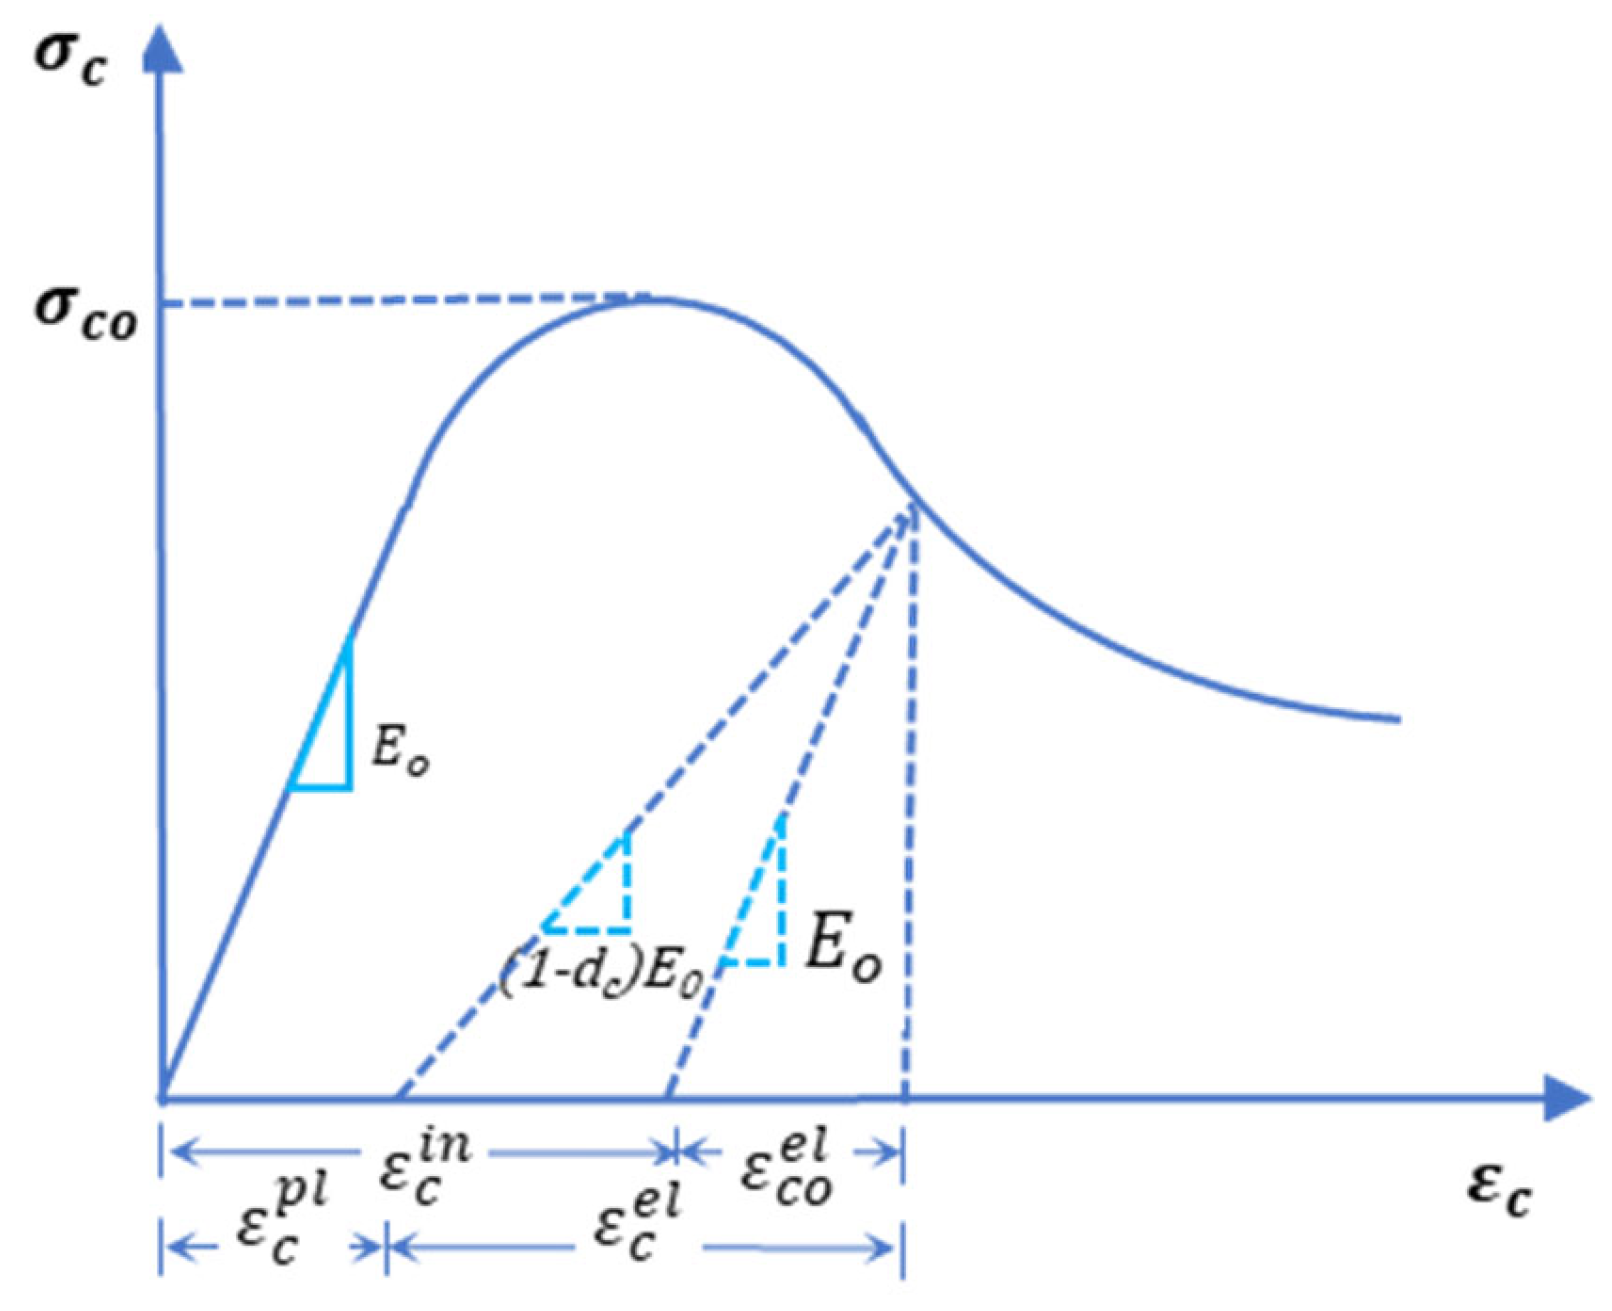
4.3. Plasticity Behavior of CC and FC

The CDP and modified CDP models identified several key parameters for conventional concrete and fiber-reinforced concrete, respectively. These parameters include the plastic potential eccentricity of concrete ( e c ,   e c s f ), the shape factor of the yielding surface in the deviatoric plane ( K c ,   K c s f ), the viscosity parameter ( μ c   a n d   μ c s f ), the dilation angle ( ψ c ,   ψ c s f ), and the ratio of compressive stress in the biaxial state to that in the uniaxial state ( σ b o / σ c o ,   σ b o s f / σ c o s f ) for CC and FC, respectively. The parameters e c and e c s f were set to a default value of 0.1 [52], while the values of K c   and K c s f   ranged between 0.64 and 0.80 [63]. For CC, a favorable strength prediction is achieved under low hydrostatic stresses with a Kc value of 0.67, and under high hydrostatic stresses, an acceptable prediction is obtained with a Kc value of 0.70. Based on the provided information, the values of 0.69 and 0.70 were selected for CC and FC, respectively [52,55]. The parameters σ b o / σ c o and σ b o s f / σ c o s f were assigned values of 1.16 and 1.40 for CC and FC, respectively [52].
The flow rule is governed by the parameter ψ c , which is a crucial factor for simulating concrete in ABAQUS. This parameter represents the plastic volumetric strains of CC, which are less for FC due to the effective matrix and confining mechanism. Both ψ c and ψ c s f denote the concrete’s plastic volumetric strains, which fell within between 31° and 42°. Notably, it was observed that the ψ c [64] of CC was higher than the ψ c s f of SFRC due to the influence of the flow rule [42]. The parameters μ c and μ c s f were determined to achieve satisfactory agreement with test properties, resulting in values of 0.009 and 0.0068 for CC and FC, respectively.

4.4. Compressive Behavior of CC and FC

To represent the nonlinear deformation of concrete, total strain (ε) was defined by Equation (3), based on the elastic-plastic theory and encompassing parameters for concrete elastic strain (εel) and plastic strain (εpl):
ε = ε e l + ε p l
The nonlinear behavior of concrete was characterized by the plastic strain induced by compression and tension damage. Therefore, an accurate simulation of plasticity and damage to the concrete had to be performed. As the stiffness of concrete degraded, strain in concrete increased, leading to the growth of concrete strain and the evolution of concrete damage, defined by elastic strain (εel) and plastic strain (εpl) [52]. The simulation of concrete’s nonlinear behavior was facilitated by the CDP model in the software, incorporating parameters such as axial compressive damage (dc) and axial tensile damage (dt). The relationship between stress and strain for concrete under compression, as illustrated in Figure 13, can be expressed by Equation (4):
σ c = ( 1 d c ) E o ( ε c ε c p l )
where Eo denotes the elastic modulus of CC and FC, calculated according to ACI 318–95 [56], ε c and ε c p l represent the compressive strain and the compressive plastic strain for CC and FC, respectively. The parameter dc was identified by Equation (5), proposed by Wang and Chen [65]:
d c = 1 e 1 / m c 1 ( e ε c , n o r m i n / m c 1 )
where m c is the control parameter for the rate of concrete damage evolution in compression (0.1). For CC [66], ε c , n o r m i n is the concrete inelastic strain normalized in compression and is equal to ε c i n / ε c u i n . ε c u i n is the strain corresponding to the concrete ultimate inelastic strain in compression by an amount of 0.033 for CC [66]. m c s f is the modified parameter of m c in compression for FC, based on the physical properties of SF [65], as given by Equation (6):
m c s f = m c 1 + a m 1 λ s f
where λ sf = Vsf (lsf/dsf) is the SF reinforcing index, with Vsf and lsf/dsf representing the volume percentage and aspect ratio (length/diameter) of the SF, respectively. Additionally, the coefficient of am1 is determined based on the characteristic of SF, with a specified value of 0.452 [65].

4.5. Tensile Behavior of CC and FC

Several models proposed in the literature [61,67,68] describe the tensile stress-strain behavior of CC and FC, presenting suggested models that include hardening and/or softening branches of strains. The hardening branch characterizes pre-peak behavior, while the post-peak behavior is depicted by the softening branch during plastic flow [69]. It is noteworthy that incorporating SF into concrete enhances ductility and influences the post-peak behavior of concretes, resulting in higher tensile strength for FC compared to CC. The stress-strain behavior of CC/FC under tension is generally represented by Equation (7), as shown in Figure 14.
σ t = 1 d t E o ε t ε t p l
where ε t and ε t p l denote the tensile strain and the plastic of the tensile strain for CC and FC, respectively. The parameter dt was defined using Equation (8), proposed by Wang and Chen [65]:
d t = 1 e 1 / m t 1 ( e ε t , n o r m c k / m t 1 )
where parameter mt is the controlling the parameter for the rate of concrete damage evolution in tension stresses and has a value of 0.05. For CC [66], ε t , n o r m c k is the concrete inelastic strain normalized in tension stresses and is equal to ε t c k / ε t u c k , where ε t u c k is the strain corresponding to the concrete ultimate inelastic strain in tension stresses by an amount of 0.0033 for CC [66]. m t s f is the modified parameter of the m t in tension stresses for FC, as given by Equation (9).
m t s f = m t 1 + a m 2 λ s f
where the coefficient of am2 is derived based on the characteristic of SF in tension with a value of 0.628 [52]. Figure 15 illustrates the CDP and modified CDP model of the four columns from each group.

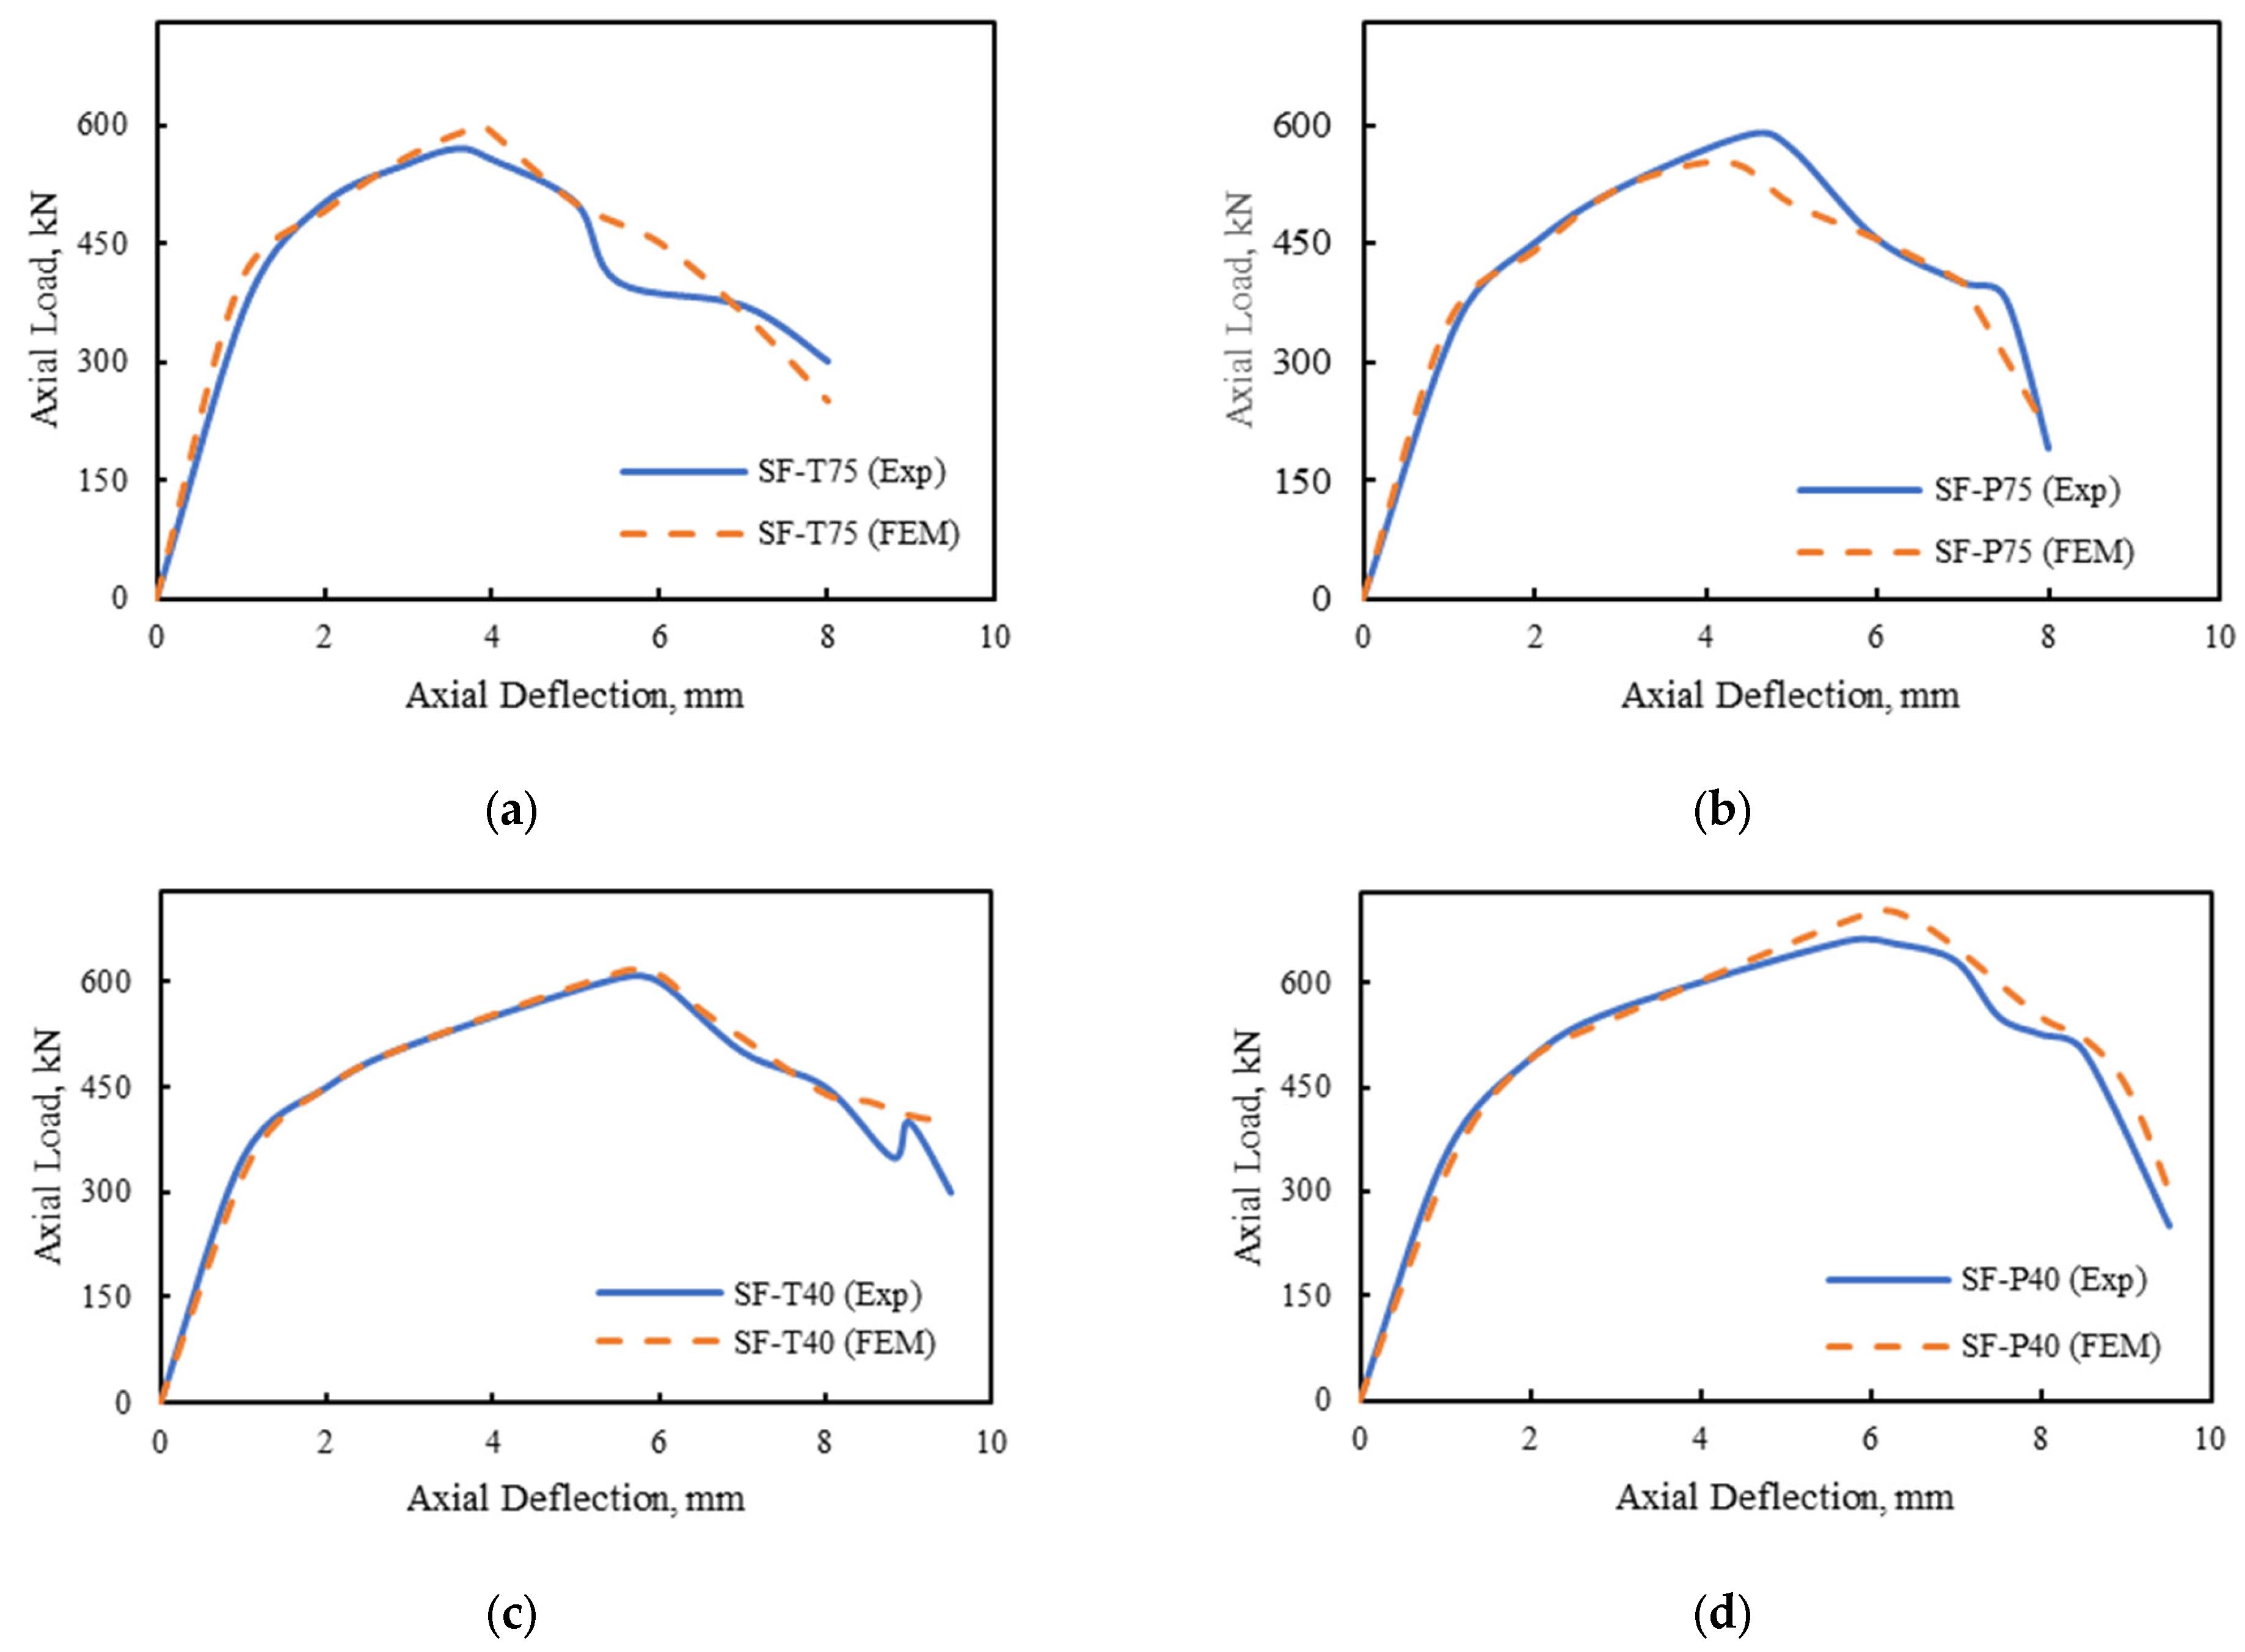
4.6. Comparative Study of Experimental and FE Results

The comparison of the experimental and FE results for the maximum compressive load and the corresponding deflection of the columns is presented in Table 6. Subsequently, the results of all columns based on the main four groups and their averages were analyzed. The average errors of the axial compression load were 1.09%, 2.57%, 0.71%, and 1.79% for GRCC, GRFC, SRCC, and SRFC columns, respectively. Additionally, the discrepancy of the corresponding deflection with the axial compressive ultimate load was, on average, 2.44%, 1.77%, 0.91%, and 1.77% for GRCC, GRFC, SRCC, and SRFC columns, respectively. The higher discrepancies were observed in the GRFC and SRFC columns for the axial compression load, suggesting a potential need for further research on accurate modeling of the FC parameters. Most FE results were higher than experimental results in the axial load and corresponding deflection, possibly due to the geometric and implementation imperfections during the manufacturing process of the specimens, which were not considered in the simulation. This includes small fluctuations in the dimensions of PVC formwork for concretes. The FE simulation of the GF-T75 column displayed a maximum discrepancy of 6.65%, while the FE of SC-T40 presented a minimum discrepancy of 1.15% for the axial compression load. The FE simulation revealed a maximum discrepancy of 5.99% for the SC-P75 specimen. Additionally, the FE analysis of SF-T40 exhibited a minimum discrepancy of 1.66% for the corresponding deflection in axial compression load. Figure 16 provides the comparison of experimental and FE results for the axial maximum compression load.
The load-deflection curves of all columns, measured from experiments and predicted by FE analysis, are depicted in Figure 17, Figure 18, Figure 19 and Figure 20. These curves illustrate that the proposed FEM accurately predicts the load-deflection behavior of columns in elastic regions, as observed in GC-T75, GC-P75, GC-T40, GF-T40, and SF-T75 specimens. Additionally, they reveal discrepancies in the post-peak branches of columns such as GF-T75, GF-T40, SC-P40, and SF-P40 columns. The deviations presented by the FE results in the post-peak branches may be attributed to the definition of GFRP bar degradation, FC damage mechanisms, or the interaction between them. Further research on these matters can enhance the accuracy of the results. However, the overall agreement of load-deflection curves for specimens was deemed acceptable with the suggested numerical method. The simulation of crack patterns in ABAQUS can accurately represent positive principal plastic strains, as the cracks’ direction is perpendicular to these strains in CC and FC [54,70,71].
Figure 16. Comparison of experimental and FE results of the ultimate axial load.
Buildings 14 00988 g016
Figure 17. Load-deflection curves of columns measured from experiments and predicted from FE analysis for group I (GRCC): (a) GC-T75 column, (b) GC-P75 column, (c) GC-T40 column, and (d) GC-P40 column.
Buildings 14 00988 g017
Figure 18. Load-deflection curves of columns measured from experiments and predicted from FE analysis for group II (GRFC): (a) GF-T75 column, (b) GF-P75 column, (c) GF-T40 column, and (d) GF-P40 column.
Buildings 14 00988 g018aBuildings 14 00988 g018b
Figure 19. Load-deflection curves of columns measured from experiments and predicted from FE analysis for group III (SRCC): (a) SC-T75 column, (b) SC-P75 column, (c) SC-T40 column, and (d) SC-P40 column.
Buildings 14 00988 g019
Figure 20. Measured and predicted load-deflection curves for Group IV (SRFC): (a) SF-T75 column, (b) SF-P75 column, (c) SF-T40 column, and (d) SF-P40 column.
Buildings 14 00988 g020
Consequently, the failure mode shapes and cracking patterns of the four groups in this study were portrayed based on these strains. In the initial stage, the cover spalling of CC and FC, albeit with a delay, commenced along the yielding of rebars. Due to the closer modulus of elastic GFRP rebars with CC and FC, assuming a perfect bond between them appeared effective compared to the steel reinforcement and concretes. Therefore, favorable interactions were observed in the composite section between the GFRP rebars with CC and FC.

5. Theoretical Equation

5.1. Axial Load of Columns in the Literature

As stated previously, some studies, such as Hadhood et al. [10,72], proposed the columns’ nominal axial load with FRP longitudinal rebars as Equation (10), in which FRP rebars’ contribution to the load of the columns is neglected.
P p r e d = α 1 f c ( A g A f )
where P p r e d is the nominal load corresponding to the first peak load, α 1 is the reduction factor, which is 0.85, f c is the compressive strength of concrete, A g is the area of the concrete’s gross section, and A f is the area of FRP longitudinal reinforcement. Some researchers proposed various philosophies to consider the contribution of the FRP bars to the FRP-RC column’s capacities. Some of them suggested equations to determine a reduction factor for the low axial compression load of GFRP rebars in columns compression capacities, as presented by Afifi et al. [1] and Tobbi et al. [73] in Equation (11):
P p r e d = α 1 f c A g A f + α f f f u A f
where α f is the ratio of the axial compressive strength to the tensile strength of GFRP rebars, which is 0.35, f f u is the GFRP rebar’s tensile strength. The nominal axial compression load of the columns was calculated to be 24% higher than the compression load of GFRP-RC columns obtained in this test on average. Some other researchers proposed the contribution of GFRP bars based on the compressive strain of concrete [72]. In this approach, suggested equations adopted the GFRP bar’s strains to calculate their contribution to the load of GFRP-RC columns. Maranan et al. [29,72] presented Equation (12):
P p r e d = α 2 f c A g A f + 0.002 E f t A f
where α 2 is the reduction factor, which is 0.9, and E f t is the tensile modulus of elasticity of GFRP bars. According to the strain compatibility between the concrete and GFRP bar, the rebar strain was equal to the ultimate concrete strain, which varied between 0.2 and 0.35% [72].

5.2. Proposed Equation for Axial Compressive Load

Some researchers suggested equations to predict the GFRP-RC column’s axial compressive load without considering the confinement effect of transversal reinforcements [1,4,17,74,75,76,77]; some others proposed only equations considering lateral confinements of FRP bars as lateral reinforcements [74,75]. Generally, the lateral confinement of the spiral/hoop is activated after the spalling of the concrete cover, increasing the DI and axial compression load of columns. In the elastic region of the column’s stress-strain curve and before the concrete cover spalling, the confinement of transversal rebars is ineffective due to their low axial strain; then, it is activated at higher axial strain [42]. The dilation of the concrete core is delayed by restraining the lateral pressure by the spiral and hoop, which enhances the ductility and axial compression load of the columns. In conclusion, the lateral confinement effect of the transversal reinforcement should be considered in RC columns’ axial load calculations. According to ACI 318-14 (18.12.7.5), the transversal steel reinforcement ratio by considering the length of spirals/hoops of the wrapped circular section is given in Equation (13):
ρ s = 0.45 f c f y s A g A c o r e 1
where ρ s is the transversal steel reinforcement ratio, f y s is the yield stress of spiral/hoop reinforcement, and A c o r e is the section area of the concrete core of the RC column based on a diameter measured out-to-out of spiral and hoop rebar.
Figure 21 shows the effect of the confinement due to steel spirals. The lateral pressure (f2) developed due to the lateral steel spirals can be presented in Equations (14) and (15):
f 2 = 2 α s f y s D c S
P c s = 2 ρ s f y s A c o r e
where f 2 is the applied lateral pressure, a s is the cross-sectional area of lateral rebar, D c   is the core diameter, and S is the pitch of the spiral. Pcs is the tolerable axial load due to transversal steel reinforcement in concrete columns.
The applied lateral pressure due to hoop rebars is calculated by the same process [78]. The other materials that tolerate the axial compressive load in the GFRP-RC columns are concrete and longitudinal rebars; their terms are:
P c c = α 1 f c A g
P c f = 0.0035 E f t + A f
where Pcc is the tolerable axial load due to concrete compressive strength in concrete columns, and Pcf is the tolerable axial load due to GFRP longitudinal rebars in concrete columns. The predicted total axial load of the concrete column can be calculated as follows:
P p r e d = P c c + P c s + P c f
A new equation was proposed to compute the axial compressive load or capacity of the GFRP-RC columns, as represented by Equation (19). The analyzed general regression and curve fitting of the test results were used in MATLAB to achieve the best compatibility for the studied GRCC and GRFC columns. This equation is presented for hybrid reinforced columns after the spalling of the concrete cover. These columns are embedded with GFRP rebar as a longitudinal rebar and steel rebar as a transversal reinforcement.
P p r e d = A c o r e A f ( α 1 f c + 2 k a ρ s f y s ) + 0.0035 E f t A f
where k a is the effectiveness factor of spiral and hoop rebars obtained in tests by 1 and 0.95, respectively, f y s is the steel’s yielding stress of spiral/hoop reinforcement, and f c is the compressive strength of CC and FC.
According to the test results, the column’s compressive capacity depended on the priority of effectivity, including the compressive strength of concrete and pitches and the type of transversal reinforcements. It should be noted that the effect of SF was macroscopically considered in the compressive strength of concrete, i.e., f c was 32.4 MPa and 35.9 MPa for CC and FC, respectively. The other significant parameter in the proposed equation was the transversal steel reinforcement ratio. As shown in Table 7, the ultimate compressive loads of GC-T40 and GC-P40 were obtained by Equation (19) further to the compressive loads of their counterpart columns, i.e., GC-T75 and GC-P75. On the other hand, Equations (3)–(5) were predicted by constant values of 474 kN, 676.2 kN, and 546 kN, respectively. As can be seen, different types and pitches of the lateral rebars were almost neutral parameters on the compressive strength of concrete columns for these equations.
The lateral rebar strain was low in the elastic region, while the concrete cover was spalling in concrete columns. The lateral steel strain increased by continuing loading in the nonelastic region, while the concrete cover region (Ag—Acore) did not contribute to enduring the compressive loading anymore. In other words, when lateral rebars were activated, the spalling of concrete cover had already occurred; thus, Acore was used instead of Ag in the theoretical proposed equation. Other equations were not considered, either the lateral confinement effect of transversal reinforcement or the spalling of concrete cover. As a result, the proposed equation had the best adaptability and lowest differences with experimental results.
As shown in Table 7, the proposed Equation (12) has an average error of 5%, and other relationships (relationships 3, 4, and 5) have an average error of 20% compared to the experimental results. On the other hand, the average error of the proposed relationship was 7%, and the average error of others’ relationships was 18% compared to the numerical analysis results. This shows that the proposed relationship is numerically and analytically superior to the equations of others.

6. Conclusions and Recommendations

This study investigated the compression behavior of circular GFRP-RC columns and compared them with steel-RC columns. A total of 16 short-scale columns were provided to study the effect of four parameters: longitudinal rebar types (GFRP and steel), concrete types (FC and CC), lateral rebar volumetric ratios, and configurations of lateral reinforcement (spiral and hoop). Based on the experimental, numerical, and theoretical results obtained in this study, the following conclusions can be drawn:
  • The SRCC and SRFC columns, on average, achieved 19.5% and 16.4% higher peak loads than their counterpart groups (GRCC and GRFC). These indicate that GFRP rebars had a lower contribution in the axial load-carrying of columns than steel rebars.
  • DIs of GRCC and GRFC columns were higher (up to 7.4% and 12.9%) than their counterpart columns (SRCC and SRFC), indicating that the columns reinforced by GFRP rebars were more ductile than columns reinforced by steel rebars.
  • Adding steel fibers into concrete columns (GRFC and SRFC) increased peak loads by 8.8% and 6.2% compared with columns with conventional concrete (GRCC and SRCC). Furthermore, SFs attained increases of 9.2% and 4% in DIs of GRFC and SRFC columns as compared with their counterpart columns (GRCC and SRCC). The improvement of the post-peak behavior (the softening branch) of the load-deflection curve raised the DIs of these columns.
  • The modified CDP model of GRFC and SRFC specimens had slight discrepancies with experimental results, with an average difference of 2.57% and 1.79% for peak loads and average discrepancies of 2.52% and 4.4% for the corresponding deflections at peak loads. Also, FE predictions were compatible with the experimental results for load-deflection curves and failure modes.
  • According to the proposed theoretical equation, columns having a pitch of 40 mm displayed an average of 15% higher ultimate loads than that obtained counterpart columns with a pitch of 75 mm, as well as columns with spirals obtained, on average, 1.5% further peak loads than counterpart columns with hoops. This equation performed well over the test measurements of investigated compression columns by considering the axial involvement of GFRP longitudinal rebars, steel-spiral/hoop rebar, and reinforcement volumetric ratio. The comparative investigations accredit the applicability of the proposed theoretical equation for GRCC and GRFC columns.
The proposed equation (Equation (12)) was compared with similar equations (Equations (3)–(5)). The discrepancy from the experimental results was 20% on average for the similar equations and 5% for the proposed equation. Furthermore, based on the modified CDP model results, these average discrepancies for the proposed and similar equations were 7% and 18%, respectively. Therefore, both theoretical and numerical methods verified the superiority of the proposed equation over similar equations.
This study assessed the structural behavior of circular SFRC-RC columns reinforced with GFRP bars. The experimental and numerical results demonstrated that conventional structures/members, such as bridge piers, can potentially be replaced with new concrete and reinforcing materials while expecting better mechanical properties and durability under different environmental conditions and loadings.

Author Contributions

Conceptualization, S.F.S.; methodology, S.F.S.; validation, I.S.; formal analysis, I.S. and M.P.; investigation, S.F.S.; data curation, M.P.; writing—original draft preparation, S.F.S. and I.S.; writing—review and editing, M.P. and J.H.Y.; visualization, I.S.; supervision, S.F.S. and J.H.Y.; project administration, M.P. and J.H.Y.; funding acquisition, J.H.Y. All authors have read and agreed to the published version of the manuscript.

Funding

This research was partly supported by a grant (20014561) of the Regional Customized Disaster-Safety R&D Program, funded by the Ministry of Interior and Safety (MOIS, Republic of Korea).

Data Availability Statement

Data are contained within the article.

Conflicts of Interest

The authors declare no conflicts of interest.

References

  1. Afifi, M.Z.; Mohamed, H.M.; Benmokrane, B. Axial Capacity of Circular Concrete Columns Reinforced with GFRP Bars and Spirals. J. Compos. Constr. 2014, 18, 04013017. [Google Scholar] [CrossRef]
  2. Xiong, Z.; Mai, G.; Qiao, S.; He, S.; Zhang, B.; Wang, H.; Zhou, K.; Li, L. Fatigue bond behavior between basalt fibre-reinforced polymer bars and seawater sea-sand concrete. Ocean. Coast. Manag. 2022, 218, 106038. [Google Scholar] [CrossRef]
  3. Mai, G.; Li, L.; Chen, X.; Xiong, Z. Fatigue performance of basalt fiber-reinforced polymer bar-reinforced sea sand concrete slabs. J. Mater. Res. Technol. 2022, 22, 706–727. [Google Scholar] [CrossRef]
  4. Salah-Eldin, A.; Mohamed, H.M.; Benmokrane, B. Axial–Flexural Performance of High-Strength-Concrete Bridge Compression Members Reinforced with Basalt-FRP Bars and Ties: Experimental and Theoretical Investigation. J. Bridge Eng. 2019, 24, 04019069. [Google Scholar] [CrossRef]
  5. GB50608; Technical Code for Infrastructure Application of FRP Composites. China Planning Press: Beijing, China, 2010.
  6. CAN/CSA, S806-12; Design and Construction of Building Components with Fiber-Reinforced Polymers. Canadian Standards Association (CSA): Mississauga, ON, Canada, 2017.
  7. AS 3600: 2018; Concrete Structures. Australian Standards (AS): Sydney, Australia, 2018.
  8. ACI 440. 1R-15; Guide for the Design and Construction of Structural Concrete Reinforced with Fiber-Reinforced Polymer (FRP) Bars. American Concrete Institute (ACI); Committee Fiber Reinforced Plastic Reinforcement: Farmington Hills, MI, USA, 2015.
  9. Khorramian, K.; Sadeghian, P. Experimental and Analytical Behavior of Short Concrete Columns Reinforced with GFRP Bars under Eccentric Loading. Eng. Struct. 2017, 151, 761–773. [Google Scholar] [CrossRef]
  10. Hadhood, A.; Mohamed, H.M.; Ghrib, F.; Benmokrane, B. Efficiency of glass-fiber reinforced-polymer (GFRP) discrete hoops and bars in concrete columns under combined axial and flexural loads. Compos. Part B Eng. 2017, 114, 223–236. [Google Scholar] [CrossRef]
  11. Hadhood, A.; Mohamed, H.M.; Benmokrane, B. Strength of circular HSC columns reinforced internally with carbon-fiber-reinforced polymer bars under axial and eccentric loads. Constr. Build. Mater. 2017, 141, 366–378. [Google Scholar] [CrossRef]
  12. Maranan, G.B.; Manalo, A.C.; Benmokrane, B.; Karunasena, W.; Mendis, P. Behavior of concentrically loaded geopolymer-concrete circular columns reinforced longitudinally and transversely with GFRP bars. Eng. Struct. 2016, 117, 422–436. [Google Scholar] [CrossRef]
  13. Hadi, M.N.; Karim, H.; Sheikh, M.N. Experimental Investigations on Circular Concrete Columns Reinforced with GFRP Bars and Helices under Different Loading Conditions. J. Compos. Constr. 2016, 20, 04016009. [Google Scholar] [CrossRef]
  14. Mohamed, H.M.; Afifi, M.Z.; Benmokrane, B. Performance Evaluation of Concrete Columns Reinforced Longitudinally with FRP Bars and Confined with FRP Hoops and Spirals under Axial Load. J. Bridge Eng. 2014, 19, 04014020. [Google Scholar] [CrossRef]
  15. Tobbi, H.; Farghaly, A.S.; Benmokrane, B. Concrete Columns Reinforced Longitudinally and Transversally with Glass Fiber-Reinforced Polymer Bars. ACI Struct. J. 2012, 109, 551–558. [Google Scholar]
  16. De Luca, A.; Matta, F.; Nanni, A. Behavior of Full-Scale Glass Fiber-Reinforced Polymer Reinforced Concrete Columns under Axial Load. ACI Struct. J. 2010, 107, 589–596. [Google Scholar]
  17. Tobbi, H.; Farghaly, A.S.; Benmokrane, B. Behavior of Concentrically Loaded Fiber-Reinforced Polymer Reinforced Concrete Columns with Varying Reinforcement Types and Ratios. ACI Struct. J. 2013, 111, 375–386. [Google Scholar]
  18. Afifi, M.Z.; Mohamed, H.M.; Benmokrane, B. Strength and Axial Behavior of Circular Concrete Columns Reinforced with CFRP Bars and Spirals. J. Compos. Constr. 2013, 18, 04013035. [Google Scholar] [CrossRef]
  19. Elchalakani, M.; Ma, G. Tests of glass fiber-reinforced polymer rectangular concrete columns subjected to concentric and eccentric axial loading. Eng. Struct. 2017, 151, 93–104. [Google Scholar] [CrossRef]
  20. Hadi, M.N.; Youssef, J. Experimental investigation of GFRP-RC and GFRP encased square concrete specimens under axial and eccentric load, and four point bending test. J. Compos. Constr. 2016, 20, 04016020. [Google Scholar] [CrossRef]
  21. Zadeh, H.J.; Nanni, A. Design of RC columns using glass FRP reinforcement. J. Compos. Constr. 2012, 17, 294–304. [Google Scholar] [CrossRef]
  22. Guérin, M.; Mohamed, H.M.; Benmokrane, B.; Shield, C.K.; Nanni, A. Effect of glass fiber-reinforced polymer reinforcement ratio on axial-flexural strength of reinforced concrete columns. ACI Struct. J. 2018, 115, 1049–1061. [Google Scholar] [CrossRef]
  23. Guérin, M.; Mohamed, H.M.; Benmokrane, B.; Nanni, A.; Shield, C.K. Eccentric behavior of full-scale reinforced concrete columns with glass fiber-reinforced polymer bars and ties. ACI Struct. J. 2018, 115, 489–499. [Google Scholar] [CrossRef]
  24. Hadi, M.N.; Ahmed, H.; Sheikh, M.N. Effect of Using GFRP Reinforcement on the Behavior of Hollow-Core Circular Concrete Columns. Compos. for Constr. 2020, 25, 06020003. [Google Scholar] [CrossRef]
  25. Sun, L.; Wei, M.; Zhang, N. Experimental study on the behavior of GFRP reinforced concrete columns under eccentric axial load. Constr. Build. Mater. 2017, 152, 214–225. [Google Scholar] [CrossRef]
  26. Hadi, M.N.; Hasan, H.A.; Sheikh, M.N. Experimental Investigation of Circular High-Strength Concrete Columns Reinforced with Glass Fiber-Reinforced Polymer Bars and Helices under Different Loading Conditions. J. Compos. Constr. 2017, 21, 04017005. [Google Scholar] [CrossRef]
  27. Karim, H.; Sheikh, M.N.; Hadi, M.N. Axial load-axial deformation behavior of circular concrete columns reinforced with GFRP bars and helices. Constr. Build. Mater. 2016, 112, 1147–1157. [Google Scholar] [CrossRef]
  28. Hales, T.A.; Pantelides, C.P.; Reaveley, L.D. Experimental evaluation of slender high-strength concrete columns with GFRP and hybrid reinforcement. J. Compos. Constr. 2016, 20, 04016050. [Google Scholar] [CrossRef]
  29. Maranan, G.B.; Manalo, A.C.; Benmokrane, B.; Karunasena, W.; Mendis, P. Evaluation of the flexural strength and serviceability of geopolymer concrete beams reinforced with glass-fibre-reinforced polymer (GFRP) bars. Eng. Struct. 2015, 101, 529–541. [Google Scholar] [CrossRef]
  30. Ye, Y.Y.; Zhuge, Y.; Smith, S.T.; Zeng, J.J.; Bai, Y.L. Behavior of GFRP-RC columns under axial compression: Assessment of existing models and a new axial load-strain model. Build. Eng. 2022, 47, 103782. [Google Scholar] [CrossRef]
  31. Saffarian, I.; Atefatdoost, G.R.; Hosseini, S.A.; Shahryari, L. Experimental research on the behavior of circular SFRC columns reinforced longitudinally by GFRP rebars. Comput. Concr. 2023, 31, 513–525. [Google Scholar]
  32. Gulsan, M.E.; Cevik, A.; Mohmmad, S.H. Crack pattern and failure mode prediction of SFRC corbels: Experimental and numerical study. Comput. Concr. 2021, 28, 507–519. [Google Scholar]
  33. Hasan, H.A.; Sheikh, M.N.; Hadi, M.N. Performance evaluation of high strength concrete and steel fiber high strength concrete columns reinforced with GFRP bars and helices. Constr. Build. Mater. 2017, 134, 297–310. [Google Scholar] [CrossRef]
  34. Kaufmann, W.; Amin, A.; Beck, A.; Lee, M. Shear transfer across cracks in steel fibre reinforced concrete. Eng. Struct. 2019, 186, 508–524. [Google Scholar] [CrossRef]
  35. Lawler, J.S.; Zampini, D.; Shah, S.P. Permeability of cracked hybrid fiber-reinforced mortar under load. ACI Mater. J. 2002, 99, 379–385. [Google Scholar]
  36. Yazıcı, Ş.; İnan, G.; Tabak, V. Effect of aspect ratio and volume fraction of steel fiber on the mechanical properties of SFRC. Constr. Build. Mater. 2007, 21, 1250–1253. [Google Scholar] [CrossRef]
  37. Wang, Q.S.; Li, X.B.; Zhao, G.Y.; Peng SH, A.O.; Yao, J.R. Experiment on mechanical properties of steel fiber reinforced concrete and application in deep underground engineering. J. China Univ. Min. Technol. 2008, 18, 64–81. [Google Scholar] [CrossRef]
  38. Shan, L.; Zhang, L. Experimental study on mechanical properties of steel and polypropylene fiber-reinforced concrete. Appl. Mech. Mater. 2014, 584, 1355–1361. [Google Scholar] [CrossRef]
  39. Wang, X.; Fan, F.; Lai, J.; Xie, Y. Steel fiber reinforced concrete: A review of its material properties and usage in tunnel lining. Structures 2021, 34, 1080–1098. [Google Scholar] [CrossRef]
  40. Bayramov, F.; Taşdemir, C.; Taşdemir, M.A. Optimisation of steel fiber reinforced concretes by means of statistical response surface method. Cem. Concr. Compos. 2004, 26, 665–675. [Google Scholar] [CrossRef]
  41. Zhang, X.; Deng, Z. Experimental study and theoretical analysis on axial compressive behavior of concrete columns reinforced with GFRP bars and PVA fibers. Constr. Build. Mater. 2018, 172, 519–532. [Google Scholar] [CrossRef]
  42. Raza, A.; Ahmad, A. Investigation of HFRC columns reinforced with GFRP bars and spirals under concentric and eccentric loadings. Eng. Struct. 2021, 227, 111461. [Google Scholar] [CrossRef]
  43. Elchalakani, M.; Dong, M.; Karrech, A.; Mohamed, A.; Mohamed, S.; Huo, J. Circular Concrete Columns and Beams Reinforced with GFRP Bars and Spirals under Axial, Eccentric, and Flexural Loading. Compos. Constr. 2020, 24, 93–104. [Google Scholar] [CrossRef]
  44. Tobbi, H.; Farghaly, A.S.; Benmokrane, B. Strength Model for Concrete Columns Reinforced with Fiber-Reinforced Polymer Bars and Ties. ACI Struct. J. 2014, 111, 789–798. [Google Scholar] [CrossRef]
  45. ASTM-C150/C150M-18; Standard Specification for Portland Cement. ASTM International: West Conshohocken, PA, USA, 2018.
  46. ASTM-C143; Standard Test Method for Slump of Hydraulic Cement Concrete. ASTM International: West Conshohocken, PA, USA, 2005.
  47. ASTM-C39/C39M-18; Standard Test Method for Compressive Strength of Cylindrical Concrete Specimens. ASTM International: West Conshohocken, PA, USA, 2018.
  48. Maranan, G.B.; Manalo, A.C.; Benmokrane, B.; Karunasena, W.; Mendis, P. Shear Behavior of Geopolymer Concrete Beams Reinforced with GFRP Bars. ACI Struct. J. 2016, 114, 337. [Google Scholar] [CrossRef]
  49. Elchalakani, M.; Dong, M.; Karrech, A.; Li, G.; Mohamed Ali, M.S.; Yang, B. Experimental Investigation of Rectangular Air-Cured Geopolymer Concrete Columns Reinforced with GFRP Bars and Stirrups. J. Compos. Constr. 2019, 23, 04019011. [Google Scholar] [CrossRef]
  50. Bencardino, F.; Rizzuti, L.; Spadea, G.; Swamy, R.N. Stress-Strain Behavior of Steel Fiber-Reinforced Concrete in Compression. Mater. Civ. Eng. 2008, 20, 255–263. [Google Scholar] [CrossRef]
  51. Essawy, A.S.; El-Hawary, M. Strength and ductility of spirally reinforced rectangular concrete columns. Constr. Build. Mater. 1998, 12, 31–37. [Google Scholar] [CrossRef]
  52. Chi, Y.; Yu, M.; Huang, L.; Xu, L. Finite element modeling of steel-polypropylene hybrid fiber reinforced concrete using modified concrete damaged plasticity. Eng. Struct. 2017, 148, 23–35. [Google Scholar] [CrossRef]
  53. Hany, N.F.; Hantouche, E.G.; Harajli, M.H. Finite element modeling of FRP-confined concrete using modified concrete damaged plasticity. Eng. Struct. 2016, 125, 1–14. [Google Scholar] [CrossRef]
  54. Raza, A.; Ahmad, A. Numerical investigation of load-carrying capacity of GFRP-reinforced rectangular concrete members using CDP model in ABAQUS. Adv. Civ. Eng. 2019, 2019, 1745341. [Google Scholar] [CrossRef]
  55. Chi, Y.; Xu, L.; Yu, H.S. Plasticity model for hybrid fiber-reinforced concrete under true triaxial compression. J. Eng. Mech. 2014, 140, 393–405. [Google Scholar] [CrossRef]
  56. ACI318–95; Building Code Requirements for Structural Concrete. American Concrete Institute: Farmington Hills, MI, USA, 1995.
  57. Triantafyllou, G.G.; Rousakis, T.C.; Karabinis, A.I. Corroded RC beams patch repaired and strengthened in flexure with fiber-reinforced polymer laminates. Compos. B Eng. 2017, 112, 125–136. [Google Scholar] [CrossRef]
  58. Ibrahim, A.M.; Fahmy, M.F.; Wu, Z. 3D finite element modeling of bond-controlled behavior of steel and basalt FRP-reinforced concrete square bridge columns under lateral loading. Compos. Struct. 2016, 143, 33–52. [Google Scholar] [CrossRef]
  59. Özcan, D.M.; Bayraktar, A.; Şahin, A.; Haktanir, T.; Türker, T. Experimental and finite element analysis on the steel fiber-reinforced concrete (SFRC) beams ultimate behavior. Constr. Build. Mater. 2009, 23, 1064–1077. [Google Scholar] [CrossRef]
  60. Elchalakani, M.; Karrech, A.; Dong, M.; Ali, M.M.; Yang, B. Experiments and finite element analysis of GFRP reinforced geopolymer concrete rectangular columns subjected to concentric and eccentric axial loading. Structures 2018, 14, 273–289. [Google Scholar] [CrossRef]
  61. Lok, T.S.; Xiao, J.R. Flexural strength assessment of steel fiber-reinforced concrete. J. Mater. Civ. Eng. 1999, 11, 188–196. [Google Scholar] [CrossRef]
  62. Elchalakani, M.; Dong, M.; Karrech, A.; Li, G.; Mohamed Ali, M.S.; Manalo, A. Behavior and design of air-cured GFRP-reinforced geopolymer concrete square columns. Mag. Concr. Res. 2018, 71, 1006–1024. [Google Scholar] [CrossRef]
  63. Lubliner, J.; Oliver, J.; Oller, S.; Oñate, E. A plastic-damage model for concrete. Solids Struct. Int. J. 1989, 25, 299–326. [Google Scholar] [CrossRef]
  64. Wu, J.Y.; Li, J.; Faria, R. An energy release rate-based plastic-damage model for concrete. Int. J. Solids Struct. 2006, 43, 583–612. [Google Scholar] [CrossRef]
  65. Wang, J.C. ABAQUS Application in Civil Engineering; Zhejiang University Press: Zhejiang, China, 2006. [Google Scholar]
  66. Huang, Z.; Liew, J.R. Nonlinear finite element modelling and parametric study of curved steel-concrete-steel double skin composite panels infilled with ultralightweight cement composite. Constr. Build. Mater. 2015, 95, 922–938. [Google Scholar] [CrossRef]
  67. Barros, J.A.; Figueiras, J.A. Flexural behavior of SFRC: Testing and modelling. J. Mater. Civ. Eng. 1999, 11, 331–339. [Google Scholar] [CrossRef]
  68. Barros, J.A.; Figueiras, J.A. Model for the analysis of steel fiber reinforced concrete slabs on grade. Comput. Struct. 2001, 79, 97–106. [Google Scholar] [CrossRef]
  69. Chi, Y.; Xu, L.; Yu, H.S. Constitutive modeling of steel-polypropylene hybrid fiber reinforced concrete using a non-associated plasticity and its numerical implementation. Compos. Struct. 2014, 111, 497–509. [Google Scholar] [CrossRef]
  70. Ahmad, A.; Raza, A. Reliability Analysis of Strength Models for CFRP-Confined Concrete Cylinders. Compos. Struct. 2020, 244, 112–123. [Google Scholar] [CrossRef]
  71. Saffarian, I.; Atefatdoost, G.R.; Hosseini, S.A.; Shahryari, L. Experimental and numerical research on the behavior of steel-fiber-reinforced-concrete columns with GFRP rebars under axial loading. Struct. Eng. Mech. 2023, 86, 399–415. [Google Scholar]
  72. Elmessalami, N.; El Refai, A.; Abed, F. Fiber-reinforced polymers bars for compression reinforcement: A promising alternative to steel bars. Constr. Build. Mater. 2019, 209, 725–737. [Google Scholar] [CrossRef]
  73. Prachasaree, W.; Piriyakootorn, S.; Sangsrijun, A.; Limkatanyu, S. Behavior and Performance of GFRP Reinforced Concrete Columns with Various Types of Stirrups. Int. J. Polym. Sci. 2015, 2015, 237231. [Google Scholar]
  74. Pantelides, C.P.; Gibbons, M.E.; Reaveley, L.D. Axial load behavior of concrete columns confined with GFRP spirals. J. Compos. Constr. 2013, 17, 305–313. [Google Scholar] [CrossRef]
  75. Khan, Q.S.; Sheikh, M.N.; Hadi, M.N. Axial-flexural interactions of GFRP-CFFT columns with and without reinforcing GFRP bars. J. Compos. Constr. 2016, 21, 04016109. [Google Scholar] [CrossRef]
  76. Samani, A.K.; Attard, M.M. A stress–strain model for uniaxial and confined concrete under compression. Eng. Struct. 2012, 41, 335–349. [Google Scholar] [CrossRef]
  77. Hadhood, A.; Mohamed, H.M.; Benmokrane, B. Axial load–moment interaction diagram of circular concrete columns reinforced with CFRP bars and spirals: Experimental and theoretical investigations. J. Compos. Constr. 2016, 21, 04016092. [Google Scholar] [CrossRef]
  78. ACI318–19; Building Code Requirements for Structural Concrete. American Concrete Institute: Farmington Hills, MI, USA, 2019.
Figure 1. Hooked-end steel fibers.
Buildings 14 00988 g001
Figure 7. Axially loaded columns after testing with their failure modes: (a) GRCC columns, (b) GRFC columns, (c) SRCC columns, and (d) SRFC columns.
Buildings 14 00988 g007
Figure 8. Load-strain curves of (a) longitudinal GFRP bars (Groups I and II columns) and (b) longitudinal steel bars (Groups III and IV columns).
Buildings 14 00988 g008
Figure 9. Axial compressive loads of Group I, II, III, and IV columns.
Buildings 14 00988 g009
Figure 11. FE modeling of columns: (a) geometric presentations of reinforcements and concrete and (b) mesh presentations.
Buildings 14 00988 g011
Figure 12. Stress—strain curves of reinforcements under tensile loading.
Buildings 14 00988 g012
Figure 13. Compressive stress—strain curve adopted in this study.
Buildings 14 00988 g013
Figure 14. Tensile concrete stress—strain curve adopted in this study.
Buildings 14 00988 g014
Figure 15. The CDP and modified CDP model predictions for (a) GC-T40, (b) GF-T40, (c) SC-T40, and (d) SF-T75.
Buildings 14 00988 g015aBuildings 14 00988 g015b
Figure 21. Lateral confinement of the concrete due to steel spiral rebar (left) and one pith of spiral rebar (right).
Buildings 14 00988 g021
Table 1. Physical and mechanical properties of steel fibers.
Length
(mm)
Diameter
(mm)
Area
(mm2)
Tensile Strength (MPa)Elongation
(%)
Elasticity
Modulus (GPa)
500.80.50267584200
Table 2. Mixture design of CC and FC.
Concrete TypeCement
(kg/m3)
Sand
(kg/m3)
Gravel
(kg/m3)
Water
(kg/m3)
Steel Fibers *
(kg/m3)
Superplasticizer
(kg/m3)
CC449.8894.4825.6202.5--
FC449.8894.4825.6202.523.753.6
* Note: Fibers were added to the mixture as an additional material and were not considered for volumetric design.
Table 3. Physical and mechanical properties of the steel and GFRP rebars.
Material TypeDiameter
(mm)
Area
(mm2)
Tensile Strength
(MPa)
Elastic
Modulus (GPa)
Tensile
Strain
(%)
Type of
Reinforcement
GFRP9.570.85943.1503.0Longitudinal
Steel9.570.90372.32000.25Longitudinal
Steel6.432.15262.22000.15Transverse
Table 4. Specimen details.
Group IDSpecimen LabelType of RebarsType of ConcreteLongitudinal RebarTransverse Rebar
Diameter
(mm)
No. of
Rebars
Reinforcing
Ratio (%)
Diameter
(mm)
Spacing
(mm)
Type of ConfinementReinforcing
Ratio (%)
Group I
(GRCC)
GC-T75GFRPPlain9.562.676.475Tied1.71
GC-P7575Spiral1.71
GC-T4040Tied3.22
GC-P4040Spiral3.22
Group II
(GRFC)
GF-T75Fiber9.562.676.475Tied1.71
GF-P7575Spiral1.71
GF-T4040Tied3.22
GF-P4040Spiral3.22
Group III
(SRCC)
SC-T75SteelPlain9.562.676.475Tied1.71
SC-P7575Spiral1.71
SC-T4040Tied3.22
SC-P4040Spiral3.22
Group IV
(SRFC)
SF-T75Fiber9.562.676.475Tied1.71
SF-P7575Spiral1.71
SF-T4040Tied3.22
SF-P4040Spiral3.22
Table 5. Axial compression test results.
Column IDPu (kN)Deflection at Pu (mm)εlong (με)Ductility Index
GC-T75445.63.36443174.1
GC-P75478.53.77550964.2
GC-T40487.14.08874274.5
GC-P40499.94.22180204.8
GF-T75476.73.46145574.3
GF-P75509.84.35359494.6
GF-T40542.25.34298835.0
GF-P40551.65.52210,9525.2
SC-T75500.53.59312583.7
SC-P75577.14.02314754.0
SC-T40592.14.38416814.1
SC-P40616.75.04319754.5
SF-T75569.23.64812953.9
SF-P75587.44.47816424.2
SF-T40605.35.47319614.3
SF-P40659.15.70419964.5
Note: εlong is the strain measured at Pu.
Table 6. Results of the experimental and FE analysis of the ultimate axial load and deflection.
SpecimensExperimental ResultsFEM ResultsDifference in Pu (%)Difference in Deflection at Pu (%)
Pu (kN)Deflection at Pu (mm)Pu (kN)Deflection at Pu (mm)
GC-T75445.63.364427.63.261−4.04−3.06
GC-P75478.53.775485.33.9301.424.11
GC-T40487.14.088501.24.2512.903.99
GC-P40499.94.221520.34.4214.084.74
GF-T75476.73.461508.43.6276.654.80
GF-P75509.84.353482.74.125−5.32−5.24
GF-T40542.25.342556.35.4552.602.12
GF-P40551.65.522586.55.8216.335.41
SC-T75500.53.593511.63.6532.221.68
SC-P75577.14.023541.83.782−6.12−5.99
SC-T40592.14.384585.34.256−1.15−2.92
SC-P40616.75.043630.25.2232.193.57
SF-T75569.23.648597.83.8505.025.54
SF-P75587.44.478552.64.244−5.92−5.23
SF-T40605.35.473615.35.5641.651.66
SF-P40659.15.704701.45.9966.425.12
Table 7. Experimental, numerical, and predicted results of the axial compressive load for GRCC and GRFC columns.
SpecimenPexp(kN)Pnum(kN)Ppred(kN)Pexp/PpredPnum/Ppred
Equation (19)Equation
(10)
Equation
(11)
Equation
(12)
Equation
(19)
Equation
(10)
Equation
(11)
Equation
(12)
Equation
(19)
Equation
(10)
Equation
(11)
Equation
(12)
GC-T75445.6427.6420.7474.0676.2546.01.060.940.660.811.020.900.630.78
GC-P75478.5485.5425.0474.0676.2546.01.121.010.710.881.141.020.720.88
GC-T40487.1501.2491.8474.0676.2546.00.991.030.720.891.021.050.740.92
GC-P40499.9520.3499.9474.0676.2546.01.001.050.740.921.041.100.770.95
GF-T75476.7508.4449.1571.6727.5600.01.060.830.650.791.140.890.700.85
GF-P75509.8482.7453.4571.6727.5600.01.120.890.700.851.060.850.660.81
GF-T40542.2556.3520.3571.6727.5600.01.040.950.750.901.060.970.760.93
GF-P40551.6586.5528.3571.6727.5600.01.040.960.760.921.111.030.810.98
GRCC = glass reinforced conventional concrete, GRFC = glass reinforced fiber concrete, Equation (12) is the proposed equation., Equation (3) is Hadhood’s equation, Equation (4) is Tobbi’s equation., and Equation (5) is Maranan’s equation.
Disclaimer/Publisher’s Note: The statements, opinions and data contained in all publications are solely those of the individual author(s) and contributor(s) and not of MDPI and/or the editor(s). MDPI and/or the editor(s) disclaim responsibility for any injury to people or property resulting from any ideas, methods, instructions or products referred to in the content.

