Article

Structural Design and Mechanical Behavior Investigation of Steel–Concrete Composite Decks of Narrow-Width Steel Box Composite Bridge

1
College of Civil Engineering, Shaoxing University, Shaoxing 312000, China
2
Shaoxing Communications Investment Group Co., Ltd., Shaoxing 312000, China
3
Zhejiang Institute of Communications Co., Ltd., Hangzhou 310006, China
4
CCCC Highway Bridges National Engineering Research Center Co., Ltd., Beijing 100088, China
*
Author to whom correspondence should be addressed.
Buildings 2024, 14(4), 912; https://doi.org/10.3390/buildings14040912
Submission received: 8 January 2024 / Revised: 4 March 2024 / Accepted: 5 March 2024 / Published: 27 March 2024
(This article belongs to the Special Issue Research on Structural Analysis and Design of Civil Structures)

Abstract

:
Steel–concrete composite decks are commonly employed in narrow-width steel box composite girder bridges to augment their lateral spanning capabilities, while the concurrent omission of longitudinal stiffeners leads to a substantial reduction in the number of components, thereby yielding a structurally optimized bridge configuration. This paper delineates the structural design parameters of a narrow-profile steel box composite girder bridge and assess the mechanical behavior of its incorporated steel–concrete composite deck under static and fatigue loading conditions. To this end, two full-scale segment specimens from the composite bridge decks were subjected to equal amplitude cyclic fatigue tests. The investigation specifically concentrated on the impacts of two types of shear connectors—namely, perforated steel plates combined with shear studs and perfobond rib shear connectors (PBL connectors)—on the static and fatigue performance, including fatigue stiffness, of the steel–concrete composite bridge decks. The results indicate that, under the static bending condition, the composite deck specimen equipped with stud connectors demonstrates superior overall flexural stiffness in comparison to the specimen featuring PBL connectors. Furthermore, the flexural stiffness of the steel–concrete composite specimens experiences a negligible alteration across two million fatigue loading cycles. Upon the completion of two million fatigue loading cycles, the composite deck specimens incorporating the shear connectors composed of perforated steel plates and shear studs exhibit relatively wider crack widths under the static peak load. Both configurations of the steel–concrete composite bridge deck specimens manifest evident interfacial detachment, signifying insufficient tensile pull-out stiffness of the shear connectors. It is recommended to increase the quantity of the shear connectors or select the pertinent types in order to enhance the interface shear resistance.

1. Introduction

Steel–concrete composite beams represent a composite structure that integrates concrete and steel through shear connectors to collaboratively sustain loads. This structure exploits the compressive properties of concrete, effectively preventing tensile cracking, whilst leveraging the high tensile strength of steel. In comparison with reinforced concrete beams, steel–concrete composite beams can significantly lower the cross-sectional height, thereby reducing the structural self-weight, shortening the construction period, and enhancing the ductility of the structure. When contrasted with steel bridges, steel–concrete composite beams decrease the overall construction costs, markedly reduce steel usage, and bolster the stiffness and integrity of the structure. Due to these merits, the steel–concrete composite beam structure has been extensively adopted and has emerged as one of the significant development trajectories in bridge engineering [1,2,3]. Steel–concrete composite beams are extensively utilized in medium- and small-span bridge structures. Researchers, both Chinese and international, have conducted extensive research on the static performance of steel–concrete composite beams, leading to the development of comprehensive calculation methods and the establishment of a range of design codes [4,5,6,7]. There are detailed regulations for the design and construction of steel–concrete composite beams, yet the guidelines regarding the fatigue performance design for composite beams are noticeably absent in the current codes of many countries. Structures under cyclic loading incur fatigue damage with each fatigue load cycle, precipitating the degradation of material strength or mechanical properties in composite structures, a progression that is irreversible. The fatigue failure process may be described as the continuous degradation of overall structural performance and material properties due to cyclic loading, with damage accumulating and strength diminishing progressively, ultimately resulting in structural failure. With the continuous development and application of steel–concrete composite beams in bridge engineering, fatigue damage of these beams has increasingly become a prominent issue [8]. The fatigue failure characteristics of steel–concrete composite continuous beams, including the development process and mechanism of internal fatigue damage, were studied using numerous experimental and theoretical calculation approaches [9,10,11,12]. Alencar et al. [13] and Lu et al. [14] investigated the fatigue properties of composite specimens with welded joints subjected to distortion-induced fatigue and with initial defects through static and fatigue tests. The fatigue behaviors of steel–concrete composite elements with various shear connectors, including single stud and single row studs, grouped studs, corroded stud connectors, large stud connectors, and PBL connectors, were analyzed experimentally and numerically [15,16,17,18,19]. Xiang et al. [20] and Liu et al. [21] investigated the fatigue performance of a steel plate–concrete composite slab under variable amplitude fatigue and low-cycle fatigue loads. The fatigue behaviors of improved composite box girder bridges with corrugated steel webs were evaluated through finite element analysis and a discussion of experimental results [22,23,24]. Various new types of steel–concrete composite girders, such as profiled steel sheeting–concrete, concrete-filled wide-flat steel tubes replacing concrete slabs, orthotropic steel decks with UHPC overlays, concrete-filled tubular flanges, and corrugated webs, were presented and explored to improve the fatigue behaviors [25,26,27,28].
Narrow steel box composite beams achieve a reduced steel box width by utilizing wider flange plate, thereby cutting down on the quantity of longitudinal stiffeners for the top flanges and simplifying the transverse stiffening diaphragms. The decreased number of internal stiffeners in narrow steel box composite beams significantly simplifies manufacturing, as the lightweight steel box beams facilitate transportation and installation. This renders narrow steel box bridges more structurally efficient, appropriate for curved and variable width structures, and congruent with the prevailing trends of industrialization, standardization, and intelligent development in the civil transportation industry. Narrow steel box beam bridges typically use steel–concrete composite decks or pre-stressed concrete decks to extend the span of the bridge deck and eliminate the need for longitudinal stiffeners, leading to a significantly fewer components and a structurally sound bridge configuration. The large-span steel–concrete composite bridge deck of narrow steel box composite beams is directly exposed to repetitive vehicle impacts, featuring a complex load-bearing mechanism that necessitates further research into its fatigue characteristics.
Although narrow steel box composite beams have gained some popularity in Japan, their application remains limited in China, with comparative scant research conducted on their structural performance. Hu et al. [9] introduced the design concept of narrow steel box composite beams and outlined a refined construction procedure to control cracking in the negative bending moment zones of continuous large-span steel–concrete composite beams. To date, research concerning the fatigue performance of steel–concrete composite bridge decks in narrow steel box composite beam bridges remains unreported.
This paper is based on a three-span narrow-width steel box composite beam bridge (50 m + 85 m + 50 m) for the Keqiao–Zhuji Expressway Project, which features narrow-width steel box–concrete composite beams and steel–concrete composite bridge decks composed of steel plates, shear connectors, and cast-in-place concrete. Shear connectors are essential components to ensure the collaborative functionality between steel and concrete in the steel–concrete composite structure, with headed studs or perfobond rib (PBL) shear connectors being commonly employed. Headed studs provide a flexible arrangement and non-directional shear resistance, yet are characterized by a comparatively low shear stiffness and load-carrying capacity. PBL shear connectors offer a high load-carrying capacity, significant shear stiffness, and robust fatigue resistance, but their shear performance exhibits a certain degree of directional dependency. In order to elucidate the impact of shear connectors on the fatigue performance of composite bridge decks, this paper conducts experimental studies on the static and fatigue performance of the steel–concrete composite bridge decks with different types of shear connectors (perforated steel plate + headed studs and PBL shear connectors). Our primary focus was on the following aspects: (1) the static bending behaviors of steel–composite decks featuring two types of shear connectors, which serve as benchmarks for the subsequent fatigue tests on the same full-scale composite deck specimens, and (2) the fatigue characteristics and failure behaviors of composite decks equipped with two types of shear connectors, which furnish insights for the structural selection and optimization of such bridge types.

2. Structural Design of the Narrow-Width Steel Box Composite Bridge (NWSBCB)

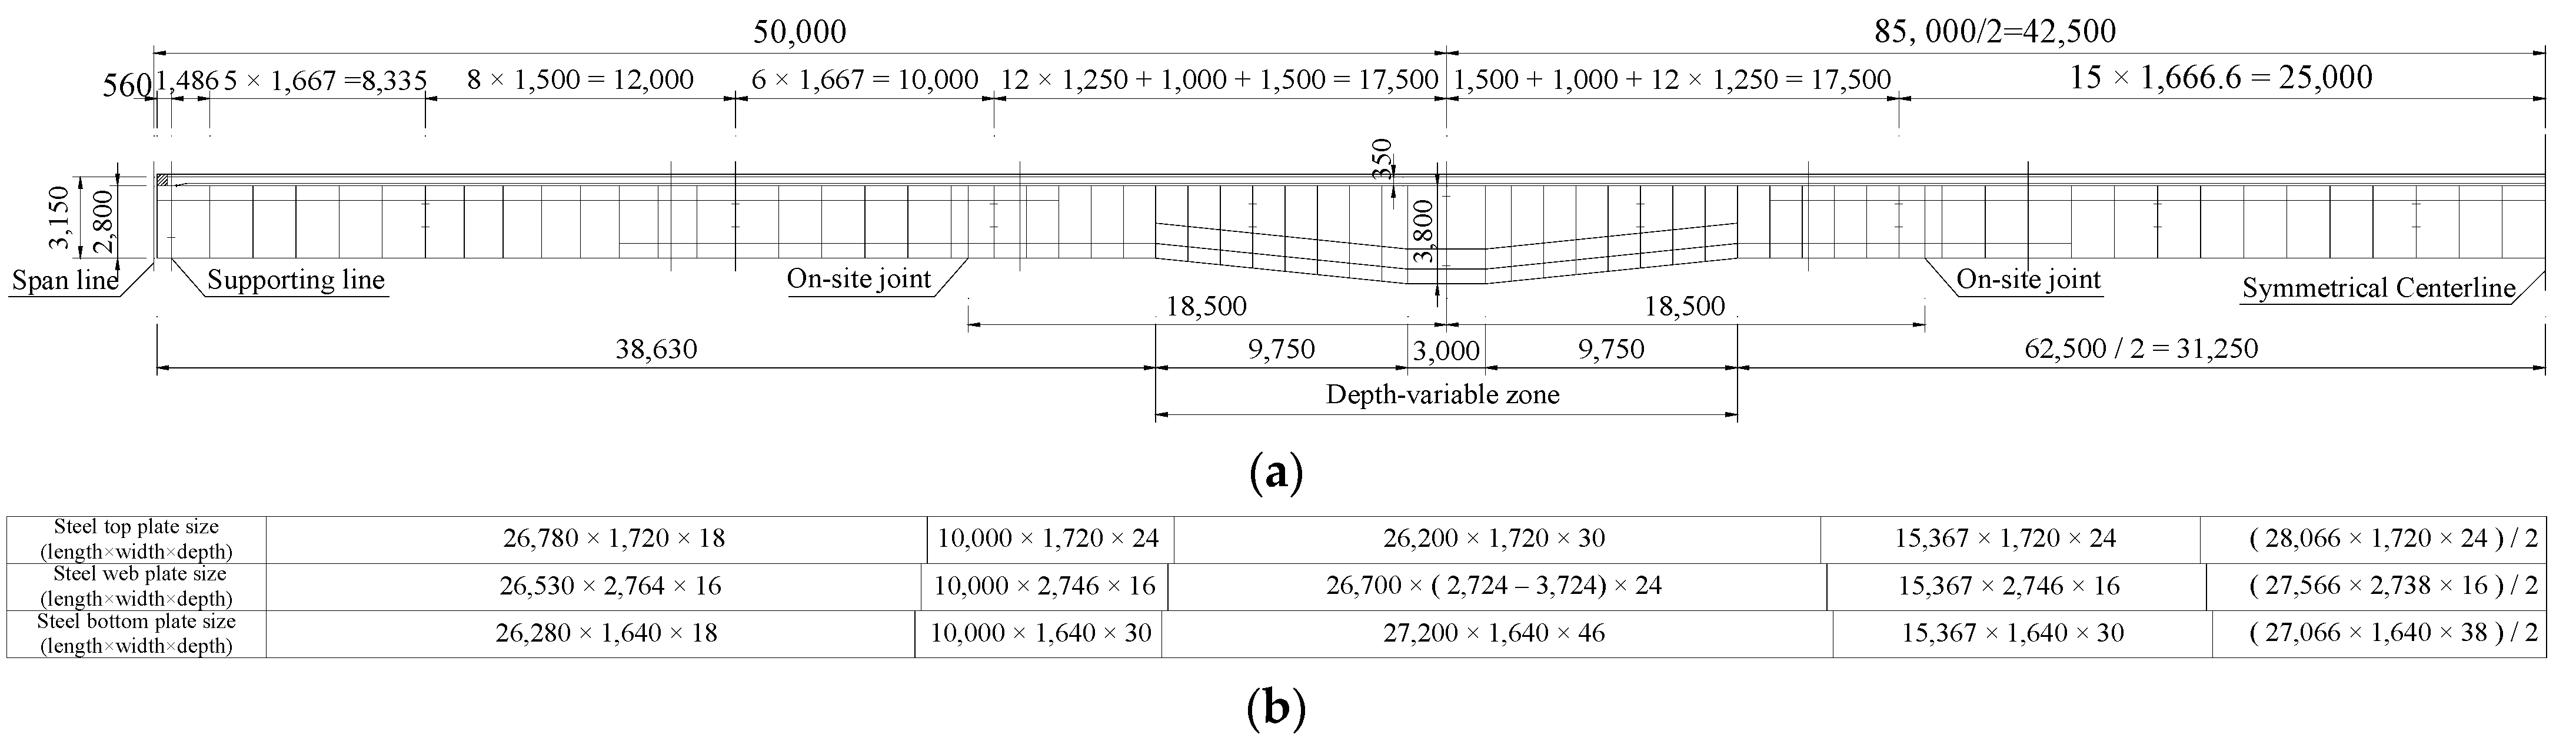
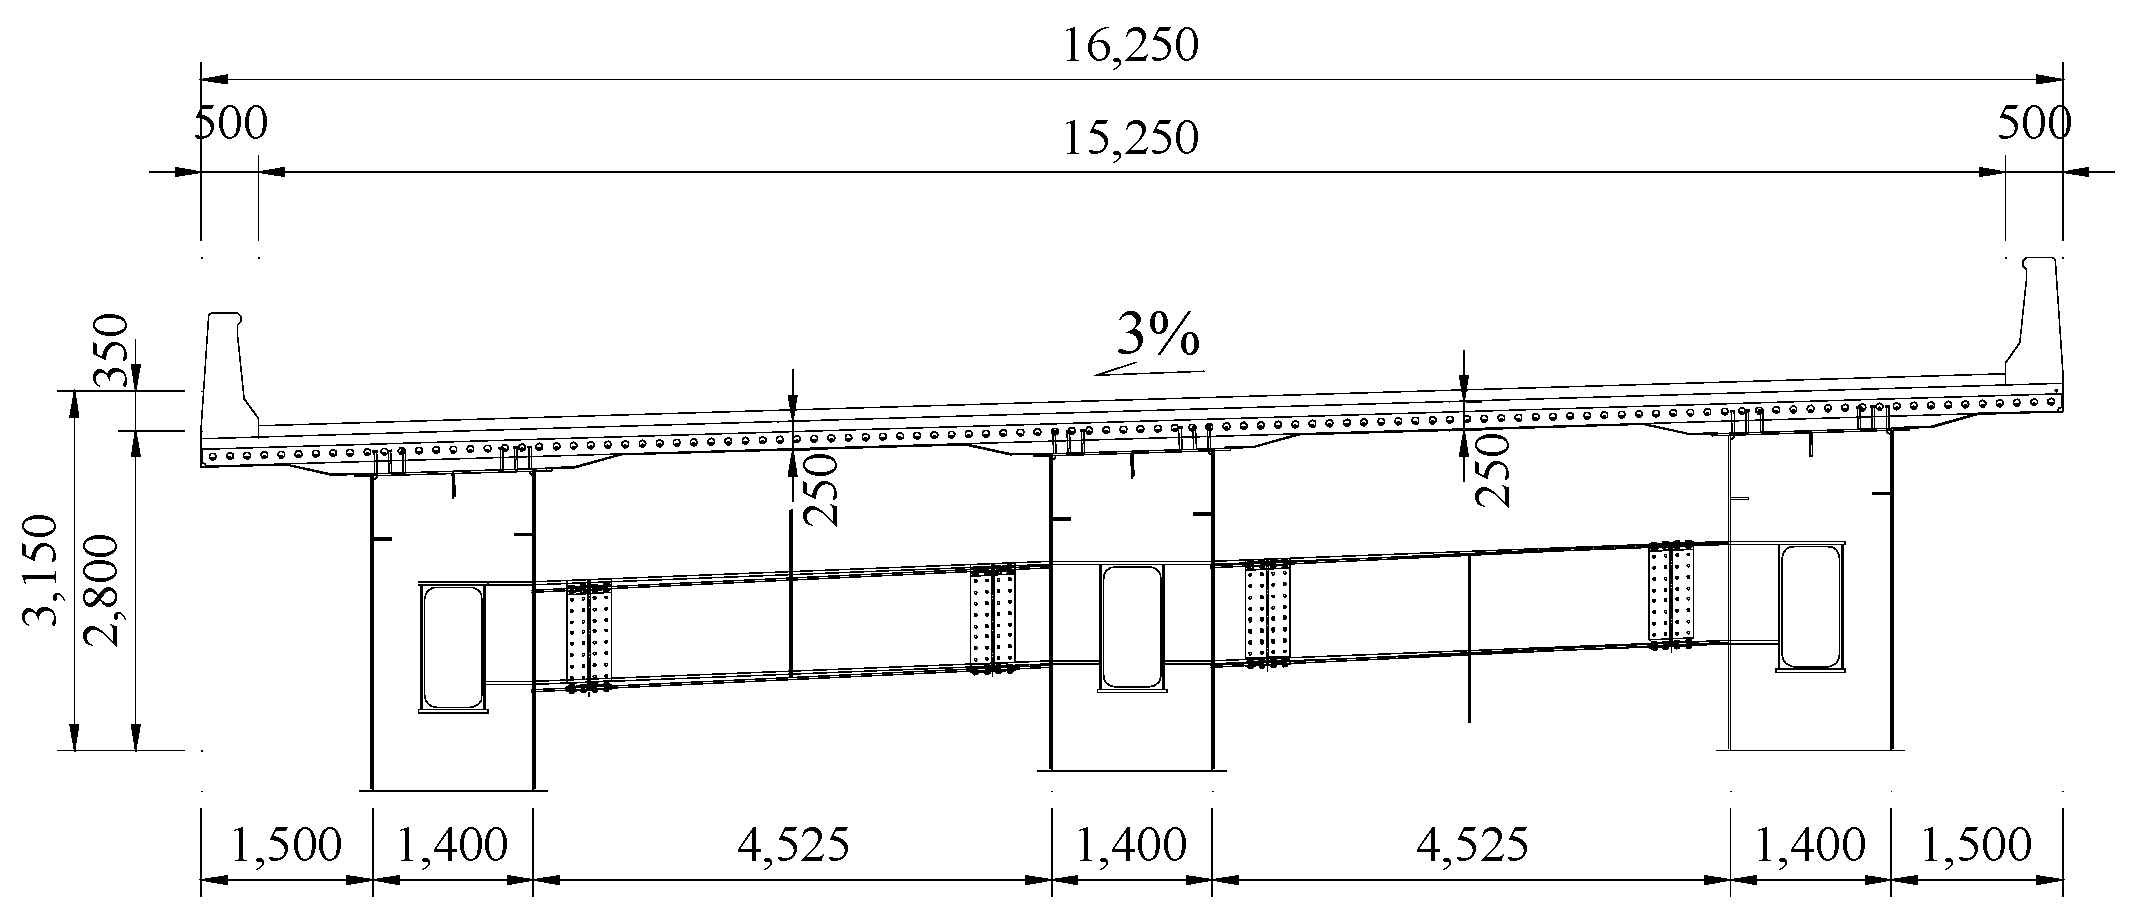
2.1. Structural Design Description of the Bridge

The narrow-width steel box–concrete composite continuous girder bridge, which spans over the Lantian Expressway on the Kezhu Expressway, has a total length of 185 m, with a bridge span arrangement of 50 + 85 + 50 m and a side-span to mid-span ratio of 0.588. The design employs a separated cross-section design. The elevation of the composite continuous girder bridge and the dimensions of the main components of the steel box beam are illustrated in Figure 1. The additional specifications on configurations and dimensions are detailed in Reference [29].
The heights of the steel box beam at mid-span and the interior supports are 2.8 m and 3.8 m, respectively, with height-to-span ratios of 1/30.4 and 1/22.4. Taking the bridge deck thickness into account, the total height of the composite beam is 3.15 m at the mid-span and 4.15 m at the interior supports. The beam height features a linear transition within the range of 9.75 m near the interior supports. Constructed from the Q355D steel, the steel box beam incorporates a variable thickness design for the girder webs, with the thicknesses varying from 16 mm to 46 mm. Both the top and bottom flanges of the steel box beam are equipped with a stiffening rib in the longitudinal compression area. Two horizontal stiffening ribs are set in the compression zone of the webs within the height transition regions near the interior support point, whereas the remaining segments have a single horizontal stiffening rib. Box diaphragms are installed at intervals of 5 to 6 m at mid-span, with shortened intervals near the interior supports. The thicknesses of the box diaphragm at the interior piers, end piers, and mid-span are 30 mm, 16 mm, and 12 mm, respectively. Transverse beams with I-shaped cross-sections are positioned at piers and at regular intervals of approximately 10 m within spans. Headed studs with Φ22 × 200 mm dimensions serve as shear connectors and are spaced 250 mm apart longitudinally, narrowing to 125 mm at beam ends and near the interior supports; transversely, they are spaced 200 mm apart and arranged closely adjacent to the inner side of box beam webs.

2.2. Structural Design Description of the Steel–Concrete Composite Bridge Deck

The narrow web spacing of narrow steel box composite girders leads to larger deck spans, frequently utilizing prestressed concrete or steel–concrete composite decks. The steel–concrete composite bridge deck has advantages such as a reasonable structure, robust spanning capability, and a balance of cost-efficiency and durability, and is composed of a steel bottom plate, shear connectors, and a cast-in-place concrete layer. Typical shear connection forms for steel–concrete composite girder bridge decks encompass PBL connectors, headed studs + stiffening plates, profiled steel perforated plates, and reinforcing bar grating connectors, among which PBL connectors are the most extensively used. Headed studs + stiffening plates are more convenient when large bridge widths complicate the construction of steel bars for perforated plates.
The steel–concrete composite bridge deck of this bridge is composed of steel plates and a cast-in-place concrete layer, with the cross-section depicted in Figure 2. The steel plates include a steel bottom plate, side end plates, perforated stiffening ribs, and other support components. Cast-in-place concrete is laid atop, connected by transverse perfobond strips (with Φ22 deformed bars) and other shear connections. The surfaces between the concrete overlay and the bottom steel elements are roughened to increase the bond performance. The steel plates are factory-fabricated in segments, transported, hoisted on site, and are then spliced using high-strength bolts. The steel plates also serve as the bottom formwork for concrete pouring of the bridge deck, facilitating formwork-free construction. The individual deck width of the bridge is 16.25 m, with three main girders. The steel box width is 1.4 m with 1.5 m cantilevers. The transverse net distance between steel boxes is 4.525 m, and the box center-to-center spacing is 5.925 m. Transverse box girders connect the steel boxes. The thickness of the composite deck is 250 mm at mid-span and cantilever ends, increasing to 350 mm above the boxes. A 100 mm layer of asphalt pavement is placed on the deck.

3. Finite Element Analysis of NWSBCB

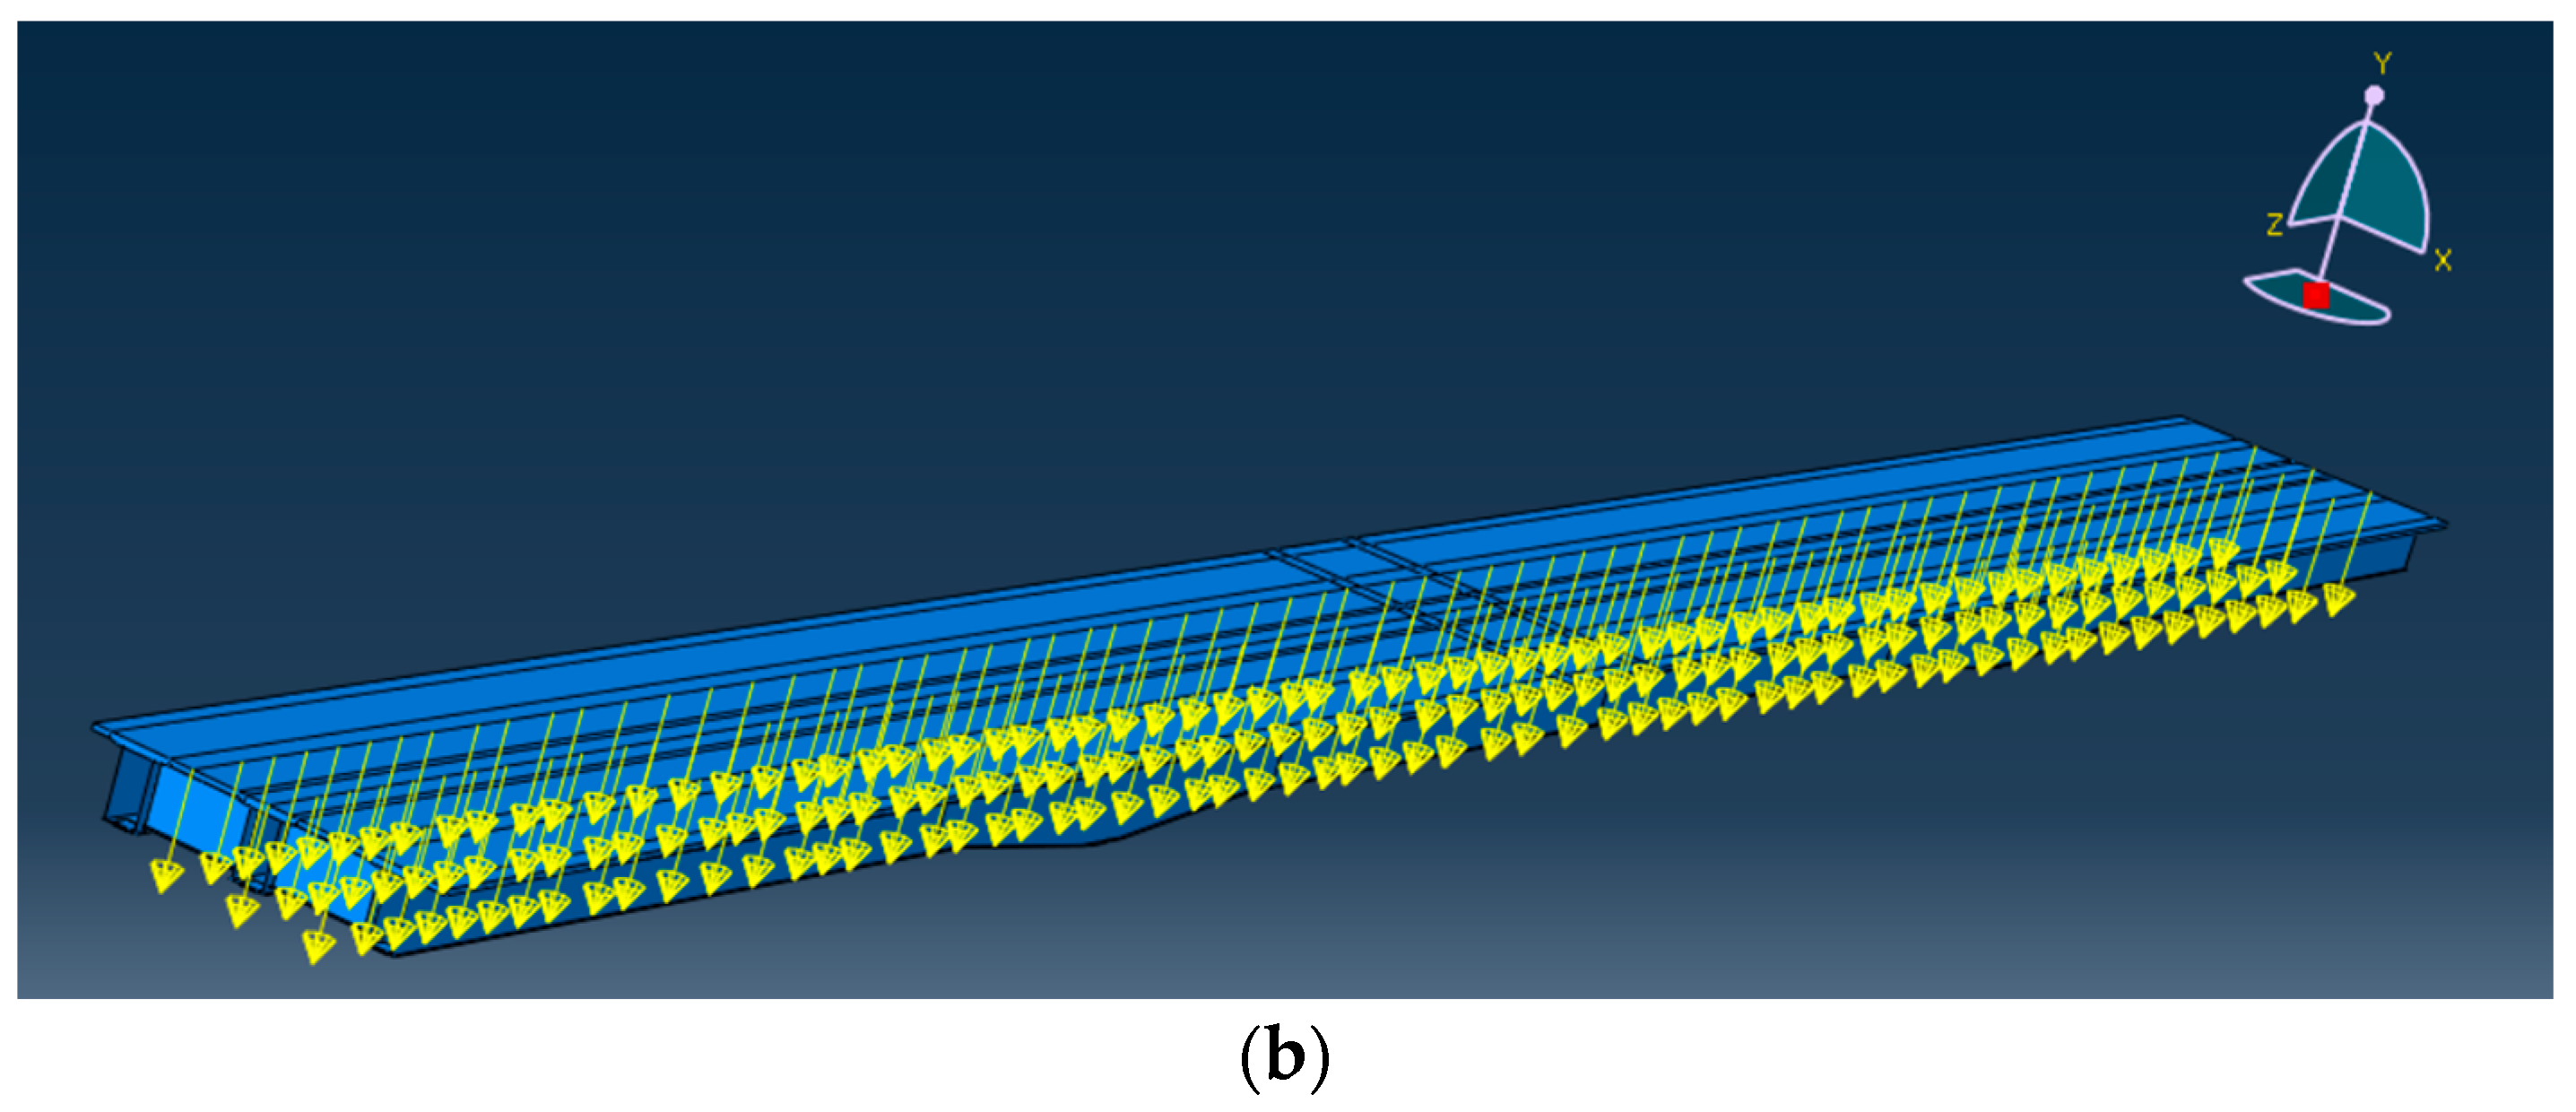
3.1. Finite Element Model

Based on the actual bridge design dimensions of the NWSBCB Highway bridge from Keqiao to Zhuji, a finite element model is developed using Abaqus 2022 software. The model features a total length of 185 m and a width of 16.25 m. It is divided into two primary components: the concrete bridge deck and the steel girder. To optimize the configuration and meshing of the FE model, the steel girder is initially subdivided into several parts before assembly. The individual steel parts, comprising the roof plate, web, and bottom plate, are merged and subsequently connected to the diaphragm with tie constraints. The geometric model of the FE analysis is shown in Figure 3. In this model, there are four types of boundary conditions consisting of 12 bearings in total, as shown in Figure 4. The first type of boundary condition (type 1) constrains the displacements in the longitudinal, transverse, and vertical directions, respectively, i.e., applying U1, U2 and U3 in the FEA model; meanwhile, type 2 limits only a vertical displacement (the restraint of U2). Type 3 restrains itself from transverse and vertical displacements by applying the conditions of U1 and U2, and type 4 constrains the longitudinal and vertical displacements (the restraints of U2 and U3). Note that the transverse, vertical, and longitudinal directions of the NWSBCB bridge correspond to the X axis, Y axis, and Z axis in the finite element model, respectively.
A three-dimensional solid element C3D8R (eight-node reduced integration elements) is selected to model the concrete bridge deck, while the steel girder employs a two-dimensional shell element S4R (four-node reduced integration shell elements). The reason for not modelling the steel girder with the C3D8R element is partially due to the significant depth difference between the steel elements and concrete bridge deck, and employing C3D8R to model steel girders will introduce a great number of nodes and thus increase the difficulty of the globe computation. There are 80,572 nodes in the FE model, 42,140 shell elements of S4R, and 26,730 solid elements of C3D8R, for a total of 68,870 elements. Those assembled elements are dependent and meshed separately. The elements of the concrete deck are meshed into three layers, with a mesh dimension of 1.0 m × 0.24 m × 0.083 m (length × width × height). The mesh size of the steel girder is 0.5 m, and that of the diaphragm plates is 0.23 m, as shown in Figure 5. Before determining the mesh size of the FE model, its mesh-relevant sensitivity analysis is conducted and the result of the analysis shows a good uniform convergence for the mesh size of the FE model employed.

3.2. Design Loads

The design loads, such as deadweight, secondary dead load, support settlement, lane load, and fatigue vehicle load, are considered in the overall FE model. The concrete deck is specified as a grade of C40 with a density of 2500 kg/m³. Its elastic modulus is 32.5 GPa with a Poisson’s ratio of 0.2. The mechanical properties of concrete, including the plasticity, damage plasticity, cracking, and so on, are defined in the FEA model; specifically, the expansion angle, eccentricity ratio, K coefficient, and viscosity coefficient are 31, 0.1, and 0.05, respectively. The material of steel elements is a specified Q345-grade steel with a density of 7850 kg/m³. The steel has an elastic modulus of 206 GPa, and its Poisson ratio is 0.3. The deadweight is applied by a gravitational acceleration loading. The secondary dead load, including the deadweights of the asphalt concrete pavement and the guardrail, is simulated using a line load. The deadweight of the guardrail is 12.2 kN/m, distributed on both sides, whereas the asphalt concrete’s deadweight is 12.12 kN/m, as shown in Figure 6.
Reflecting the actual bridge design’s support settlements, a middle support settlement of 28.3 mm and an end settlement of 16.7 mm are applied. The lane loading considers a Class I Highway loading. In the model, the lane load is applied using a concentrate load and a distribution load. The lane load distributes transversally at the center of the composite bridge deck.
According to the standard of Specifications for Design of Highway Steel Bridge (JTGD64-2015) [30], the components of a bridge deck for a steel bridge are generally checked using fatigue load model III. Each axle load of such model is 120 kN, as illustrated in Figure 7. To evaluate the maximum stress amplitude on the composite bridge deck under various combinations of fatigue wheel loads, different loading positions across the longitudinal and transverse directions of the bridge deck are considered, as shown in Figure 8. For the longitudinal distribution of fatigue loads, two loading modes are considered. The first mode is the fatigue wheel loads located at the right center of the main span, while the second one represents a symmetric distribution of fatigue wheel loads at the mid-span, as shown in Figure 8a. In the distribution cases of fatigue wheel loads, three transversal positions are involved. In the first position, the fatigue wheel loads are distributed symmetrically around the centerline of the bridge girder. The second position represents a symmetrical distribution of the fatigue wheel loads at the center of the composite bridge deck. For the third distribution, the fatigue wheel loads are located asymmetrically with a wheel at the center of the composite bridge deck. The longitudinal and transverse positions of fatigue loads of the FE model in Abaqus are shown in Figure 9.

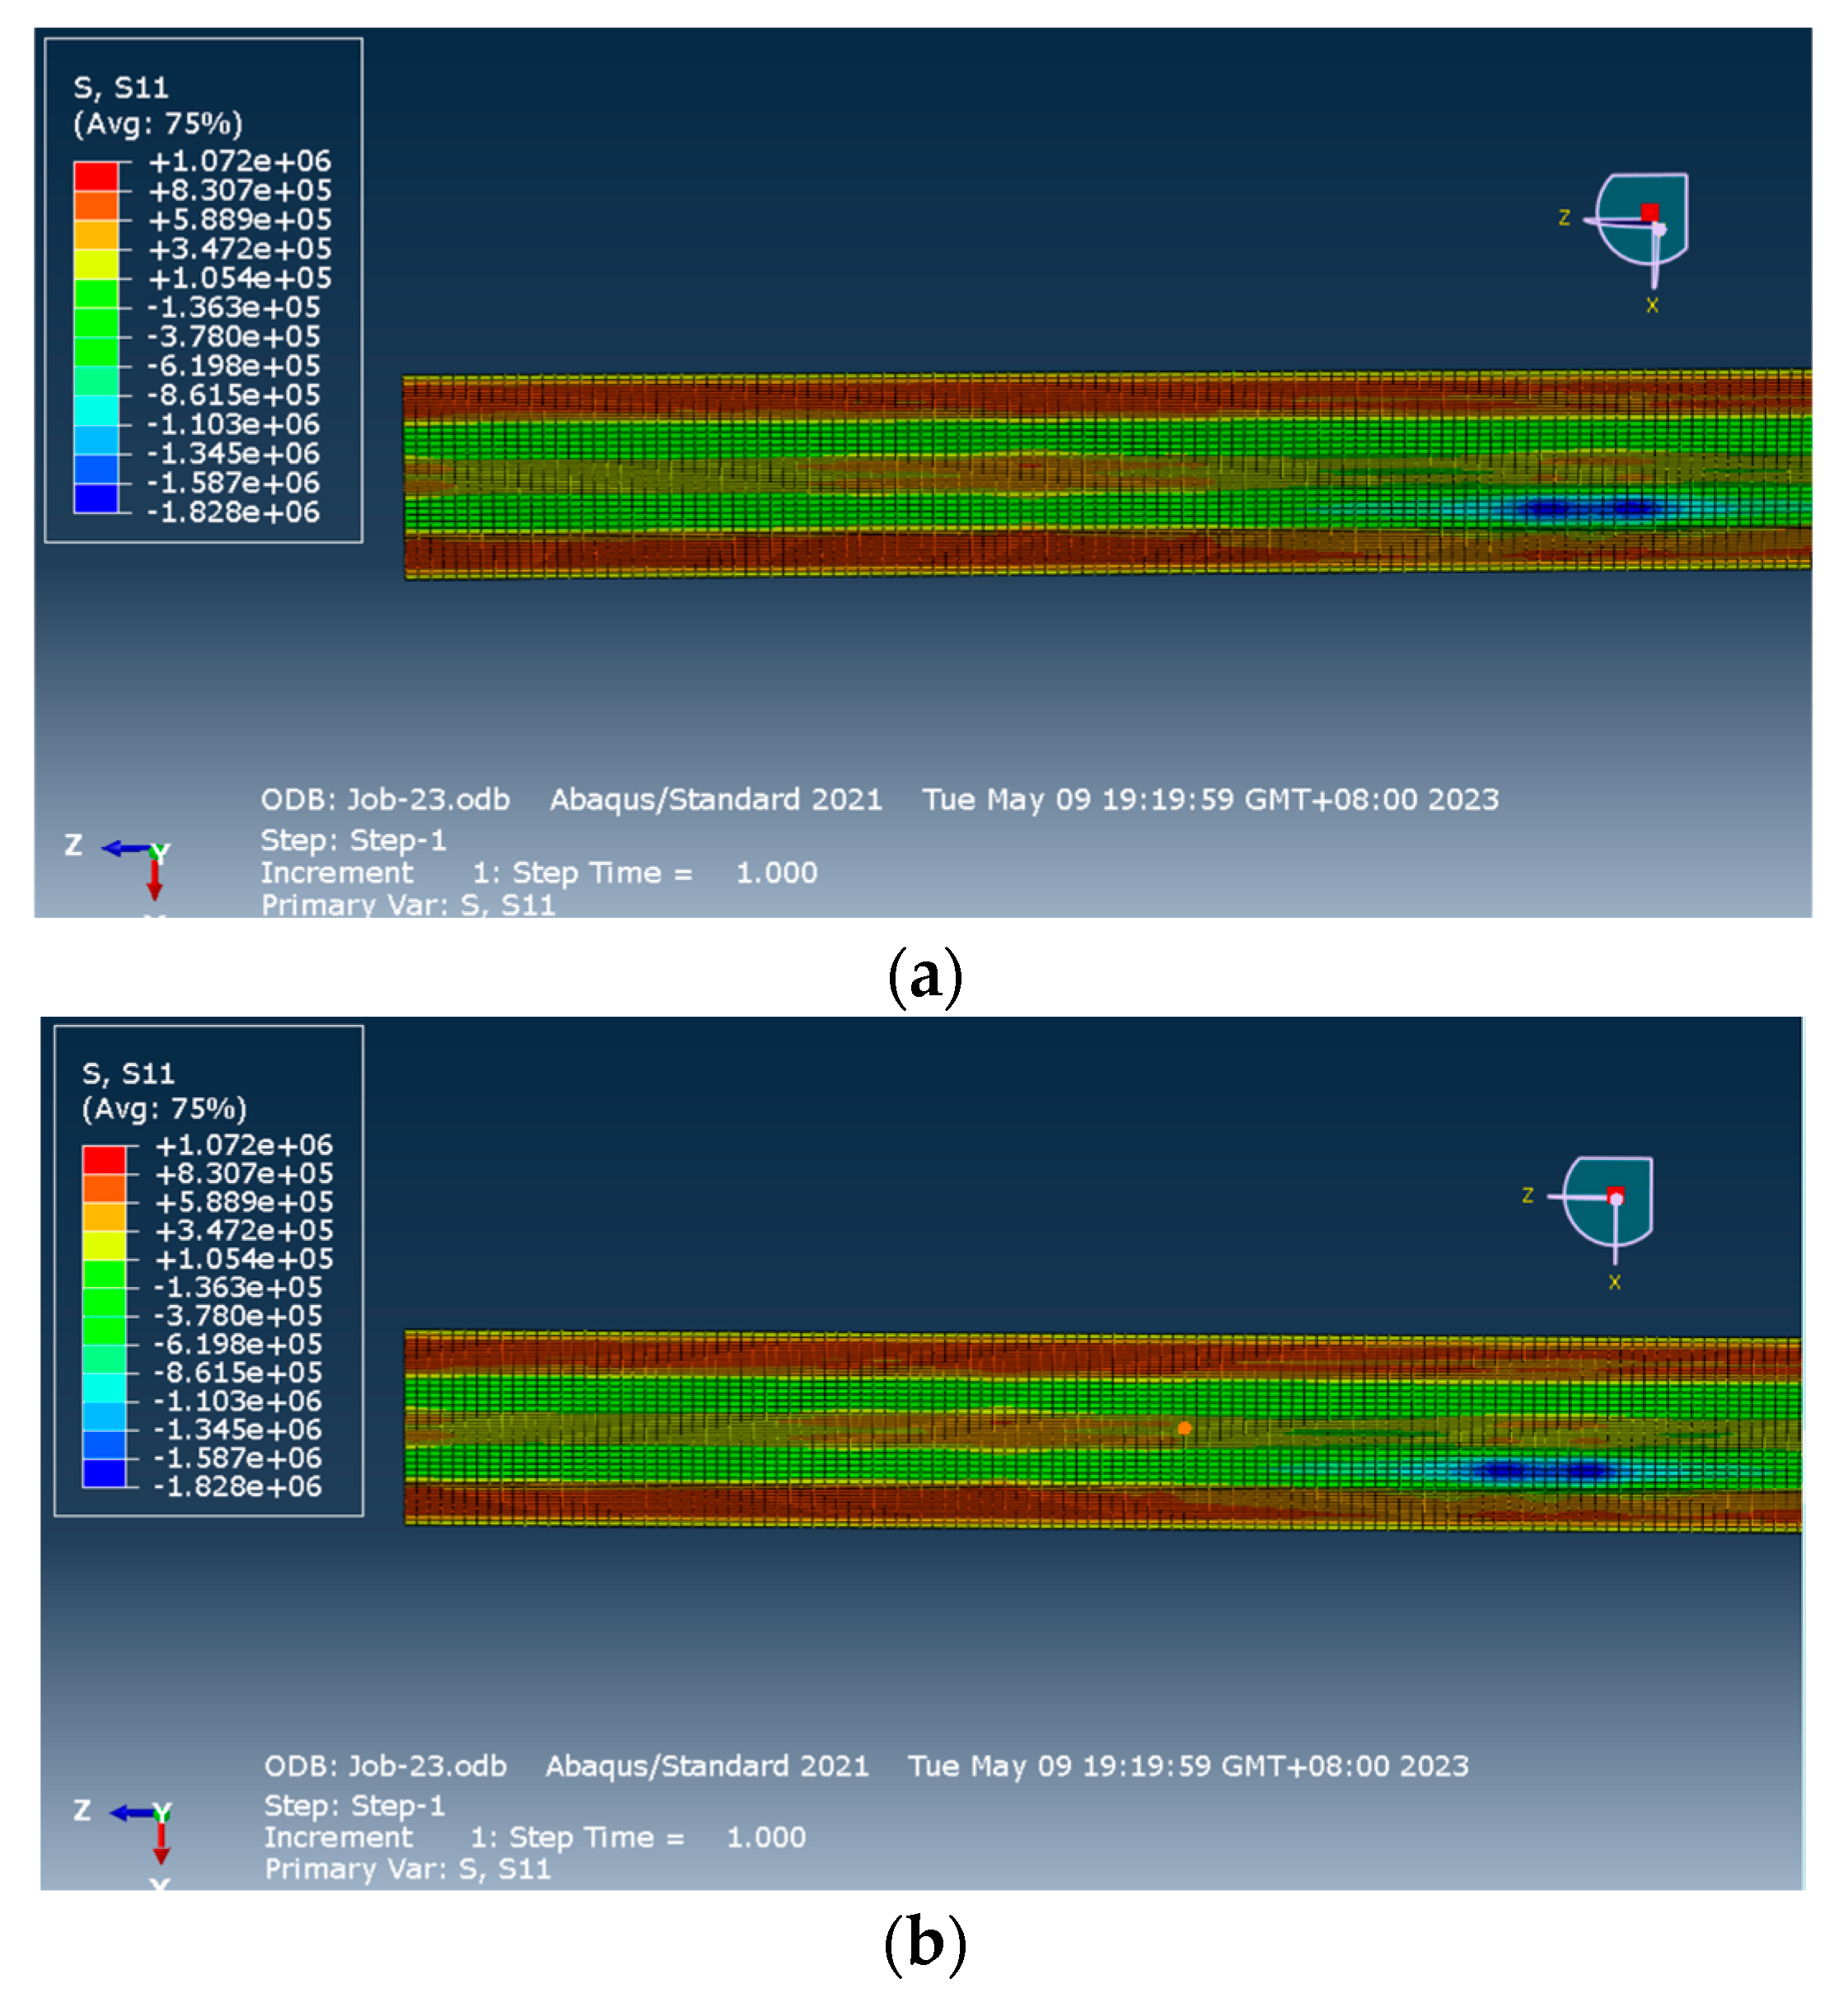
3.3. FE Analysis Results

Seven load combinations in the FE model for the general static analysis based on the actual bridge design dimensions are considered as follows. The first one only considers the deadweight. Second, the deadweight and the secondary dead load are involved. The third combination takes into account the deadweight, secondary dead load, and support settlements.
In the fourth case, the deadweight, secondary dead load, and a single lane load in a full span. For the fifth combination, a single lane load is just distributed in the mid-span as compared to the four loads in combination. When it comes to the sixth combination, the loads include the deadweight, secondary dead load, and fatigue load model I. Last, fatigue load model III is taken into consideration with a combination of the deadweight and secondary dead load, while the positions of fatigue load model III differ with four types in longitudinal and transversal distributions.
To comprehensively obtain and evaluate the most critical stress amplitudes in the entire bridge deck of the NWSBCB, the Mises stresses under different load combinations are analyzed and compared in the present study. Additionally, this research also focuses on the structural behaviors of the composite deck segment under transverse fatigue loading, considering the feasibility and convenience of the fatigue test. Therefore, it also pays attention to the transverse stress (stress component S11) of the composite bridge deck in this study.
The calculation results of the FE model under various load combinations are summarized in Table 1, with further details discussed below. From Table 1, it is shown that under the fourth load combination, which is a combination of the deadweight, secondary dead load, and a single lane load in a full bridge, the maximum Mises stress in the concrete bridge deck reaches 7.08 MPa at the middle supporting zones. Similarly, under the action of the deadweight, secondary dead load, and single-lane load only distribution in the mid-span, the maximum tensile stress in the transverse direction of the concrete bridge deck reaches 2.42 MPa at the middle supporting positions. Under these design loads, the concrete bridge deck at the middle supporting zones is at risk of cracking, and the implementation of crack prevention measures at these positions is recommended.
Compared with the results of various combinations with fatigue wheel loads, it is observed that the maximum transverse stress in the composite bridge deck is detected when using fatigue wheel load model III with longitudinal distribution 2 and transverse distribution 3. In such case, the fatigue wheel load is located longitudinally at the mid-span where the maximum vertical value of longitudinal influence line is, and distributes transversely in the middle of the bridge deck where the maximum vertical of transverse influence line dominates. The maximal tensile stress in the concrete bridge deck and atop the steel plate is 1.073 MPa and 10.14 MPa, respectively, as shown in Figure 10.

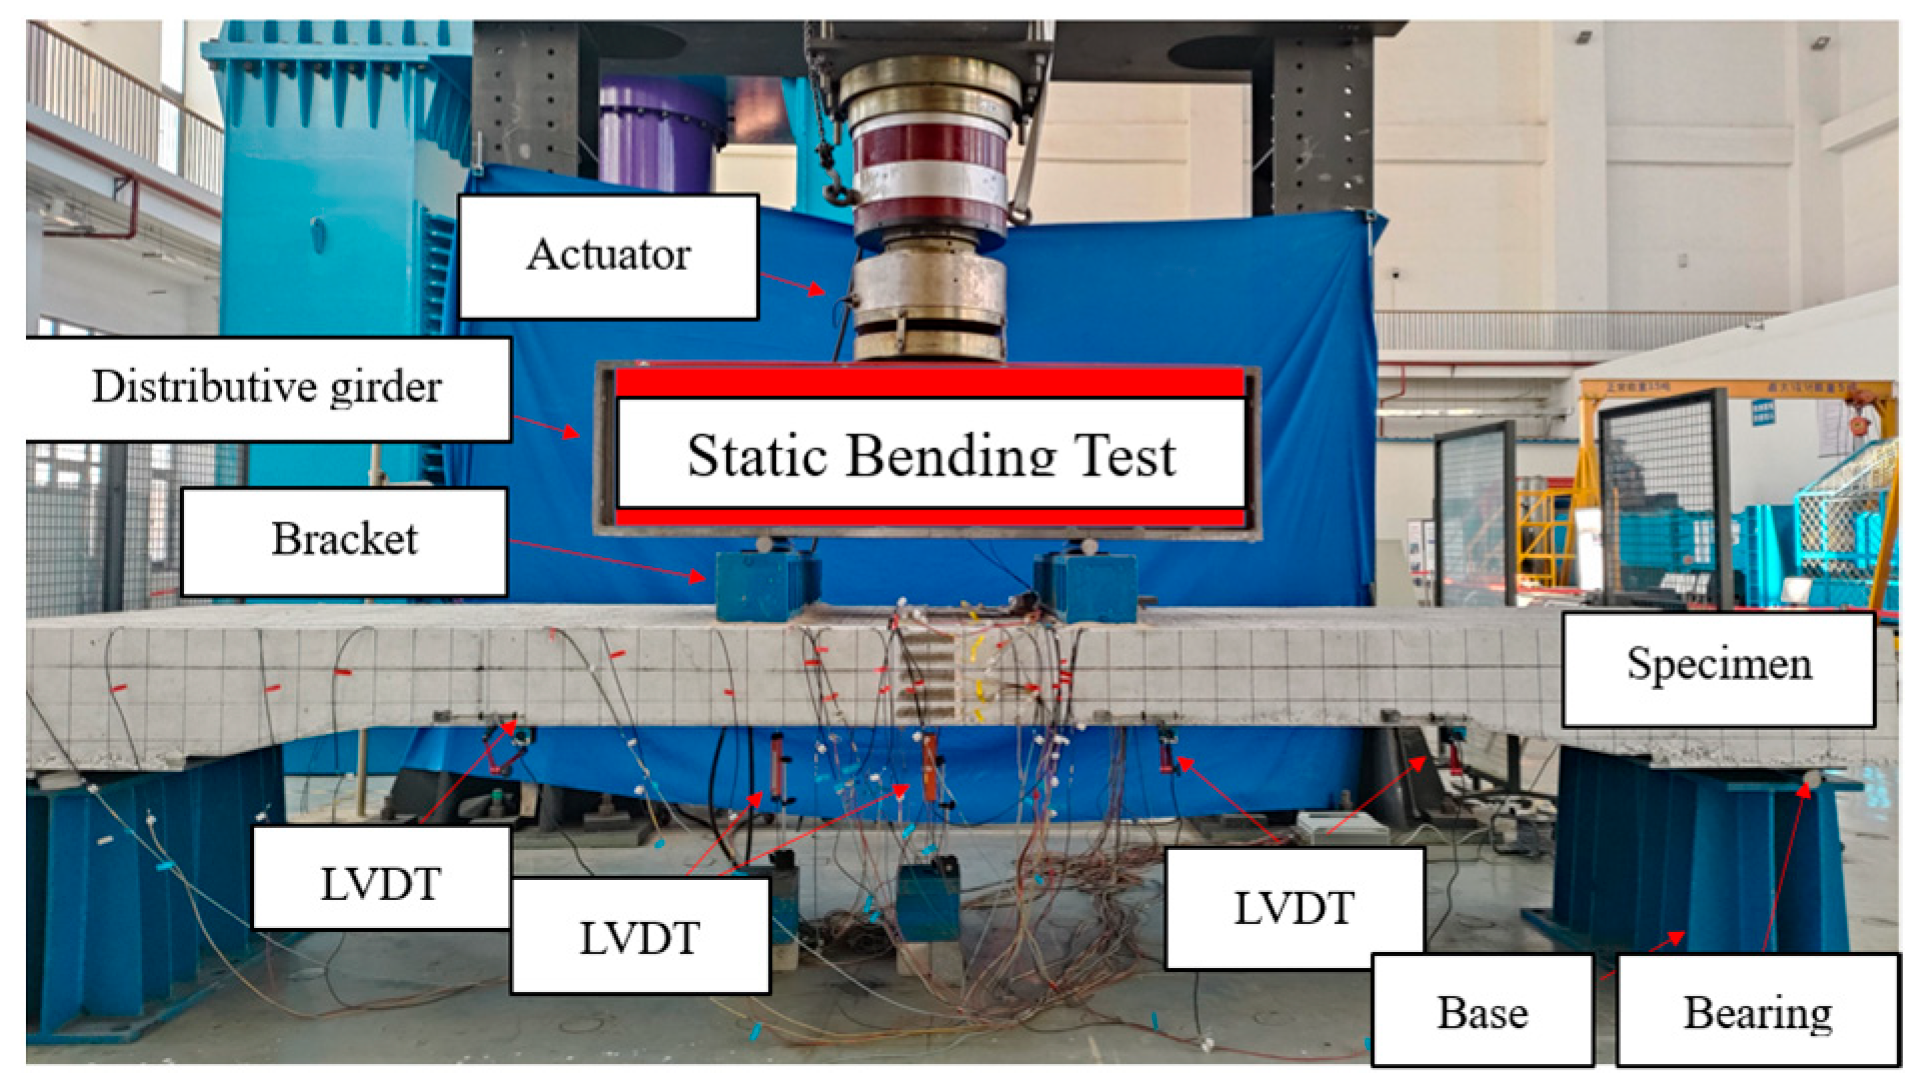
4. Static Bending Test of the Steel–Concrete Composite Bridge Deck for the NWSBCB

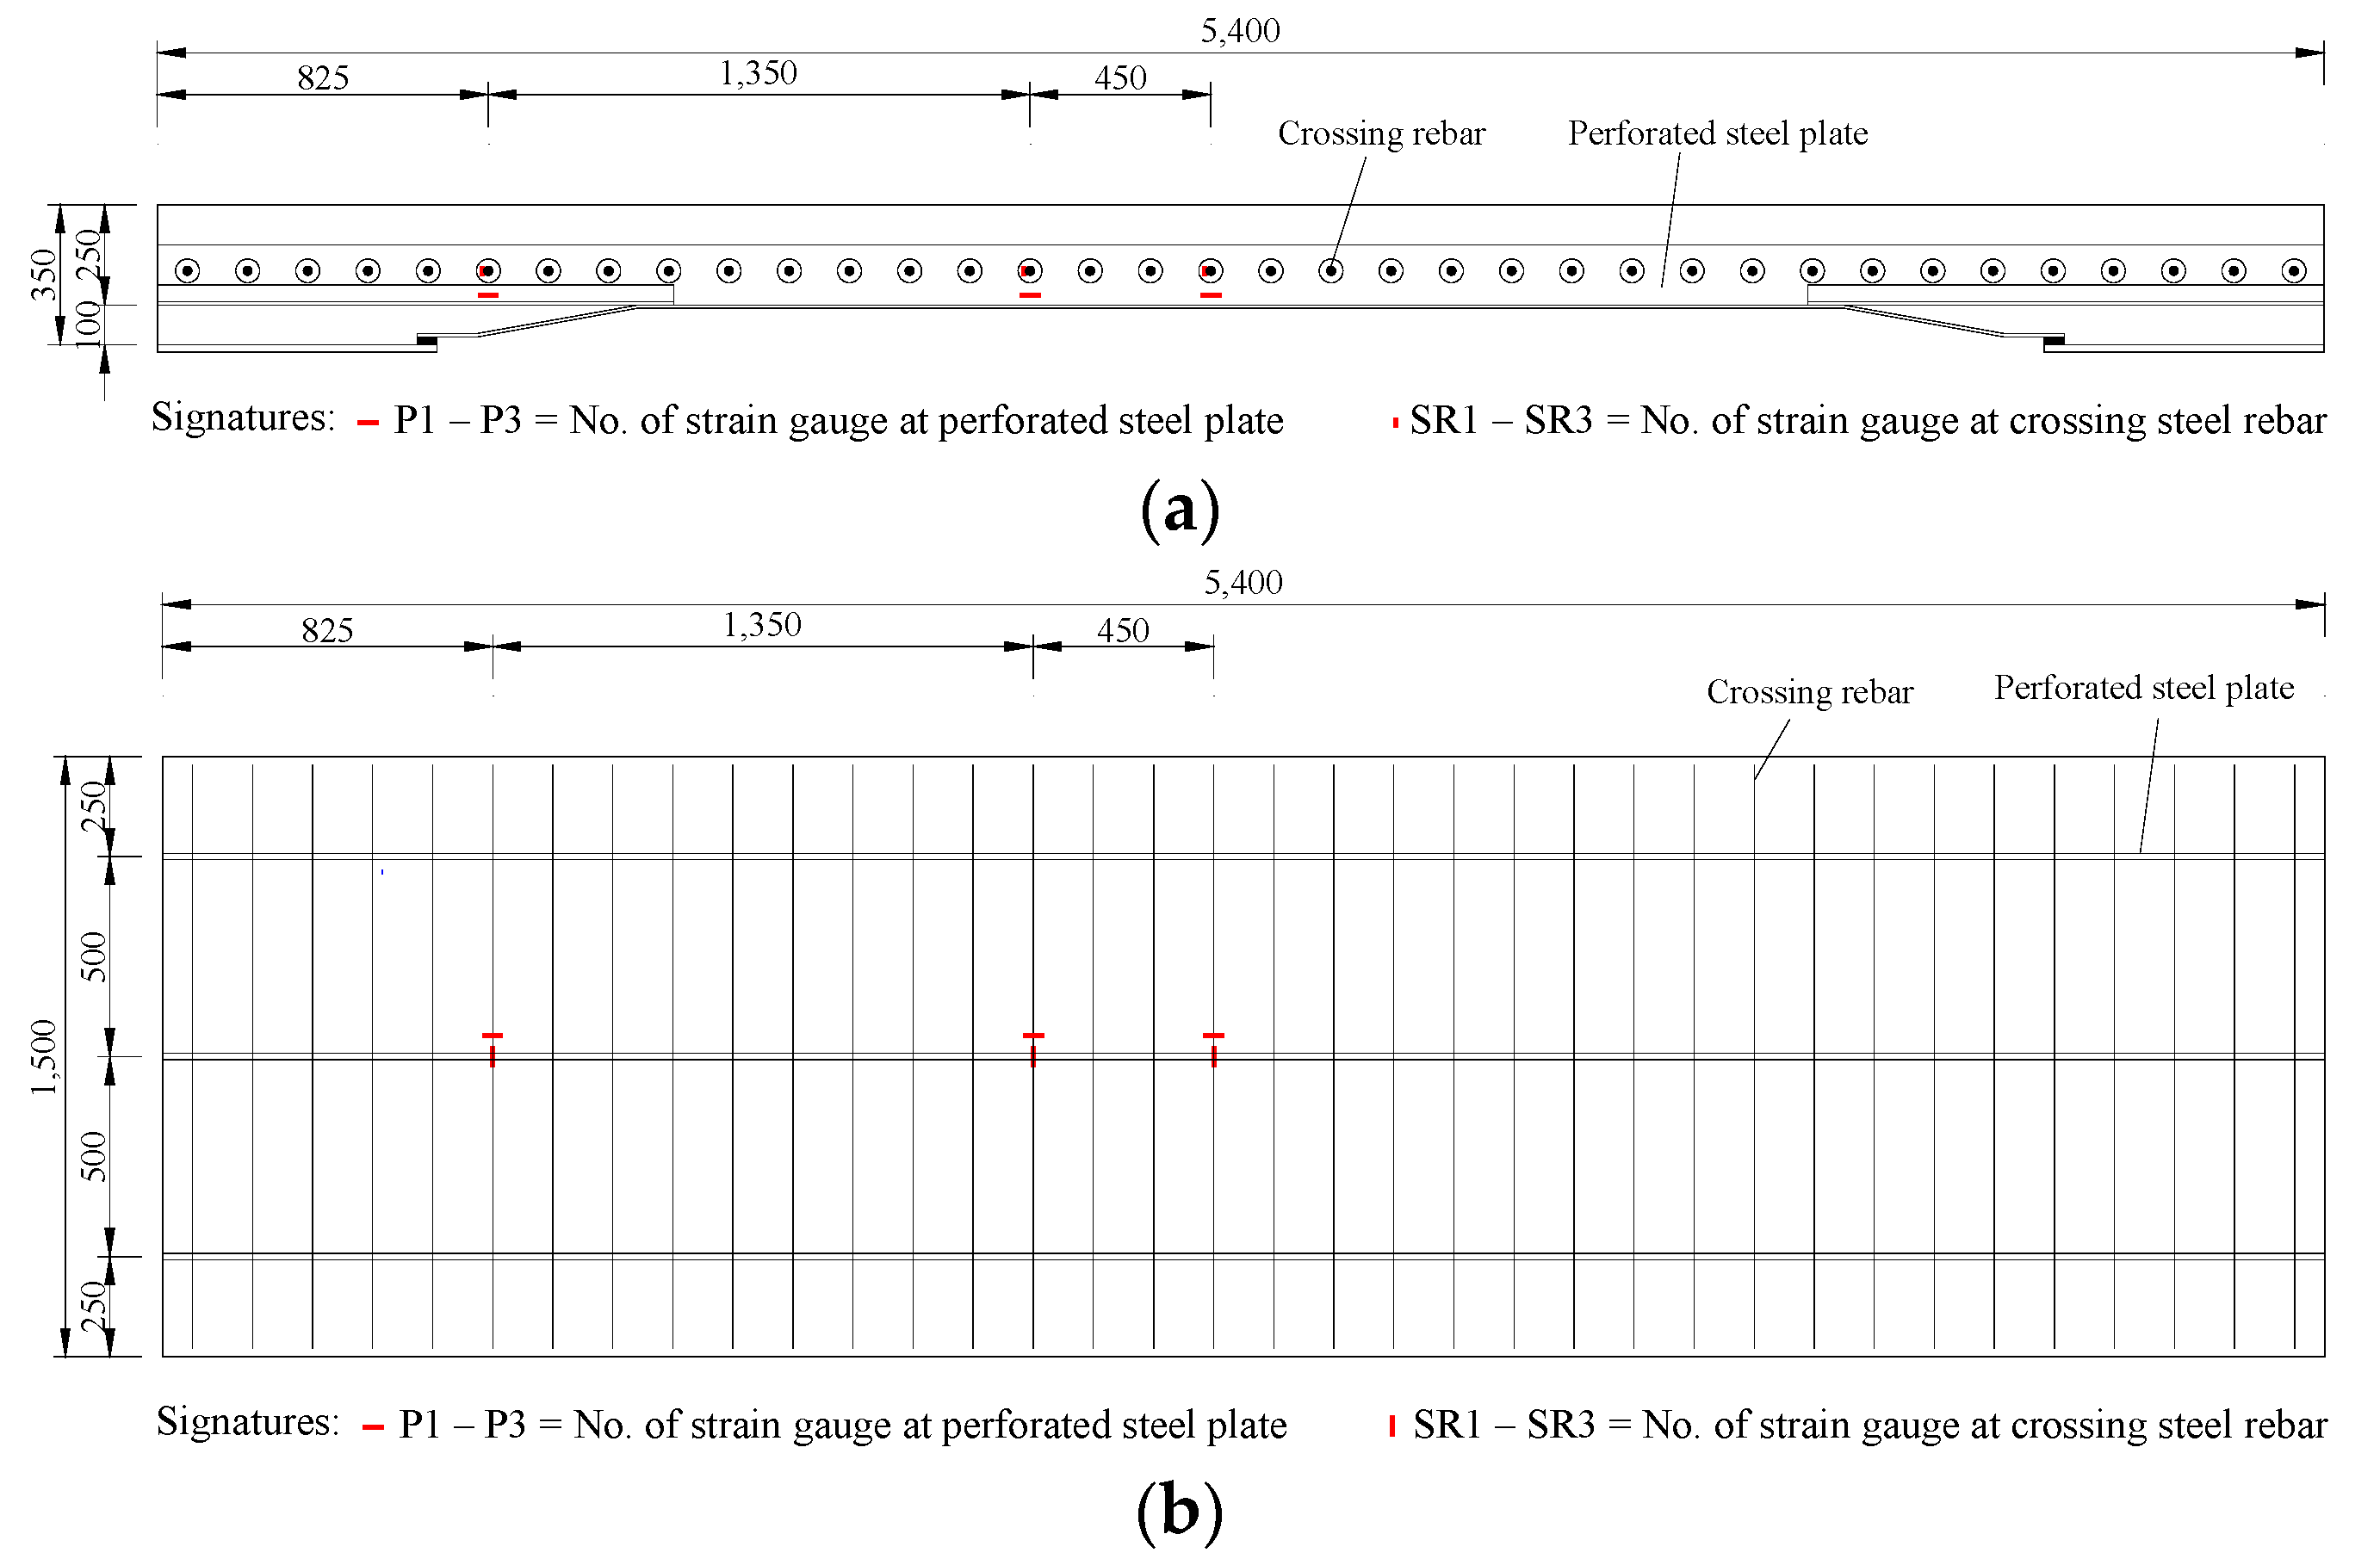
4.1. Experimental Design

To serve as benchmarks for fatigue tests on composite bridge decks under transverse bending, two full-scale models featuring both PBL connectors and stud connectors are designed and fabricated. To analyze the flexural mechanical performance of composite bridge decks with different connection configurations, static bending tests are conducted. Based on the design of the actual bridge deck of the NWSBCB on the highway bridge from Keqiao to Zhuji, the segment of composite bridge deck located between the edge girder and central element is chosen as the research object, as shown in Figure 11. Full-scale model specimens with dimensions of 5400 mm × 1500 mm (length × width) are designed for both PBL connectors and stud connectors. Both specimens display variations in their thicknesses of concrete layers with a 250 mm depth of the middle part and 350 mm depth of the supporting part, whereas the bottom steel plate maintains a consistent thickness of 8 mm.
The composite deck specimens undergo loading via a four-point bending approach, as shown in Figure 12. The specimen spans 5200 mm with a pure bending length of 1000 mm, and it is supported on the bearing at both ends. A 5000 kN hydraulic jack is used for static loading, and the loading process adheres to the guideline entitled “Standard for Test Method of Concrete Structures (GBT 50152-2012)” [31]. A loading rate of 1 mm/s is adopted, taking into account the balance of the test duration and static process stability.

4.2. Test Results

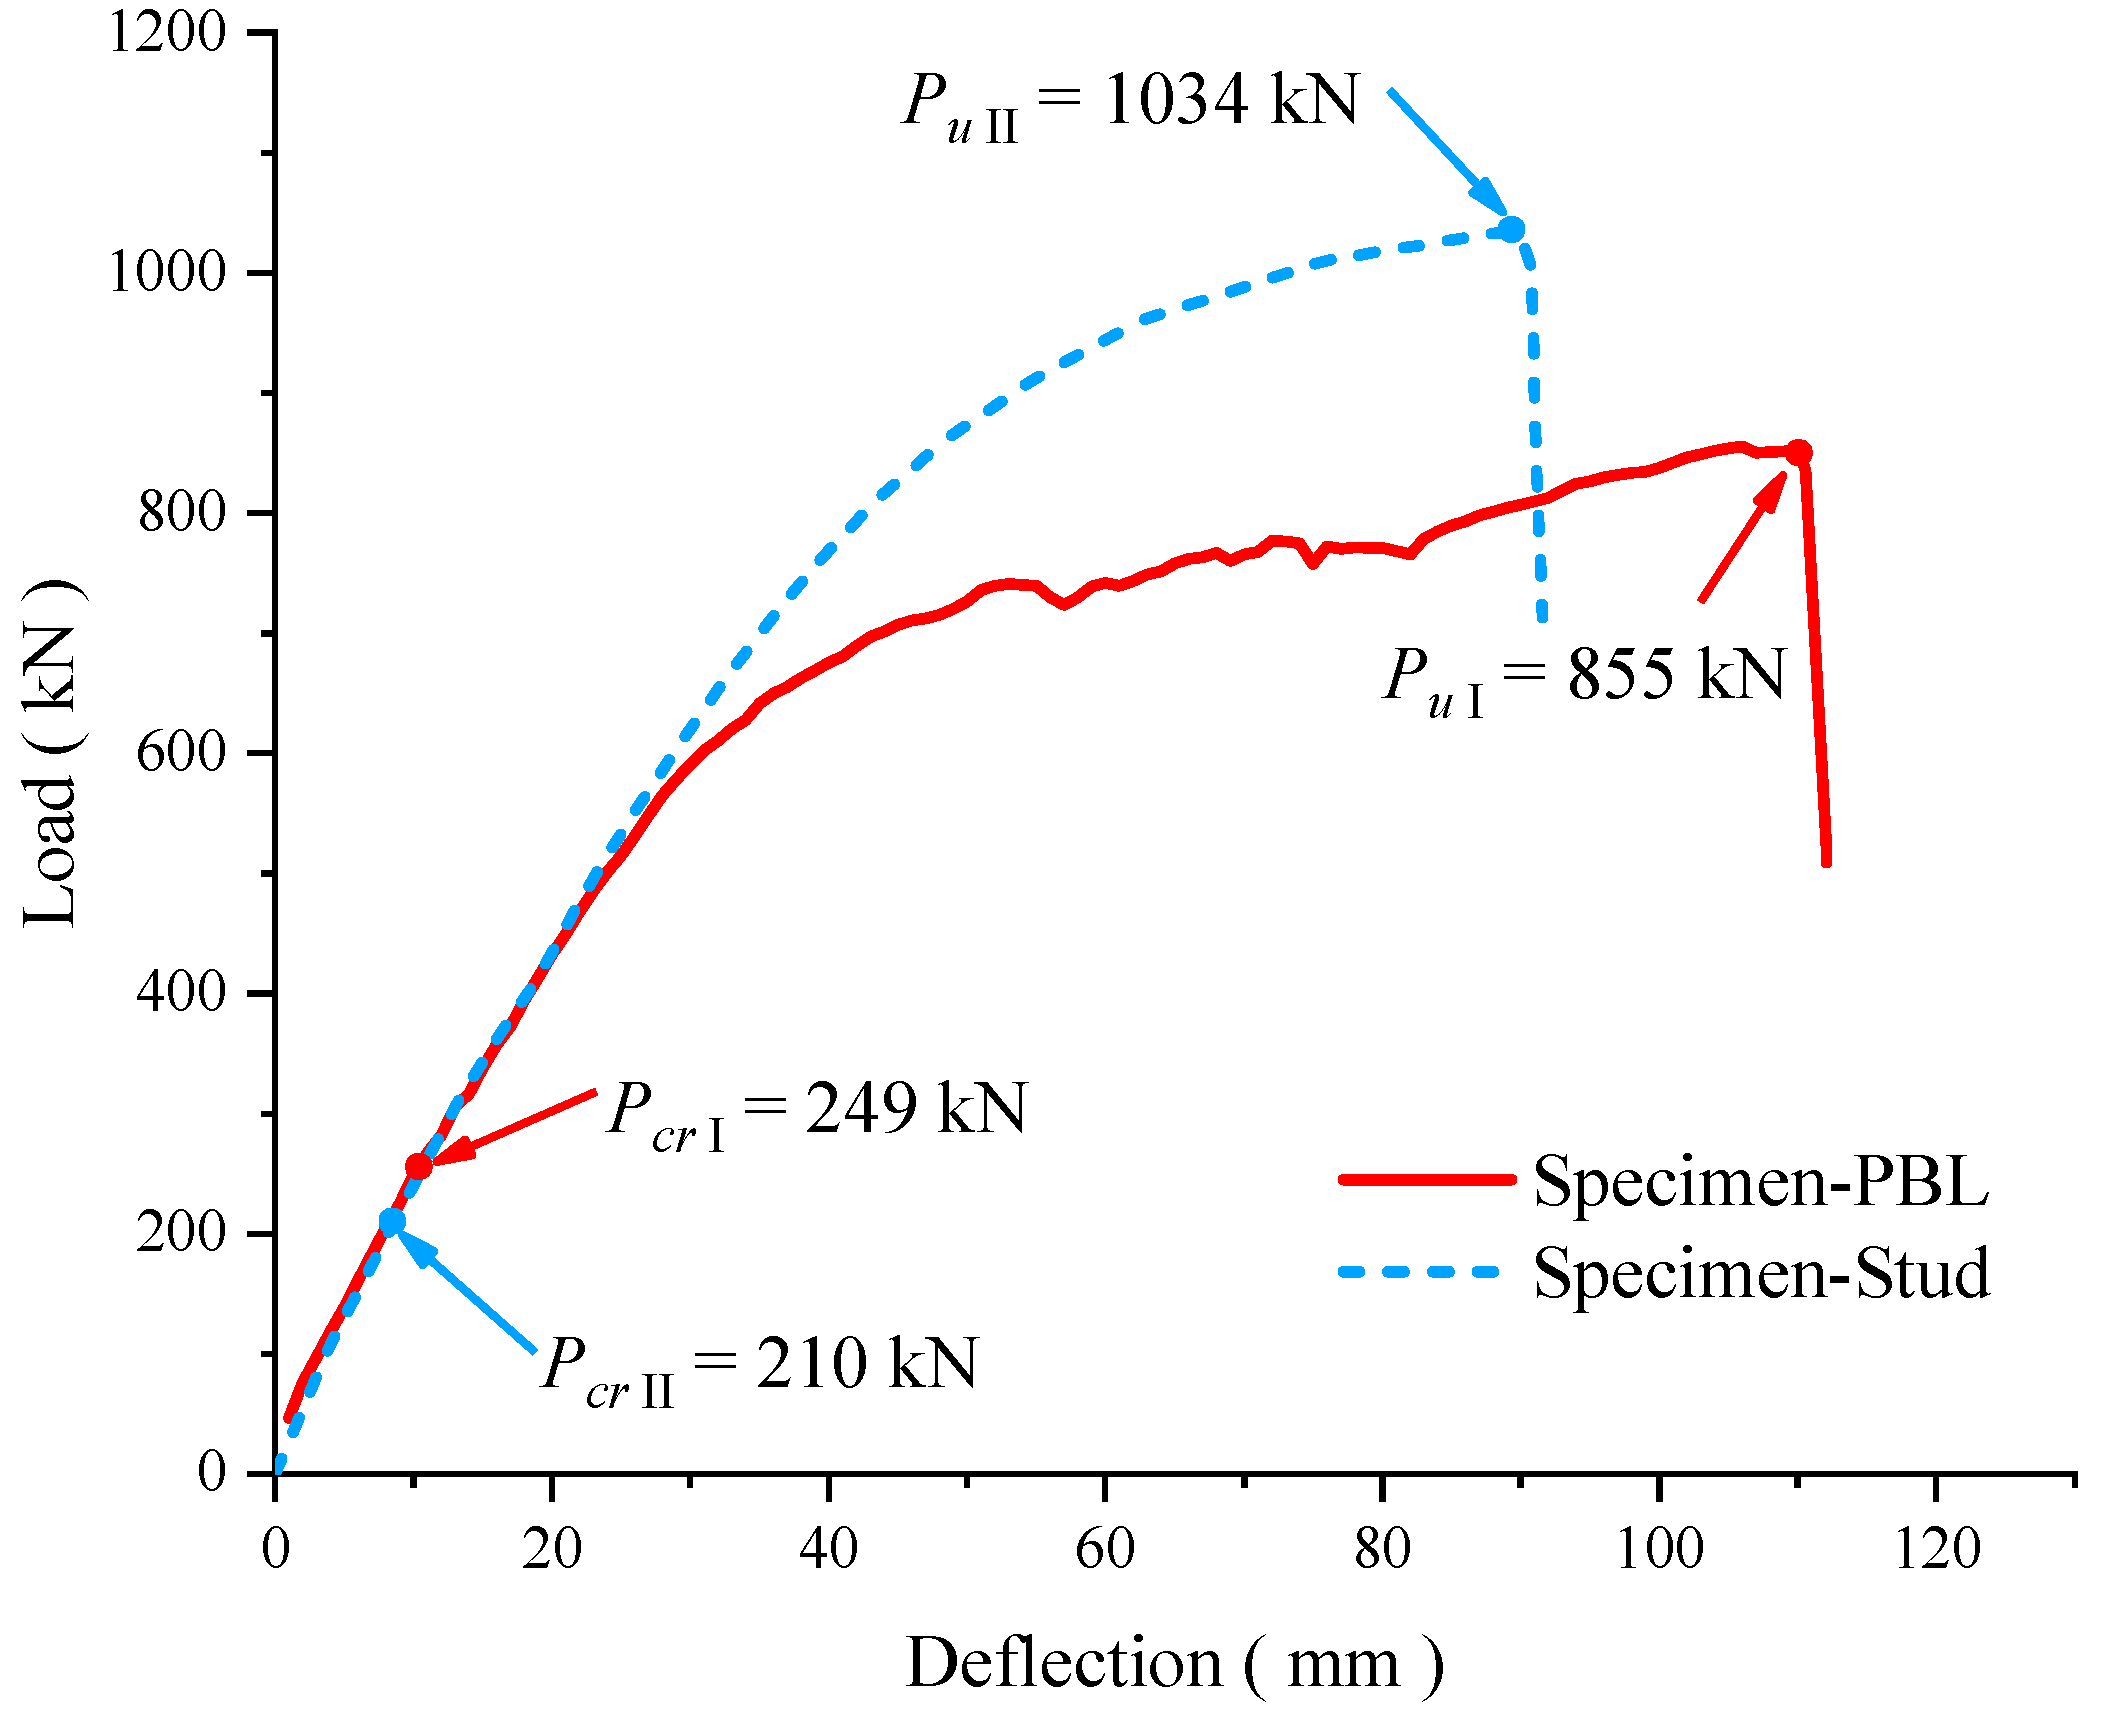
4.2.1. Load-Deflection Curve

Load-deflection curves of composite bridge deck specimens under static bending are illustrated in Figure 13. The characteristic values, including the cracking and ultimate loads of the composite deck specimens, have been ascertained. Table 2 summarizes the characteristic values corresponding to the cracking and ultimate loads of composite bridge deck specimens in the static bending tests. Those characteristic values are discussed herein. The composite deck specimen featuring PBL connectors withstood a cracking load of 249 kN, approximately 18.6% higher than its counterpart with stud connectors, which had a cracking load of 210 kN. Interestingly, the plastic development of the composite deck specimen with stud connectors proceeds more slowly than that of the specimen with PBL connectors. The peak load of the composite deck specimen with stud connectors is 1034 kN, 20.9% higher than the counterpart of 855 kN observed for the specimen with PBL connectors. This indicates that the composite deck specimen with stud connectors exhibits superior overall flexural stiffness relative to the specimen with PBL connectors.

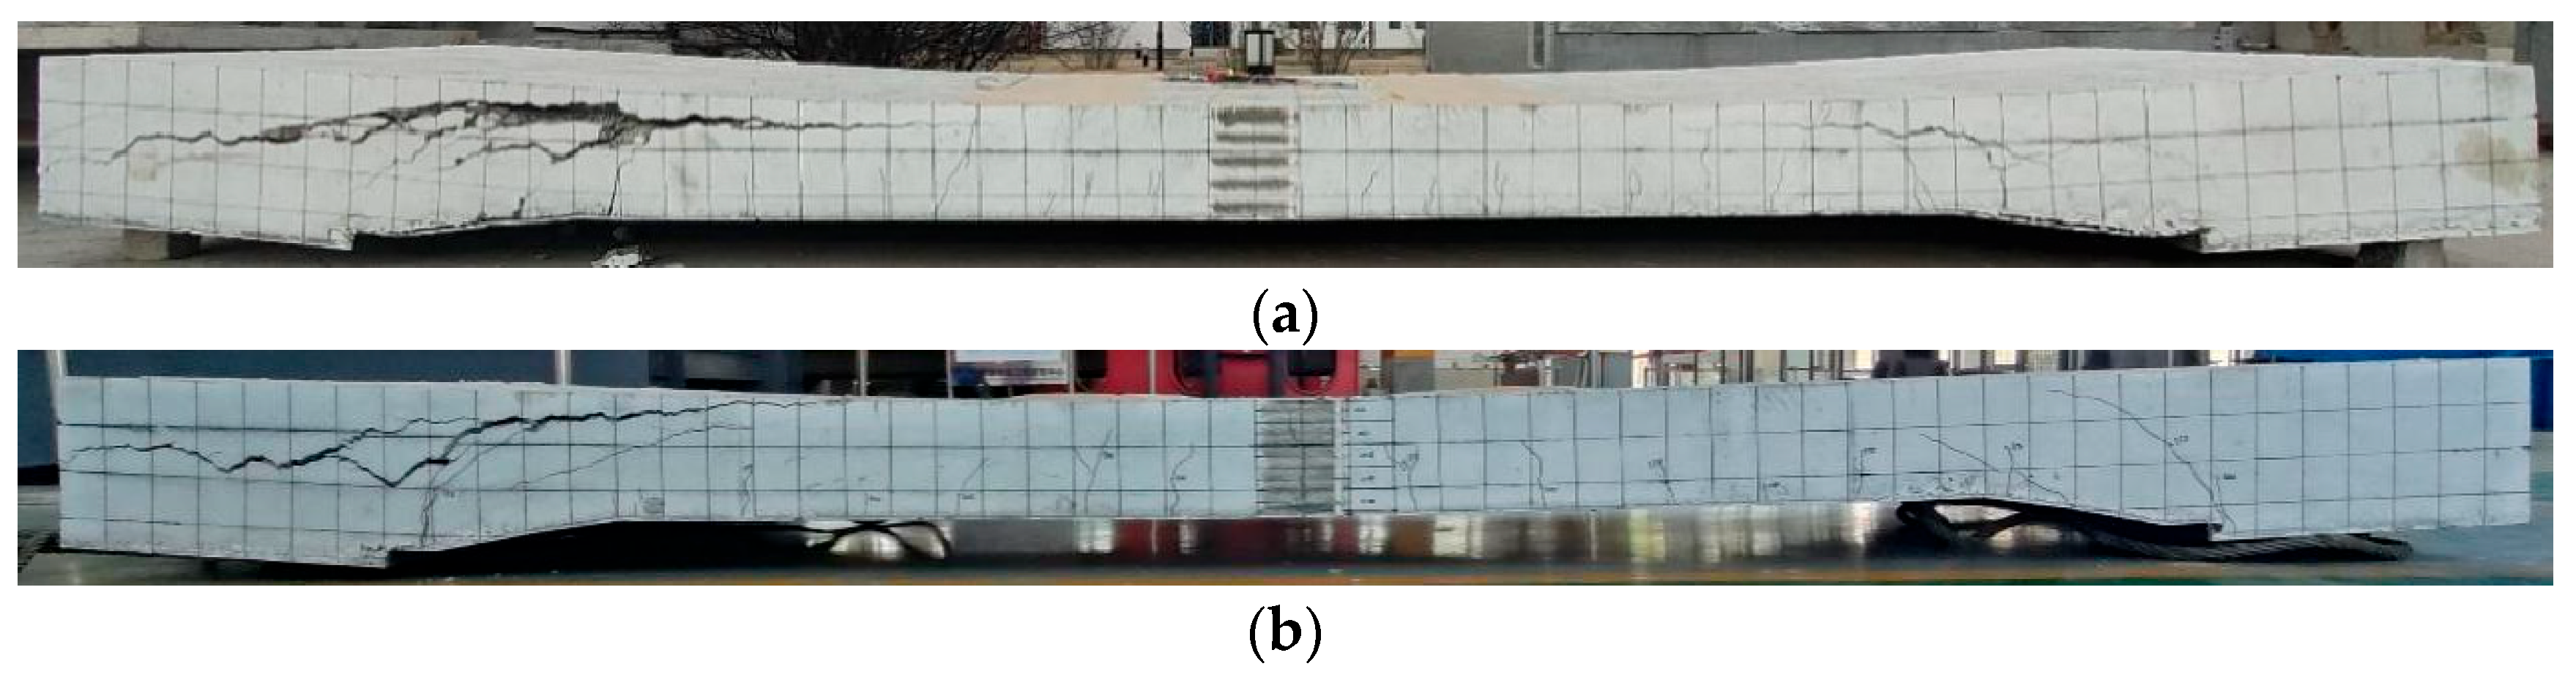
4.2.2. Crack Propagation

In the case of composite bridge deck specimen with PBL connectors, during the initial phase of testing, the specimen exhibits linear elastic behavior. As the applied load escalates to 249 kN, an array of minuscule cracks initially becomes discernible within the pure bending zones. Visible cracks (width = 0.182 mm) appear on the side faces of the concrete layer in the variable depth zones; meanwhile, some slips emerge on the interface between steel plate and concrete layer at the bottom at the variable section, as shown in Figure 14a. As the load applied increases, the concrete cracks in the variable depth zones continue to expand. When the load reaches 730 kN, the continuous failure sound of the specimen is obviously heard, and the interface slip between the steel plate and the concrete layer at the bottom of the variable depth zone enlarges. With a further increase in the applied load, the mid-span deflection of the specimen increases significantly, while the load-bearing capacity increases slowly and the specimen goes into the obvious plastic stage. Concurrently, the crack within the variable depth zone propagates, and both the crack width and the interface slip between the bottom steel plate and concrete layer augment (see Figure 14a). Upon reaching the zenith load of 835 kN, an abrupt shear failure manifests on one side of the concrete layer in the specimen, followed by a significant decrease in load. It implies that the specimen reaches the strength limit, and there are several cracks in the pure bending zone of the specimen. The maximum crack width is about 2 mm, as shown in Figure 14b.
For the composite bridge deck specimen with steel stud connectors, the specimen exhibits elastic behavior during the initial stage of test loading. When the load exceeds 210 kN, cracks start to appear for the first time on the concrete side from the loading point to the pure bending zone, and the interface between the steel plate and the concrete overlay at the bottom of the variable depth zone debonds. At this moment, the crack width and the slip width are approximately 0.164 mm and 0.6 mm, respectively. As the applied load increases, inclined cracks are also observed in the concrete layer, and the interfacial debonding slip develops gradually. As the load increases from 800 kN to 850 kN, the specimen emits an obvious fracture sound resembling a “click”. Meanwhile, the cracks in the pure bending zone propagate, and the inclined cracks in the concrete layer of cross-section variable zone enlarge considerably. The interface debonding slip is 1.88 mm, and the mid-span deflection increase significantly, indicating that the specimen has entered a plastic stage, as shown in Figure 15a. When the load peaks at 1034 kN, a sudden shear fracture occurs on one side of the specimen, followed by a large decrease in the load. Eventually, several cracks within the pure bending zone of the specimen markedly expand, with the widest crack surpassing 2 mm, as shown in Figure 15b.

4.2.3. Failure Pattern

Figure 16 gives the failure photos of composite deck specimens under static bending loading. Figure 16a reveals that the ultimate failure mode of the composite deck specimen with PBL connectors is characterized by a diagonal shear failure in the variable depth concrete section. The bottom steel plate of such specimen does not yield, yet considerable deformation is observed at its variable height section, resulting in a noticeable delamination gap at the interface between the bottom steel plate and the concrete overlay. When it comes to the composite deck specimen with stud connectors, the failure appears similarly to diagonal shear failure in the variable depth concrete section (see Figure 16b). In this instance, however, yield occurs in the bottom steel plate of the specimen, accompanied by relatively minor delamination gaps at the interface between the steel plate and the concrete overlay.

5. Fatigue Bending Test of the Steel–Concrete Composite Bridge Deck for the NWSBCB

The composite action of the steel–concrete composite member hinges upon the reliable connection between steel beams and the concrete deck. Shear connectors play a crucial role in facilitating composite action in these structures. However, shear connectors subjected to repeated vehicle loading are prone to fatigue failure. In order to examine the fatigue characteristics and failure behavior of composite bridge decks for the NWSBCB under transverse bending, we engineered and fabricated two full-scale specimens of composite bridge decks featuring both PBL connectors and steel studs in this study. By conducting fatigue bending tests, the fatigue behaviors of composite bridge deck specimens equipped with different shear connectors were analyzed.

5.1. Fatigue Test Design

To enable a straightforward comparison of test outcomes, the fatigue test model is designed to be identical to the aforementioned static test model. Based on the actual bridge design of the NWSBCB, the sections of the composite bridge deck between the edge member and middle element are selected to fabricate the research specimens (see Figure 11). Full-scale models of composite bridge decks with PBL and stud connectors are designed and fabricated, and those detailed dimensions are shown in Figure 17 and Figure 18 and Table 3.
For the composite deck specimen with PBL connectors, the concrete layer is affixed to the bottom steel plate via three perforated steel plates. The connecting steel plates are 150 mm high and 14 mm thick, spaced at intervals of 500 mm. The perforated steel plates feature drilled holes of 60 mm in diameter uniformly spaced at 150 mm apart. The steel bars crossing the drilled holes are 22 mm in diameter, as shown in Figure 17.
For the composite deck specimen with stud connectors, the concrete overlay is connected to the bottom steel plate via three perforated steel plates, which feature drilled holes without crossing rebars. Instead, the concrete overlay is connected to the bottom steel plate through welded stud connectors. The stud connectors have dimensions of φ22 × 200 mm and are arrayed longitudinally at 250 mm apart and transversely at 400 mm intervals, as presented in Figure 18. The dimensions, configuration, and layout of the steel mesh within the specimens are identical to those of the actual bridge design. The concrete layer consists of C40-grade concrete with an added micro-expanding agent, and the steel plate is of Q345-C grade, while the rebars are made from HRB400-grade ribbed steel.

5.2. Fatigue Specimen Fabrication and Processing

Photos of the fabrication and processing of the composite deck fatigue specimens are presented in Figure 19.

5.3. Measurement Arrangement

To track the deflection changes in composite deck specimens under fatigue loading, three electronic Linear Variable Differential Transformers (LVDTs) are positioned at the mid-span and two loading sections. Furthermore, to mitigate the influence of bearing deformations on the mid-span section deflection, two LVDTs are placed atop each end of the bearing position. Additionally, five linear variable displacement transducers are distributed along the span, from the mid-span to the bearing sections, measuring the relative slip and deformation at the corresponding positions. The LVDTs used to measure deflection have a maximum range of 50 mm with a precision of 0.1 mm, and the LVDTs for slip measurement are chosen with a maximum range and precision of 25 mm and 0.1 mm, respectively. The arrangement of measurement points for slip and deformation is illustrated in Figure 20a.
To capture the variation trend of strain in response to loading patterns, strain gauges are affixed longitudinally at the mid-span area and the bending–shear zone of the composite deck specimen both on the top surface and side surfaces of the concrete layer, as well as on the top and bottom surfaces of the steel plate. As shown in Figure 16 and Figure 20b, four cross-sectional positions are selected along the span on the top surface of the concrete layer and the bottom surface of the steel plate, including three pure bending sections and one bending–shear section. On each cross-section, five strain gauges are aligned transversely, each separated by a spacing of 250 mm. Additionally, on the side surfaces of the concrete layer at both the mid-span section and the variable depth sections, five strain gauges are placed vertically, each spaced 50 mm apart. Informed by the static test results of the composite deck specimens, three strain rosettes are installed height-wise to simultaneously capture the bending and shear deformations at a designated section within the variable depth zones, where bending and shear stresses are intricate (refer to Figure 20a).
To ascertain the stress state of the perforated steel plates and steel rebars, strain gauges are pre-embedded on the perforated steel plates and the top layer of the reinforcement mesh, as shown in Figure 21. For the composite deck specimen with PBL connectors, strain gauges are additionally embedded at the crossing steel rebars to monitor their stress state, as shown in Figure 22. For the composite deck specimen with stud connectors, strain gauges are placed longitudinally on several studs within the mid-span and supporting zones (see Figure 23). Each stud is equipped with one strain gauge on the tensile side and another on the compression side, enabling the measurement of the strains on both sides and thereby the determination of the shear force of the stud. Given the failure mode observed in the static tests previously mentioned, strain gauges are further placed on the studs within the bending–shear zones. During the tests, the crack widths of concrete layers for specimens with different shear connections are measured using a crack width measuring device; meanwhile, the stress evolution and damage propagation of steel elements are identified by monitoring the relevant strain gauges and a visual inspection of fatigue-sensitive details.

5.4. Fatigue Testing Procedure

Fatigue tests on composite deck specimens were carried out at Hunan Provincial Key Laboratory of Wind Engineering and Bridge Engineering of Hunan University. The fatigue loading equipment used was the PMZ2.0 electro-hydraulic pulsating fatigue automatic control testing machine with a load capacity of 500 kN, as shown in Figure 24. This machine provides several advantages for the automatic control of the overall process, which includes oil filling, venting, loading, static and dynamic load holding, output overload protection, timing and counting, unloading, and shutdown. The PMZ2.0 testing machine features a static load accuracy of 2.0% and a dynamic load accuracy of 3.0%. Deviations in the static force during load holding and in peak and valley forces during fatigue loadings were all kept to less than 1.0 kN.
The composite deck specimens were loaded vertically using a whole-cycle automatic control fatigue testing machine. During the test, a force sensor positioned beneath the actuator of the fatigue testing machine was employed to collect the applied loads and synchronously transmit the force data to the automatic control system for loading control, as shown in Figure 25. The fatigue test loading procedure comprises the following stages. First, for preloading, a vertical load of 5 kN was applied by the fatigue machine to eliminate any gaps at the contact surface between the actuator and the distributive beam or the interface between a specimen and the bearing. Subsequently, the data normality was checked and the system was unloaded following the accuracy calibration of the test system. Second, for the static loading cycle, a static load cycle was applied using a step-by-step loading and unloading method. The load cycle was as follows: 0 kN→20 kN→70 kN→120 kN→70 kN→20 kN→0 kN. Third, for the fatigue loading cycle, the peak load for fatigue loading was set as 0.15 Pu (120 kN), and the lower load was selected as 0.05 Pu (40 kN). The determination of the peak load for fatigue loading corresponded to the maximum tensile stress of the concrete bridge deck, as provided by the numerical modeling of the specimen tested. Considering the attainability and affordability of a low-cycle fatigue test, the lower value of the fatigue loading cycle was determined by a lower-to-upper ratio of 1/3. Fatigue loading was applied using load control, and a fixed frequency sine wave load was adopted. The targeted number of fatigue test cycles was two million, and the loading frequency was set as 4.0 Hz.
The study focuses on the fatigue behaviors of composite deck specimens subjected to a total of two million fatigue loading cycles. Therefore, it is necessary to subdivide the fatigue loading process. When the fatigue loading cycle reaches 10,000 cycles, 50,000 cycles, 100,000 cycles, 200,000 cycles, 500,000 cycles, 1,000,000 cycles, 1,500,000 cycles, and finally 2,000,000 cycles, the fatigue loading is temporarily halted. Subsequently, the static loading cycle, as outlined previously, is applied while the measured test data are concurrently collected.

5.5. Fatigue Testing Results

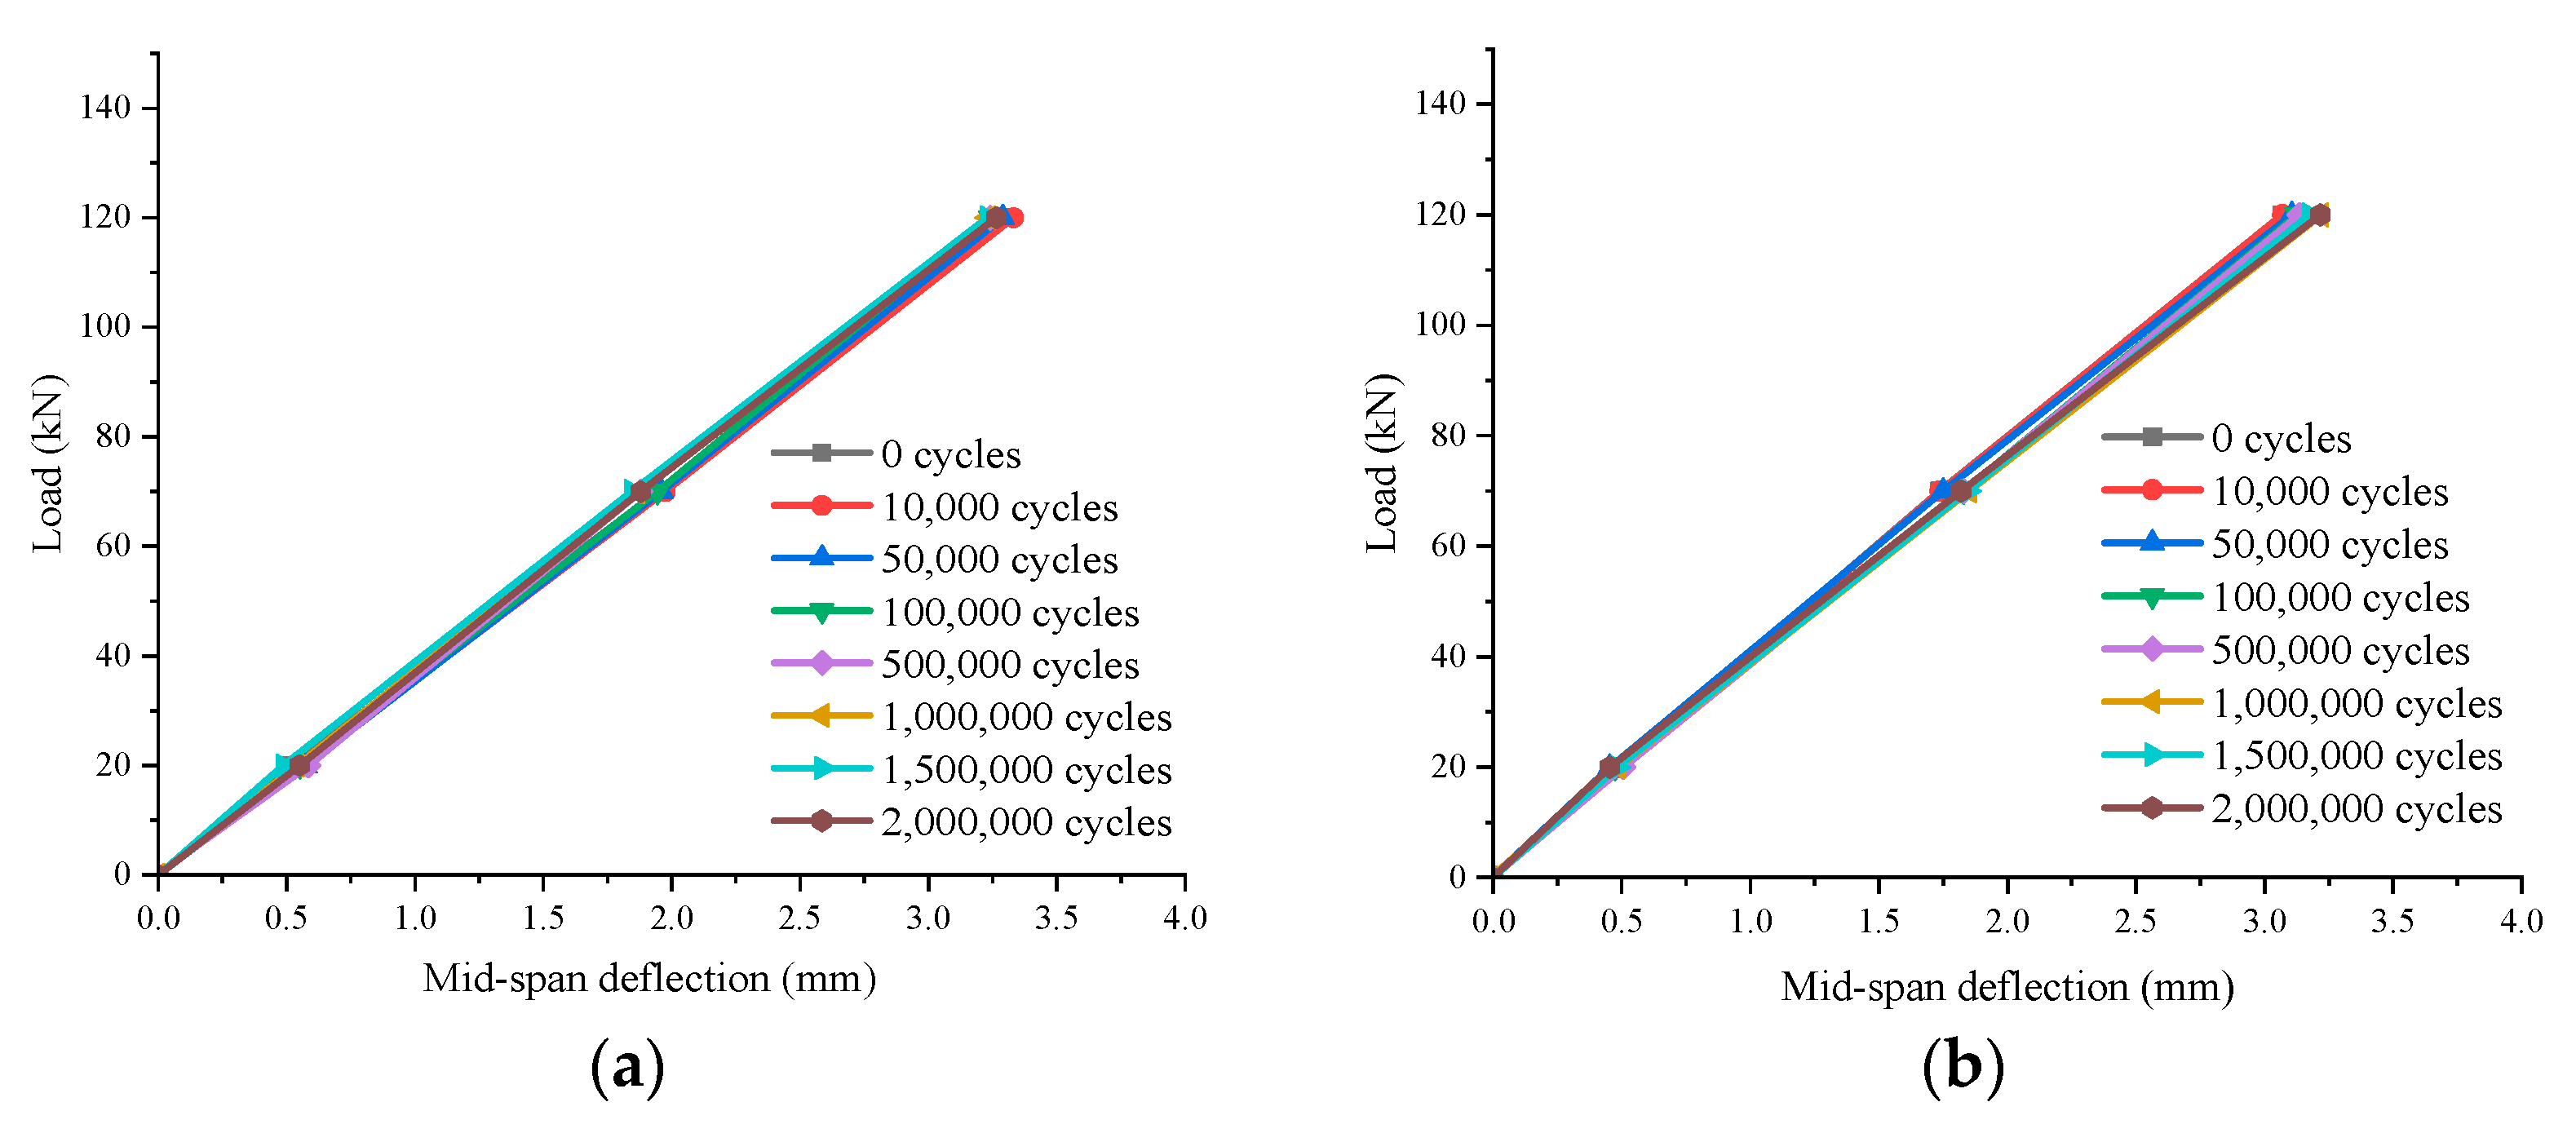
5.5.1. Load-Deflection Curve

To counteract the influence of the bearing deformation on the specimen deflection, mid-span deflection f is calculated using Equation (1):
f = D 3 D 1 + D 5 2
where D3 denotes the vertical deformation measured at the mid-span section; D1 and D5 correspond to the vertical deformations measured at the two ends of the supporting sections. The load-deflection curves for the composite deck specimens, measured at selected fatigue loading cycle intervals, are shown in Figure 26.

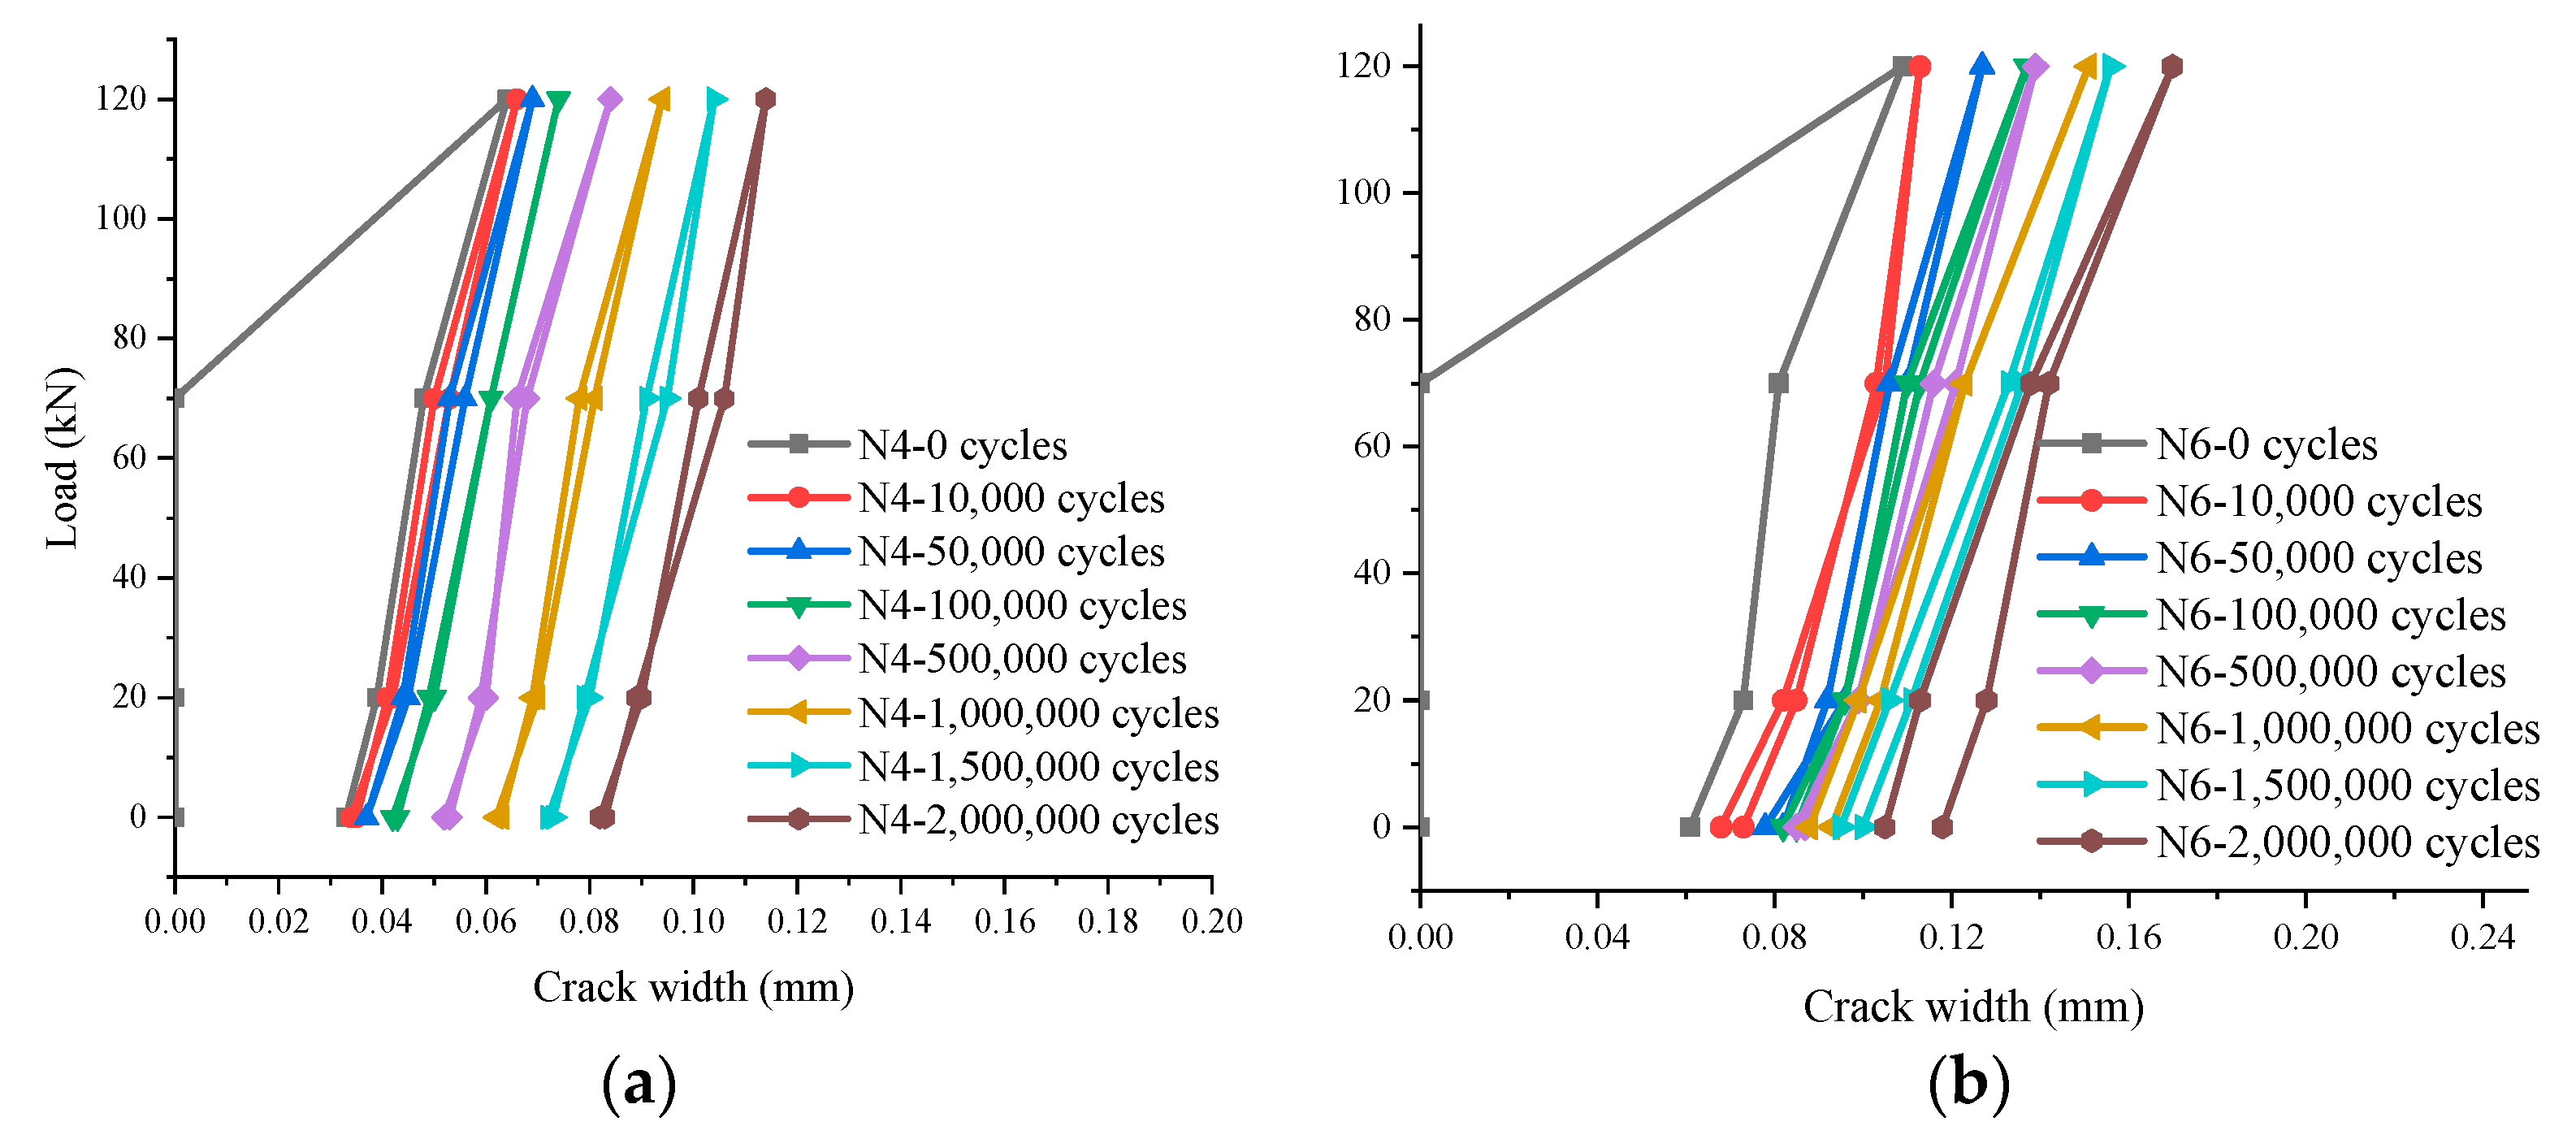
5.5.2. Load vs. Crack Width Curves

A schematic diagram depicting the crack distribution in the composite deck specimens with different shear connections following two million cycles of fatigue loading is presented in Figure 27. For instance, the composite deck specimen with stud connectors develops a total of twelve cracks after two million loading cycles. Among them, the fourth crack, labeled as N4 and situated beneath the left support on the east side of the specimen with a crack length of 18.0 cm, is chosen as the representative crack for analysis. The load versus maximum crack width curve for N4 is illustrated in Figure 28a. The composite deck specimen with PBL connectors exhibits a total of 10 cracks after two million loading cycles. The widest crack, labeled N6 with a crack length of 13.8 cm and located within the pure bending zone on the west side of the specimen, is selected as the representative crack for analysis. The load versus maximum crack width curve of N6 is shown in Figure 28b. As depicted in the figure, both composite deck specimens with stud connectors and with PBL connectors display a steady increase in the maximum crack width over successive fatigue loading cycles. After two million fatigue loading cycles, the maximum crack width for N4 in the composite deck specimen with stud connectors under a static load of 120 kN is 0.12 mm; conversely, for N6 in the composite deck specimen with PBL connectors, it reaches 0.17 mm.

5.5.3. Load vs. Longitudinal Slip Curves

The interface connection strength and stiffness of a composite member are crucial factors determining its load-bearing capacity. Herein, the trend of longitudinal slip at the interface of the composite deck specimens under various fatigue loading cycles is discussed. Figure 29 illustrates the longitudinal slip at the interface between the concrete layer and steel plate across different fatigue loading cycles. The figure shows that before reaching 100,000 cycles of fatigue loading, the longitudinal slips for both composite deck specimens are relatively small and increase slowly. After 500,000 cycles of fatigue loading, the longitudinal slip begins to increase rapidly as the loading cycles accumulate. Upon comparing the composite deck specimens with different shear connectors, the longitudinal slip of the specimen with the stud connectors is marginally larger than that of the specimen with the PBL connectors.

6. Analysis and Discussion

6.1. Influence of Fatigue Loading Cycles on Structural Bending Stiffness

In Figure 26, the composite deck specimens with both types of shear connections underwent two million loading cycles, with the fatigue load amplitude ranging from 40 kN to 120 kN. The changes in the slope of the load versus mid-span deflection curves for the composite deck specimens after different fatigue loading cycles are considered relatively minor. Additionally, after unloading, the mid-span deflection can nearly return to zero. This indicates that the structural bending stiffness of the composite deck specimens remains almost constant throughout the fatigue loading process.
The strain values measured on the bottom surface of the steel plate at the mid-span of the composite bridge deck exhibit relatively small variations with increasing fatigue loading cycles (see Figure 30). Therefore, the influence of the fatigue loading cycle on the overall structural stiffness of the composite deck specimens is considered moderate. Comparing the results of specimens with different shear connectors, it is noted that under identical fatigue loading cycles, the mid-span deflection of the composite deck specimen with stud connectors is slightly higher than that of the specimen with PBL connectors.

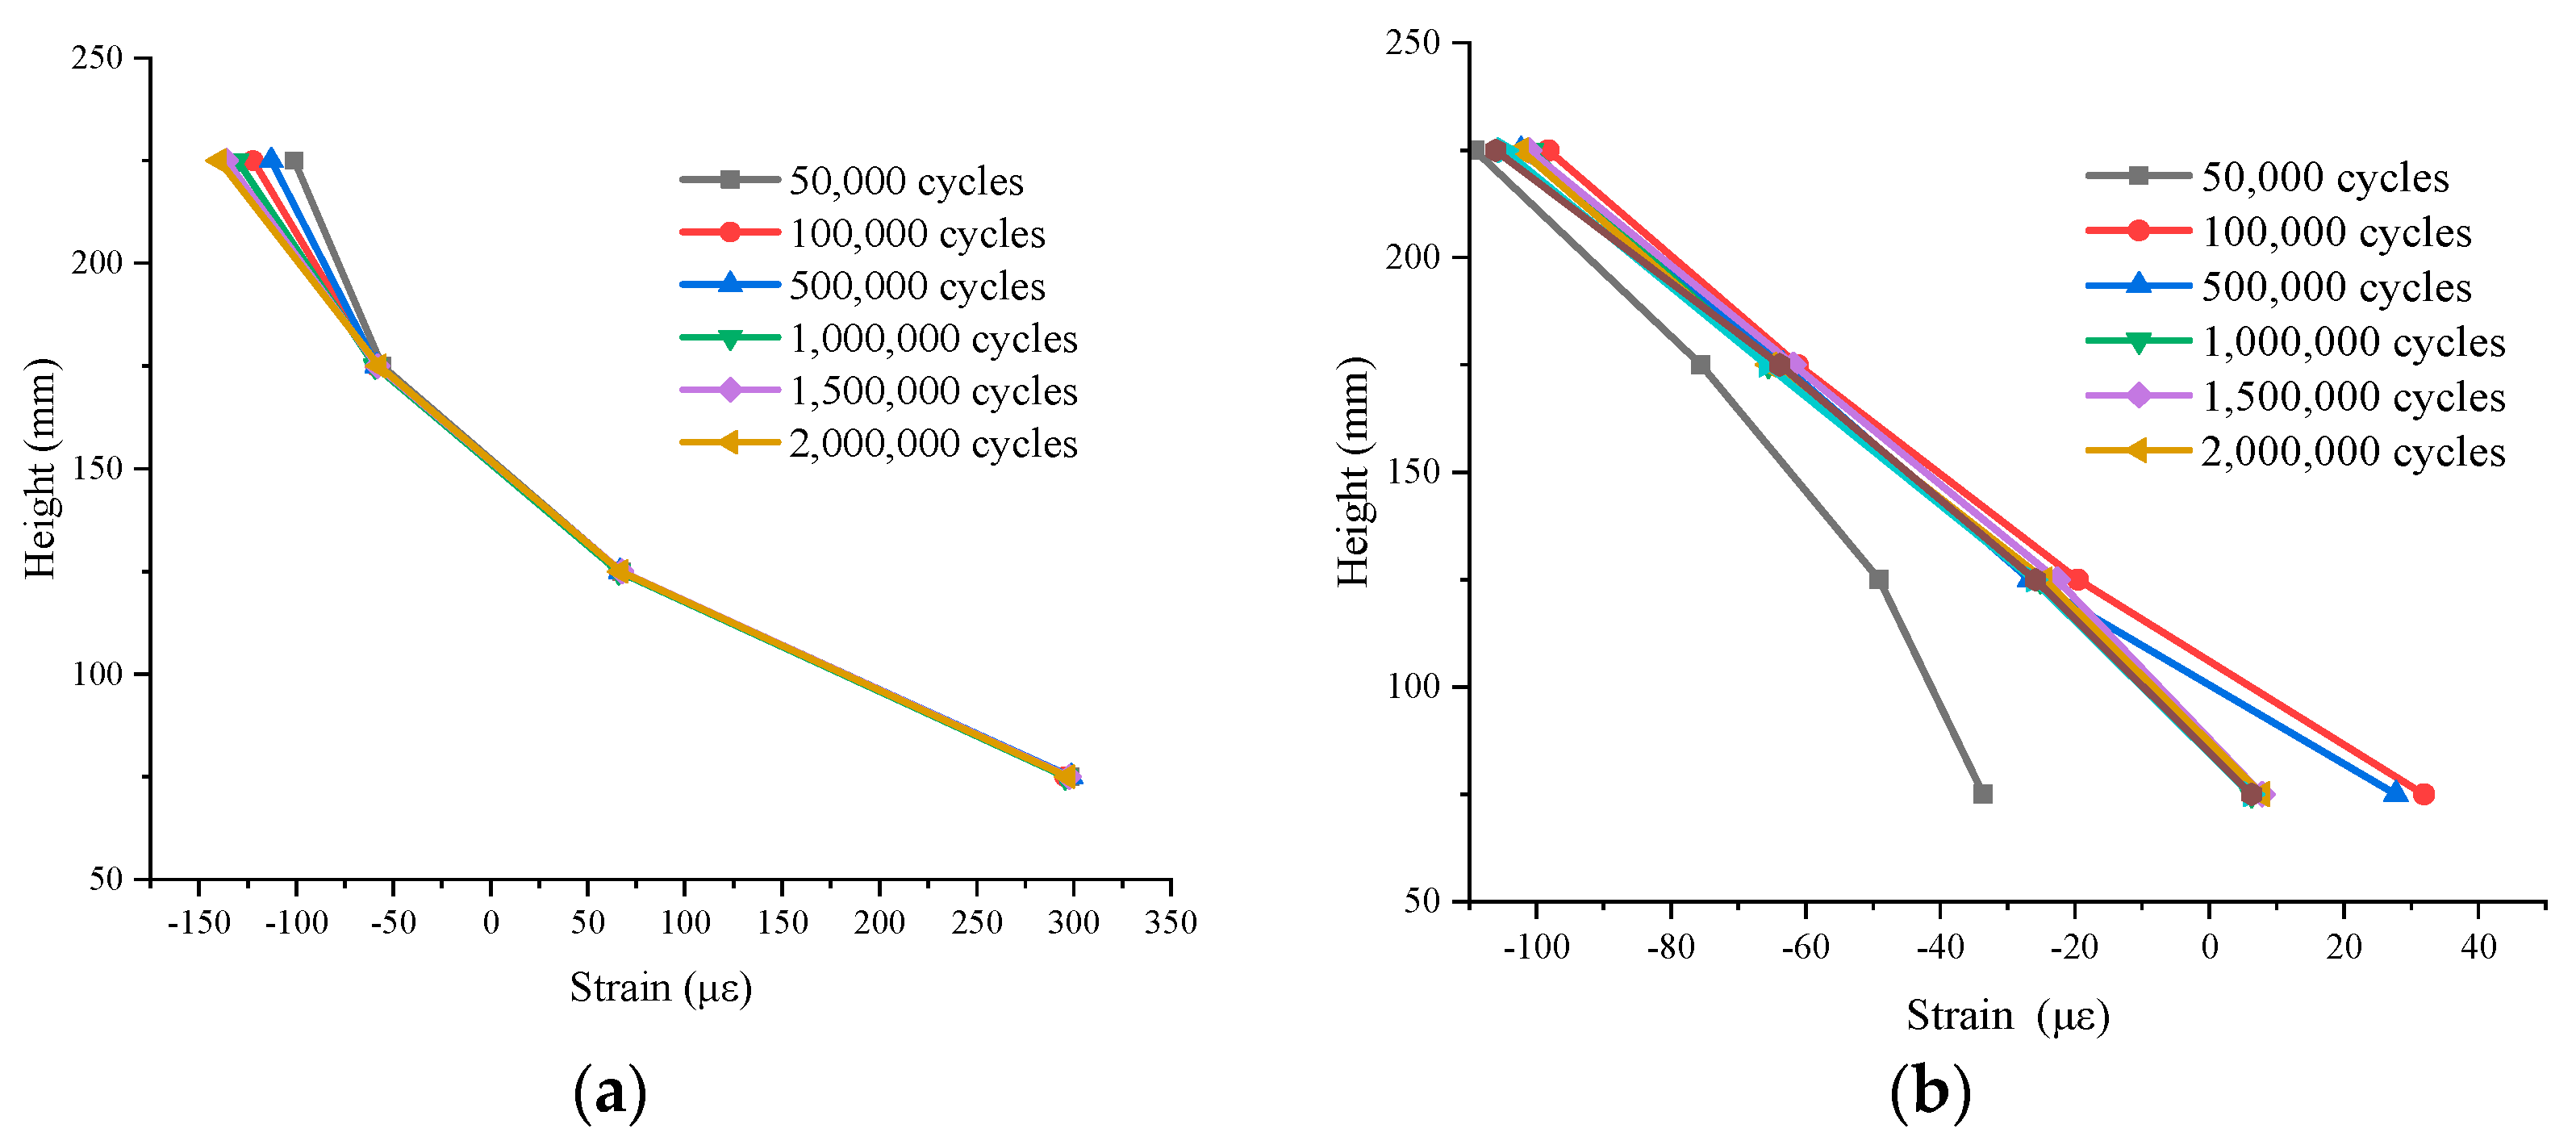
6.2. Trend of Sectional Strain Varying with Fatigue Loading Cycles

The strain distribution curves along the height of the cross-section at the midspan of the composite deck specimens under varying fatigue loading cycles are shown in Figure 31. The figure reveals that, regardless of composite deck specimens with stud connectors or with PBL connectors, the strain distribution curves exhibit relatively minor variations across the fatigue loading cycles. Moreover, the longitudinal tensile strains at the mid-span section display an approximately linear distribution along the specimen height. Comparing the results of composite deck specimens with different shear connections, it is noted that the height of the tensile zone in the composite deck specimen with stud connectors is smaller than that in the specimen with PBL connectors. Additionally, the tensile strains within the concrete layer are more pronounced in the composite deck specimen with stud connectors. This suggests that the composite deck specimen with stud connectors experiences higher tensile stresses in the mid-span bending zone, corroborating the earlier observation of a slightly increased mid-span deflection for the composite deck specimen with stud connections.

6.3. Interface Vertical Slips between the Concrete Layer and Steel Plate

Figure 32 illustrates the interface vertical slip between the concrete layer and steel plate of the composite deck specimen. In this figure, after two million fatigue loading cycles, the width of vertical slip of the concrete–steel interface near crack N1, located in the variable depth zone of the composite deck specimen with stud connectors, is 0.21 mm under a static peak load of 120 kN, while near crack N9, it reaches 0.26 mm (see Figure 32a).
For the composite deck specimen with PBL connectors, after two million fatigue loading cycles, the vertical slip width at the interface under static peak load is as high as 0.85 mm, which indicates significant delamination at the interface between the concrete layer and the steel plate (see Figure 32b). Considering that the typical concrete crack width limit for normal service is 0.2 mm, it is evident that the delamination width at the interface bond in the specimens surpasses this limit. This suggests that delamination failure at the interface within their variable depth zones is present in the composite deck specimens with different shear connectors. Furthermore, the excessive width of the interface vertical slip suggests that the shear connectors in the composite deck specimen with PBL connectors lack sufficient shear resistance. It is advisable to increase either the number or the shear strength of shear connectors in the design of composite bridge decks for practical bridge applications.

6.4. Influence of Fatigue Loading Cycles on the Tensile Strain of Shear Studs

Figure 33 shows the strain values measured by strain gauges on the side surfaces of a shear stud, specifically using stud S7 as an example, at the variable depth zones of the composite bridge deck. The tensile strain of shear stud S7 exhibits a relatively minor variation in response to an increasing number fatigue loading cycles for the composite specimen with stud connectors. Despite the significant interface slips detected after experiencing two million fatigue loading cycles, the stresses of shear studs remain at a relatively lower level.

7. Conclusions

We conducted a fatigue test on full-scale specimens of the steel–concrete composite decks employed for narrow-width steel box composite bridges, which remains unreported in this field and enables us to observe particular phenomena that are associated with the specimens equipped with different shear connectors that have not been fully considered in past similar studies. This allowed us to explore the fatigue behaviors of the composite decks under different conditions, providing new empirical evidence for theories within the field.
(1) To comprehensively assess the most critical stress amplitudes across the entire bridge deck of the NWSBCB for Kezhu Highway, a finite element model for the general static analysis is established and is developed on the basis of the actual design dimensions of the composite bridge deck. The analysis results reveal that under the combined action of self-weight, secondary dead load and Grade I highway live load, the Mises stress and maximum transverse tensile stress in the concrete bridge deck at the middle supporting point are 7.08 MPa and 2.42 MPa, respectively. This indicates a risk of cracking in the concrete bridge deck in the support zones under the design loads according to the standards, underscoring the importance of crack prevention strategies. When the wheel load of fatigue is positioned longitudinally at the mid-span and transversely between the steel webs, the peak of transverse tensile stress occurs in the composite bridge deck, with the maximum stresses for the concrete bridge deck and steel plate rising to 1.073 MPa and 10.14 MPa, respectively.
(2) The characteristic values of composite bridge deck specimens under static bending, including both the cracking and ultimate loads of the composite deck specimens, have been determined. The composite deck specimen with PBL connectors withstands a cracking load of 249 kN, approximately 18.6% higher than that of 210 kN endured by the composite deck specimen with stud connectors. Interestingly, the plastic development in the composite deck specimen with stud connectors progresses more slowly compared to that in the specimen with PBL connectors. The peak load capacity of the composite deck specimen with stud connectors reaches 1034 kN, 20.9% higher than the comparable load of 855 kN for the specimen with PBL connectors. This indicates that the composite deck specimen with stud connectors exhibits significantly enhanced overall flexural stiffness relative to the specimen with PBL connectors.
(3) The bending stiffness of the composite deck specimens demonstrates relatively moderate variations throughout the fatigue loading process. Consequently, the influence of the fatigue loading cycle on the overall structural stiffness of the composite deck specimens is considered moderate. Upon comparing the results of specimens with different shear connectors, it becomes apparent that under identical fatigue loading cycles, the mid-span deflection of the composite deck specimen with stud connectors is slightly greater than that of the specimen with PBL connectors. The composite deck specimen with stud connectors exhibits a greater tensile height and tensile strain in the concrete layer within the mid-span bending zone, compared with the composite deck specimen with PBL connectors.
(4) As the number of fatigue loading cycles increases, the maximum crack width incrementally enlarges for the composite deck specimens with both shear connection types. After two million fatigue loading cycles, the maximum crack width under the static peak load for the composite deck specimen with stud connectors is 0.12 mm, while the counterpart of the composite deck specimen with PBL connectors reaches 0.17 mm. For the composite specimen with stud connectors, even after two million fatigue loading cycles, the stress conditions of shear studs remain at a comparatively lower level and demonstrate minimal variation as fatigue loading cycles increase.
(5) After two million fatigue loading cycles, the width of the vertical slip at the concrete–steel interface for the composite deck specimen with stud connectors is 0.26 mm under a static peak load of 120 kN, while the corresponding slip width for the composite deck specimen with PBL connectors grows to 0.85 mm. The results suggest that a significant interface debonding occurs at the variable depth zones of the composite deck specimens with both types of shear connectors. The excessive width of the interface vertical slip implies a deficient shear resistance in the shear connectors of the composite deck specimen with PBL connectors. It is recommended to enhance either the quantity or the strength of shear connectors in the design of composite bridge decks for practical bridge applications.

Author Contributions

Conceptualization, methodology, and supervision, Y.C.; funding acquisition, Y.Z. (Yongchun Zhang); resources and investigation, M.Y.; investigation, X.H.; visualization, W.H.; writing—original draft preparation, K.Q.; writing—review and editing, and project administration, Y.Z. (Yaoyu Zhu); data curation, X.W. All authors have read and agreed to the published version of the manuscript.

Funding

This research was funded by the Science and Technology Project of Zhejiang Provincial Department of Transportation (2022-GCKY-19).

Data Availability Statement

The original contributions presented in the study are included in the article, further inquiries can be directed to the corresponding author.

Conflicts of Interest

Authors Yunteng Chen and Yongchun Zhang were employed by the company Shaoxing Communications Investment Group Co., Ltd. Authors Maofeng Yu, Xiangsen Hu, Wei He were employed by the company Zhejiang Institute of Communications Co., Ltd. Authors Kaiqiang Qin, Yaoyu Zhu and Xiaochen Wei were employed by the company CCCC Highway Bridges National Engineering Research Center Co., Ltd. The funder was not involved in the study design, collection, analysis, interpretation of data, the writing of this article or the decision to submit it for publication.

References

  1. Huang, Q. Design Principle of Steel-Concrete Composite Bridge Structure, 2nd ed.; China Communications Press: Beijing, China, 2017. [Google Scholar]
  2. Nie, J. Steel-Concrete Composite Bridge; China Communications Press: Beijing, China, 2011. [Google Scholar]
  3. Nie, J. Application of composite beam in small and medium span bridge. In Proceedings of the 11th Annual Meeting of Steel-concrete Composite Structure Branch of China Steel Association, Harbin, China, 1 June 2007. [Google Scholar]
  4. British Standard Committee. BS 5400Steel, Concrete and Composite Bridges; British Standards Institution (BSI): London, UK, 1979. [Google Scholar]
  5. GB 50017-2003; Standard for Design of Steel Structure. China Building Industry Press: Beijing, China, 2003.
  6. Eurocode 4; Design of Composite Steel and Concrete Structures-Part 2: General Rules and Rules for Bridge. European Committee for Standardization: Brussels, Belgium, 2005.
  7. AASHTO. AASHTO-LRFD Bridge Design Specifications; American Association of State Highway and Transportation Officials: Washington, DC, USA, 2007. [Google Scholar]
  8. Huang, Q. Analysis of common diseases and strengthening strategies of existing steel-mixed composite beam bridges. In Proceedings of the National Academic Conference on Reinforcement, Reconstruction and Evaluation of Existing Bridges, Nanjing, China, 1 November 2008. [Google Scholar]
  9. Yan, L.; Han, B.; Zhang, J.; Li, W.; Huibing, X.; Ce, G.; Liangjiang, C.; Jiaping, Y.; Ziwei, S.; Bowen, Z. Experimental study on fatigue damage of continuous steel–concrete composite beam by acoustic emission. Structures 2023, 57, 105185. [Google Scholar] [CrossRef]
  10. Song, Z.; Han, B.; Zhang, J.; Xie, H.; Yan, W.; Li, W.; Yu, J. Fatigue behavior of full-shear-connection steel–concrete composite continuous beams under high-cycle loading. Structures 2023, 56, 105036. [Google Scholar] [CrossRef]
  11. Leitão, F.N.; Da Silva, J.G.S.; Vellasco, P.D.S.; De Andrade, S.A.L.; De Lima, L.R.O. Composite (steel–concrete) highway bridge fatigue assessment. J. Constr. Steel Res. 2011, 67, 14–24. [Google Scholar] [CrossRef]
  12. Xu, Y.; Liu, X.; Wang, B.; Xiyan, Y. Residual mechanical properties of composite beams with PBL connectors under fatigue loads. Structures 2023, 51, 185–195. [Google Scholar] [CrossRef]
  13. Alencar, G.; de Jesus, A.M.P.; Calçada, R.A.B.; José Guilherme, S.d.S. Fatigue life evaluation of a composite steel-concrete roadway bridge through the hot-spot stress method considering progressive pavement deterioration. Eng. Struct. 2018, 166, 46–61. [Google Scholar] [CrossRef]
  14. Lu, K.; Du, L.; Xu, Q.; Yao, Y.; Wang, J. Fatigue performance of stud shear connectors in steel-concrete composite beam with initial damage. Eng. Struct. 2023, 276, 115381. [Google Scholar] [CrossRef]
  15. Yan, L.B.; Han, B.; Fan, L.; Xiao, L. Fatigue damage of PBH shear connector of steel-concrete composite structure. Eng. Struct. 2020, 213, 110540. [Google Scholar] [CrossRef]
  16. Xu, C.; Su, Q.; Sugiura, K. Mechanism study on the low cycle fatigue behavior of group studs shear connectors in steel-concrete composite bridges. J. Constr. Steel Res. 2017, 138, 196–207. [Google Scholar] [CrossRef]
  17. Huang, Y.; Chen, S.; Gu, P. Interface stress analysis and fatigue design method of steel-ultra high performance concrete composite bridge deck. Structures 2022, 38, 1453–1464. [Google Scholar] [CrossRef]
  18. Liu, T.; Nie, X.; Zeng, J.; Su, H. Static and fatigue behaviors of corroded stud connectors in weathering steel–concrete composite beams. Eng. Struct. 2022, 272, 115030. [Google Scholar] [CrossRef]
  19. Lee, P.-G.; Shim, C.-S.; Chang, S.-P. Static and fatigue behavior of large stud shear connectors for steel–concrete composite bridges. J. Constr. Steel Res. 2005, 61, 1270–1285. [Google Scholar] [CrossRef]
  20. Xiang, D.; Gu, M.; Zou, X.; Yuqing, L. Fatigue behavior and failure mechanism of steel-concrete composite deck slabs with perforated ribs. Eng. Struct. 2022, 250, 113410. [Google Scholar] [CrossRef]
  21. Liu, R.; Yong, Y. Research on fatigue performance of steel-plate-concrete composite slab. Thin-Walled Struct. 2021, 160, 107339. [Google Scholar] [CrossRef]
  22. Zhang, Z.; Tian, C.-K.; Deng, E.-F.; Peng, X.; Hu, H.Y.; Li, F.R. Fatigue performance and optimal design of corrugated steel–concrete composite bridge deck. Structures 2023, 48, 427–437. [Google Scholar] [CrossRef]
  23. Ahn, J.-H.; Sim, C.; Jeong, Y.-J.; Kim, S.-H. Fatigue behavior and statistical evaluation of the stress category for a steel–concrete composite bridge deck. J. Constr. Steel Res. 2009, 65, 373–385. [Google Scholar] [CrossRef]
  24. Ji, W.; Bai, Q.; Wang, W.; Li, J. Fatigue study on improved composite box girder bridge with corrugated steel webs. J. Constr. Steel Res. 2024, 213, 108380. [Google Scholar] [CrossRef]
  25. Gao, Q.; Dong, Z.; Cui, K.; Liu, C.; Liu, Y. Fatigue performance of profiled steel sheeting–concrete bridge decks subjected to vehicular loads. Eng. Struct. 2020, 213, 110558. [Google Scholar] [CrossRef]
  26. Tu, B.; Cai, S.; Li, J.; Liu, H. Fatigue assessment of a full-scale composite box-girder with corrugated-steel-webs and concrete-filled-tubular flange. J. Constr. Steel Res. 2021, 183, 106768. [Google Scholar] [CrossRef]
  27. Xiang, Z.; Zhu, Z. Fatigue behavior of orthotropic composite bridge decks without cutout at rib-to-floorbeam intersection. J. Constr. Steel Res. 2023, 201, 107596. [Google Scholar] [CrossRef]
  28. Wang, Z.Y.; Zhou, X.F.; Liu, Z.F.; Wang, Q.Y. Fatigue behaviour of composite girders with concrete-filled tubular flanges and corrugated webs—Experimental study. Eng. Struct. 2021, 241, 112416. [Google Scholar] [CrossRef]
  29. Xiangsen, H.; Liang, H.; Yu, M. Design idea of a main-span 85m continuous narrow steel box composite beam. North Commun. 2022, 11, 5–9+14. [Google Scholar]
  30. JTG D64-2015; Specifications for Design of Highway Steel Bridge. China Communications Press: Beijing, China, 2015.
  31. GBT 50152-2012; Standard for Test Method of Concrete Structures. China Building Industry Press: Beijing, China, 2012.
Figure 1. Design of the narrow-width steel box composite beam of Kezhu Expressway (unit: mm): (a) elevation view and (b) detailed dimensions of steel elements.
Buildings 14 00912 g001
Figure 2. Typical section of the narrow-width steel box composite beam bridge (unit: mm).
Buildings 14 00912 g002
Figure 3. Geometric model of the finite element analysis in Abaqus.
Buildings 14 00912 g003
Figure 4. Types and positions of boundary constraints.
Buildings 14 00912 g004
Figure 5. Meshing of the finite element model: (a) concrete bridge deck and (b) steel girder.
Buildings 14 00912 g005
Figure 6. Secondary dead load: (a) guardrail load; (b) load of asphalt concrete pavement.
Buildings 14 00912 g006aBuildings 14 00912 g006b
Figure 7. Calculation model III of fatigue wheel loads (unit: m): (a) elevation view and (b) plane view.
Buildings 14 00912 g007
Figure 8. Longitudinal and transversal distribution positions of fatigue wheel loads (unit: mm): (a) longitudinal distribution of fatigue wheel loads and (b) transversal distribution of fatigue wheel loads.
Buildings 14 00912 g008
Figure 9. Longitudinal and transversal distribution positions of fatigue wheel loads in the FE model: (a) longitudinal distribution position 1; (b) longitudinal distribution position 2; (c) transversal distribution position 1; (d) transversal distribution position 2; and (e) transversal distribution position 3.
Buildings 14 00912 g009
Figure 10. Transversal stress nephogram under the load combination case of 7d: (a) concrete deck and (b) steel plate topside.
Buildings 14 00912 g010
Figure 11. Design prototype of the full-scale model for the composite bridge deck.
Buildings 14 00912 g011
Figure 12. Loading photo of the static test.
Buildings 14 00912 g012
Figure 13. Load-deflection curves of composite bridge deck specimens under static bending.
Buildings 14 00912 g013
Figure 14. Crack propagation of the composite bridge deck specimen with PBL connectors: (a) at visible cracking and (b) at peak load.
Buildings 14 00912 g014
Figure 15. Crack propagation of the composite bridge deck specimen with stud connectors: (a) at visible cracking and (b) at peak load.
Buildings 14 00912 g015
Figure 16. Static bending failure of composite bridge deck: (a) specimen with PBL connectors and (b) specimen with stud connectors.
Buildings 14 00912 g016
Figure 17. Specimen configuration of the composite bridge deck with PBL connectors (unit: mm): (a) plane view and (b) elevation view.
Buildings 14 00912 g017
Figure 18. Specimen configuration of the composite bridge deck with stud connectors (unit: mm): (a) plane view and (b) elevation view.
Buildings 14 00912 g018
Figure 19. Photos of the fabrication and processing of fatigue composite deck specimens. (a) Fabrication and processing of steel elements, including the welding of bottom steel plate with the perforated steel plate, the bolt connection with the steel plate of the girder, and the welding of the steel mold at the side elevation. (b) Welding of stud connectors and assembly of the reinforcement mesh in the composite deck specimen with stud connectors. (c) A locally embedded strain gauge in the composite deck specimen with stud connectors. (d) Perforated steel rebar in the composite deck specimen with PBL connectors. (e) Perforated steel rebar in the composite deck specimen with PBL connectors. (f) The oiling of the steel formwork for demolding. (g) Concrete layer casting and surface treatment, (h) concrete curing, and (i) demolding of the steel formwork.
Buildings 14 00912 g019
Figure 20. Distribution of strain gauges and LVDTs in composite deck specimens (unit: mm): (a) elevation view; (b) top view of the concrete layer; and (c) bottom view of the steel plate.
Buildings 14 00912 g020aBuildings 14 00912 g020b
Figure 21. Distribution of strain gauges on the reinforcement mesh within concrete layers (unit: mm): (a) elevation view and (b) plane view.
Buildings 14 00912 g021aBuildings 14 00912 g021b
Figure 22. Distribution of strain gauges on crossing steel rebars for the composite deck specimen with PBL connectors (unit: mm) ): (a) elevation view and (b) plane view.
Buildings 14 00912 g022
Figure 23. Distribution of strain gauges on stud connectors for the composite deck specimen with stud connectors (unit: mm)): (a) elevation view and (b) plane view.
Buildings 14 00912 g023
Figure 24. Electro-hydraulic pulsation fatigue whole-cycle automatic control testing machine.
Buildings 14 00912 g024
Figure 25. Automatic control system of the fatigue load amplitude.
Buildings 14 00912 g025
Figure 26. Measured load-deflection curves for fatigue specimens: (a) composite deck specimen with stud connectors and (b) composite deck specimen with PBL connectors.
Buildings 14 00912 g026
Figure 27. Schematic representation of the crack distribution in the composite deck specimens: (a) composite deck specimen with stud connectors and (b) composite deck specimen with PBL connectors.
Buildings 14 00912 g027
Figure 28. Measured load vs. crack width curves of fatigue composite deck specimens: (a) composite deck specimen with stud connectors and (b) composite deck specimen with PBL connectors.
Buildings 14 00912 g028
Figure 29. Measured load–longitudinal slip curves of fatigue composite deck specimens: (a) composite deck specimen with stud connectors and (b) composite deck specimen with PBL connectors.
Buildings 14 00912 g029
Figure 30. Measured load vs. mid-span strain curves of steel plates: (a) composite deck specimen with stud connectors and (b) composite deck specimen with PBL connectors.
Buildings 14 00912 g030
Figure 31. Measured load vs. mid-span strain curves of fatigue composite deck specimens: (a) composite deck specimen with stud connectors and (b) composite deck specimen with PBL connectors.
Buildings 14 00912 g031
Figure 32. Observed interface vertical slips between the concrete layer and steel plate: (a) composite deck specimen with stud connectors and (b) composite deck specimen with PBL connectors.
Buildings 14 00912 g032aBuildings 14 00912 g032b
Figure 33. Measured load vs. tensile strain curves of steel stud named S7 for the composite deck specimen with stud connectors.
Buildings 14 00912 g033
Table 1. Calculation results of the FE model under different load combination conditions.
ConditionLoad CombinationStress TypeStructural Element PositionMaximum Stress (MPa)
1DeadweightMisesConcrete deckMiddle supporting point4.844
Steel top plate Middle supporting point23.24
Steel web plateMiddle supporting point74.32
Steel bottom plate Middle supporting point88.14
Steel diaphragm plateMiddle supporting point27.59
TransverseConcrete deckMiddle supporting point topside0.584
Steel top plateMiddle supporting point5.53
2Deadweight + Secondary dead loadMisesConcrete deckMiddle supporting point6.48
Steel top plate Middle supporting point32.01
Steel web plateMiddle supporting point95.06
Steel bottom plate Middle supporting point114
Steel diaphragm plateMiddle supporting point36.74
TransverseConcrete deckMiddle supporting point topside0.775
Steel top plateMiddle supporting point6.65
3Deadweight + Secondary dead load + Supporting settlementsMisesConcrete deckMiddle supporting point6.298
Steel top plate Middle supporting point31.08
Steel web plateMiddle supporting point92.84
Steel bottom plate Middle supporting point110.7
Steel diaphragm plateMiddle supporting point37.14
TransverseConcrete deckMiddle supporting point topside0.776
Steel top plateMiddle supporting point6.598
4Deadweight + Secondary dead load + Single-lane load in a full bridgeMisesConcrete deckMiddle supporting point7.082
Steel top plate Middle supporting point38.33
Steel web plateMiddle supporting point107.8
Steel bottom plate Middle supporting point128.0
Steel diaphragm plateMiddle supporting point39.28
TransverseConcrete deckMid-span bottom 2.411
Steel top plateMid-span bottom27.67
5Deadweight + Secondary dead load + Single-lane load in a middle spanMisesConcrete deckMid-span7.012
Steel top plate Mid-span38.76
Steel web plateMid-span106.7
Steel bottom plate Middle supporting point127.4
Steel diaphragm plateMiddle supporting point40.03
TransverseConcrete deckMid-span bottom 2.419
Steel top plateMid-span bottom27.71
6Deadweight + Secondary dead load + Fatigue load model IMisesConcrete deckMid-span6.782
Steel top plate Mid-span33.24
Steel web plateMid-span102
Steel bottom plate Middle supporting point121.2
Steel diaphragm plateMiddle supporting point38.15
TransverseConcrete deckMid-span bottom 1.656
Steel top plateMid-span bottom18.15
7aDeadweight + Secondary dead load + Fatigue load model III
(longitudinal distribution 1 and transversal distribution 1)
MisesConcrete deckMiddle supporting point6.649
Steel top plate Middle supporting point32.77
Steel web plateMiddle supporting point99.08
Steel bottom plate Middle supporting point118.4
Steel diaphragm plateMiddle supporting point35.98
TransverseConcrete deckMiddle supporting point topside0.776
Steel top plateMiddle supporting point topside7.095
7bDeadweight + Secondary dead load + Fatigue load model III
(longitudinal distribution 2 and transversal distribution 1)
MisesConcrete deckMiddle supporting point6.66
Steel top plate Middle supporting point32.8
Steel web plateMiddle supporting point98.62
Steel bottom plate Middle supporting point118.4
Steel diaphragm plateMiddle supporting point36.04
TransverseConcrete deckMiddle supporting point topside0.777
Steel top plateMiddle supporting point topside7.107
7cDeadweight + Secondary dead load + Fatigue load model III
(longitudinal distribution 2 and transversal distribution 2)
MisesConcrete deckMiddle supporting point6.674
Steel top plate Middle supporting point33.15
Steel web plateMiddle supporting point99.43
Steel bottom plate Middle supporting point119.5
Steel diaphragm plateMiddle supporting point37.57
TransverseConcrete deckMiddle supporting point topside1.072
Steel top plateMiddle supporting point topside9.692
7dDeadweight + Secondary dead load + Fatigue load model III
(longitudinal distribution 2 and transversal distribution 3)
MisesConcrete deckMiddle supporting point6.709
Steel top plate Middle supporting point33.9
Steel web plateMiddle supporting point100.7
Steel bottom plate Middle supporting point121.5
Steel diaphragm plateMiddle supporting point38.43
TransverseConcrete deckMiddle supporting point topside1.072
Steel top plateMiddle supporting point topside10.14
Table 2. Characteristic values of composite bridge deck specimens in static bending tests.
Specimen No.First Cracking Load (kN)Peak Load (kN)Deflection at First Cracking (mm)Deflection at Peak Load (mm)
Specimen-PBL24985510.0106.0
Specimen-Stud21010348.5989.5
Table 3. Design parameters of composite deck specimens.
Specimen No.Shear ConnectorsDimensions
(mm)
Diameter of Drilled Holes (mm)Depth of the Concrete Layer (mm)Concrete Type
BP1PBL5400 × 150 × 14φ60250~350C40 with micro-expanding agent
BP2Stud5400 × 150 × 14φ60250~350C40 with micro-expanding agent
Disclaimer/Publisher’s Note: The statements, opinions and data contained in all publications are solely those of the individual author(s) and contributor(s) and not of MDPI and/or the editor(s). MDPI and/or the editor(s) disclaim responsibility for any injury to people or property resulting from any ideas, methods, instructions or products referred to in the content.

