
Should We Depend on Expert Opinion or Statistics? A Meta-Analysis of Accident-Contributing Factors in Construction


Abstract
:1. Introduction
2. Methodology
- Statement of research questions.
- Search for relevant studies.
- Content analysis and study selection.
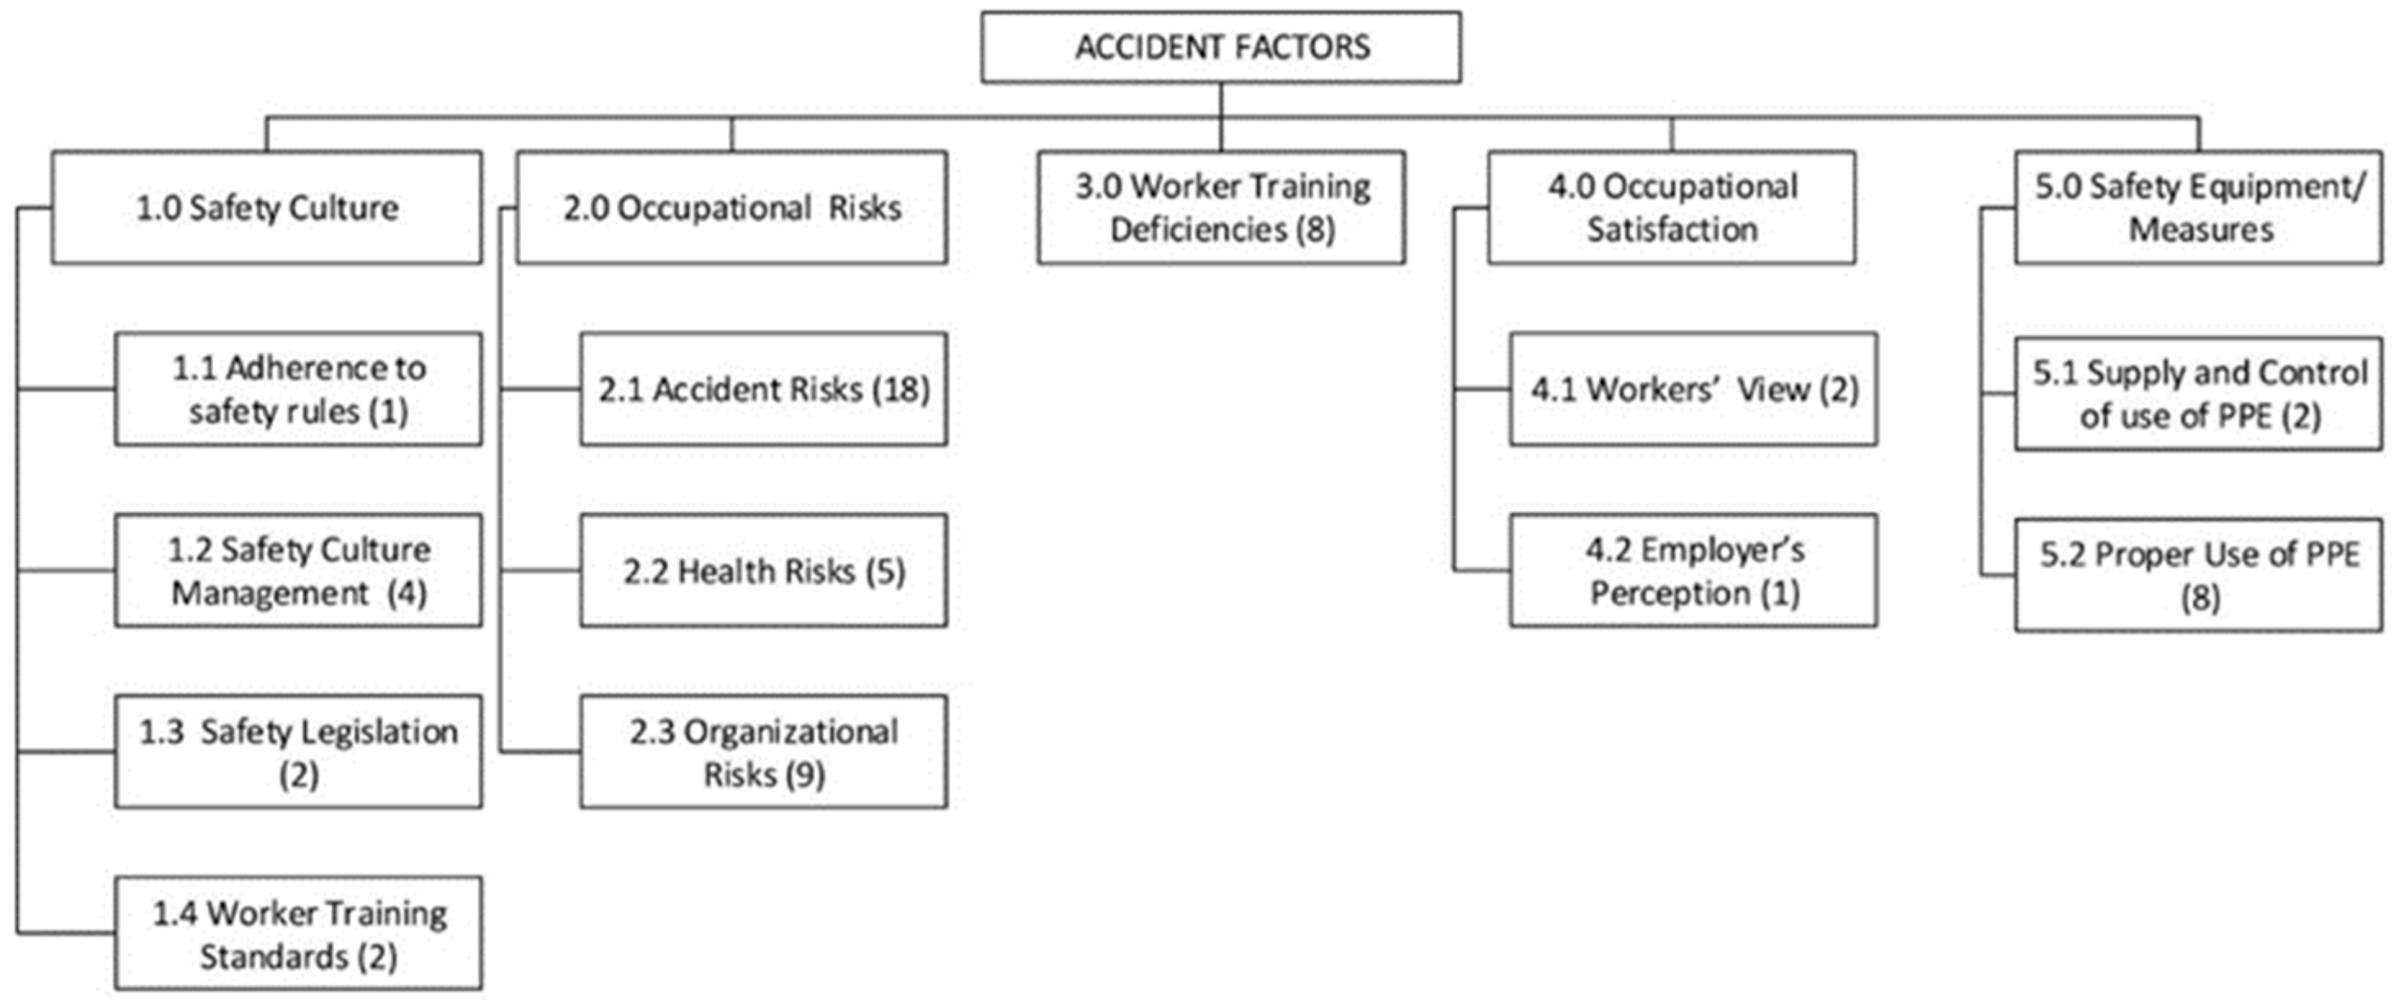
- Identifying, classifying, and developing the AFBS.
- Data meta-analysis.
- Comparison and discussion of the results.
- Investigated safety rather than health hazards;
- Identified and assessed factors leading to accidents;
- Referred to civil engineering projects;
- Analyzed data obtained through surveys, statistics, and/or accident records;
- Provided factor importance or information regarding occurrence frequency.
3. Data Meta-Analysis
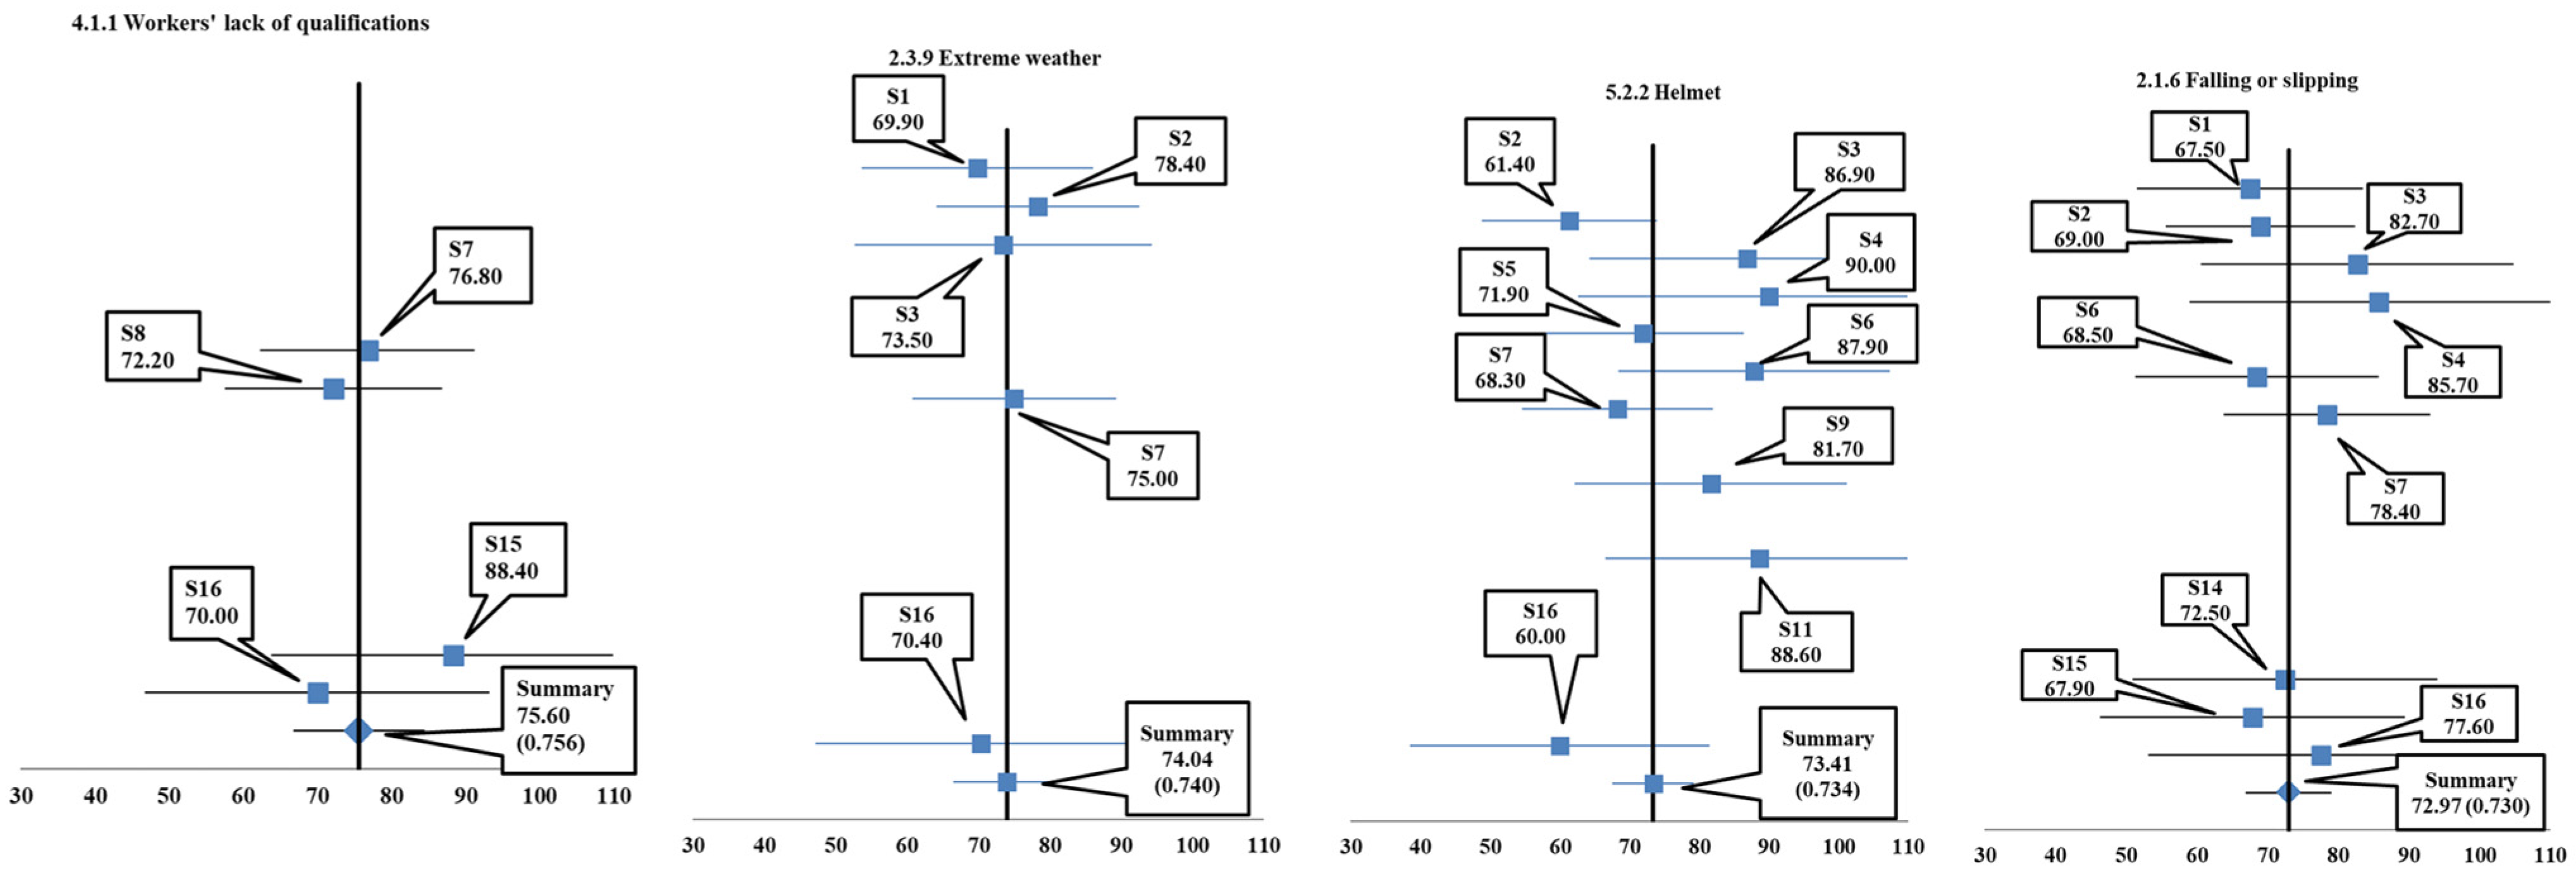
3.1. Meta-Analysis of Opinion-Based Data
- Whether the summary effect is derived from the synthesis of a large or small number of studies;
- Whether the effect sizes of the individual studies have close numerical values, and whether their confidence intervals (95%) overlap;
- Whether the effect summary is based on many or few studies;
- Whether studies with extreme effect size values are included in the meta-analysis [44].
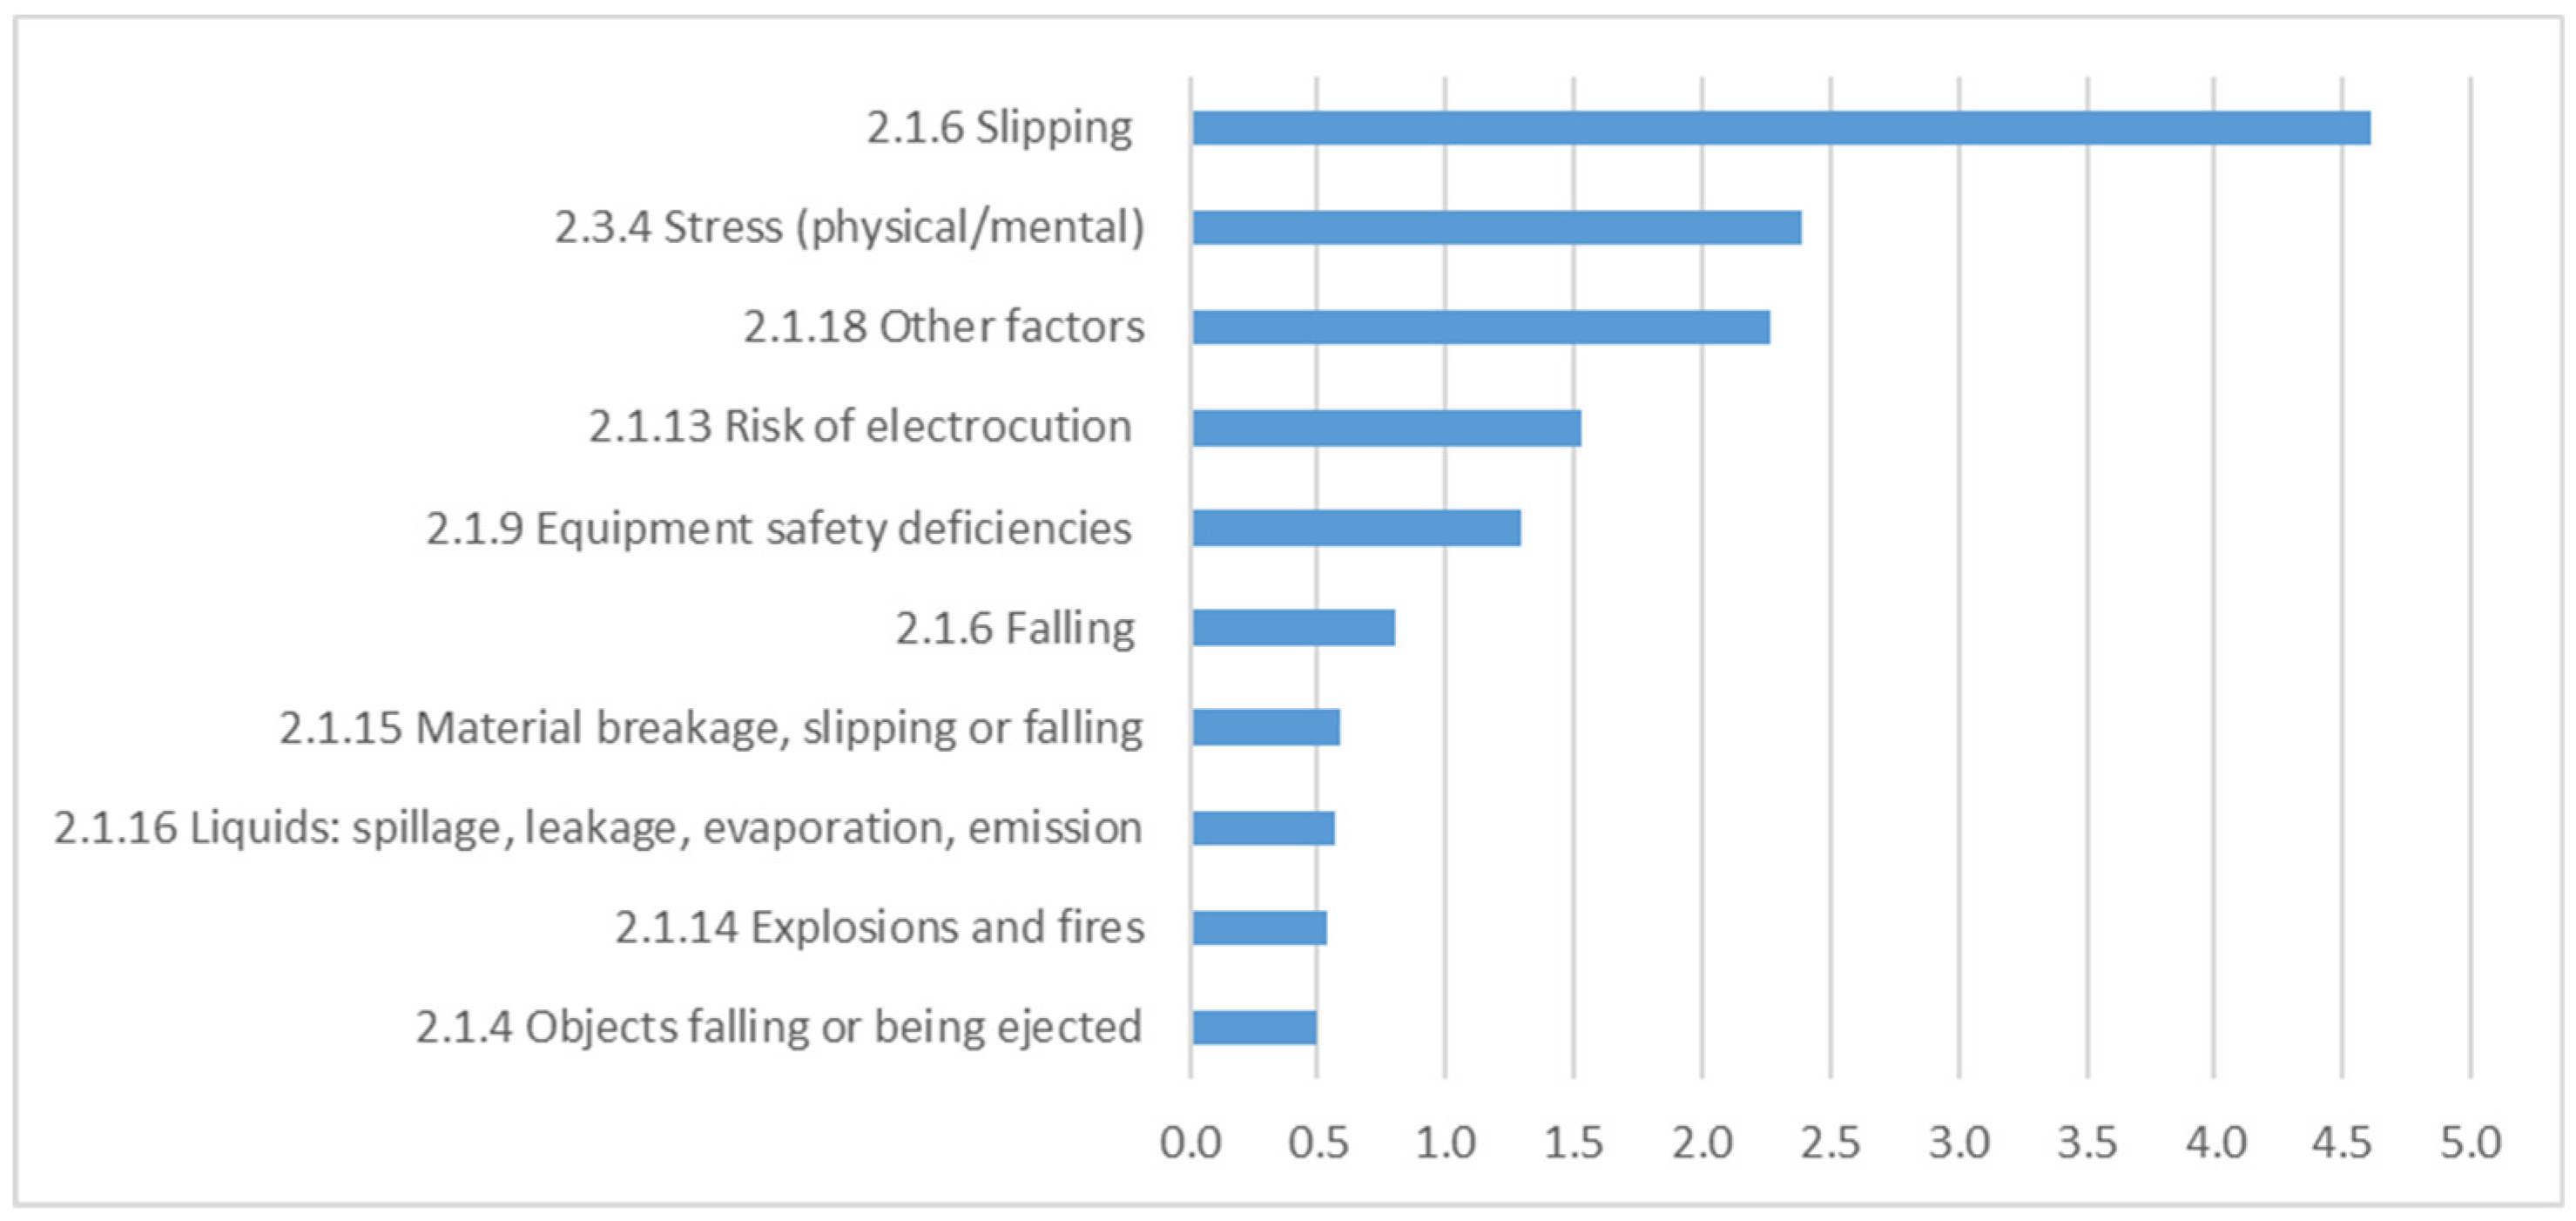
3.2. Meta-Analysis of Real-Accident-Based Studies
4. Discussion
5. Conclusions
Author Contributions
Funding
Data Availability Statement
Conflicts of Interest
References
- Suraji, A. Construction Accidents and the Lesson Learnt from 1000 Cases. Int. J. Constr. Manag. 2003, 3, 41–49. [Google Scholar] [CrossRef]
- Fang, D.P.; Xie, F.; Huang, X.Y.; Li, H. Factor Analysis-Based Studies on Construction Workplace Safety Management in China. Int. J. Proj. Manag. 2004, 22, 43–49. [Google Scholar] [CrossRef]
- Haslam, R.A.; Hide, S.A.; Gibb, A.G.F.; Gyi, D.E.; Pavitt, T.; Atkinson, S.; Duff, A.R. Contributing Factors in Construction Accidents. Appl. Ergon. 2005, 36, 401–415. [Google Scholar] [CrossRef]
- Ng, S.T.; Cheng, K.P.; Skitmore, R.M. A Framework for Evaluating the Safety Performance of Construction Contractors. Build. Environ. 2005, 40, 1347–1355. [Google Scholar] [CrossRef]
- Choudhry, R.M.; Fang, D.; Mohamed, S. The Nature of Safety Culture: A Survey of the State-of-the-Art. Saf. Sci. 2007, 45, 993–1012. [Google Scholar] [CrossRef]
- Katsakiori, P.; Manatakis, E.; Goutsos, S.; Athanassiou, G. Factors Attributed to Fatal Occupational Accidents in a Period of 5 Years Preceding the Athens 2004 Olympic Games. Int. J. Occup. Saf. Ergon. 2008, 14, 285–292. [Google Scholar] [CrossRef] [PubMed]
- Hon, C.K.H.; Chan, A.P.C.; Wong, F.K.W. An Analysis for the Causes of Accidents of Repair, Maintenance, Alteration and Addition Works in Hong Kong. Saf. Sci. 2010, 48, 894–901. [Google Scholar] [CrossRef]
- Cheng, C.W.; Leu, S.S.; Lin, C.C.; Fan, C. Characteristic Analysis of Occupational Accidents at Small Construction Enterprises. Saf. Sci. 2010, 48, 698–707. [Google Scholar] [CrossRef]
- Behm, M.; Schneller, A. Application of the Loughborough Construction Accident Causation Model: A Framework for Organizational Learning. Constr. Manag. Econ. 2013, 31, 580–595. [Google Scholar] [CrossRef]
- Chong, H.Y.; Low, T.S. Accidents in Malaysian Construction Industry: Statistical Data and Court Cases. Int. J. Occup. Saf. Ergon. 2014, 20, 503–513. [Google Scholar] [CrossRef]
- Phoya, S.; Eliufoo, H.; Pietrzyk, K.; Nyström, M. Assessment of Health and Safety Risk Perception of Site Managers, Supervisors and Workers in Tanzania Urban Construction Sites. In Proceedings of the CIB W099 Conference, Washington, DC, USA, 24–26 August 2011; Available online: https://www.irbnet.de/daten/iconda/CIB_DC24275.pdf (accessed on 29 September 2023).
- Fard, M.M.; Terouhid, S.A.; Kibert, C.J.; Hakim, H. Safety Concerns Related to Modular/Prefabricated Building Construction. Int. J. Inj. Contr. Saf. Promot. 2017, 24, 10–23. [Google Scholar] [CrossRef] [PubMed]
- Amiri, M.; Ardeshir, A.; Fazel Zarandi, M.H.; Soltanaghaei, E. Pattern Extraction for High-Risk Accidents in the Construction Industry: A Data-Mining Approach. Int. J. Inj. Contr. Saf. Promot. 2016, 23, 264–276. [Google Scholar] [CrossRef]
- Carrillo-Castrillo, J.A.; Trillo-Cabello, A.F.; Rubio-Romero, J.C. Construction Accidents: Identification of the Main Associations between Causes, Mechanisms and Stages of the Construction Process. Int. J. Occup. Saf. Ergon. 2017, 23, 240–250. [Google Scholar] [CrossRef]
- Hoła, B.; Nowobilski, T.; Szer, I.; Szer, J. Identification of Factors Affecting the Accident Rate in the Construction Industry. Procedia Eng. 2017, 208, 35–42. [Google Scholar] [CrossRef]
- Andersen, L.P.; Nørdam, L.; Joensson, T.; Kines, P.; Nielsen, K.J. Social Identity, Safety Climate and Self-Reported Accidents among Construction Workers. Constr. Manag. Econ. 2018, 36, 22–31. [Google Scholar] [CrossRef]
- Winge, S.; Albrechtsen, E.; Mostue, B.A. Causal Factors and Connections in Construction Accidents. Saf. Sci. 2019, 112, 130–141. [Google Scholar] [CrossRef]
- Yap, J.B.H.; Lee, W.K. Analysing the Underlying Factors Affecting Safety Performance in Building Construction. Prod. Plan. Control 2020, 31, 1061–1076. [Google Scholar] [CrossRef]
- Betsis, S.; Kalogirou, M.; Aretoulis, G.; Pertzinidou, M. Work Accidents Correlation Analysis for Construction Projects in Northern Greece 2003–2007: A Retrospective Study. Safety 2019, 5, 33. [Google Scholar] [CrossRef]
- Zhang, W.; Zhu, S.; Zhang, X.; Zhao, T. Identification of Critical Causes of Construction Accidents in China Using a Model Based on System Thinking and Case Analysis. Saf. Sci. 2020, 121, 606–618. [Google Scholar] [CrossRef]
- Chen, Y. The Development and Validation of a Human Factors Analysis and Classification System for the Construction Industry. Int. J. Occup. Saf. Ergon. 2020, 28, 479–493. [Google Scholar] [CrossRef]
- Mosly, I. Factors Influencing Safety Performance in the Construction Industry of Saudi Arabia: An Exploratory Factor Analysis. Int. J. Occup. Saf. Ergon. 2022, 28, 901–908. [Google Scholar] [CrossRef] [PubMed]
- Tayeh, B.A.; Salem, T.J.; Abu Aisheh, Y.I.; Alaloul, W.S. Risk Factors Affecting the Performance of Construction Projects in Gaza Strip. Open Civ. Eng. J. 2020, 14, 94–104. [Google Scholar] [CrossRef]
- Asilian-Mahabadi, H.; Khosravi, Y.; Hassanzadeh-Rangi, N.; Hajizadeh, E.; Behzadan, A.H. Factors Affecting Unsafe Behavior in Construction Projects: Development and Validation of a New Questionnaire. Int. J. Occup. Saf. Ergon. 2020, 26, 219–226. [Google Scholar] [CrossRef]
- Alamneh, Y.M.; Wondifraw, A.Z.; Negesse, A.; Ketema, D.B.; Akalu, T.Y. The Prevalence of Occupational Injury and Its Associated Factors in Ethiopia: A Systematic Review and Meta-Analysis. J. Occup. Med. Toxicol. 2020, 15, 14. [Google Scholar] [CrossRef]
- Antoniou, F.; Merkouri, M. Accident Factors per Construction Type and Stage: A Synthesis of Scientific Research and Professional Experience. Int. J. Inj. Contr. Saf. Promot. 2021, 28, 439–453. [Google Scholar] [CrossRef] [PubMed]
- Ashuro, Z.; Zele, Y.T.; Kabthymer, R.H.; Diriba, K.; Tesfaw, A.; Alamneh, A.A. Prevalence of Work-Related Injury and Its Determinants among Construction Workers in Ethiopia: A Systematic Review and Meta-Analysis. J. Environ. Public Health 2021, 2021, 9954084. [Google Scholar] [CrossRef] [PubMed]
- Meseret, M.; Ehetie, T.; Hailye, G.; Regasa, Z.; Biruk, K. Occupational Injury and Associated Factors among Construction Workers in Ethiopia: A Systematic and Meta-Analysis. Arch. Environ. Occup. Health 2022, 77, 328–337. [Google Scholar] [CrossRef]
- Amoatey, C.T.; Ankrah, A.N.O. Exploring Critical Road Project Delay Factors in Ghana. J. Facil. Manag. 2017, 15, 110–127. [Google Scholar] [CrossRef]
- Antoniou, F. Delay Risk Assessment Models for Road Projects. Systems 2021, 9, 70. [Google Scholar] [CrossRef]
- Kaliba, C.; Muya, M.; Mumba, K. Cost Escalation and Schedule Delays in Road Construction Projects in Zambia. Int. J. Proj. Manag. 2009, 27, 522–531. [Google Scholar] [CrossRef]
- Mahamid, I.; Bruland, A.; Dmaidi, N. Causes of Delay in Road Construction Projects. J. Manag. Eng. 2012, 28, 300–310. [Google Scholar] [CrossRef]
- Sanni-Anibire, M.O.; Mohamad Zin, R.; Olatunji, S.O. Causes of Delay in the Global Construction Industry: A Meta Analytical Review. Int. J. Constr. Manag. 2022, 22, 1395–1407. [Google Scholar] [CrossRef]
- Vu, H.A.; Cu, V.H.; Min, L.X.; Wang, J.Q. Risk Analysis of Schedule Delays in International Highway Projects in Vietnam Using a Structural Equation Model. Eng. Constr. Archit. Manag. 2017, 24, 1018–1039. [Google Scholar] [CrossRef]
- Edwards, D.J.; Owusu-Manu, D.-G.; Baiden, B.; Badu, E.; Love, P.E. Financial Distress and Highway Infrastructure Delays. J. Eng. Des. Technol. 2017, 15, 118–132. [Google Scholar] [CrossRef]
- Sharma, S.; Goyal, P.K. Fuzzy Assessment of the Risk Factors Causing Cost Overrun in Construction Industry. Evol. Intell. 2022, 15, 2269–2281. [Google Scholar] [CrossRef]
- Wu, Z.; Nisar, T.; Kapletia, D.; Prabhakar, G. Risk Factors for Project Success in the Chinese Construction Industry. J. Manuf. Technol. Manag. 2017, 28, 850–866. [Google Scholar] [CrossRef]
- Aretoulis, G.N.; Papathanasiou, J.; Antoniou, F. PROMETHEE-Based Ranking of Project Managers Based on the Five Personality Traits. Kybernetes 2020, 49, 1083–1102. [Google Scholar] [CrossRef]
- Gupta, P.; Anand, S.; Gupta, H. Developing a Roadmap to Overcome Barriers to Energy Efficiency in Buildings Using Best Worst Method. Sustain. Cities Soc. 2017, 31, 244–259. [Google Scholar] [CrossRef]
- Abdul Nabi, M.; El-adaway, I.H. Understanding Disputes in Modular Construction Projects: Key Common Causes and Their Associations. J. Constr. Eng. Manag. 2022, 148, 04021184. [Google Scholar] [CrossRef]
- Mishmish, M.; El-Sayegh, S.M. Causes of Claims in Road Construction Projects in the UAE. Int. J. Constr. Manag. 2018, 18, 26–33. [Google Scholar] [CrossRef]
- Shen, W.; Tang, W.; Yu, W.; Duffield, C.F.; Hui, F.K.P.; Wei, Y.; Fang, J. Causes of Contractors’ Claims in International Engineering-Procurement-Construction Projects. J. Civ. Eng. Manag. 2017, 23, 727–739. [Google Scholar] [CrossRef]
- Antoniou, F.; Aretoulis, G.N.; Konstantinidis, D.K.; Kalfakakou, G.P. An Empirical Study of Researchers’ and Practitioners’ Views on Compensating Major Highway Project Contractors. Int. J. Manag. Decis. Mak. 2013, 12, 351–375. [Google Scholar] [CrossRef]
- Oo, B.L.; Lim, T.H.B.; Runeson, G. Critical Factors Affecting Contractors’ Decision to Bid: A Global Perspective. Buildings 2022, 12, 379. [Google Scholar] [CrossRef]
- Abbasi, G.; Abbasi, G.Y.; Abdel-Jaber, M.S.; Abu-Khadejeh, A. Risk Analysis for the Major Factors Affecting the Construction Industry in Jordan. Emir. J. Eng. Res. 2005, 10, 41–47. [Google Scholar]
- Jozi, S.A.; Shafiee, M.; MoradiMajd, N.; Saffarian, S. An Integrated Shannon’s Entropy–TOPSIS Methodology for Environmental Risk Assessment of Helleh Protected Area in Iran. Environ. Monit. Assess. 2012, 184, 6913–6922. [Google Scholar] [CrossRef] [PubMed]
- Aminbakhsh, S.; Gunduz, M.; Sonmez, R. Safety Risk Assessment Using Analytic Hierarchy Process (AHP) during Planning and Budgeting of Construction Projects. J. Saf. Res. 2013, 46, 99–105. [Google Scholar] [CrossRef]
- Zayed, T.; Amer, M.; Pan, J. Assessing Risk and Uncertainty Inherent in Chinese Highway Projects Using AHP. Int. J. Proj. Manag. 2008, 26, 408–419. [Google Scholar] [CrossRef]
- Marinelli, M.; Janardhanan, M. Green Cement Production in India: Prioritization and Alleviation of Barriers Using the Best–Worst Method. Environ. Sci. Pollut. Res. 2022, 29, 63988–64003. [Google Scholar] [CrossRef] [PubMed]
- Antoniou, F.; Agrafioti, N.F. Meta-Analysis of Studies on Accident Contributing Factors in the Greek Construction Industry. Sustainability 2023, 15, 2357. [Google Scholar] [CrossRef]
- Kalogeraki, M.; Antoniou, F. Improving Risk Assessment for Transporting Dangerous Goods through European Road Tunnels: A Delphi Study. Systems 2021, 9, 80. [Google Scholar] [CrossRef]
- Koulinas, G.K.; Marhavilas, P.K.; Demesouka, O.E.; Vavatsikos, A.P.; Koulouriotis, D.E. Risk Analysis and Assessment in the Worksites Using the Fuzzy-Analytical Hierarchy Process and a Quantitative Technique—A Case Study for the Greek Construction Sector. Saf. Sci. 2019, 112, 96–104. [Google Scholar] [CrossRef]
- Glass, G.V. Primary, Secondary, and Meta-Analysis of Research. Educ. Res. 1976, 5, 3. [Google Scholar] [CrossRef]
- Borenstein, M.; Hedges, L.V.; Higgins, J.P.T.; Rothstein, H.R. A Basic Introduction to Fixed-Effect and Random-Effects Models for Meta-Analysis. Res. Synth. Methods 2010, 1, 97–111. [Google Scholar] [CrossRef]
- Zidane, Y.J.-T.; Andersen, B. The Top 10 Universal Delay Factors in Construction Projects. Int. J. Manag. Proj. Bus. 2018, 11, 650–672. [Google Scholar] [CrossRef]
- Hu, K.; Rahmandad, H.; Smith-Jackson, T.; Winchester, W. Factors Influencing the Risk of Falls in the Construction Industry: A Review of the Evidence. Constr. Manag. Econ. 2011, 29, 397–416. [Google Scholar] [CrossRef]
- Nadhim, E.; Hon, C.; Xia, B.; Stewart, I.; Fang, D. Falls from Height in the Construction Industry: A Critical Review of the Scientific Literature. Int. J. Environ. Res. Public Health 2016, 13, 638. [Google Scholar] [CrossRef]
- Tong, R.; Wang, L.; Cao, L.; Zhang, B.; Yang, X. Psychosocial Factors for Safety Performance of Construction Workers: Taking Stock and Looking Forward. Eng. Constr. Archit. Manag. 2021, 30. [Google Scholar] [CrossRef]
- Newaz, M.T.; Davis, P.R.; Jefferies, M.; Pillay, M. Developing a Safety Climate Factor Model in Construction Research and Practice. Eng. Constr. Archit. Manag. 2018, 25, 738–757. [Google Scholar] [CrossRef]
- Moher, D.; Liberati, A.; Tetzlaff, J.; Altman, D.G. Preferred Reporting Items for Systematic Reviews and Meta-Analyses: The PRISMA Statement. BMJ 2009, 339, 332–336. [Google Scholar] [CrossRef]
- Kokkini, A.A. Risks and Risk Control Measures on Building Construction Sites: The Workers’ Perspective. Master’s Thesis, Hellenic Open University, Patras, Greece, 2020. [Google Scholar]
- Papadatou, G. Factors Causing Occupational Accidents in Construction and Prevention Measures. Master’s Thesis, Hellenic Open University, Patras, Greece, 2021. [Google Scholar]
- Ritsa, O. Safety and Health in Engineering Projects. Master’s Thesis, Hellenic Open University, Patras, Greece, 2019. [Google Scholar]
- Tsianas, B. Safety of Underground Utilities Engineering Works in an Urban Environment. Master’s Thesis, Hellenic Open University, Patras, Greece, 2020. [Google Scholar]
- Kapelakis, G. Health and Safety during the Construction and Operation of Building D of the Hellenic Open University. Master’s Thesis, Hellenic Open University, Patras, Greece, 2020. [Google Scholar]
- Kotsalos, C. The Role of Worker Training in Reducing Occupational Accidents at Workplaces. Master’s Thesis, Hellenic Open University, Patras, Greece, 2020. [Google Scholar]
- Touloupi, F. Investigating the Relationship between Labour Productivity in Construction Projects in Relation to Health and Safety Conditions. Master’s Thesis, Hellenic Open University, Patras, Greece, 2020. [Google Scholar]
- Pantos, M. Factors Affecting Safety and Hygiene in Technical Works and the Response of Human Resources to Preventive Measures. Master’s Thesis, Hellenic Open University, Patras, Greece, 2019. [Google Scholar]
- Marazioti, M. The Role of the Human Factor in the Challenge of Occupational Accidents in Technical Projects. Master’s Thesis, Hellenic Open University, Patras, Greece, 2019. [Google Scholar]
- Pigounaki, C. Economic Crisis and Occupational Accidents in Construction Projects: Evidence from the Greek Reality. Master’s Thesis, Hellenic Open University, Patras, Greece, 2018. [Google Scholar]
- Theodorakopoulos, G. Safety Management Systems in Construction Projects. Master’s Thesis, Hellenic Open University, Patras, Greece, 2016. [Google Scholar]
- Alamanos, N. The Impact of Continuous Training in the Field of Safety and Hygiene: The Case of Metro Construction Sites. Master’s Thesis, Hellenic Open University, Patras, Greece, 2017. [Google Scholar]
- Papastathakis, A. Investigation to Ensure Safe Working Conditions in Construction and Industrial Installations. Master’s Thesis, Hellenic Open University, Patras, Greece, 2018. [Google Scholar]
- Charitonidou, A. Occupational Risk Assessment of Employees in Constrcution Companies in Western Macedonia—Subjective Perception of Employees. Master’s Thesis, Hellenic Open University, Patras, Greece, 2015. [Google Scholar]
- Tzegkas, S. Health and Safety in Formwork and Concrete Laying Construction Crews. Master’s Thesis, Hellenic Open University, Patras, Greece, 2010. [Google Scholar]
- Koulinas, G. Occupational Safety Risk Assessment Using the Analytical Hierarchy Process. Master’s Thesis, Hellenic Open University, Patras, Greece, 2017. [Google Scholar]
- Bougelis, G. Occupational Risk Assessment Using Risk Registers and FEAHPFTOPSIS Multi-Criteria Decision Making Methods—Application to a Gas Plant Construction Site. Master’s Thesis, Hellenic Open University, Patras, Greece, 2021. [Google Scholar]
- Vroudas, P. Risk Assessment in Construction Projects Using Accident Statistics. Master’s Thesis, Hellenic Open University, Patras, Greece, 2016. [Google Scholar]
- Fekos, D. Hazard Analysis and Risk Assessment in Occupational Safety and Health Using a Combination of Probabilistic and Causal Methods—Application to Construction Sites. Master’s Thesis, Hellenic Open University, Patras, Greece, 2018. [Google Scholar]
- Panagiotopoulos, A.P. Analysis of Occupational Accidents in the Construction Sector. Master’s Thesis, Hellenic Open University, Patras, Greece, 2020. [Google Scholar]
- Katsolas, P. Evolution of Occupational Accidents in Construction. Master’s Thesis, Hellenic Open University, Patras, Greece, 2018. [Google Scholar]
- Mylona, S. Safety Management in Technical Telecommunications Projects. Network Works and Installation of Mobile Telephone Base Stations. Master’s Thesis, Hellenic Open University, Patras, Greece, 2019. [Google Scholar]
- Hedges, L.V. Meta-Analysis. J. Educ. Stat. 1992, 17, 279–296. [Google Scholar] [CrossRef]
- Neyeloff, J.L.; Fuchs, S.C.; Moreira, L.B. Meta-Analyses and Forest Plots Using a Microsoft Excel Spreadsheet: Step-by-Step Guide Focusing on Descriptive Data Analysis. BMC Res. Notes 2012, 5, 52. [Google Scholar] [CrossRef] [PubMed]
- Holt, G.D. Asking Questions, Analysing Answers: Relative Importance Revisited. Constr. Innov. 2014, 14, 2–16. [Google Scholar] [CrossRef]
- Higgins, J.P.T. Measuring Inconsistency in Meta-Analyses. BMJ 2003, 327, 557–560. [Google Scholar] [CrossRef] [PubMed]
- Zhao, D.; Lucas, J. Virtual Reality Simulation for Construction Safety Promotion. Int. J. Inj. Contr. Saf. Promot. 2015, 22, 57–67. [Google Scholar] [CrossRef]


| Reference | Country | Data Source | Evaluation Method |
|---|---|---|---|
| [1] | UK | Accident Data | Frequencies |
| [2] | China | Questionnaires | Factor Analysis |
| [3] | UK | Accident Data | Frequencies |
| [4] | Hong Kong | Questionnaires | RII |
| [5] | China | Interviews/Accident Data | Qualitative analysis |
| [6] | Greece | Accident Data | Factor Analysis |
| [7] | China | Questionnaires | Delphi Method |
| [8] | Taiwan | Accident Data | Frequencies/Correlation Analysis/Factor Analysis |
| [9] | USA | Accident Data | Frequencies |
| [10] | Malaysia | Accident Data | Frequencies |
| [11] | Tanzania | Questionnaires | Frequencies |
| [12] | USA | Accident Data | Frequencies |
| [13] | Iran | Accident Data | Decision Trees |
| [14] | Spain | Accident Data | Frequencies |
| [15] | Poland | Questionnaires | Correlation Analysis |
| [16] | Denmark | Questionnaires | Factor Analysis |
| [17] | Norway | Accident Data | Correlation Analysis |
| [18] | Malaysia | Questionnaires | Correlation Analysis |
| [19] | Greece | Accident Data | Correlation Analysis |
| [20] | China | Accident Data | Grey Relational Analysis |
| [21] | China | Accident Data | Frequencies/Correlation Analysis |
| [22] | Saudi Arabia | Questionnaires | Factor Analysis |
| [23] | Palestine | Questionnaires | RII/Factor Analysis/Correlation Analysis |
| [24] | USA | Questionnaires | Factor Analysis |
| [25] | Ethiopia | Published studies | Meta-analysis |
| [26] | Greece | Questionnaires | RII |
| [27] | Ethiopia | Published studies | Meta-analysis |
| [28] | Ethiopia | Published studies | Meta-analysis |
| Reference | Study Code | No. of Factors | Data Source | Sample Size (n) | Ranking Method |
|---|---|---|---|---|---|
| [26] | S1 | 104 | Questionnaires | 102 | RII |
| [61] | S2 | 28 | Questionnaires | 149 | Mean/Freq./St. Dev |
| [62] | S3 | 22 | Questionnaires | 65 | Freq. |
| [63] | S4 | 21 | Questionnaires | 46 | Freq. |
| [64] | S5 | 37 | Questionnaires | 131 | Freq. |
| [65] | S6 | 19 | Questionnaires | 89 | Freq. |
| [66] | S7 | 29 | Questionnaires | 141 | Freq. |
| [67] | S8 | 20 | Questionnaires | 130 | Freq. |
| [68] | S9 | 20 | Questionnaires | 82 | Freq. |
| [69] | S10 | 42 | Questionnaires | 57 | Freq. |
| [70] | S11 | 19 | Questionnaires | 70 | Freq. |
| [71] | S12 | 25 | Questionnaires | 25 | RII |
| [72] | S13 | 135 | Questionnaires | 55 | Mean/Freq./St. Dev. |
| [73] | S14 | 26 | Questionnaires | 60 | Freq. |
| [74] | S15 | 33 | Questionnaires | 56 | Freq. |
| [75] | S16 | 40 | Questionnaires | 50 | Freq. |
| [76] | S17 | 10 | Accidents | 169,381 | AHP |
| [77] | S18 | 8 | Accidents | 149 | DMRA/FAHP/FTOPSIS |
| [78] | S19 | 8 | Accidents | 11,171 | PRAT/TSP |
| [79] | S20 | 8 | Accidents | 41,081 | PRAT/FTA |
| [80] | S21 | 8 | Accidents | 13,776 | PRAT/TSP |
| [19] | S22 | 13 | Accidents | 413 | Freq. |
| [81] | S23 | 8 | Accidents | 2615 | Freq. |
| [82] | S24 | 11 | Accidents | 137 | Freq. |
| [6] | S25 | 6 | Accidents | 3332 | Freq. |
| Step | Variable Notation | Equation | |
|---|---|---|---|
| 1 | Calculation of effect size using RII calculates in each study (Table 4) | es | [85] |
| 2 | Calculation of standard error | SE | n = sample size |
| 3 | Calculation of variance | Var | |
| 4 | Calculation of individual study weights (fixed effect) | w | |
| 5 | Calculation of effect summary (fixed effects) | ||
| 6 | Calculation of Q (chi-squared statistic), null hypothesis: | Q | Null hypothesis: all studies equal Df: (k − 1), k: no. of studies |
| 7 | Calculation of I Negative values are replaced by zero. I2 = 0, no heterogeneity | I2 | |
| 8 | Calculation of constant ν to account for the variability between studies (random effects) | v | if |
| 9 | Calculation of new weights for each individual study (random effects) | wv | |
| 10 | Calculation of effect summary (random effects) | ||
| 11 | Calculation of standard error (random effects) | ||
| 12 | Calculation of Z to verify the null hypothesis | ||
| 13 | Repeat steps 6 and 7 using new weights for null hypothesis testing | Qv και Iv2 |
| AFBS Code | S1 | S2 | S3 | S4 | S5 | S6 | S7 | S8 | S9 | S10 | S11 | S12 | S13 | S14 | S15 | S16 | |
|---|---|---|---|---|---|---|---|---|---|---|---|---|---|---|---|---|---|
| 1.0 | Safety Culture | ||||||||||||||||
| 1.1 | Safety Rules Compliance | ||||||||||||||||
| 1.1.1 | Noncompliance | 0.706 | 0.719 | 0.722 | 0.770 | 0.695 | 0.683 | 0.723 | 0.500 | 0.770 | 0.884 | 0.796 | 0.740 | ||||
| 1.2 | Safety Culture | ||||||||||||||||
| 1.2.1 | Deficient use of safety measures | 0.704 | 0.917 | 0.785 | 0.716 | 0.920 | |||||||||||
| 1.2.2 | Organizational competitive advantage | 0.594 | 0.708 | 0.656 | 0.785 | ||||||||||||
| 1.2.3 | Lack of safety commitment | 0.684 | 0.726 | 0.410 | 0.815 | ||||||||||||
| 1.2.4 | Lack of risk management | 0.701 | 0.670 | 0.760 | 0.822 | ||||||||||||
| 1.3 | Safety legislation | ||||||||||||||||
| 1.3.1 | Violation of legislation | 0.982 | 0.866 | 0.554 | 0.676 | ||||||||||||
| 1.3.2 | Insufficient legislation implementation | 0.661 | 0.692 | 0.904 | 0.638 | 0.709 | 0.813 | ||||||||||
| 1.4 | Training Standards | ||||||||||||||||
| 1.4.1 | Inadequate training | 0.554 | 0.728 | 0.427 | 0.429 | 0.616 | 0.509 | 0.814 | 0.670 | 0.375 | 0.517 | 0.366 | 0.528 | ||||
| 2.0 | Occupational Risks | ||||||||||||||||
| 2.1 | Hazard Risks | ||||||||||||||||
| 2.1.1 | Dangerous working conditions | 0.685 | 0.607 | 0.661 | 0.668 | 0.509 | 0.625 | 0.770 | 0.531 | 0.688 | 0.776 | ||||||
| 2.1.2 | Building structures deficiencies | 0.604 | 0.649 | 0.502 | 0.436 | ||||||||||||
| 2.1.3 | Hazardous site environmental conditions | 0.189 | 0.554 | 0.679 | 0.760 | ||||||||||||
| 2.1.4 | Objects falling or being ejected | 0.710 | 0.636 | 0.839 | 0.746 | 0.690 | 0.670 | 0.768 | |||||||||
| 2.1.6 | Falling or slipping | 0.675 | 0.690 | 0.827 | 0.857 | 0.685 | 0.784 | 0.725 | 0.679 | 0.776 | |||||||
| 2.1.7 | Poor safety signage | 0.196 | 0.463 | 0.629 | 0.648 | ||||||||||||
| 2.1.8 | Poor machinery or vehicle operation | 0.703 | 0.520 | 0.831 | 0.791 | 0.492 | 0.798 | 0.479 | 0.750 | 0.710 | 0.784 | ||||||
| 2.1.9 | Equipment safety deficiencies | 0.627 | 0.652 | 0.693 | 0.616 | 0.428 | 0.415 | ||||||||||
| 2.1.11 | Poor safety installations | 0.604 | 0.458 | 0.637 | 0.477 | 0.367 | |||||||||||
| 2.1.12 | Use and mobility of hazardous material | 0.739 | 0.592 | 0.320 | 0.546 | 0.372 | 0.360 | 0.717 | |||||||||
| 2.1.13 | Risk of electrocution | 0.688 | 0.495 | 0.758 | 0.830 | 0.379 | 0.564 | 0.625 | 0.460 | 0.480 | 0.633 | 0.388 | 0.564 | ||||
| 2.1.14 | Explosions and fires | 0.386 | 0.615 | 0.504 | 0.553 | 0.495 | 0.522 | 0.530 | 0.444 | 0.594 | |||||||
| 2.2 | Health Risks | ||||||||||||||||
| 2.2.1 | Exposure to occupational diseases | 0.727 | 0.632 | 0.735 | 0.519 | 0.509 | 0.708 | ||||||||||
| 2.2.2 | Exposure to chemicals | 0.573 | 0.498 | 0.669 | 0.684 | 0.418 | 0.498 | 0.688 | 0.684 | ||||||||
| 2.2.3 | Physical factors | 0.643 | 0.492 | 0.644 | 0.544 | 0.516 | 0.661 | 0.712 | |||||||||
| 2.2.4 | Noise | 0.313 | 0.757 | 0.750 | 0.667 | 0.656 | 0.676 | ||||||||||
| 2.2.5 | Biological factors | 0.757 | 0.622 | 0.474 | 0.356 | 0.520 | |||||||||||
| 2.3 | Organizational Risks | ||||||||||||||||
| 2.3.1 | Work scheduling problems | 0.677 | 0.791 | 0.623 | 0.446 | 0.440 | 0.513 | 0.784 | |||||||||
| 2.3.2 | Psychological factors | 0.865 | 0.661 | 0.614 | 0.487 | 0.746 | 0.644 | ||||||||||
| 2.3.3 | Exhaustion | 0.775 | 0.800 | 0.687 | 0.795 | 0.607 | 0.780 | 0.521 | 0.710 | 0.692 | |||||||
| 2.3.4 | Stress (physical/mental) | 0.804 | 0.432 | 0.741 | 0.708 | ||||||||||||
| 2.3.5 | Ergonomic issues | 0.639 | 0.623 | 0.582 | 0.433 | ||||||||||||
| 2.3.6 | Deficient communication | 0.814 | 0.820 | 0.608 | 0.550 | 0.366 | 0.604 | ||||||||||
| 2.3.8 | Stressful working conditions | 0.524 | 0.691 | 0.608 | 0.502 | 0.436 | 0.717 | 0.732 | |||||||||
| 2.3.9 | Extreme weather | 0.699 | 0.784 | 0.735 | 0.745 | 0.704 | |||||||||||
| 3.0 | Worker Training Deficiencies | ||||||||||||||||
| 3.1 | Training level | 0.599 | 0.721 | 0.870 | 0.764 | 0.738 | 0.746 | 0.762 | 0.604 | 0.550 | 0.727 | 0.800 | 0.720 | ||||
| 3.2 | At work position training | 0.820 | 0.536 | 0.738 | 0.625 | 0.505 | 0.793 | 0.691 | 0.783 | 0.684 | |||||||
| 3.3 | On site training | 0.554 | 0.677 | 0.502 | 0.561 | 0.705 | 0.750 | 0.888 | 0.676 | ||||||||
| 3.4 | Lack of official H&S agency training and information | 0.406 | 0.543 | 0.439 | 0.571 | 0.533 | 0.316 | ||||||||||
| 3.5 | Accident prevention training | 0.627 | 0.776 | 0.744 | 0.784 | 0.665 | 0.691 | ||||||||||
| 3.6 | Training for emergency situations | 0.736 | 0.607 | 0.530 | 0.691 | ||||||||||||
| 3.7 | Training in new safety measures | 0.772 | 0.773 | 0.610 | 0.689 | 0.759 | 0.495 | 0.600 | 0.713 | ||||||||
| 3.8 | Safety legislation training | 0.979 | 0.919 | 0.808 | 0.804 | 0.782 | 0.879 | 0.796 | |||||||||
| 4.0 | Occupational Satisfaction | ||||||||||||||||
| 4.1 | Workers’ point of view | ||||||||||||||||
| 4.1.1 | Workers’ lack of qualifications | 0.768 | 0.722 | 0.884 | 0.700 | ||||||||||||
| 4.1.2 | Workers’ safety satisfaction | 0.638 | 0.837 | 0.784 | 0.680 | 0.689 | 0.646 | 0.702 | |||||||||
| 4.2 | Employer’s Perception | ||||||||||||||||
| 4.2.1 | Workers’ job performance satisfaction | 0.638 | 0.763 | 0.751 | 0.651 | ||||||||||||
| 5.0 | Safety Measures | ||||||||||||||||
| 5.1 | Personal Protection Equipment (PPE) | ||||||||||||||||
| 5.1.1 | Frequency of provision | 0.742 | 0.839 | 0.823 | 0.773 | 0.858 | 0.848 | 0.636 | |||||||||
| 5.1.2 | Supervision of correct use | 0.698 | 0.779 | 0.696 | 0.795 | 0.793 | 0.811 | ||||||||||
| 5.2 | Proper use of each piece of PPE | ||||||||||||||||
| 5.2.2 | Helmet | 0.614 | 0.869 | 0.900 | 0.719 | 0.879 | 0.683 | 0.817 | 0.886 | 0.600 | |||||||
| 5.2.3 | Mask | 0.586 | 0.842 | 0.773 | 0.640 | 0.683 | 0.543 | ||||||||||
| 5.2.4 | Earplugs | 0.465 | 0.727 | 0.635 | 0.732 | 0.500 | 0.476 | ||||||||||
| 5.2.5 | Special footwear | 0.826 | 0.877 | 0.887 | 0.640 | 0.978 | 0.803 | 0.899 | 0.776 | ||||||||
| 5.2.6 | Work uniforms | 0.476 | 0.605 | 0.707 | 0.708 | ||||||||||||
| 5.2.7 | Glasses | 0.663 | 0.781 | 0.787 | 0.747 | 0.601 | 0.584 | ||||||||||
| 5.2.8 | Gloves | 0.723 | 0.877 | 0.835 | 0.533 | 0.896 | 0.768 | 0.643 | 0.868 | 0.380 |
| Data from Table 4 | Step 2 | Step 3 | Step 4 | |||
|---|---|---|---|---|---|---|
| Study | n | es = RII | ||||
| S5 | 131 | 0.594 | 0.0673376 | 0.0045344 | 220.5387205 | 131 |
| S8 | 130 | 0.708 | 0.0737981 | 0.0054462 | 183.6158192 | 130 |
| S10 | 57 | 0.656 | 0.1072789 | 0.0115088 | 86.8902439 | 57 |
| S13 | 55 | 0.785 | 0.1194685 | 0.0142727 | 70.0636943 | 55 |
| Sums | 561.1084779 | 373 | ||||
| Step 5 | ||||||
| AFBS Code | Frequency of Appearance | Fixed Effect Model | Random Effects Model for Factors with Heterogeneity | Overall Rank | |||||||||||
|---|---|---|---|---|---|---|---|---|---|---|---|---|---|---|---|
| Freq | Rank (1) | Rank (2) | 95% CI | Q | I2 (%) | Z-Score p-Value | Rank (3) | Qv | I2v (%) | Z-Score p-Value | 95% CI | ||||
| 1.1.1 | 12 | 1 | 0.707 | 15 | 0.653–0.762 | 9.377 | 0 | 25.450 | 16 | ||||||
| 1.2.1 | 5 | 7 | 0.780 | 4 | 0.692–0.868 | 3.280 | 0 | 17.441 | 4 | ||||||
| 1.2.2 | 4 | 8 | 0.665 | 25 | 0.582–0.747 | 2.467 | 0 | 15.747 | 25 | ||||||
| 1.2.3 | 4 | 8 | 0.673 | 24 | 0.574–0.771 | 5.822 | 0 | 13.425 | 24 | ||||||
| 1.2.4 | 4 | 8 | 0.721 | 12 | 0.619–0.823 | 1.029 | 0 | 13.900 | 12 | ||||||
| 1.3.1 | 4 | 8 | 0.777 | 5 | 0.688–0.867 | 12.841 | 0 | 17.097 | 5 | ||||||
| 1.3.2 | 6 | 6 | 0.700 | 18 | 0.624–0.776 | 4.097 | 0 | 17.963 | 19 | ||||||
| 1.4.1 | 12 | 1 | 0.516 | 48 | 0.469–0.562 | 28.722 | 48 | 21.759 | 0.530 | 7 | 12.858 | 0 | 14.417 | 0.458–0.602 | 48 |
| 2.1.1 | 10 | 2 | 0.641 | 30 | 0.584–0.698 | 5.842 | 0 | 22.010 | 32 | ||||||
| 2.1.2 | 4 | 8 | 0.551 | 46 | 0.465–0.638 | 3.568 | 0 | 12.490 | 46 | ||||||
| 2.1.3 | 4 | 8 | 0.337 | 54 | 0.267–0.406 | 38.339 | 61 | 9.498 | 0.529 | 8 | 2.986 | 0 | 4.076 | 0.275–0.783 | 49 |
| 2.1.4 | 7 | 5 | 0.705 | 17 | 0.636–0.774 | 2.790 | 0 | 20.034 | 18 | ||||||
| 2.1.6 | 9 | 3 | 0.730 | 10 | 0.669–0.791 | 3.548 | 0 | 23.519 | 10 | ||||||
| 2.1.7 | 4 | 8 | 0.352 | 53 | 0.290–0.414 | 30.009 | 50 | 11.086 | 0.459 | 10 | 4.367 | 0 | 5.196 | 0.286–0.632 | 53 |
| 2.1.8 | 10 | 2 | 0.636 | 33 | 0.580–0.691 | 23.130 | 35 | 22.450 | 0.659 | 2 | 10.927 | 0 | 16.012 | 0.578–0.739 | 26 |
| 2.1.9 | 6 | 6 | 0.583 | 38 | 0.518–0.649 | 10.512 | 0 | 17.519 | 39 | ||||||
| 2.1.10 | 6 | 6 | 0.653 | 28 | 0.586–0.719 | 3.195 | 0 | 19.188 | 29 | ||||||
| 2.1.11 | 5 | 7 | 0.506 | 49 | 0.435–0.577 | 7.275 | 0 | 13.954 | 51 | ||||||
| 2.1.12 | 7 | 5 | 0.479 | 51 | 0.418–0.539 | 27.095 | 45 | 15.622 | 0.507 | 9 | 8.733 | 0 | 9.338 | 0.401–0.614 | 50 |
| 2.1.13 | 12 | 1 | 0.537 | 47 | 0.490–0.584 | 25.167 | 40 | 22.611 | 0.551 | 7 | 13.800 | 0 | 16.193 | 0.485–0.618 | 46 |
| 2.1.14 | 9 | 3 | 0.488 | 50 | 0.436–0.539 | 8.002 | 0 | 18.586 | 52 | ||||||
| 2.2.1 | 6 | 6 | 0.645 | 29 | 0.572–0.717 | 6.218 | 0 | 17.481 | 31 | ||||||
| 2.2.2 | 8 | 4 | 0.571 | 43 | 0.514–0628 | 10.989 | 0 | 19.635 | 43 | ||||||
| 2.2.3 | 7 | 5 | 0.606 | 36 | 0.542–0670 | 4.953 | 0 | 18.632 | 37 | ||||||
| 2.2.4 | 6 | 6 | 0.574 | 42 | 0.512–0.637 | 34.647 | 57 | 17.983 | 0.627 | 5 | 4.526 | 0 | 8.395 | 0.480–0.773 | 36 |
| 2.2.5 | 5 | 7 | 0.569 | 44 | 0.499–0.639 | 15.919 | 6 | 16.037 | 0.564 | 6 | 12.679 | 0 | 14.212 | 0.487–0.642 | 45 |
| 2.3.1 | 7 | 5 | 0.588 | 37 | 0.520–0.655 | 17.158 | 0 | 17.158 | 38 | ||||||
| 2.3.2 | 9 | 3 | 0.709 | 14 | 0.645–0.774 | 8.205 | 0 | 21.490 | 14 | ||||||
| 2.3.3 | 6 | 6 | 0.655 | 27 | 0.577–0.733 | 7.296 | 0 | 16.471 | 28 | ||||||
| 2.3.4 | 4 | 8 | 0.608 | 35 | 0.530–0.686 | 18.556 | 19 | 15.321 | 0.647 | 3 | 6.269 | 0 | 10.176 | 0.523–0.772 | 30 |
| 2.3.5 | 4 | 8 | 0.580 | 39 | 0.500–0.660 | 3.690 | 0 | 14.145 | 40 | ||||||
| 2.3.6 | 6 | 6 | 0.638 | 32 | 0.569–0.707 | 21.862 | 31 | 18.095 | 0.634 | 4 | 8.366 | 0 | 11.234 | 0.523–0745 | 34 |
| 2.3.8 | 7 | 5 | 0.577 | 41 | 0.510–0.643 | 8.047 | 0 | 17.001 | 42 | ||||||
| 2.3.9 | 5 | 7 | 0.740 | 8 | 0.666–0.815 | 0.712 | 0 | 19.376 | 8 | ||||||
| 3.1 | 12 | 1 | 0.715 | 13 | 0.662–0.768 | 7.310 | 0 | 26.550 | 13 | ||||||
| 3.2 | 9 | 3 | 0.674 | 23 | 0.616–0.731 | 14.978 | 0 | 22.980 | 23 | ||||||
| 3.3 | 8 | 4 | 0.633 | 34 | 0.570–0.696 | 10.180 | 0 | 19.636 | 35 | ||||||
| 3.4 | 6 | 6 | 0.448 | 52 | 0.385–0.511 | 6.970 | 0 | 13.962 | 54 | ||||||
| 3.5 | 7 | 5 | 0.865 | 1 | 0.781–0.950 | 3.398 | 0 | 20.038 | 1 | ||||||
| 3.6 | 6 | 6 | 0.727 | 11 | 0.656–0.797 | 2.638 | 0 | 20.225 | 11 | ||||||
| 3.7 | 4 | 8 | 0.639 | 31 | 0.545–0.732 | 2.769 | 0 | 13.443 | 33 | ||||||
| 3.8 | 8 | 4 | 0.687 | 20 | 0.628–0.746 | 9.069 | 0 | 22.745 | 21 | ||||||
| 4.1.1 | 4 | 8 | 0.756 | 7 | 0.669–0.844 | 1.496 | 0 | 16.887 | 7 | ||||||
| 4.1.2 | 7 | 5 | 0.707 | 15 | 0.644–0.770 | 4.349 | 0 | 22.014 | 16 | ||||||
| 4.2.1 | 4 | 8 | 0.696 | 19 | 0.611–0.780 | 1.856 | 0 | 16.110 | 20 | ||||||
| 5.1.1 | 7 | 5 | 0.786 | 3 | 0.712–0.860 | 2.958 | 0 | 20.771 | 3 | ||||||
| 5.1.2 | 6 | 6 | 0.763 | 6 | 0.639–0.833 | 1.546 | 0 | 21.375 | 6 | ||||||
| 5.2.2 | 9 | 3 | 0.734 | 9 | 0.676–0.793 | 12.986 | 0 | 24.579 | 9 | ||||||
| 5.2.3 | 6 | 6 | 0.659 | 26 | 0.597–0.721 | 8.344 | 0 | 20.803 | 26 | ||||||
| 5.2.4 | 6 | 6 | 0.566 | 45 | 0.502–0.631 | 12.700 | 0 | 17.177 | 44 | ||||||
| 5.2.5 | 8 | 4 | 0.807 | 2 | 0.743–0.871 | 9.966 | 0 | 24.648 | 2 | ||||||
| 5.2.6 | 4 | 8 | 0.578 | 40 | 0.503–0.654 | 5.874 | 0 | 15.056 | 41 | ||||||
| 5.2.7 | 6 | 6 | 0.680 | 22 | 0.606–0.753 | 3.758 | 0 | 18.082 | 22 | ||||||
| 5.2.8 | 9 | 3 | 0.684 | 21 | 0.627–0.740 | 30.799 | 51 | 23.721 | 0.709 | 1 | 10.497 | 0 | 13.792 | 0.608–0.809 | 14 |
| AFBS Code | Factors | S17 | S18 | S19a | S19b | S20 | S21a | S21b | S22 | S23 | S24 | S25 | Ni | ORI |
|---|---|---|---|---|---|---|---|---|---|---|---|---|---|---|
| 1.2.1 | Deficient use of safety measures | 7 | 1 | 0.013 | ||||||||||
| 1.4.1 | Inadequate training | 1 | 2 | 2 | 0.273 | |||||||||
| 2.1.3 | Hazardous site environmental conditions | 5 | 5 | 2 | 0.073 | |||||||||
| 2.1.4 | Objects falling or being ejected | 2 | 2 | 8 | 4 | 4 | 0.500 | |||||||
| 2.1.5 | Being crushed by or caught between objects | 4 | 9 | 3 | 3 | 0.189 | ||||||||
| 2.1.6 | Falling or slipping (values refer to falling) | 2 | 5 | 2 | 1 | 4 | 0.8 | |||||||
| 2.1.6 | Falling or slipping (values refer to slipping) | 2 | 3 | 1 | 1 | 1 | 1 | 2 | 1 | 8 | 4.606 | |||
| 2.1.8 | Poor machinery or vehicle operation | 4 | 5 | 2 | 0.082 | |||||||||
| 2.1.9 | Equipment safety deficiencies | 3 | 4 | 3 | 4 | 5 | 6 | 2 | 7 | 1.294 | ||||
| 2.1.13 | Risk of electrocution | 5 | 8 | 7 | 6 | 5 | 7 | 7 | 4 | 2 | 9 | 1.530 | ||
| 2.1.14 | Explosions and fires | 6 | 7 | 6 | 6 | 6 | 6 | 6 | 0.532 | |||||
| 2.1.15 | Material breakage, slippage or falling | 4 | 5 | 4 | 3 | 4 | 5 | 0.583 | ||||||
| 2.1.16 | Liquids: spillage, leakage, evaporation, emission | 5 | 3 | 8 | 8 | 8 | 8 | 6 | 0.564 | |||||
| 2.1.17 | Unanticipated events | 6 | 1 | 0.015 | ||||||||||
| 2.1.18 | Other factors | 2 | 2 | 2 | 2 | 3 | 3 | 4 | 5 | 8 | 2.267 | |||
| 2.2.1 | Exposure to occupational diseases | 6 | 1 | 0.015 | ||||||||||
| 2.2.5 | Biological factors | 3 | 1 | 0.030 | ||||||||||
| 2.3.4 | Stress (physical/mental) | 8 | 8 | 8 | 7 | 5 | 1 | 10 | 7 | 3 | 9 | 2.389 | ||
| 2.3.7 | Mental capacity, bad habits | 1 | 1 | 0.091 | ||||||||||
| 2.3.9 | Extreme weather | 10 | 3 | 2 | 0.079 |
| Rank | Opinion-Based Data (16 Studies) | Accident Based Data ORI (9 Studies) | All Studies ORI (25 Studies) [50] |
|---|---|---|---|
| 1 | 3.5 Accident prevention training | 2.1.6 Slipping | 2.1.6 Falling or slipping |
| 2 | 5.2.5 Special footwear | 2.3.4 Stress (physical/mental) | 5.2.5 Special footwear |
| 3 | 5.1.1 Frequency of provision of PPE | 2.1.18 Other factors | 2.3.4 Stress (physical/mental) |
| 4 | 1.2.1 Deficient use of safety measures | 2.1.13 Risk of electrocution | 3.8 Safety legislation training |
| 5 | 1.3.1 Violation of legislation | 2.1.9 Equipment safety deficiencies | 2.1.4 Objects falling or being ejected |
| 6 | 5.1.2 Supervision of correct use of PPE | 2.1.6 Falling | 2.1.13 Risk of electrocution hazards |
| 7 | 4.1.1 Workers’ lack of qualifications | 2.1.15 Material breakage, slippage or falling | 2.1.18 Other factors |
| 8 | 2.3.9 Extreme weather | 2.1.16 Liquids: spillage, leakage, evaporation, emission | 1.1.1. Noncompliance to safety rules |
| 9 | 5.2.2 Helmet | 2.1.14 Explosions and fires | 2.1.8 Poor machinery or vehicle operation |
| 10 | 2.1.6 Falling or slipping | 2.1.4 Objects falling or being ejected | 1.2.1 Deficient use of safety measures |
Disclaimer/Publisher’s Note: The statements, opinions and data contained in all publications are solely those of the individual author(s) and contributor(s) and not of MDPI and/or the editor(s). MDPI and/or the editor(s) disclaim responsibility for any injury to people or property resulting from any ideas, methods, instructions or products referred to in the content. |
© 2024 by the authors. Licensee MDPI, Basel, Switzerland. This article is an open access article distributed under the terms and conditions of the Creative Commons Attribution (CC BY) license (https://creativecommons.org/licenses/by/4.0/).
Share and Cite
Antoniou, F.; Agrafioti, N.F.; Aretoulis, G. Should We Depend on Expert Opinion or Statistics? A Meta-Analysis of Accident-Contributing Factors in Construction. Buildings 2024, 14, 910. https://doi.org/10.3390/buildings14040910
Antoniou F, Agrafioti NF, Aretoulis G. Should We Depend on Expert Opinion or Statistics? A Meta-Analysis of Accident-Contributing Factors in Construction. Buildings. 2024; 14(4):910. https://doi.org/10.3390/buildings14040910
Chicago/Turabian StyleAntoniou, Fani, Nektaria Filitsa Agrafioti, and Georgios Aretoulis. 2024. "Should We Depend on Expert Opinion or Statistics? A Meta-Analysis of Accident-Contributing Factors in Construction" Buildings 14, no. 4: 910. https://doi.org/10.3390/buildings14040910