


A Study on Seismic Dynamic Response of Pile-Supported Tunnels in Deep Backfill Area of Soil–Rock Mixture Based on a Model Test
Abstract
:1. Introduction
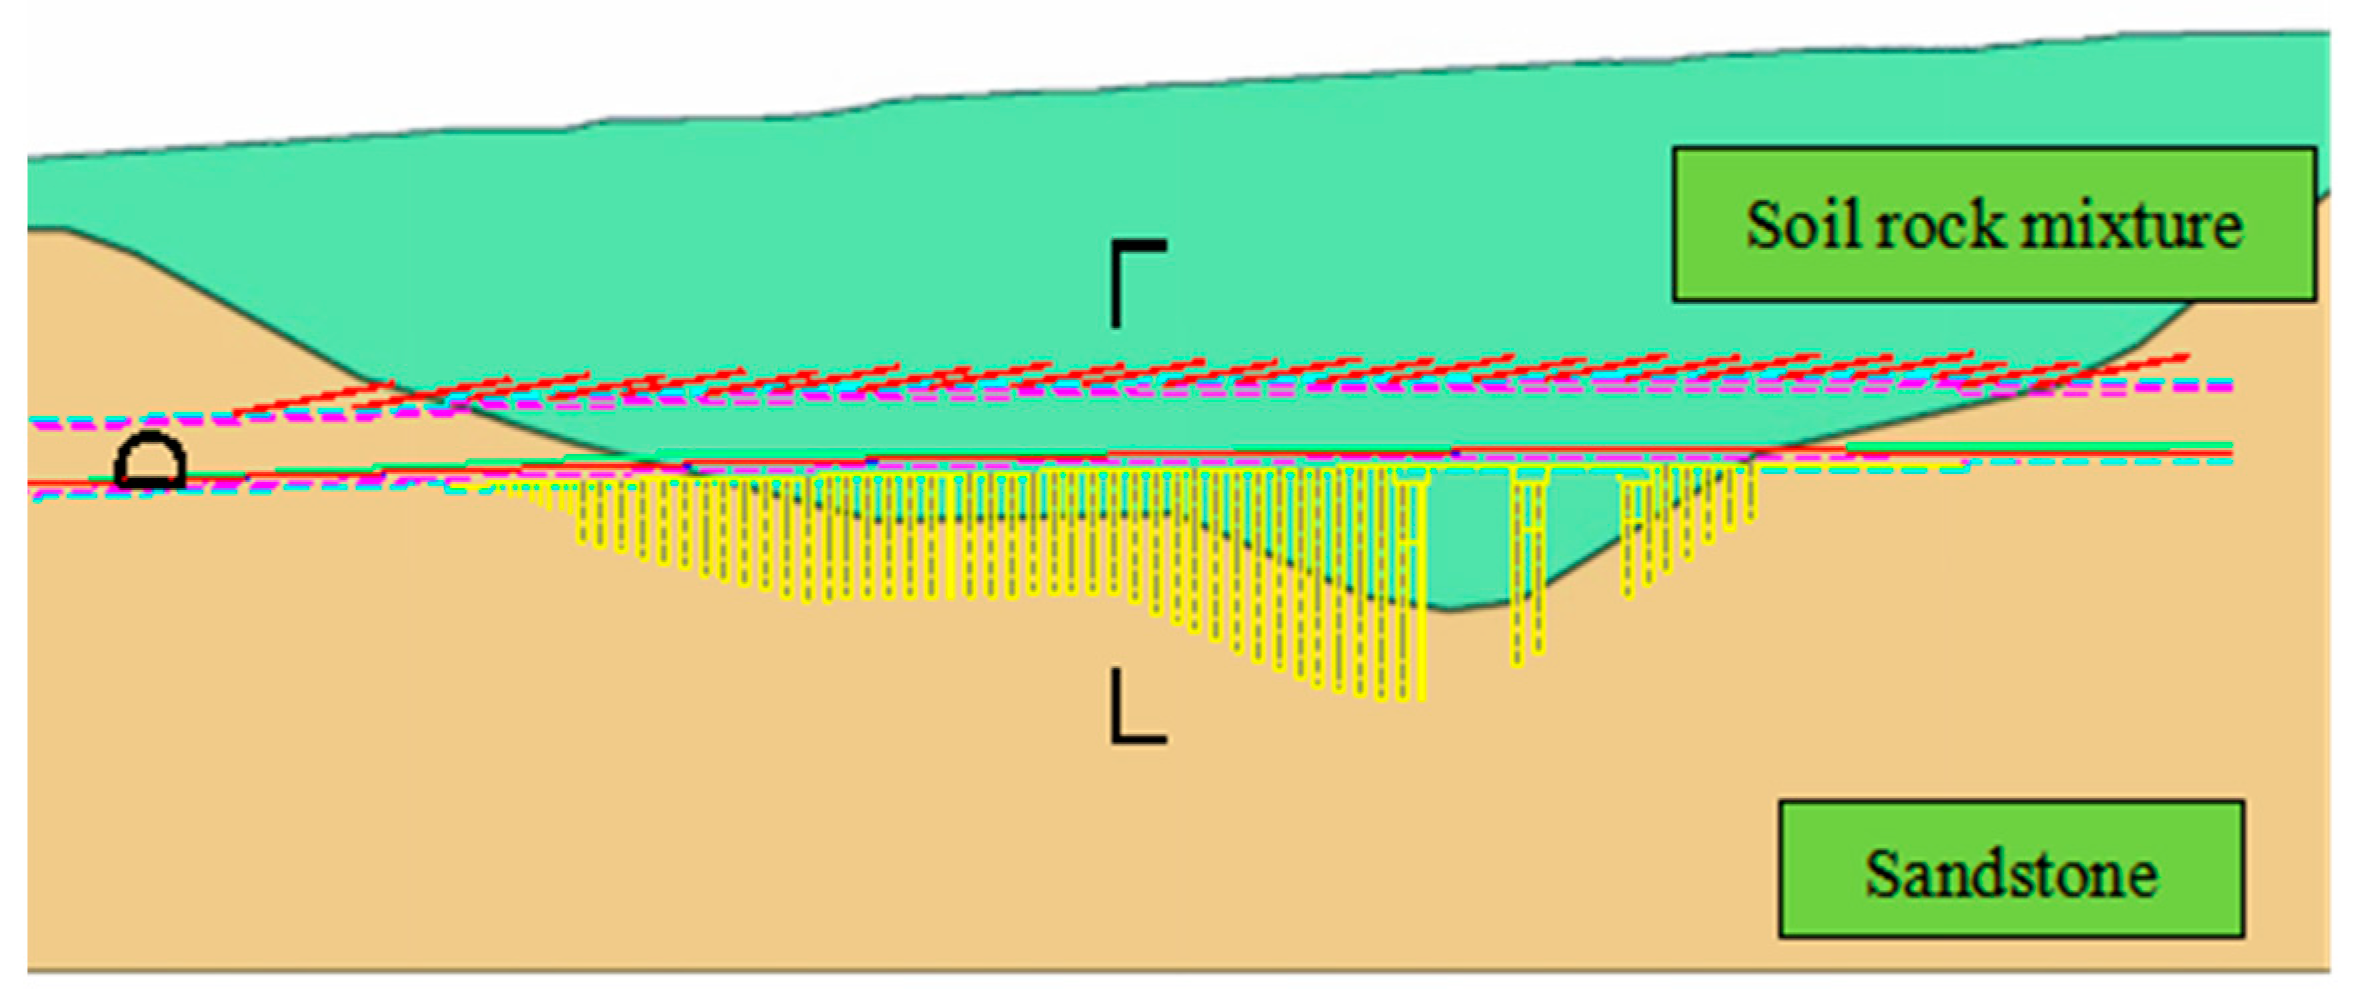
2. Project Overview
2.1. Research Site
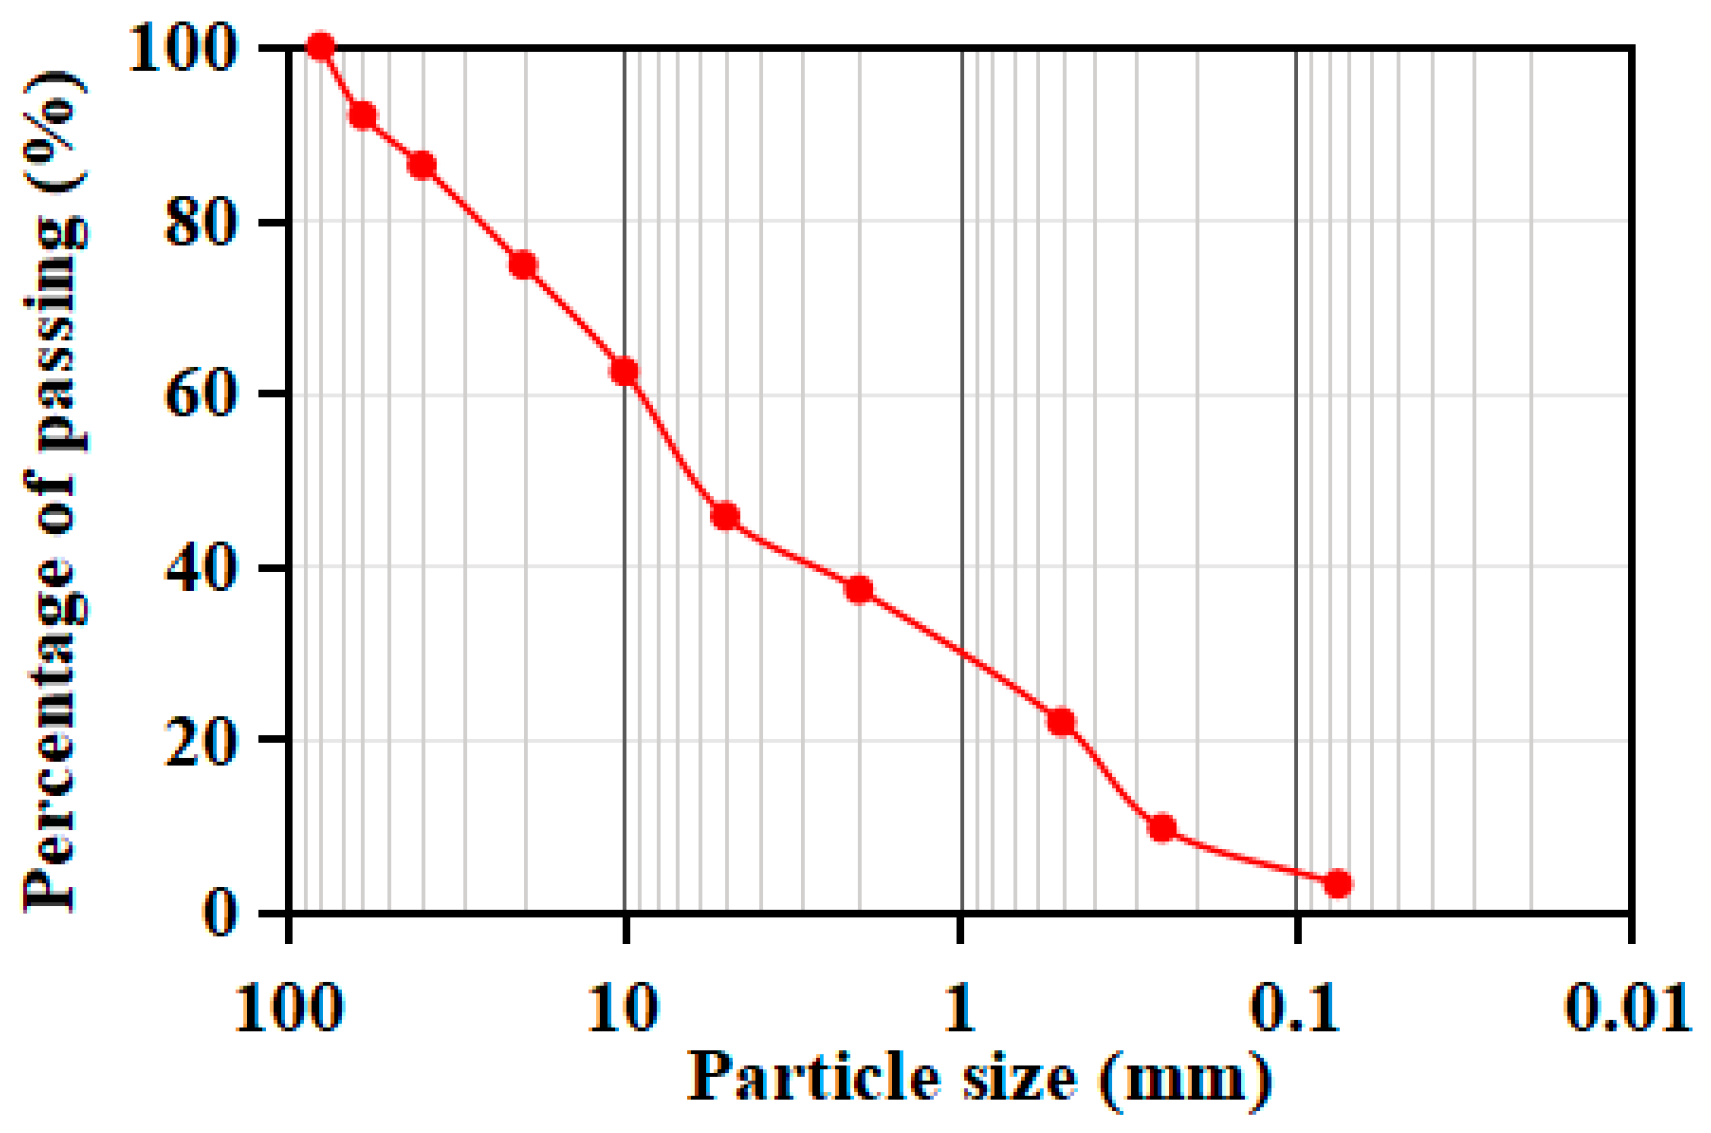
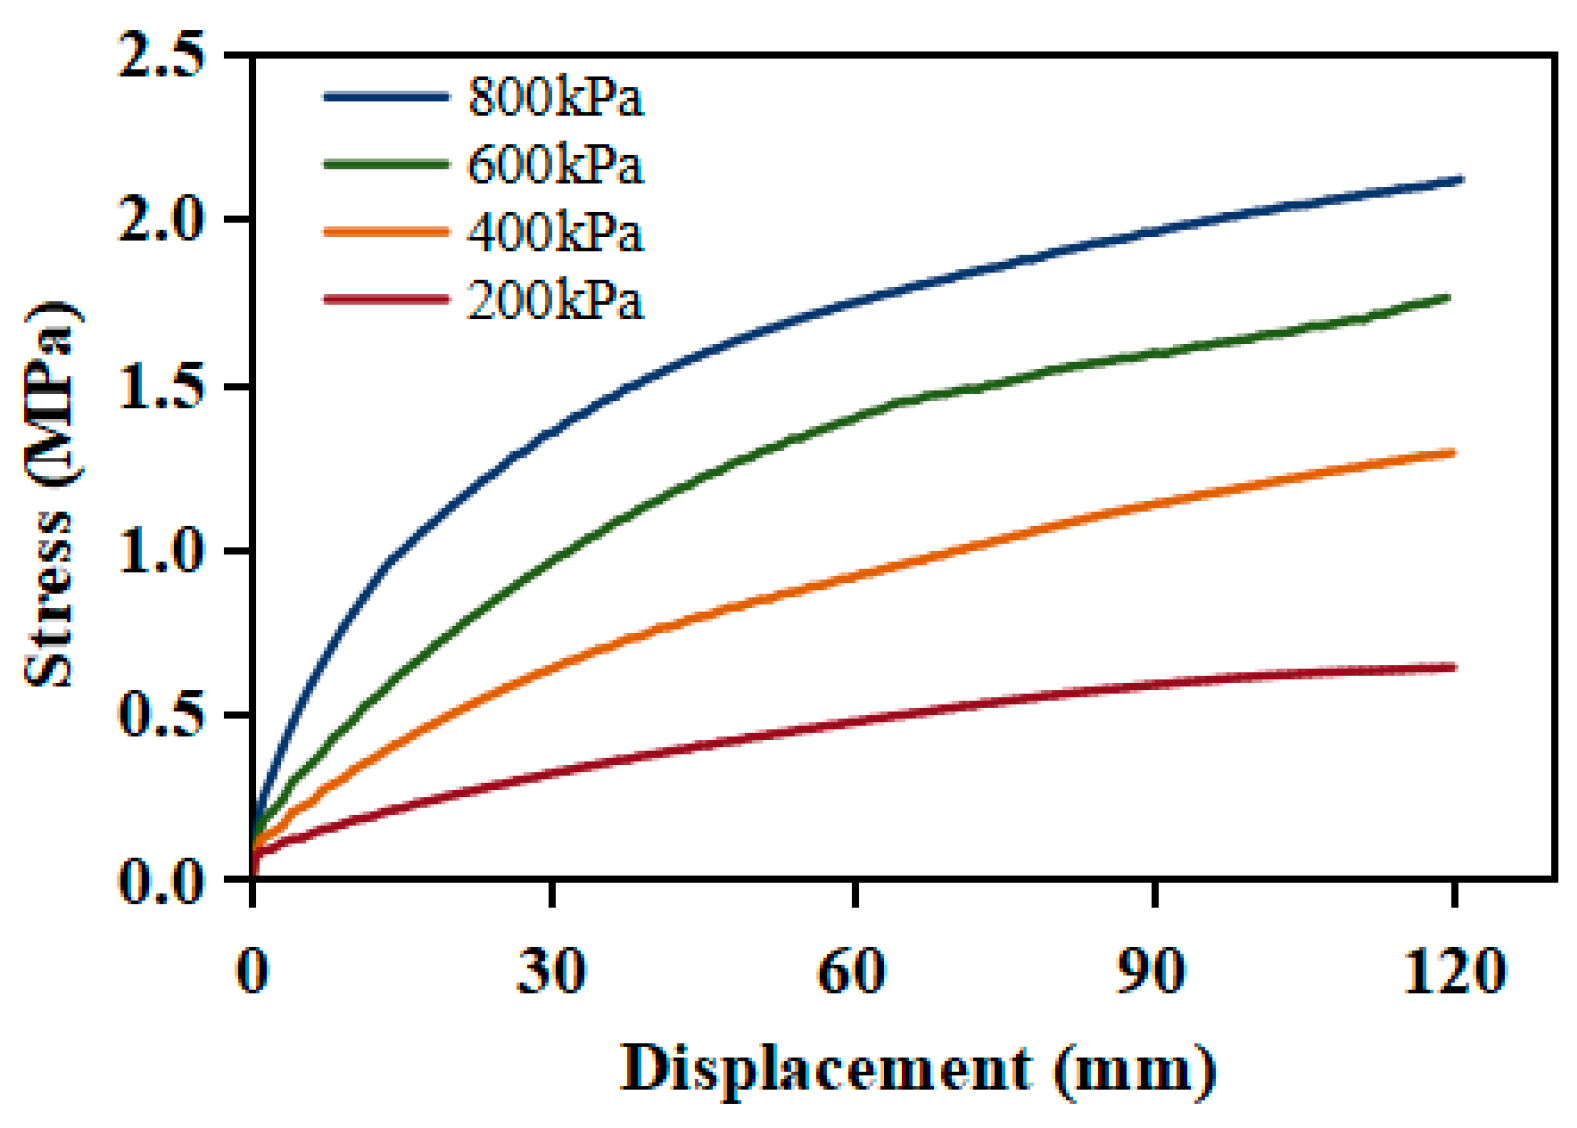
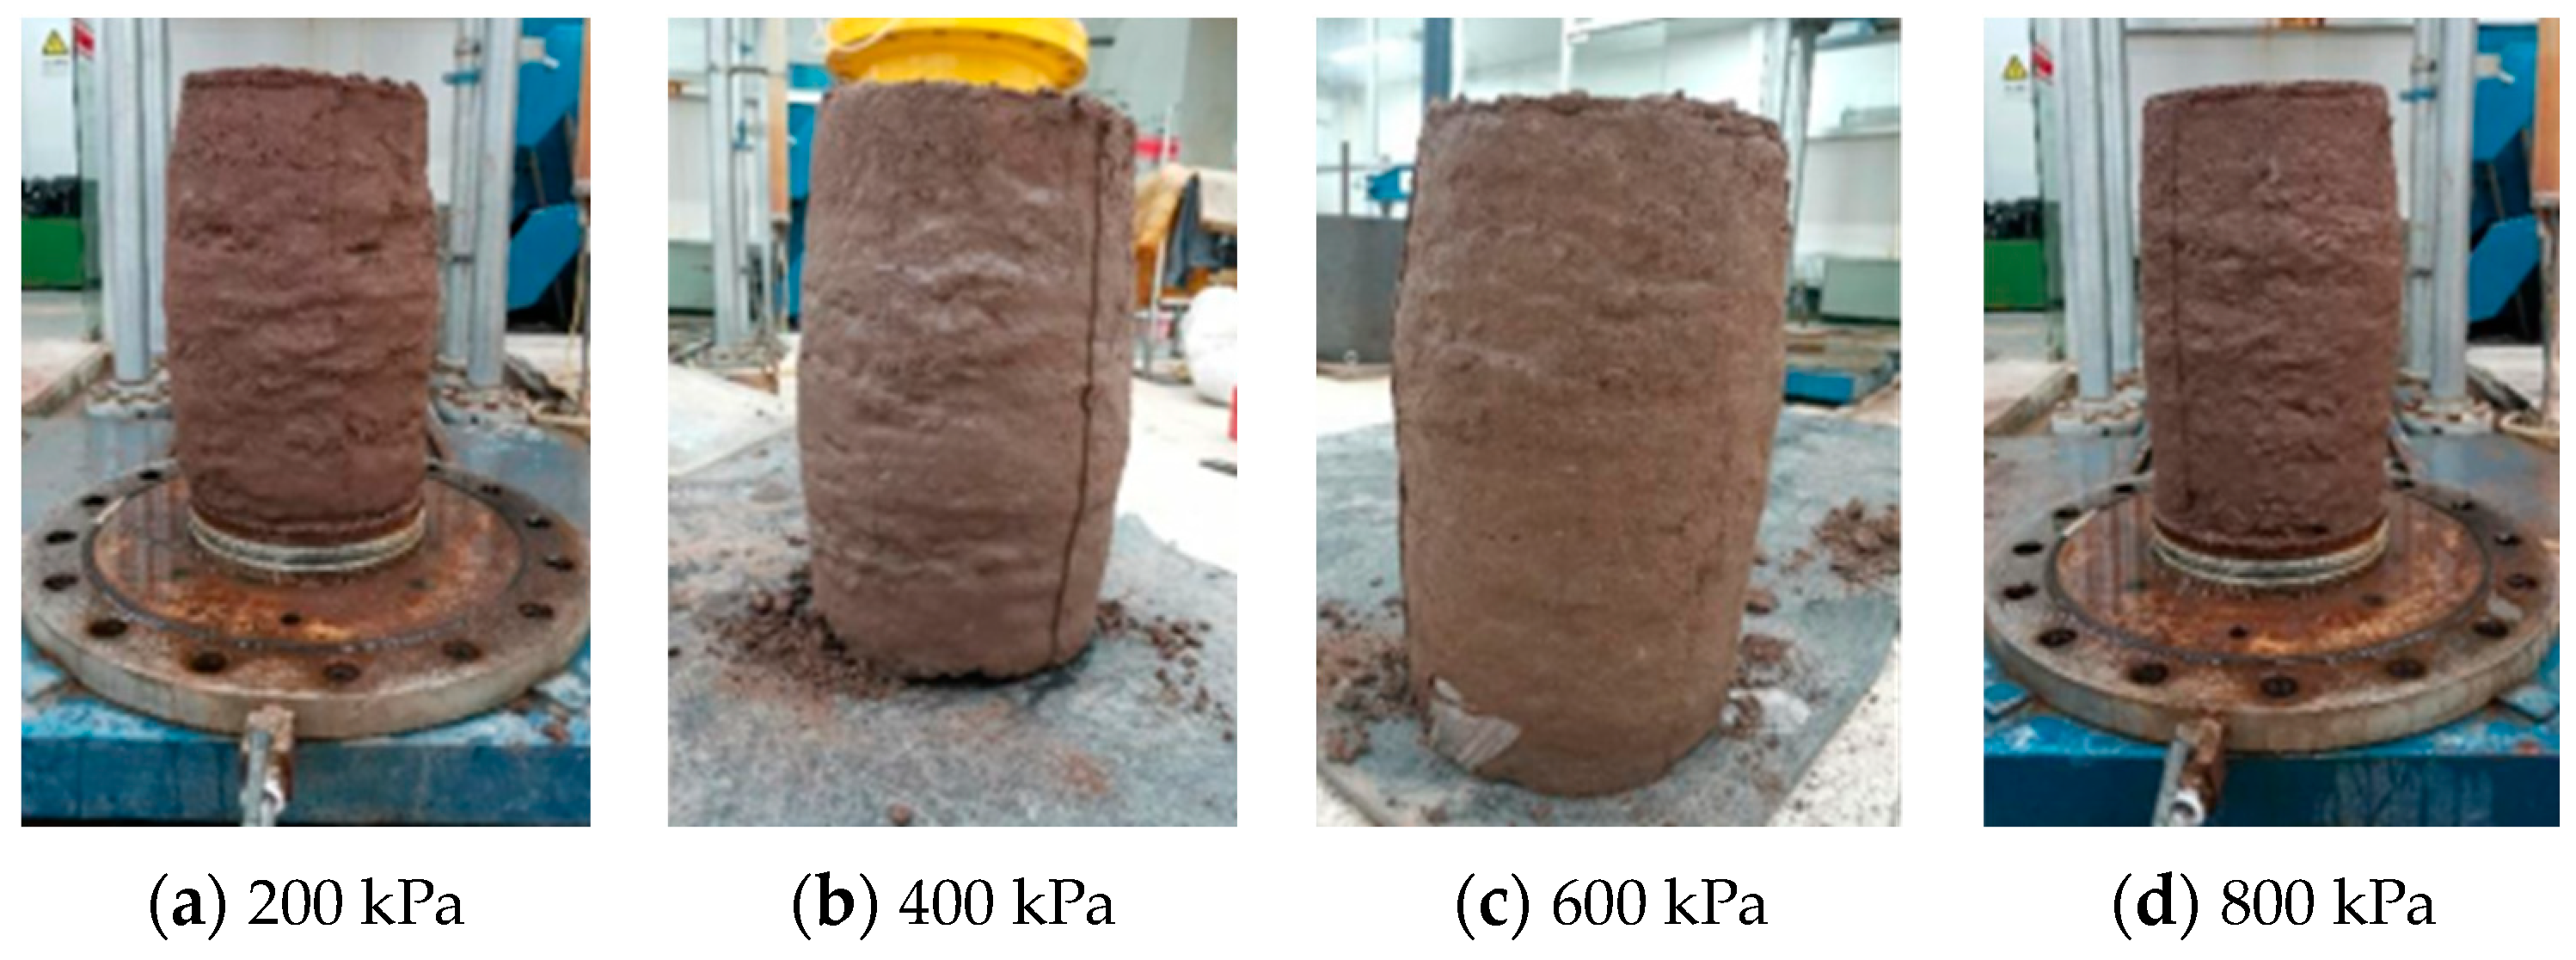
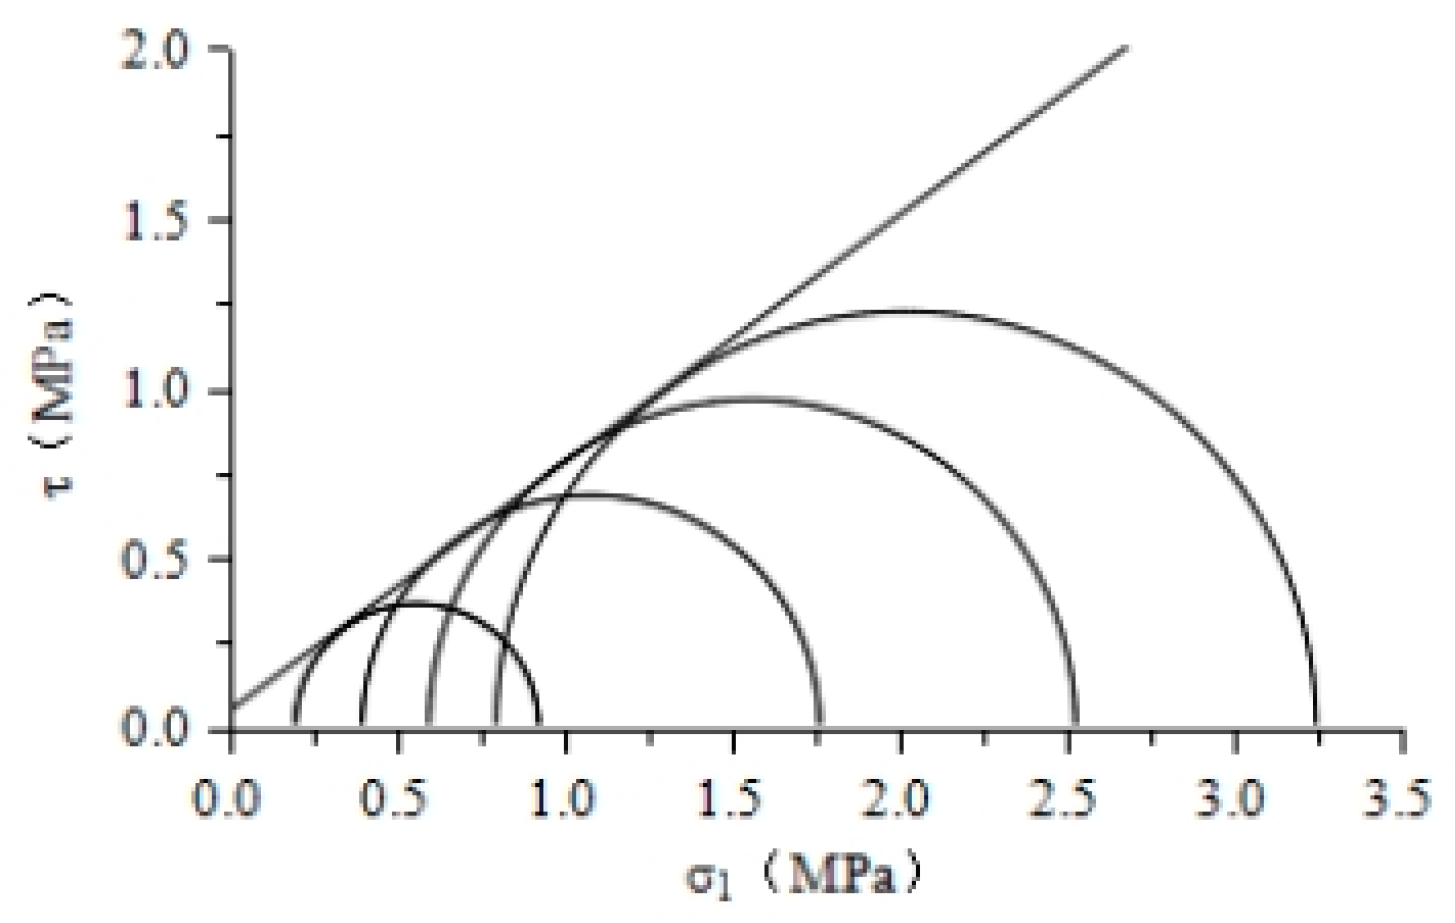
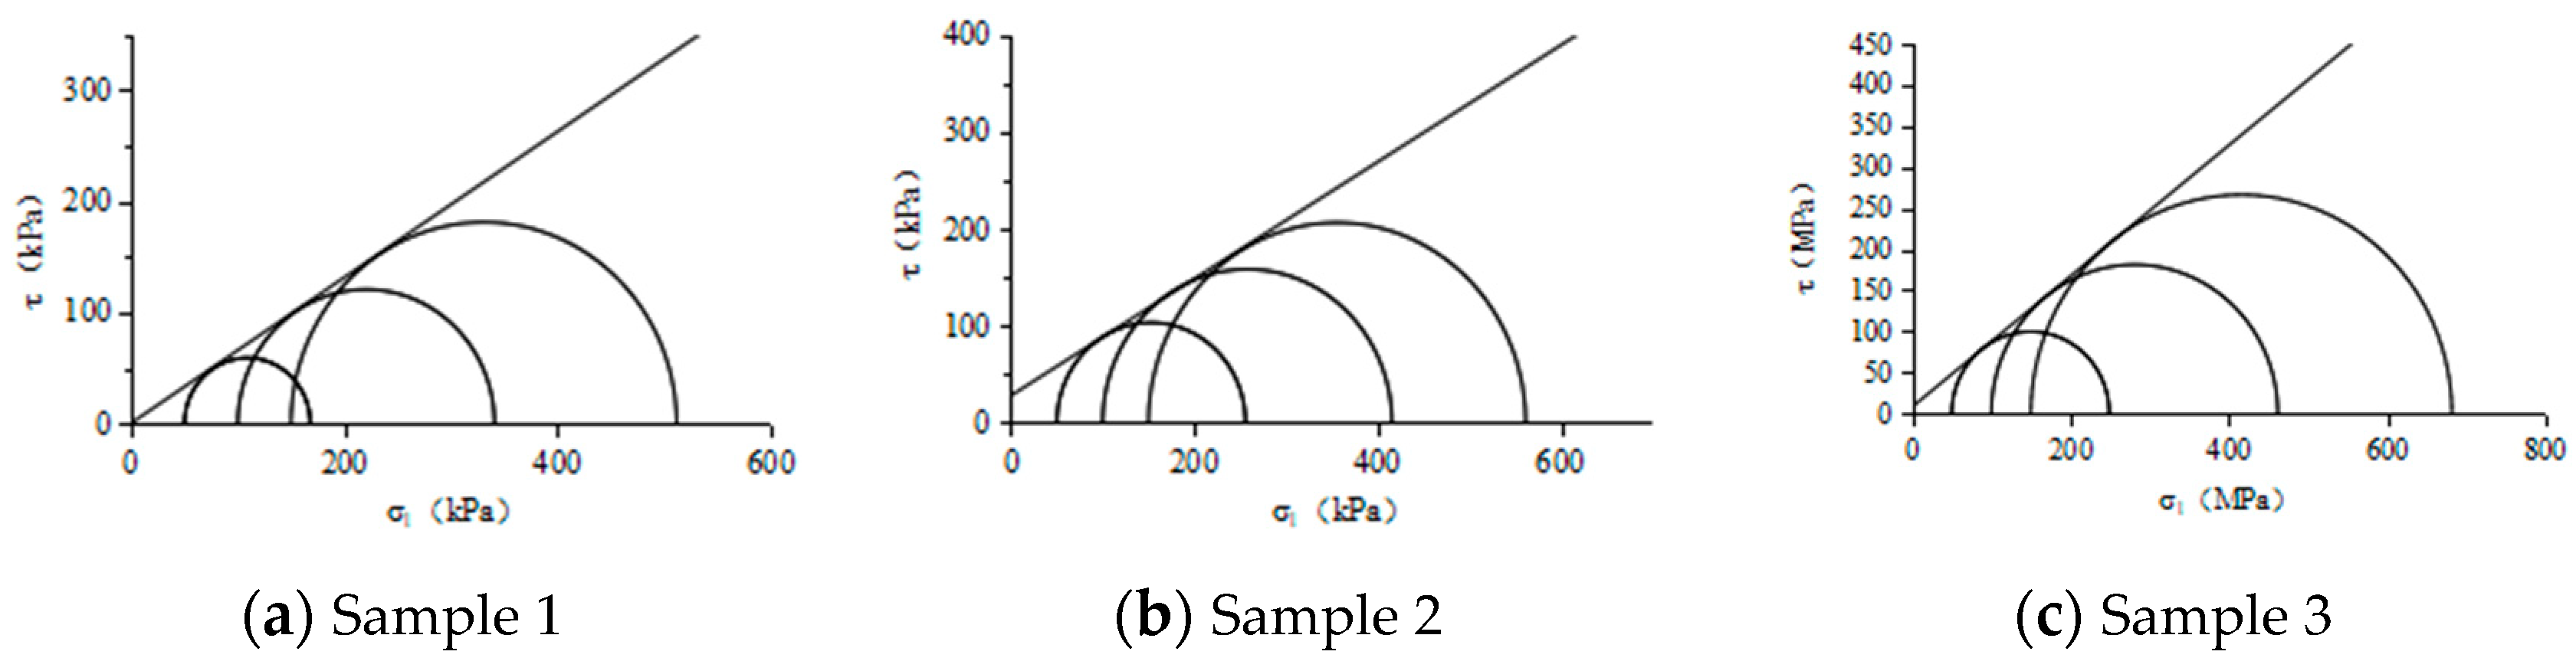
2.2. Properties of Soil–Rock Mixture
3. Design of the Model Test
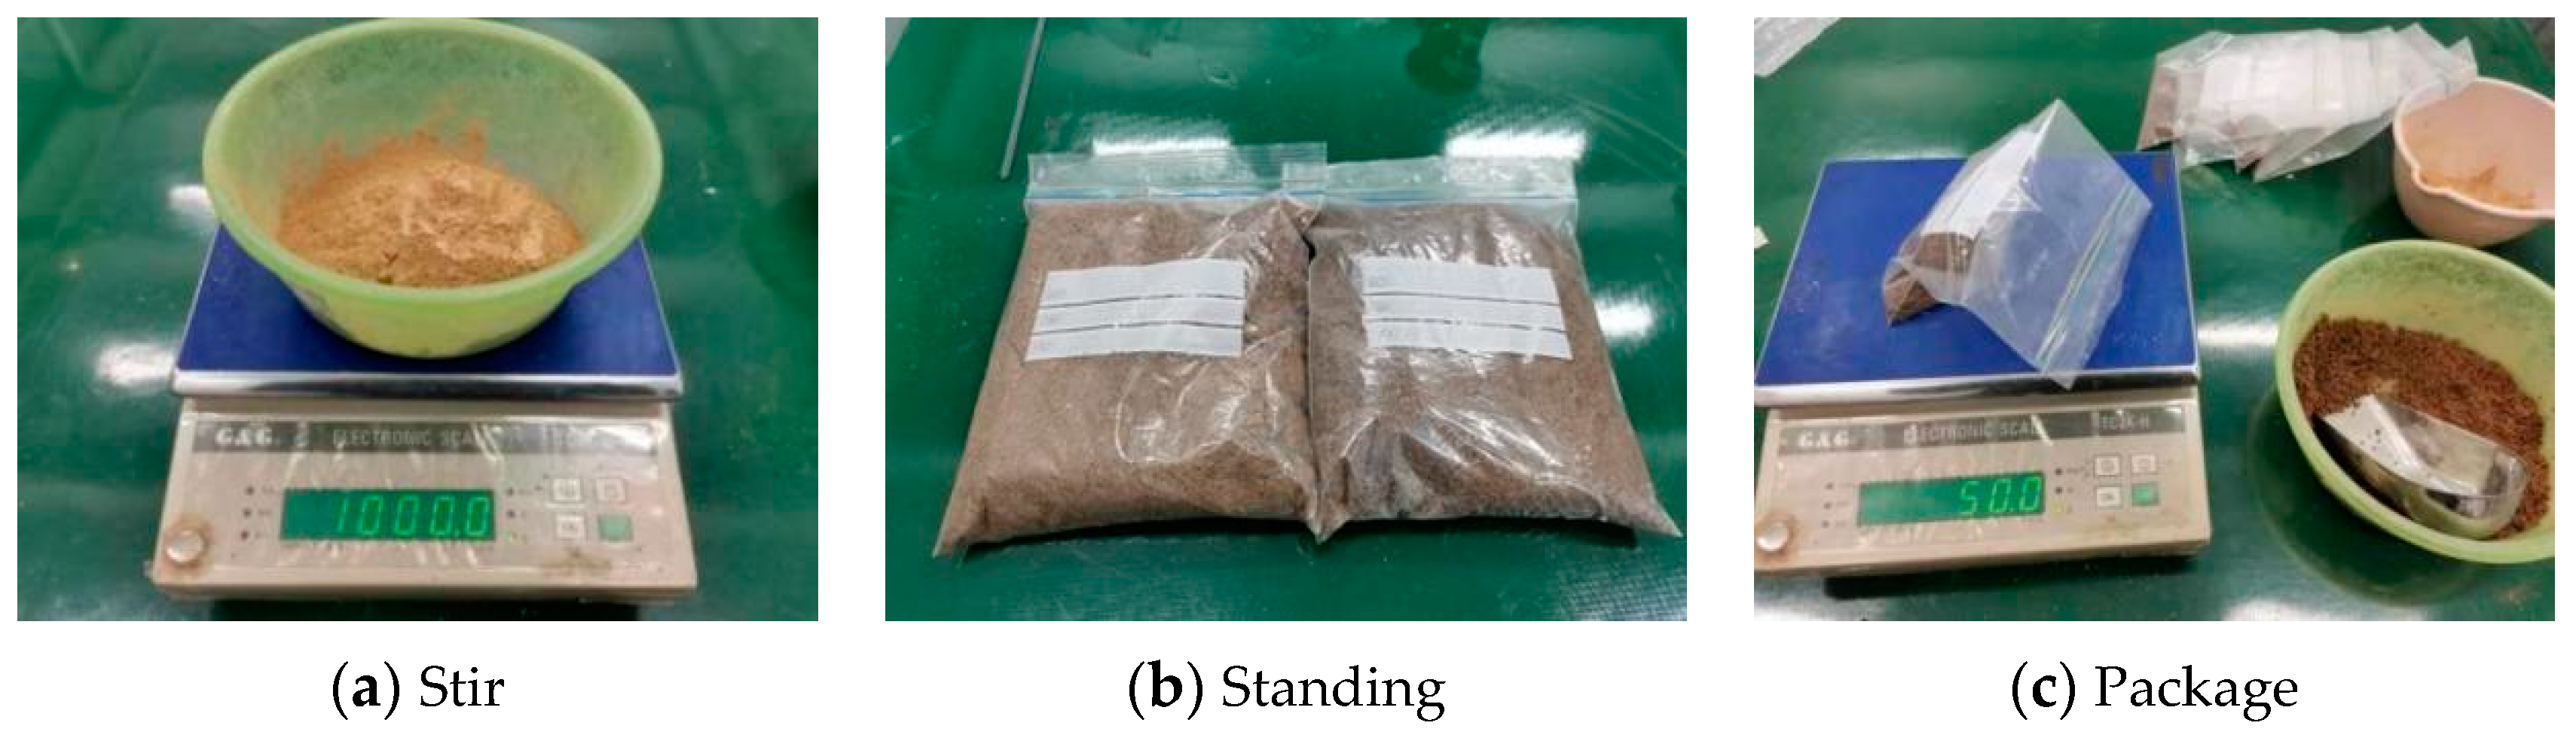
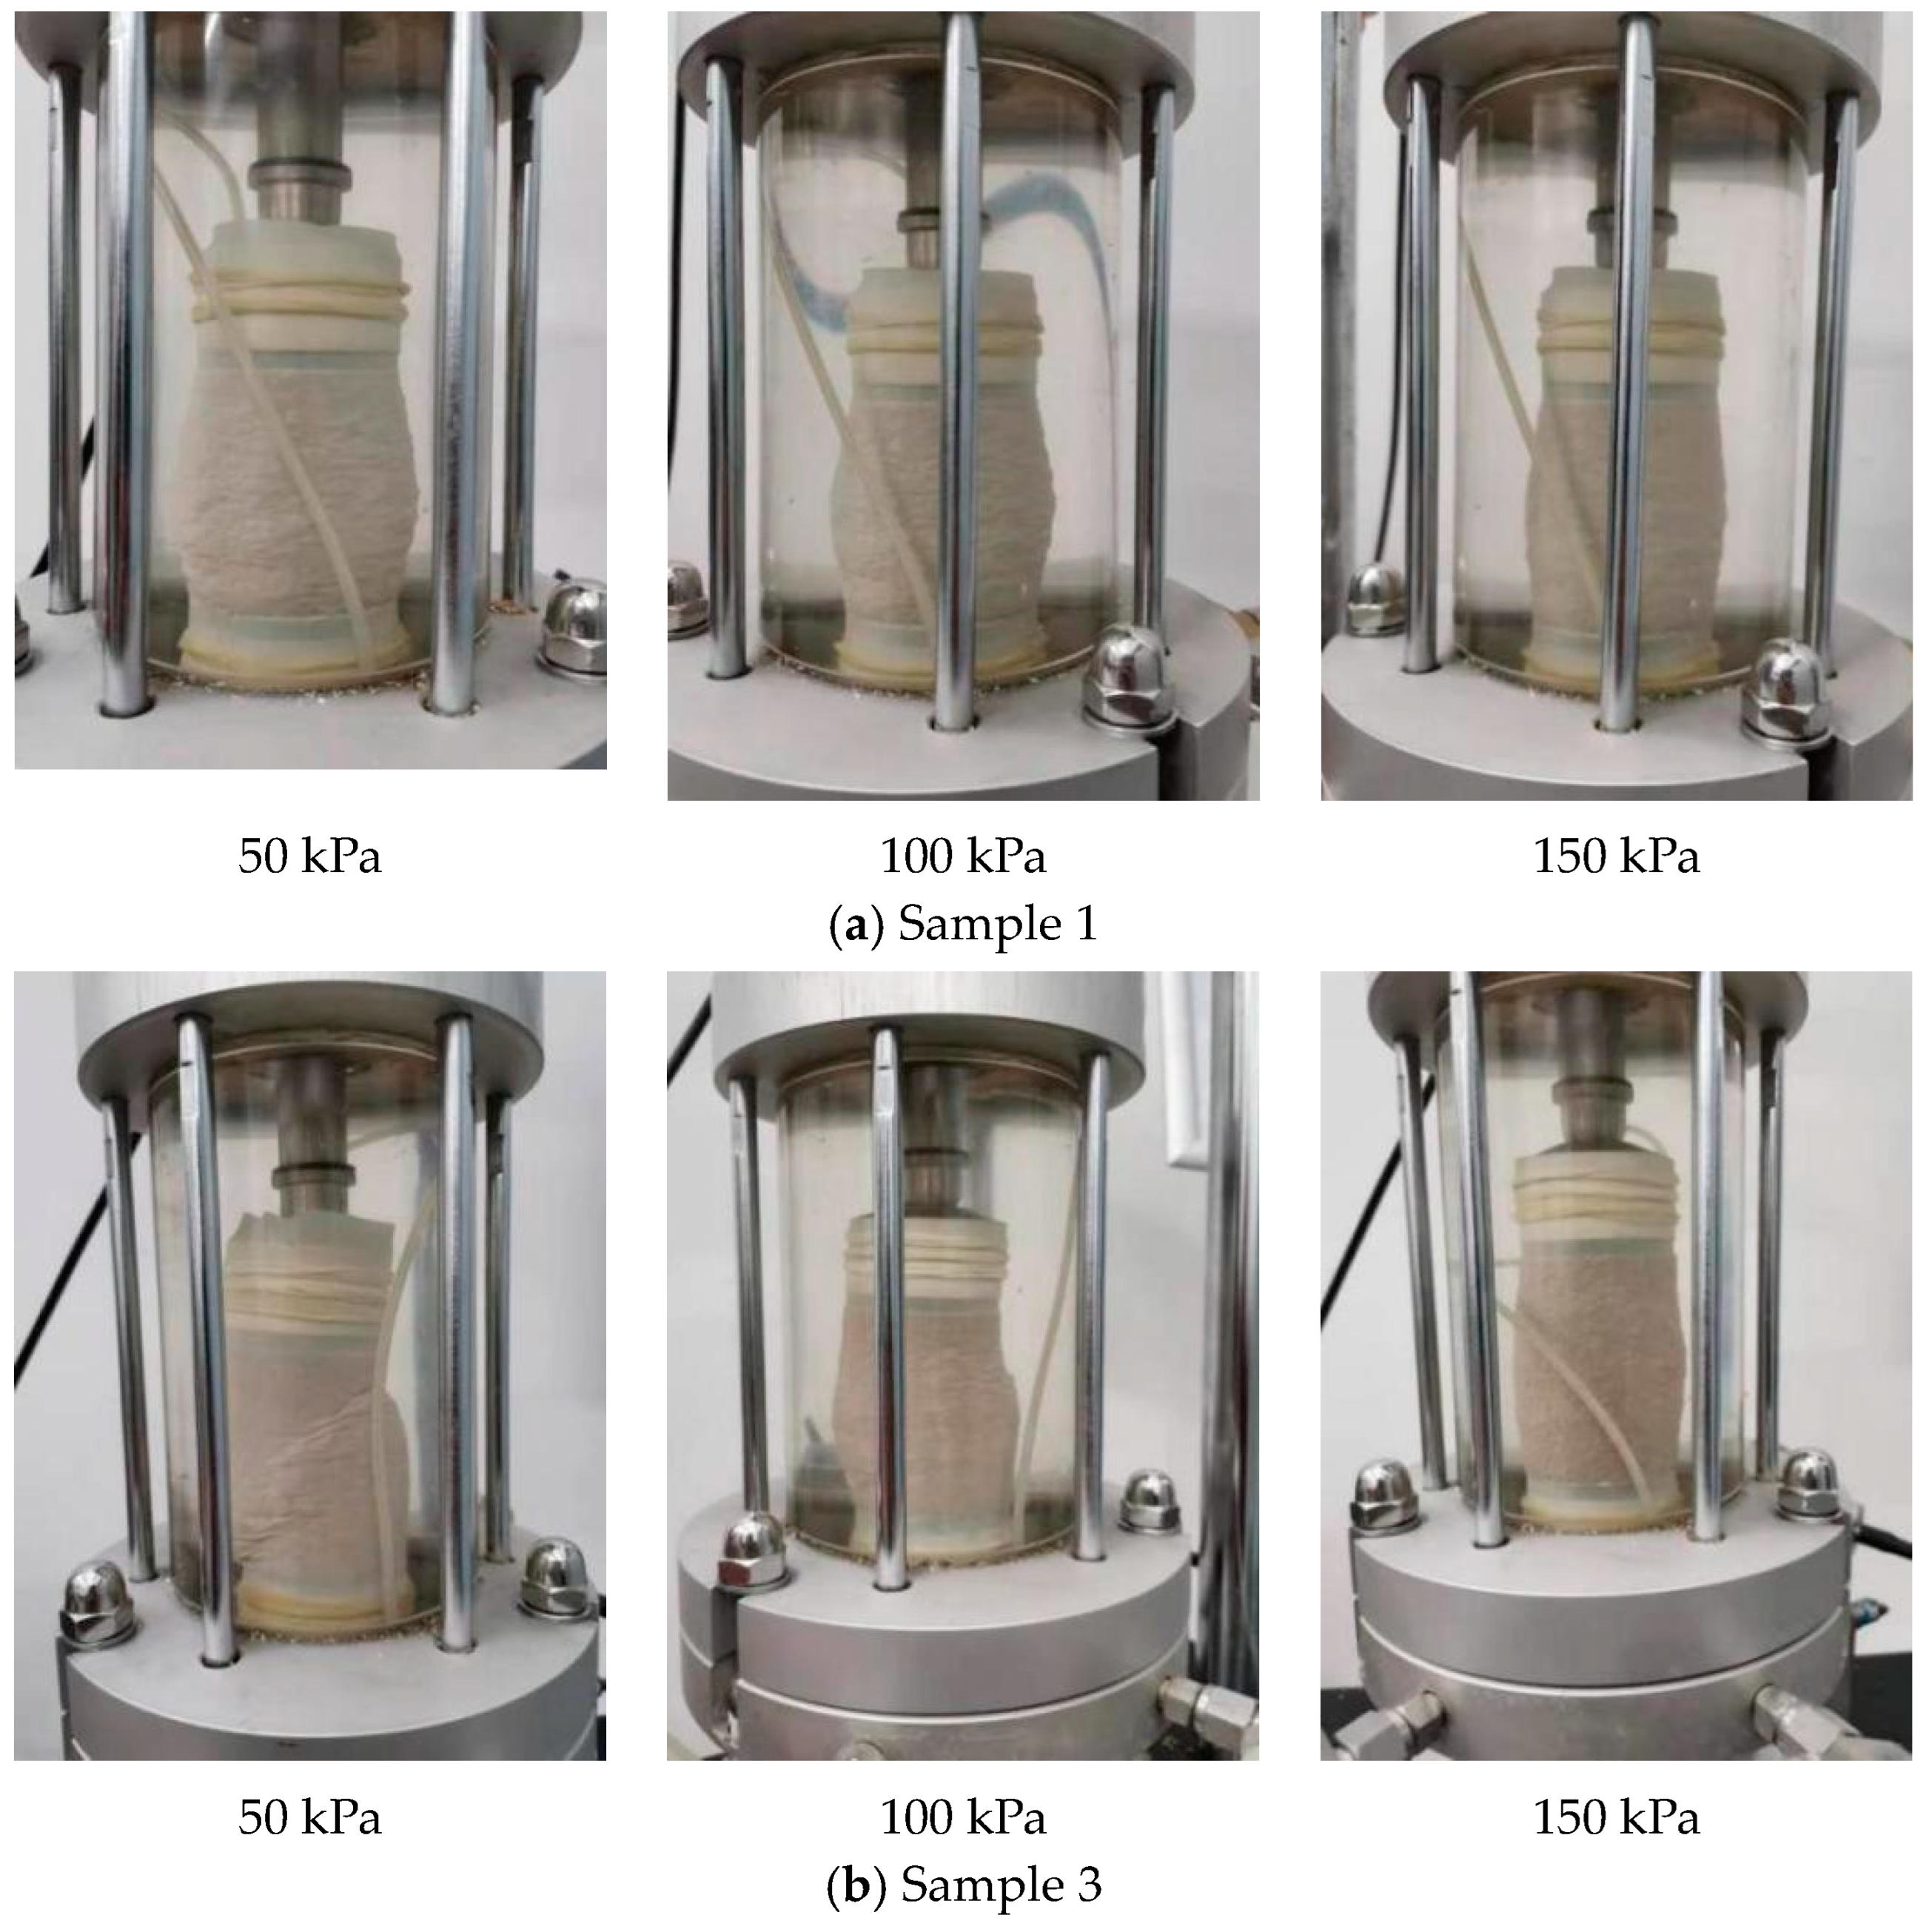
3.1. Similar Materials
- (1)
- Soil–rock mixture and grouting mixture
- (2)
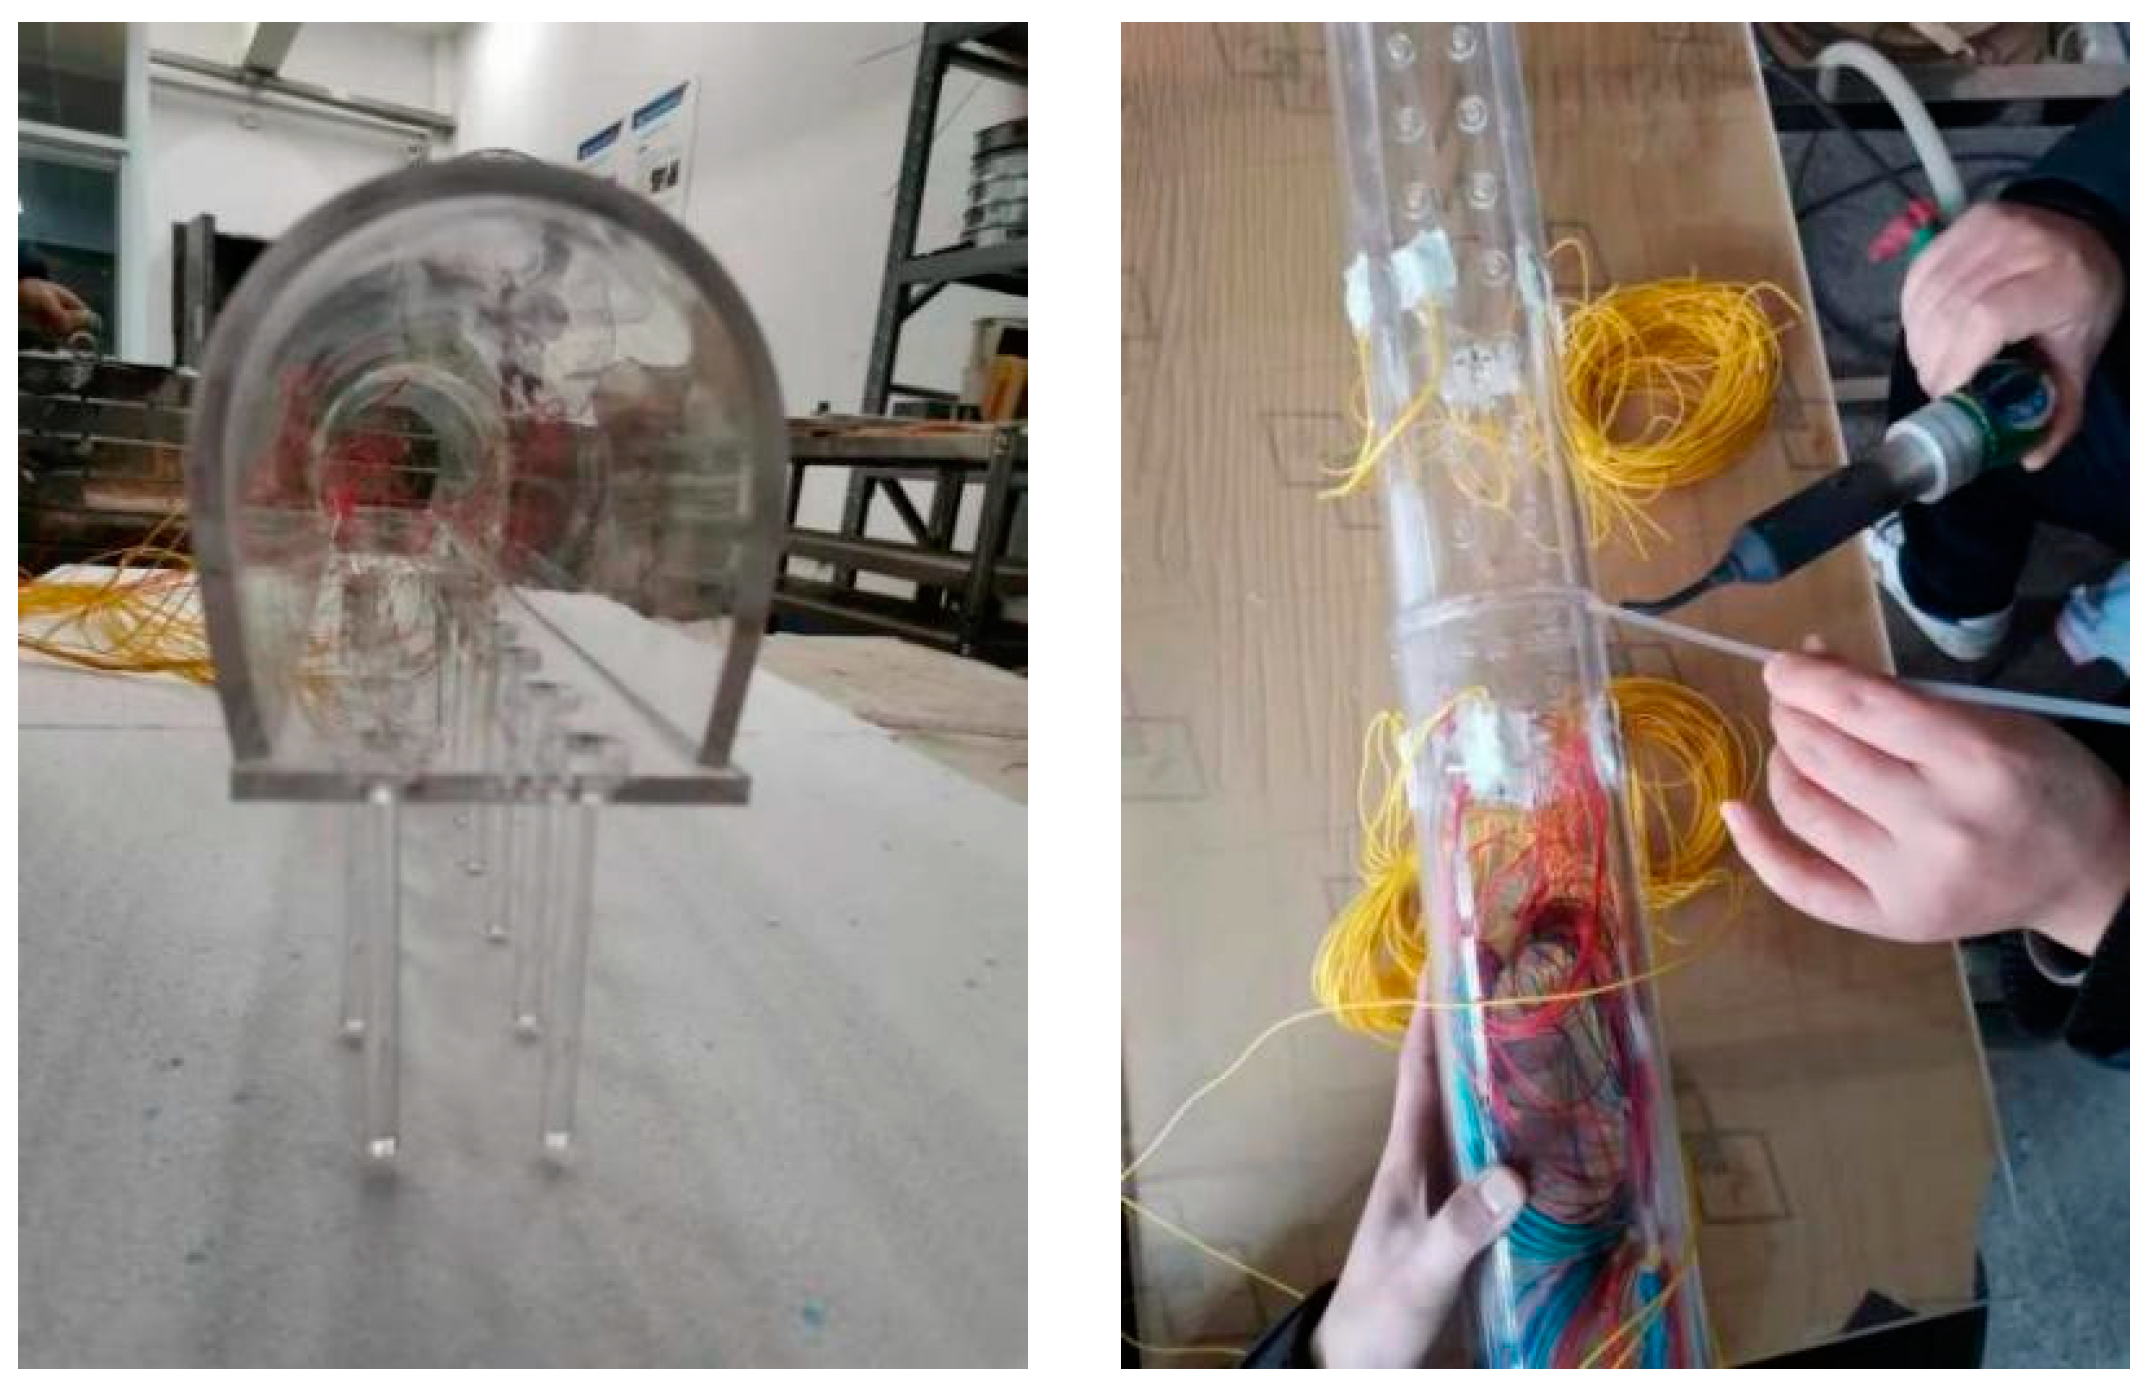
- Lining and pile foundation
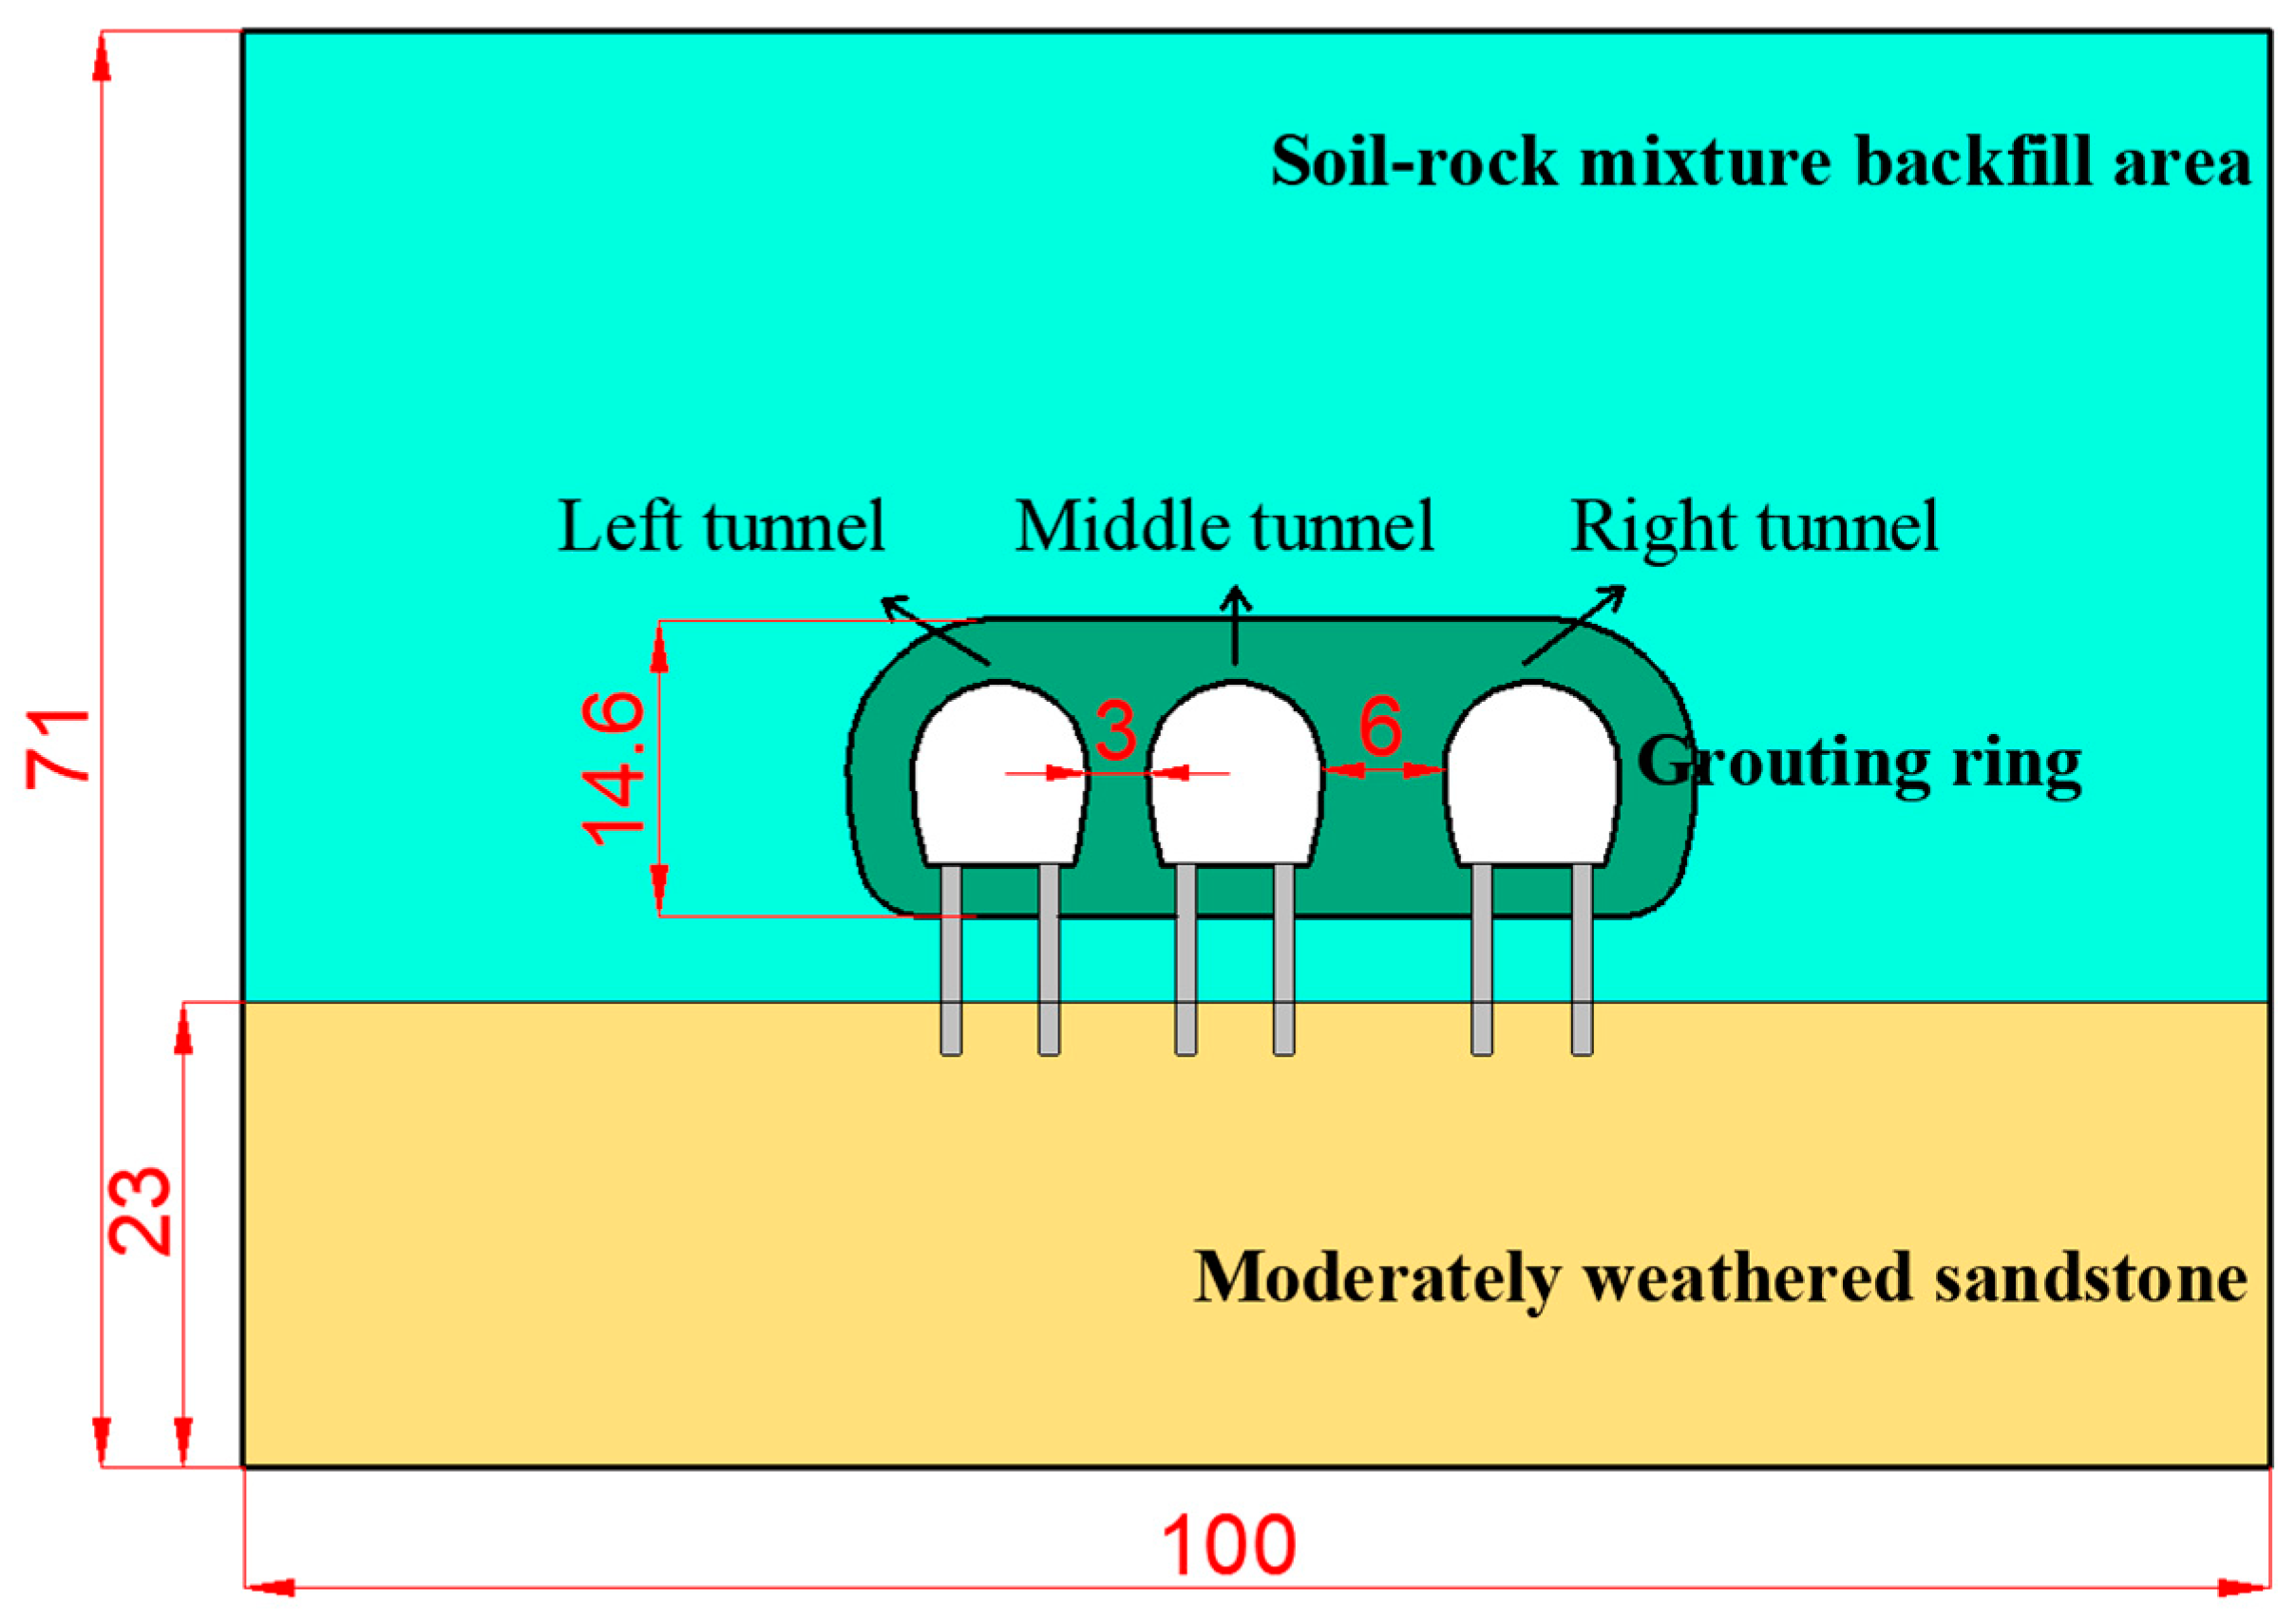
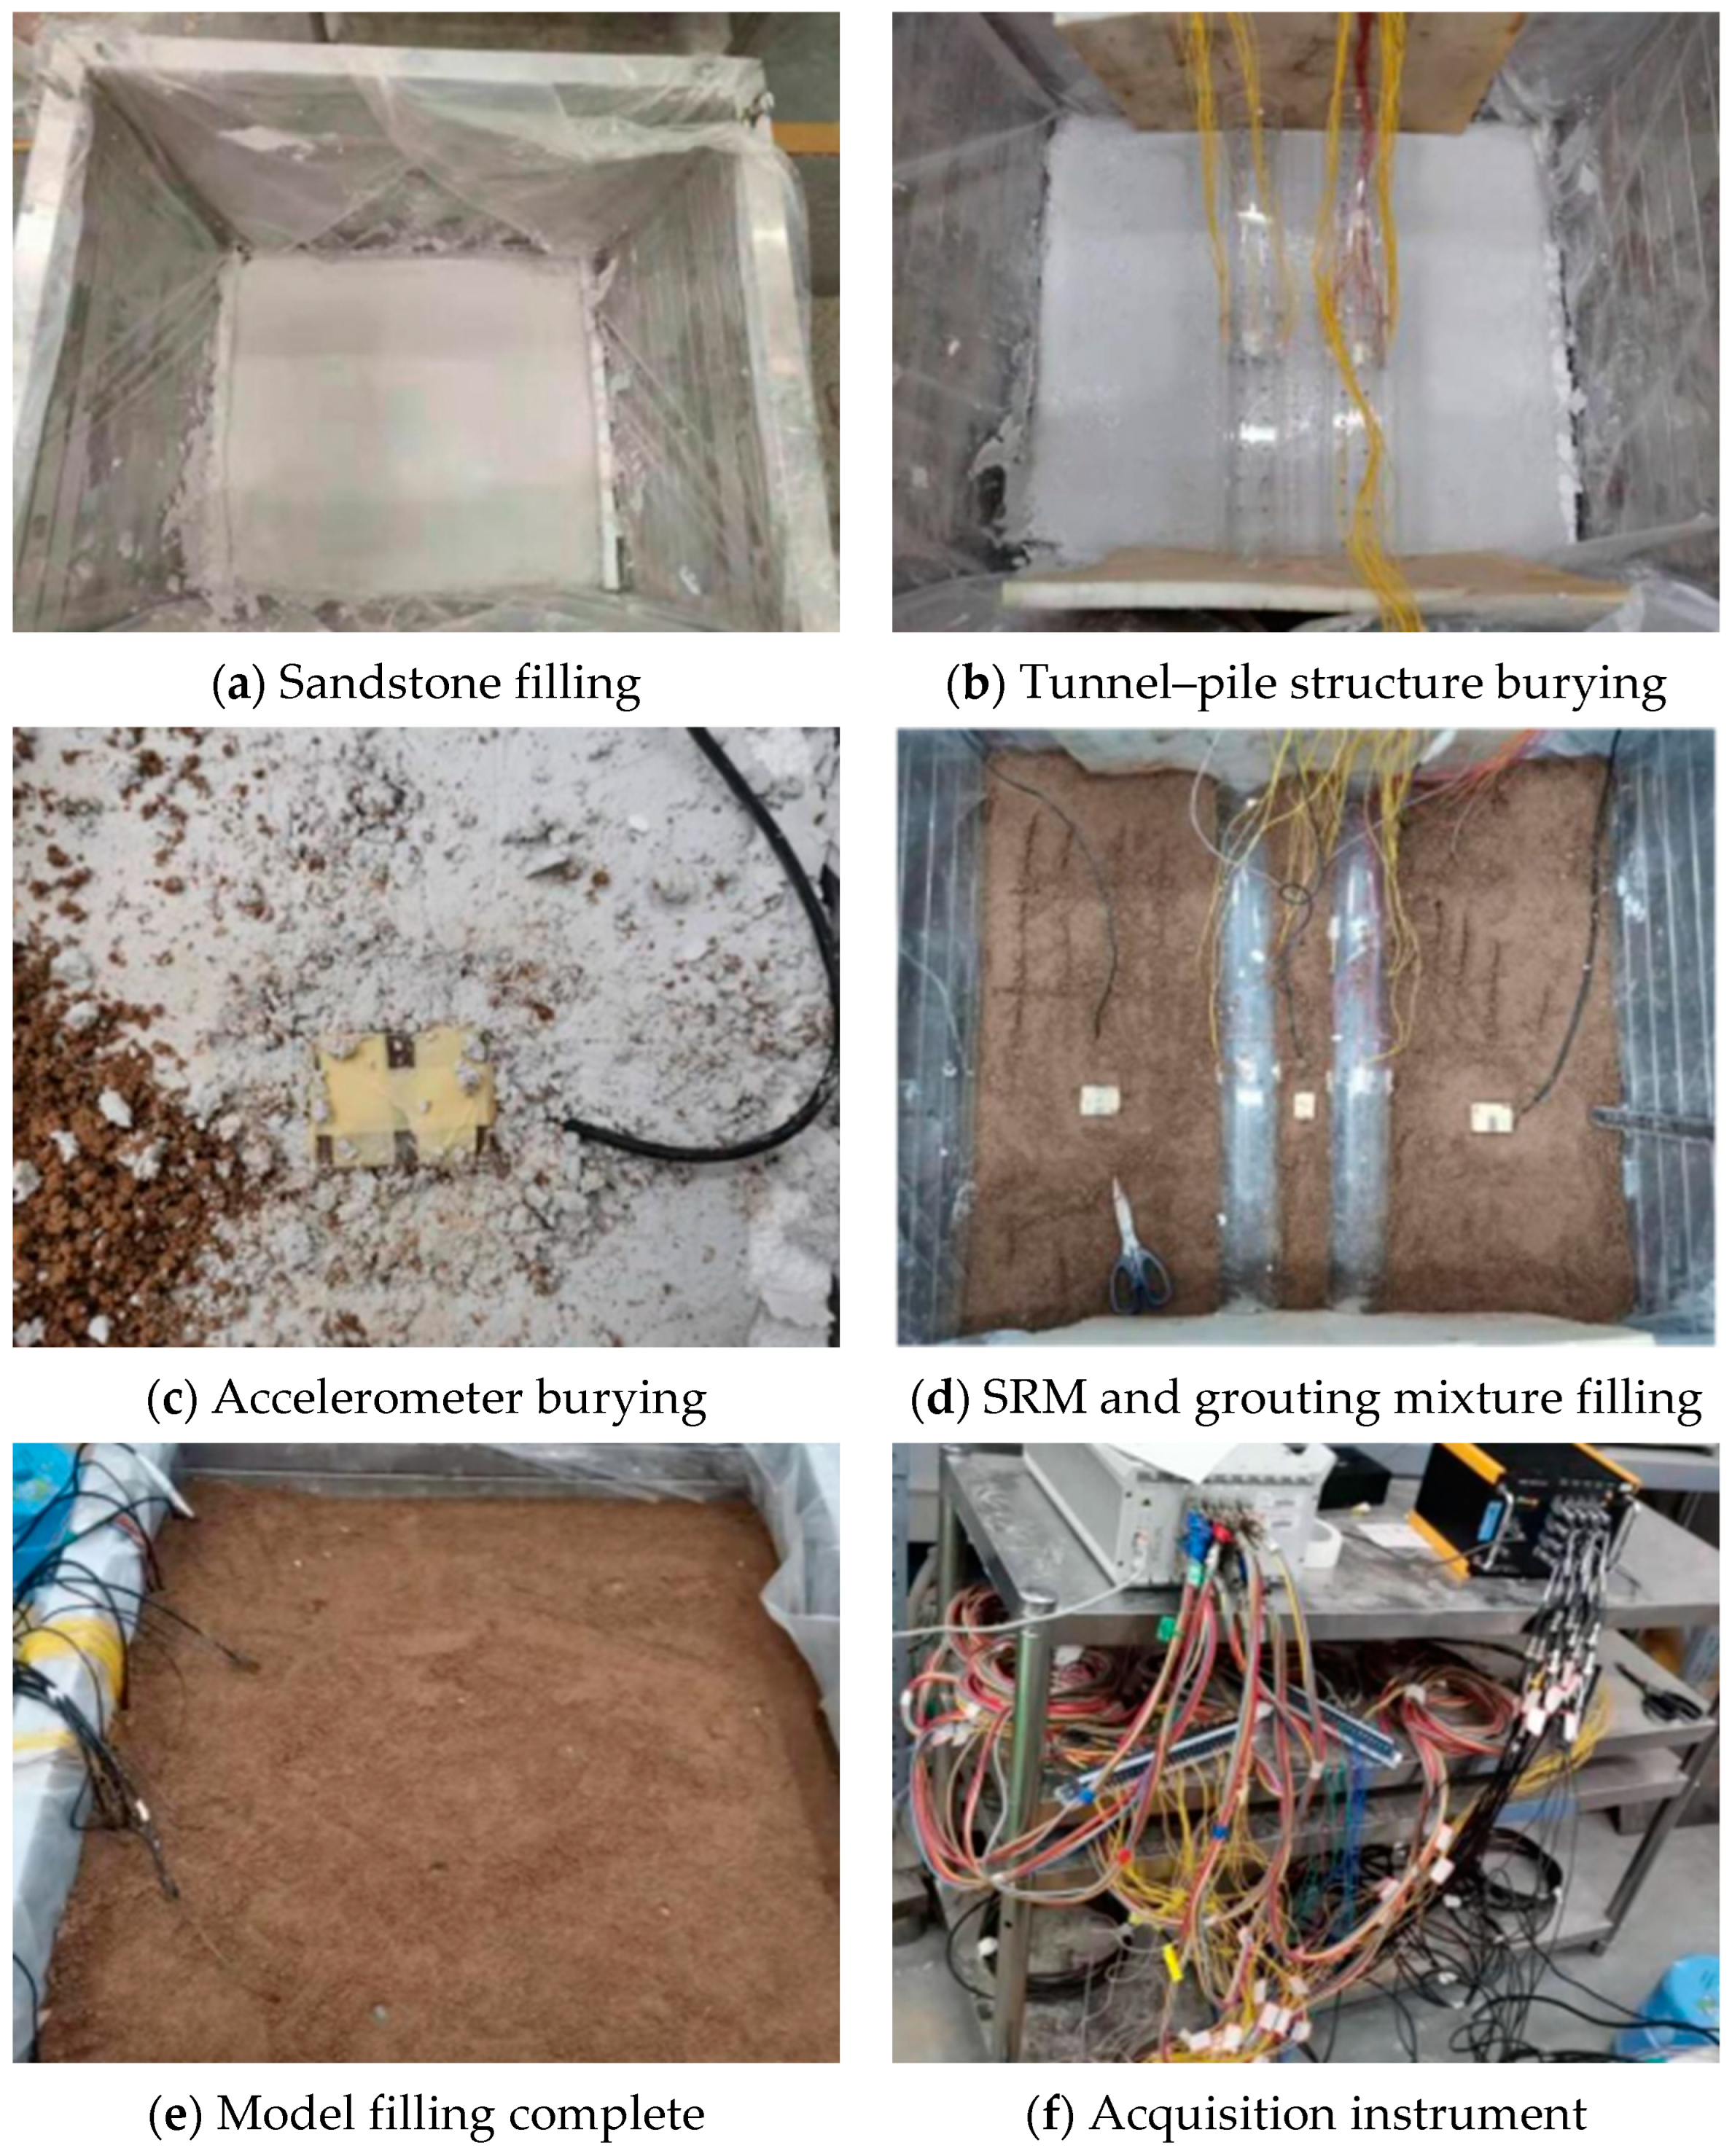
3.2. Test Scheme
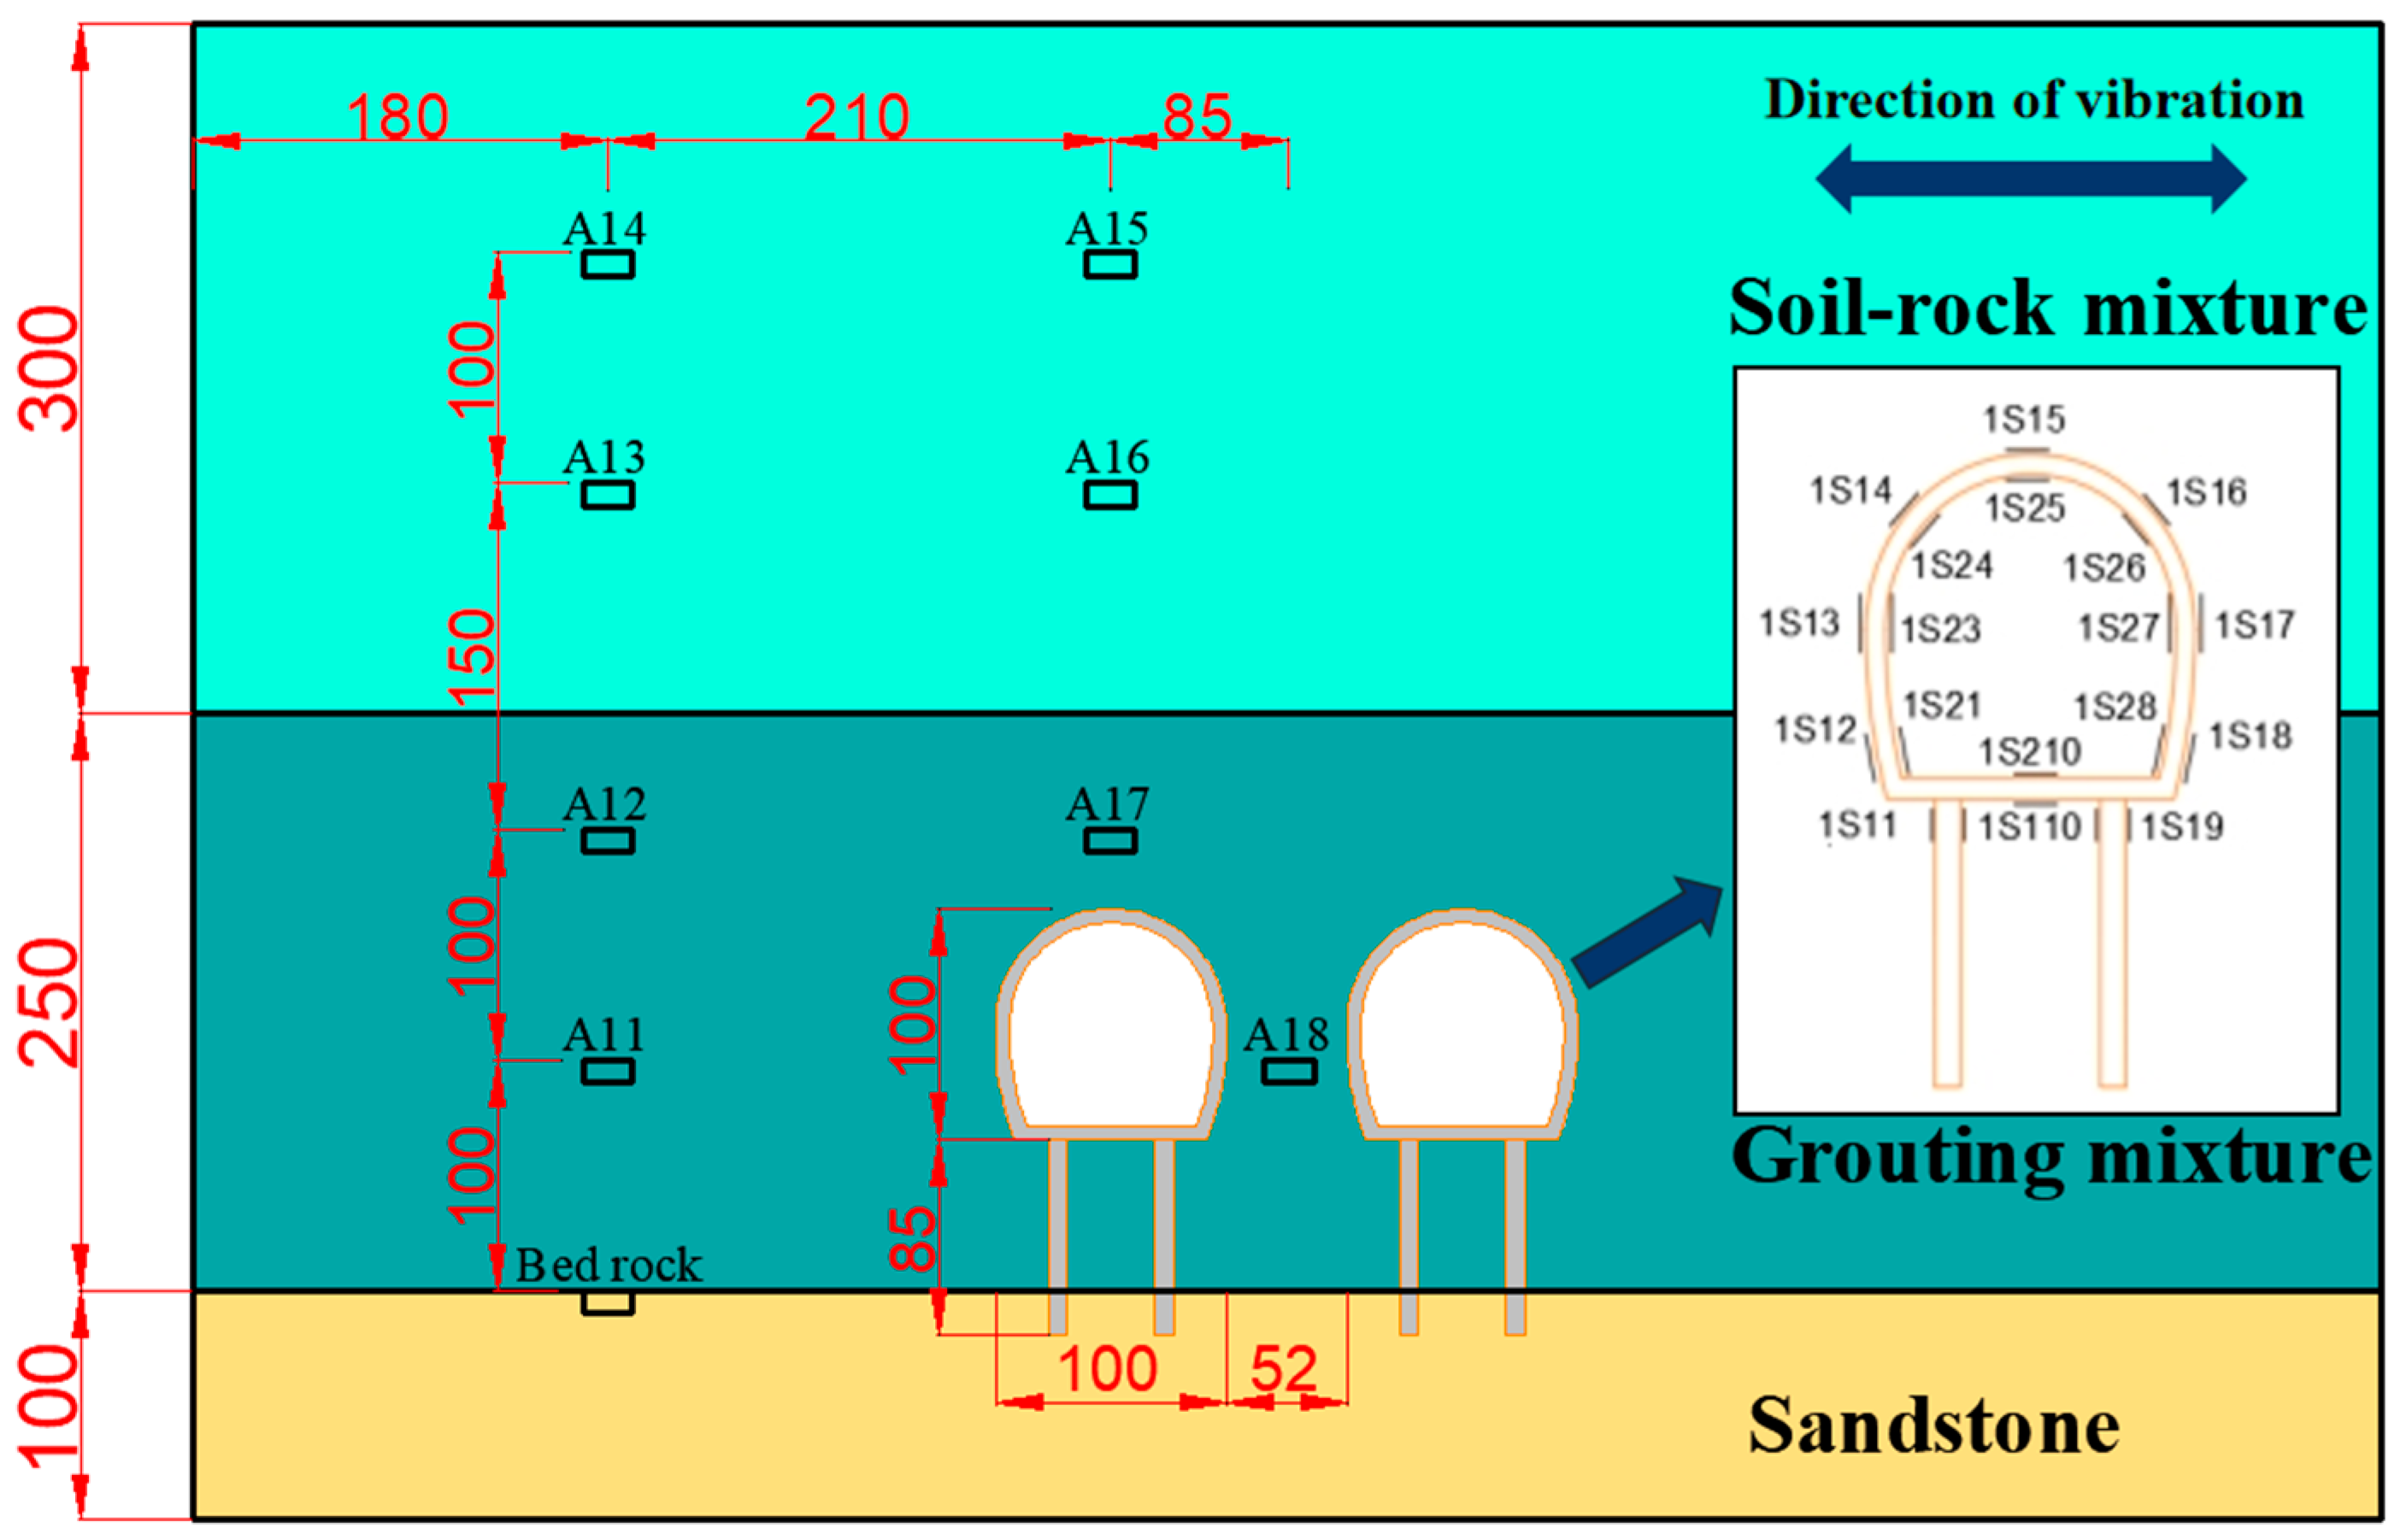
- (1)
- Model box design
- (2)
- Sensor arrangement
- (3)
- Seismic wave selection
4. Analysis of Test Results
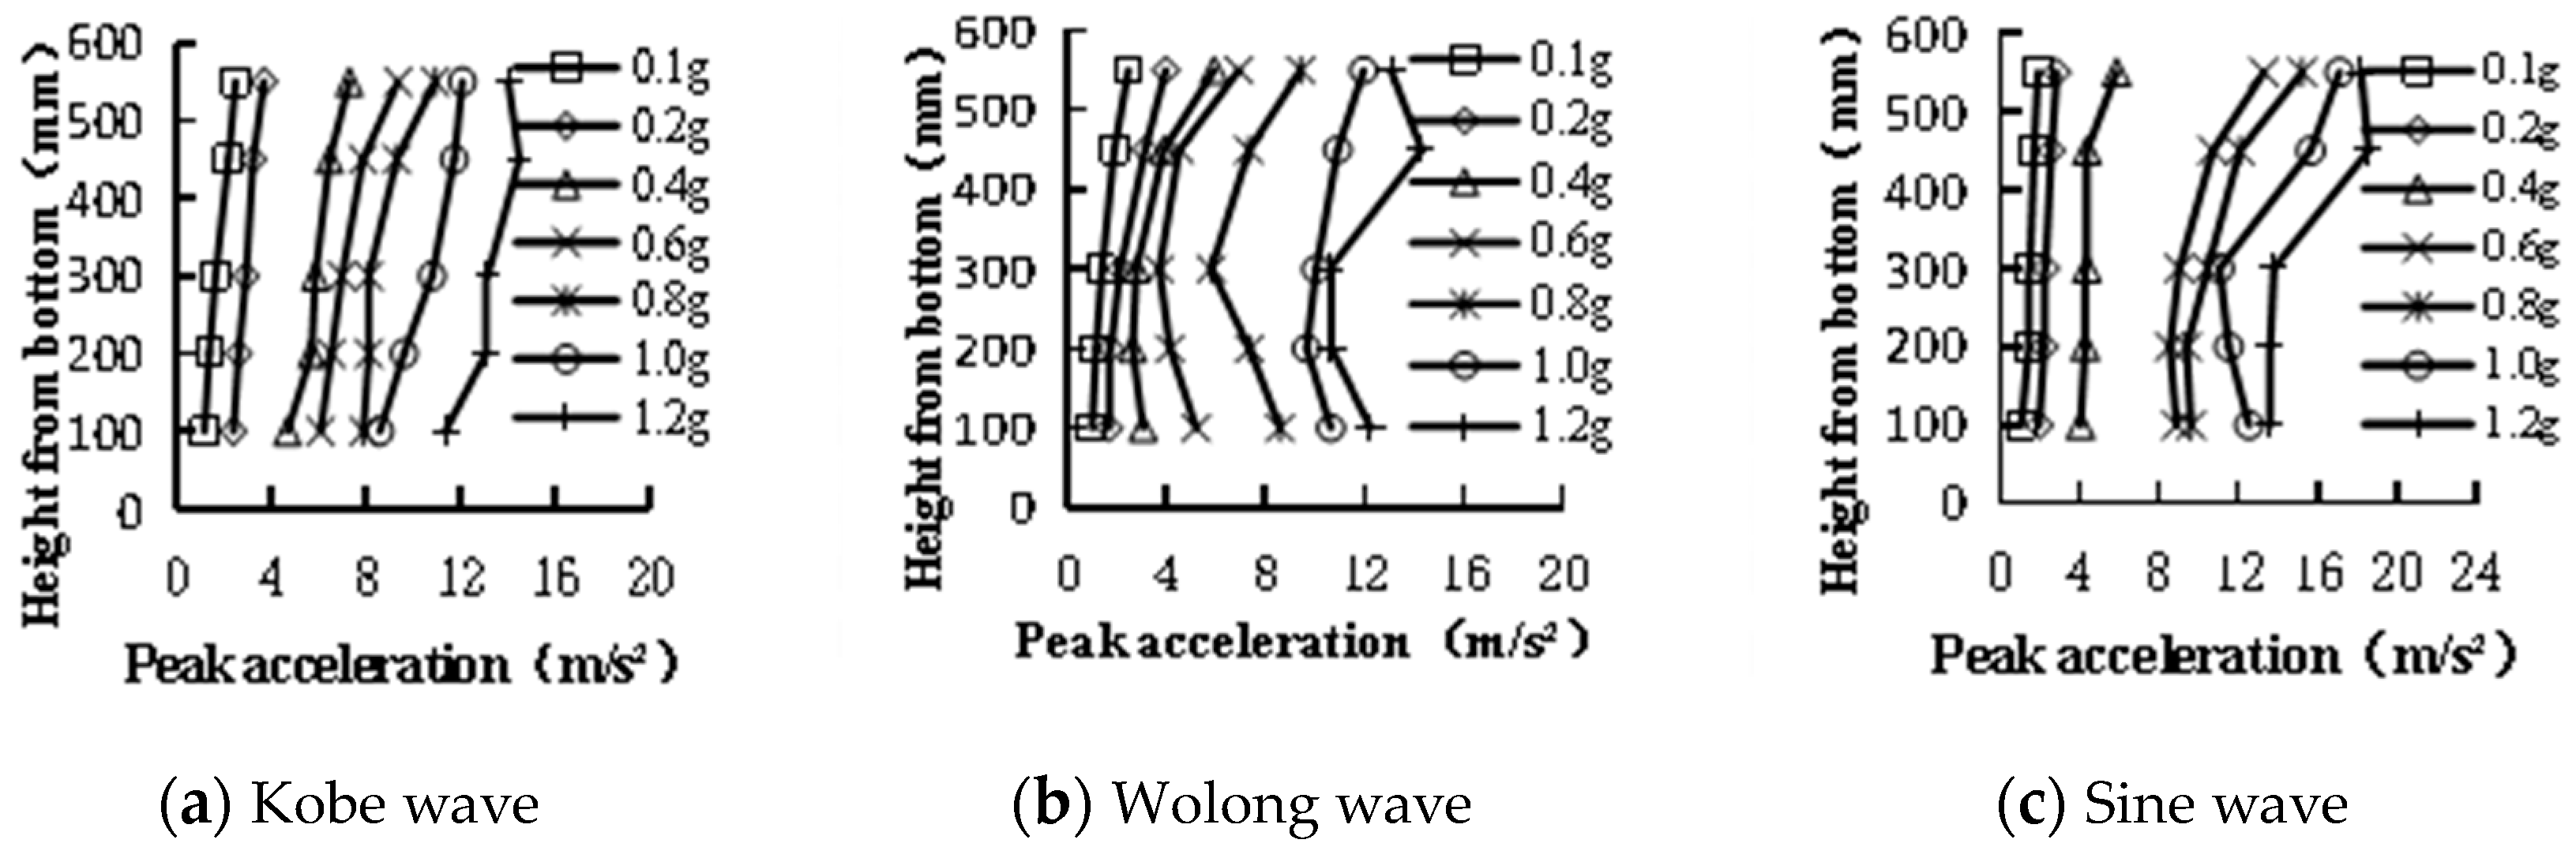
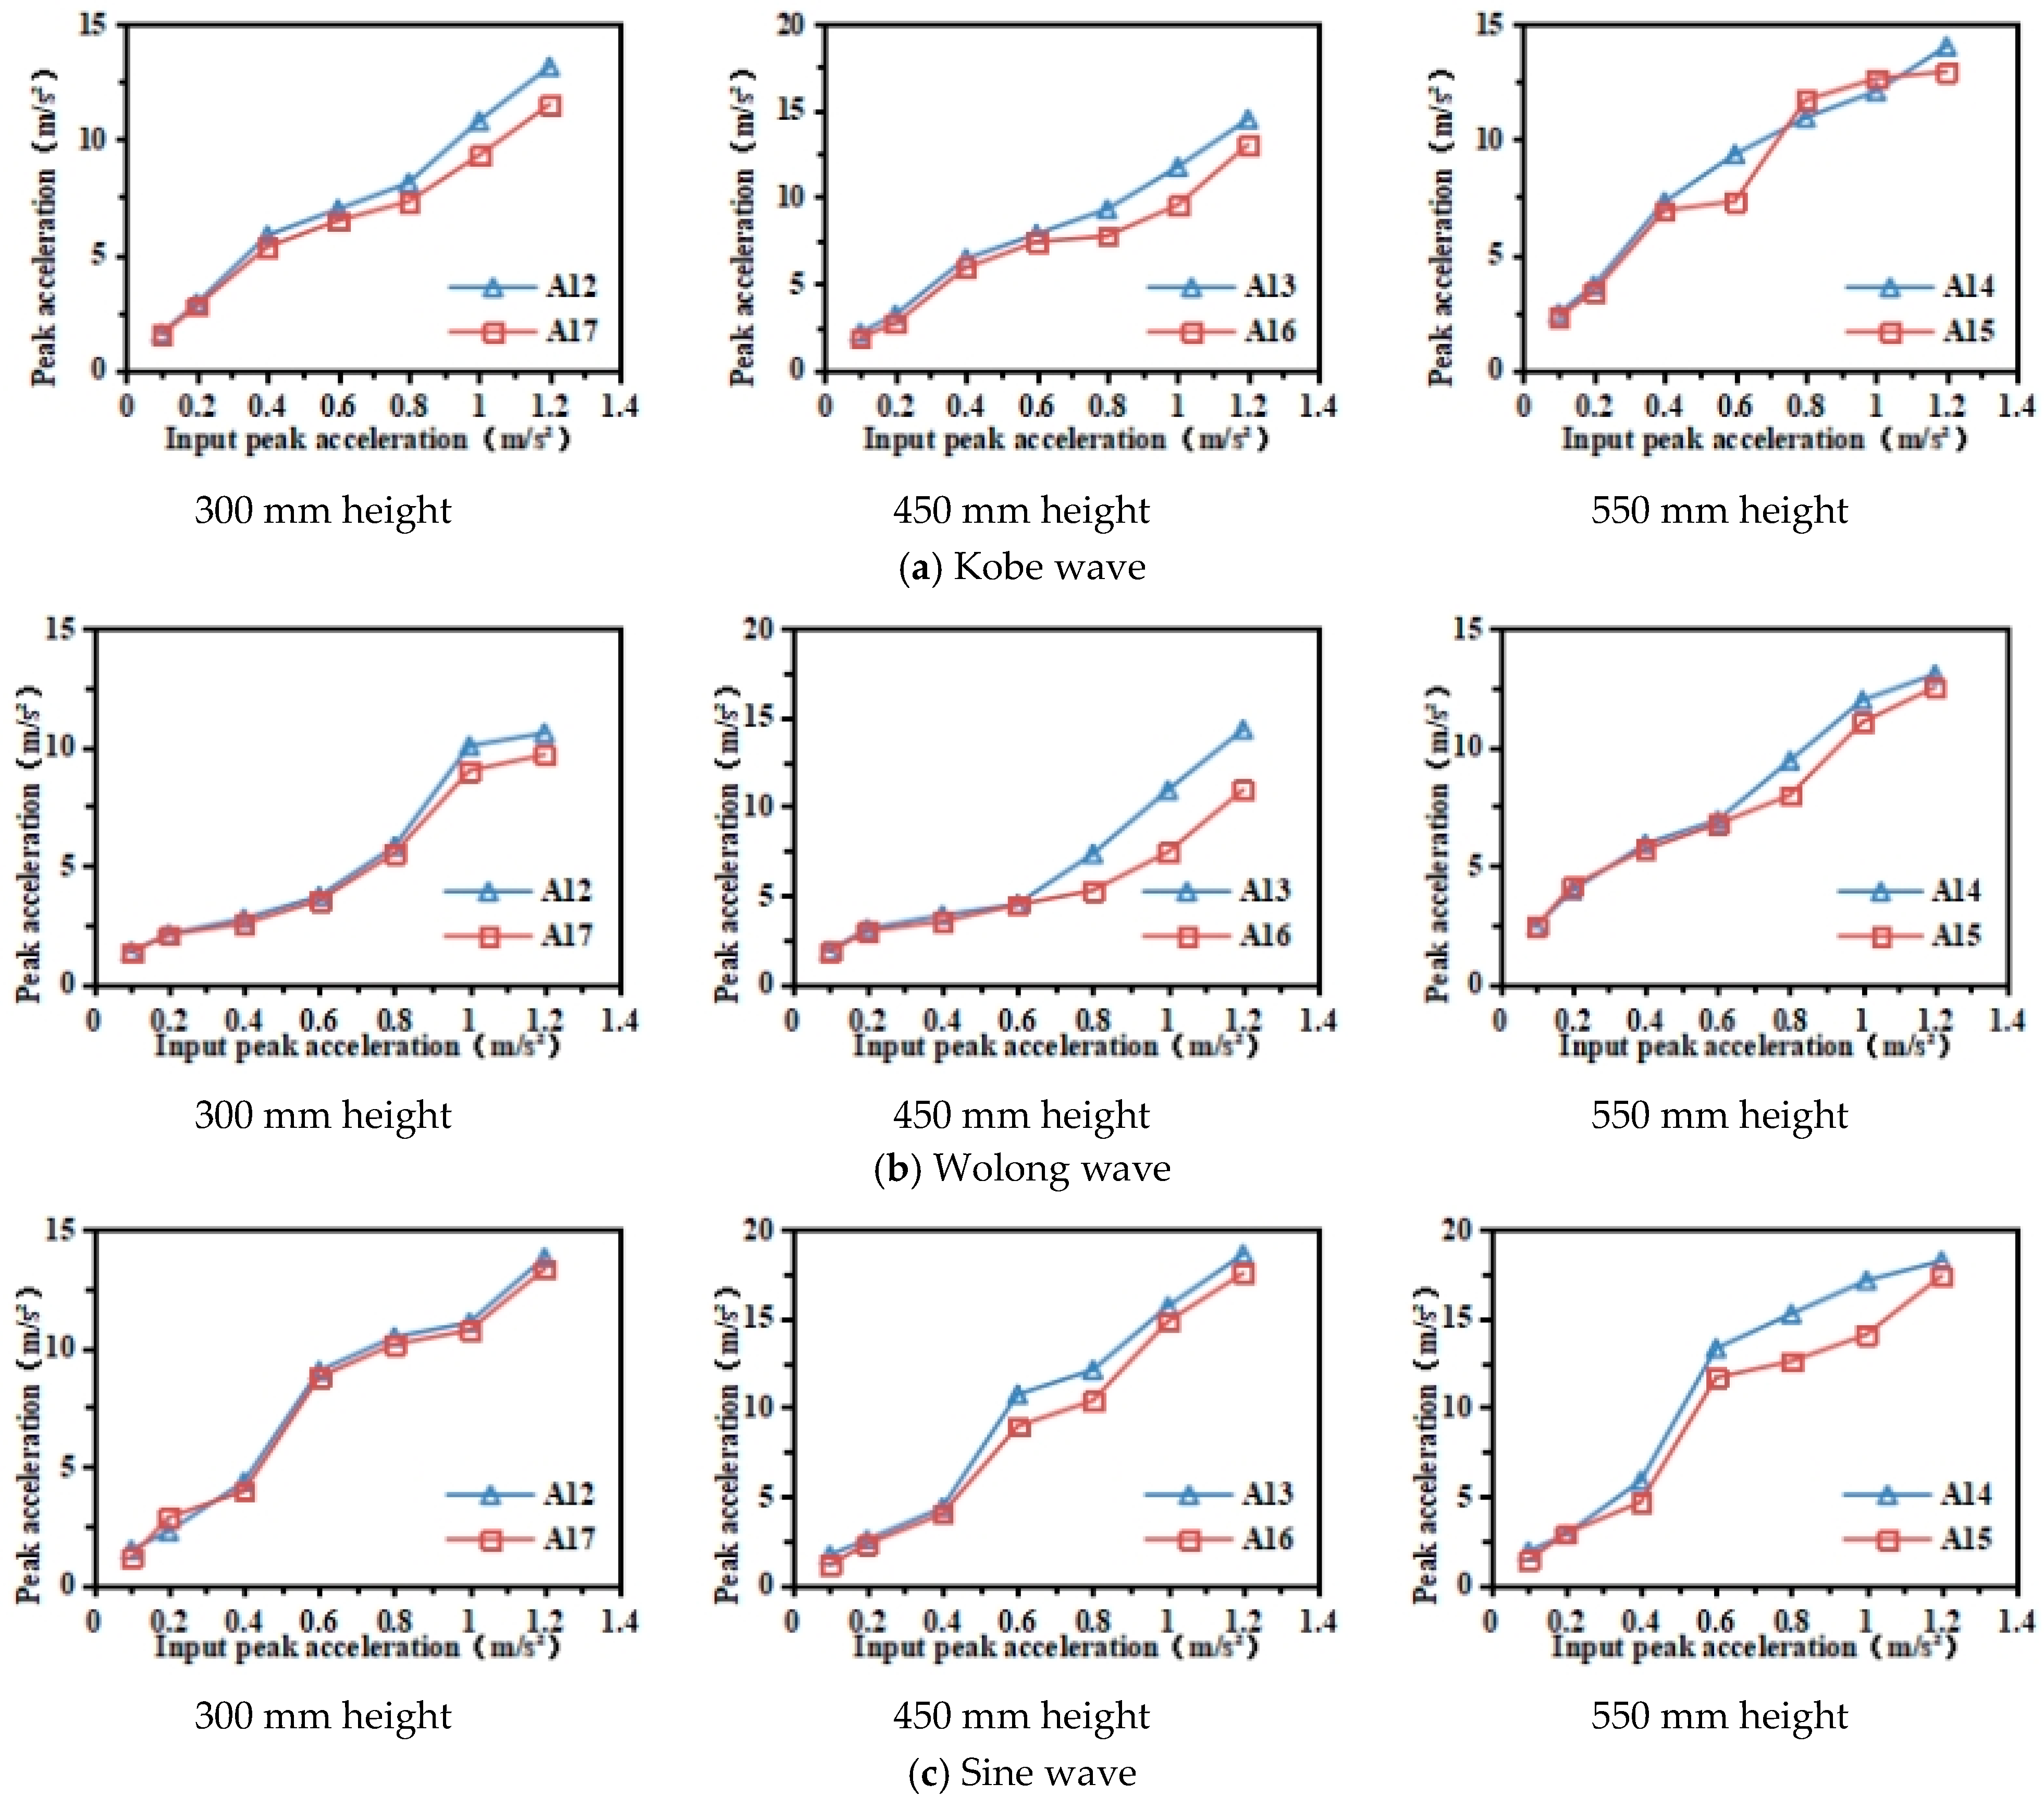
4.1. Acceleration Response Characteristics of Surrounding Rock
- (1)
- Stratum acceleration response
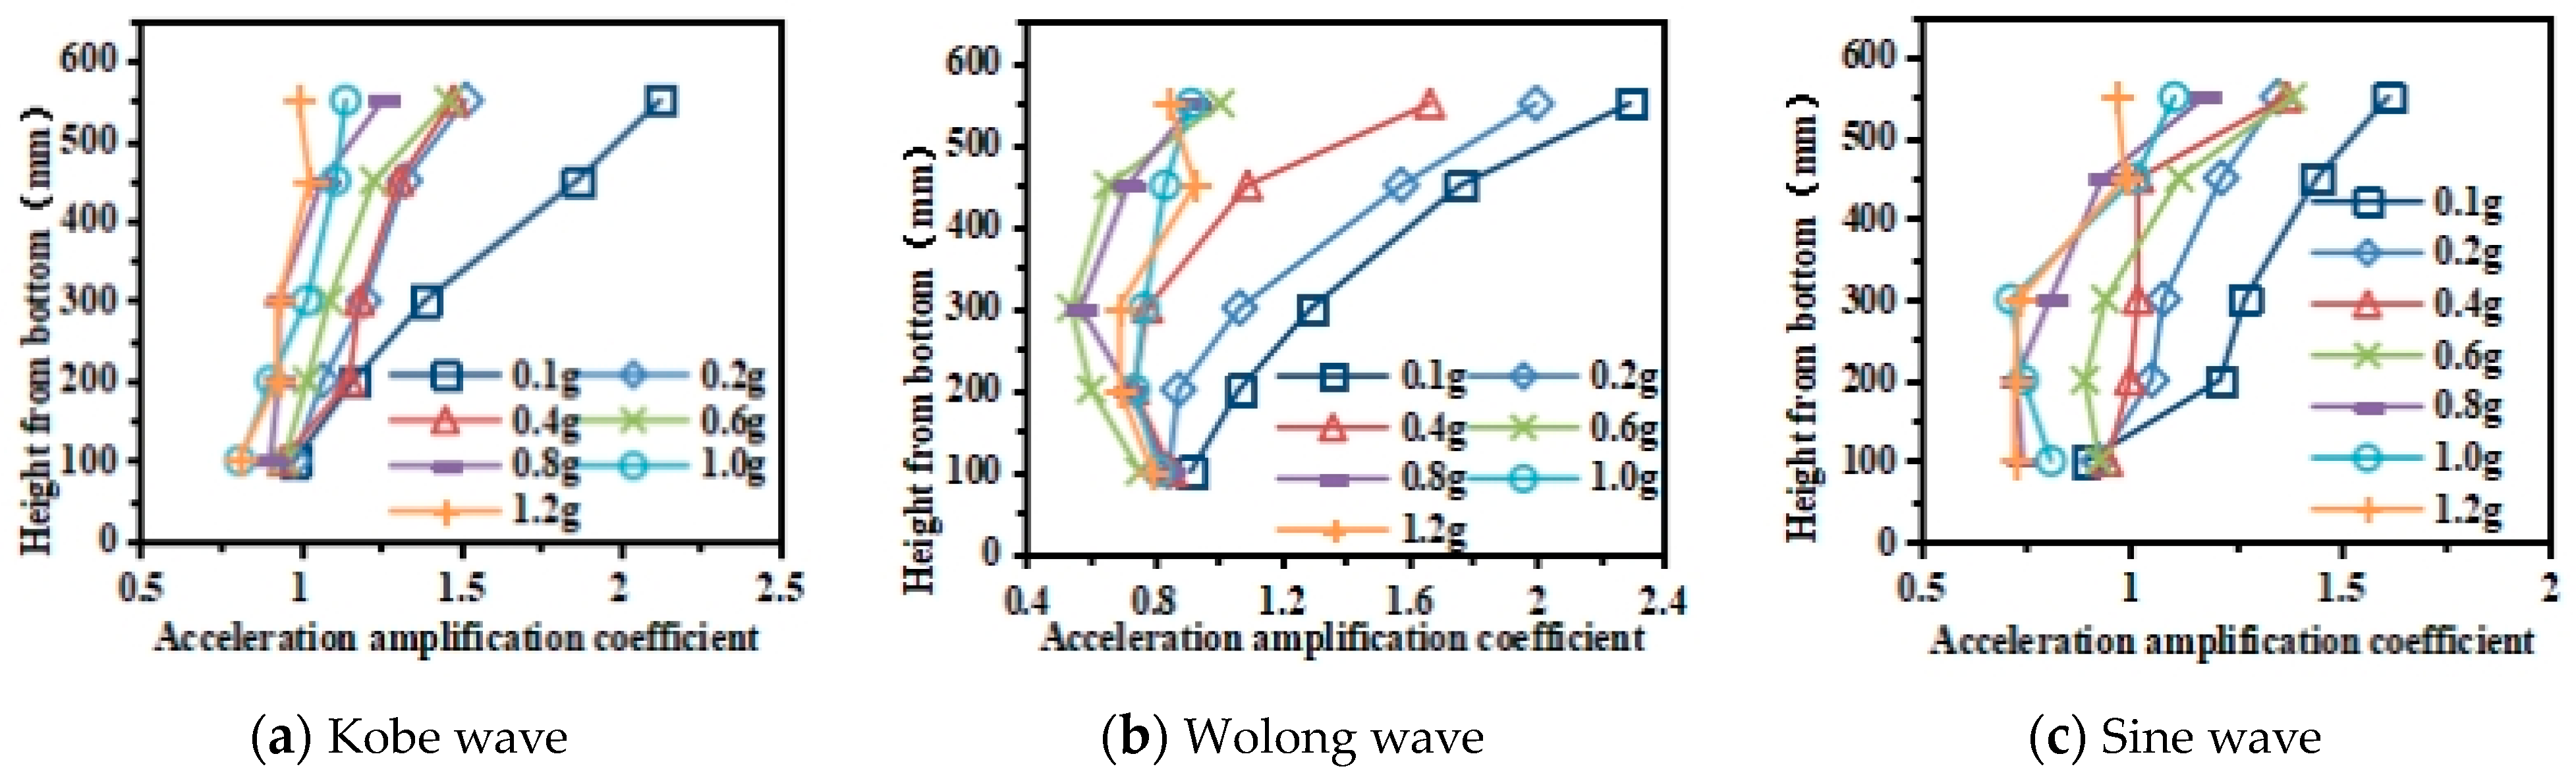
- (2)
- Influence of pile-supported tunnel structure on stratum acceleration
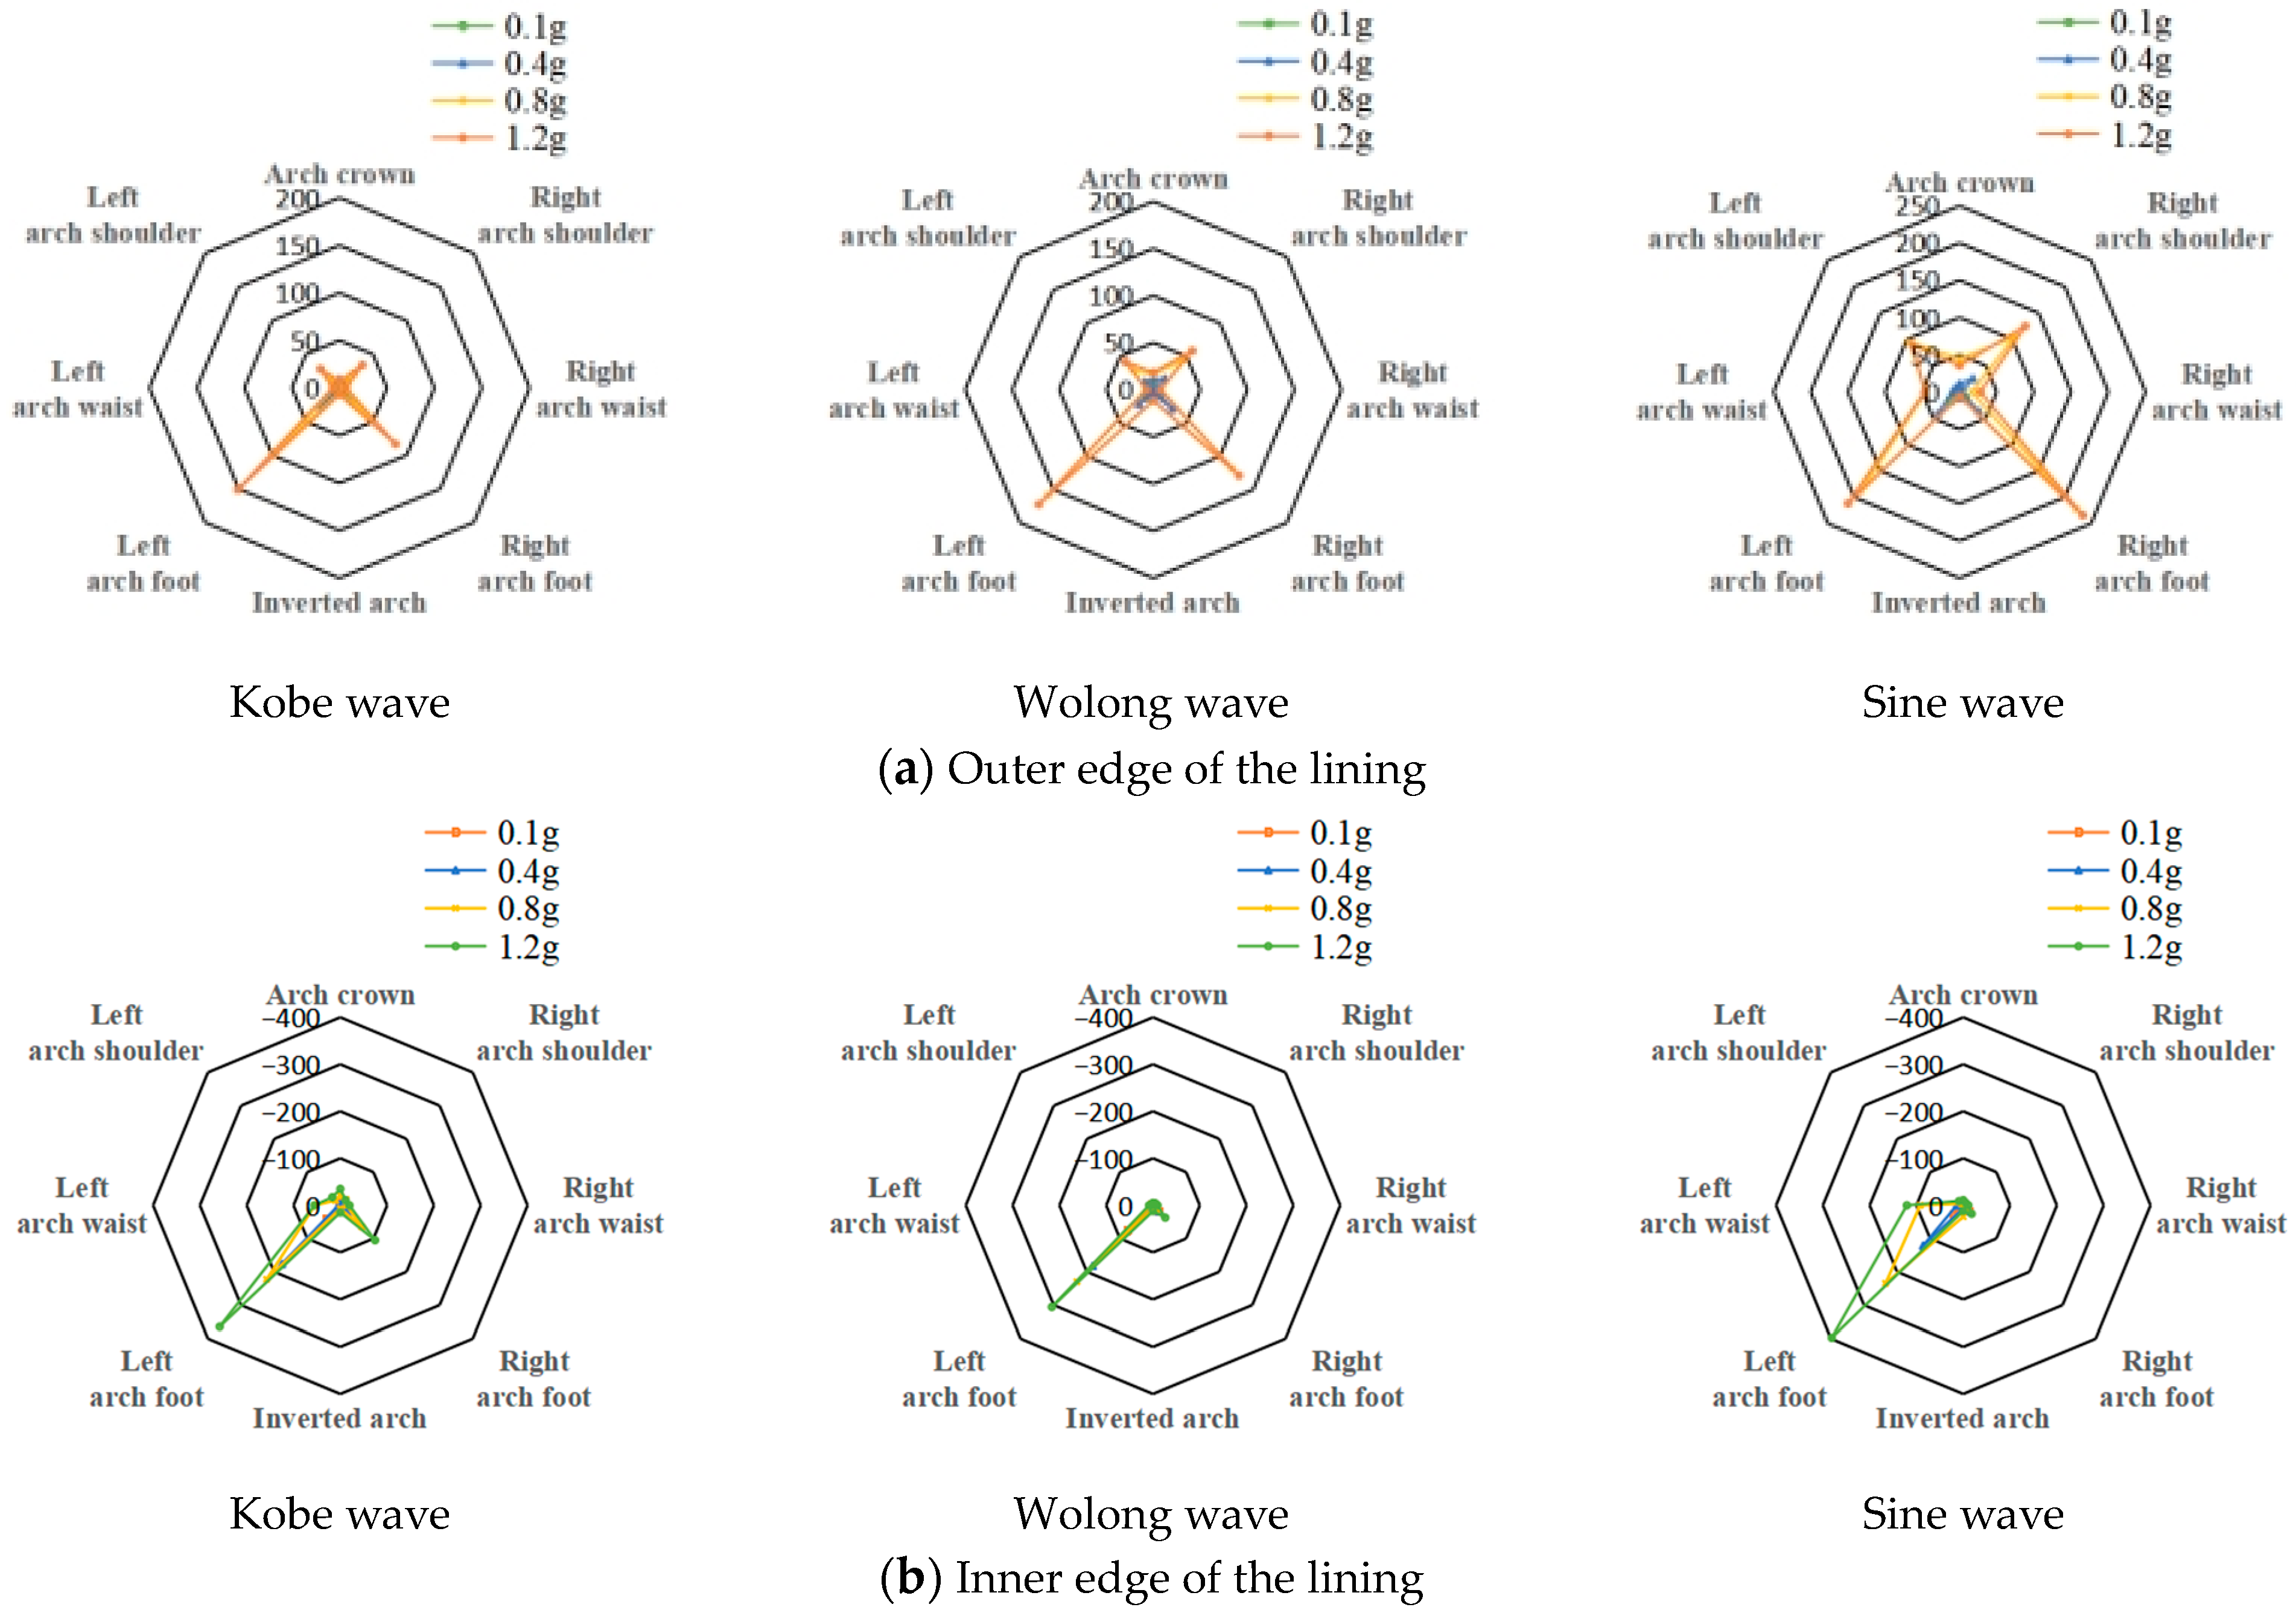
4.2. Acceleration Response Characteristics of Pile-Supported Tunnel Structure
- (1)
- Strain acceleration response of tunnel lining
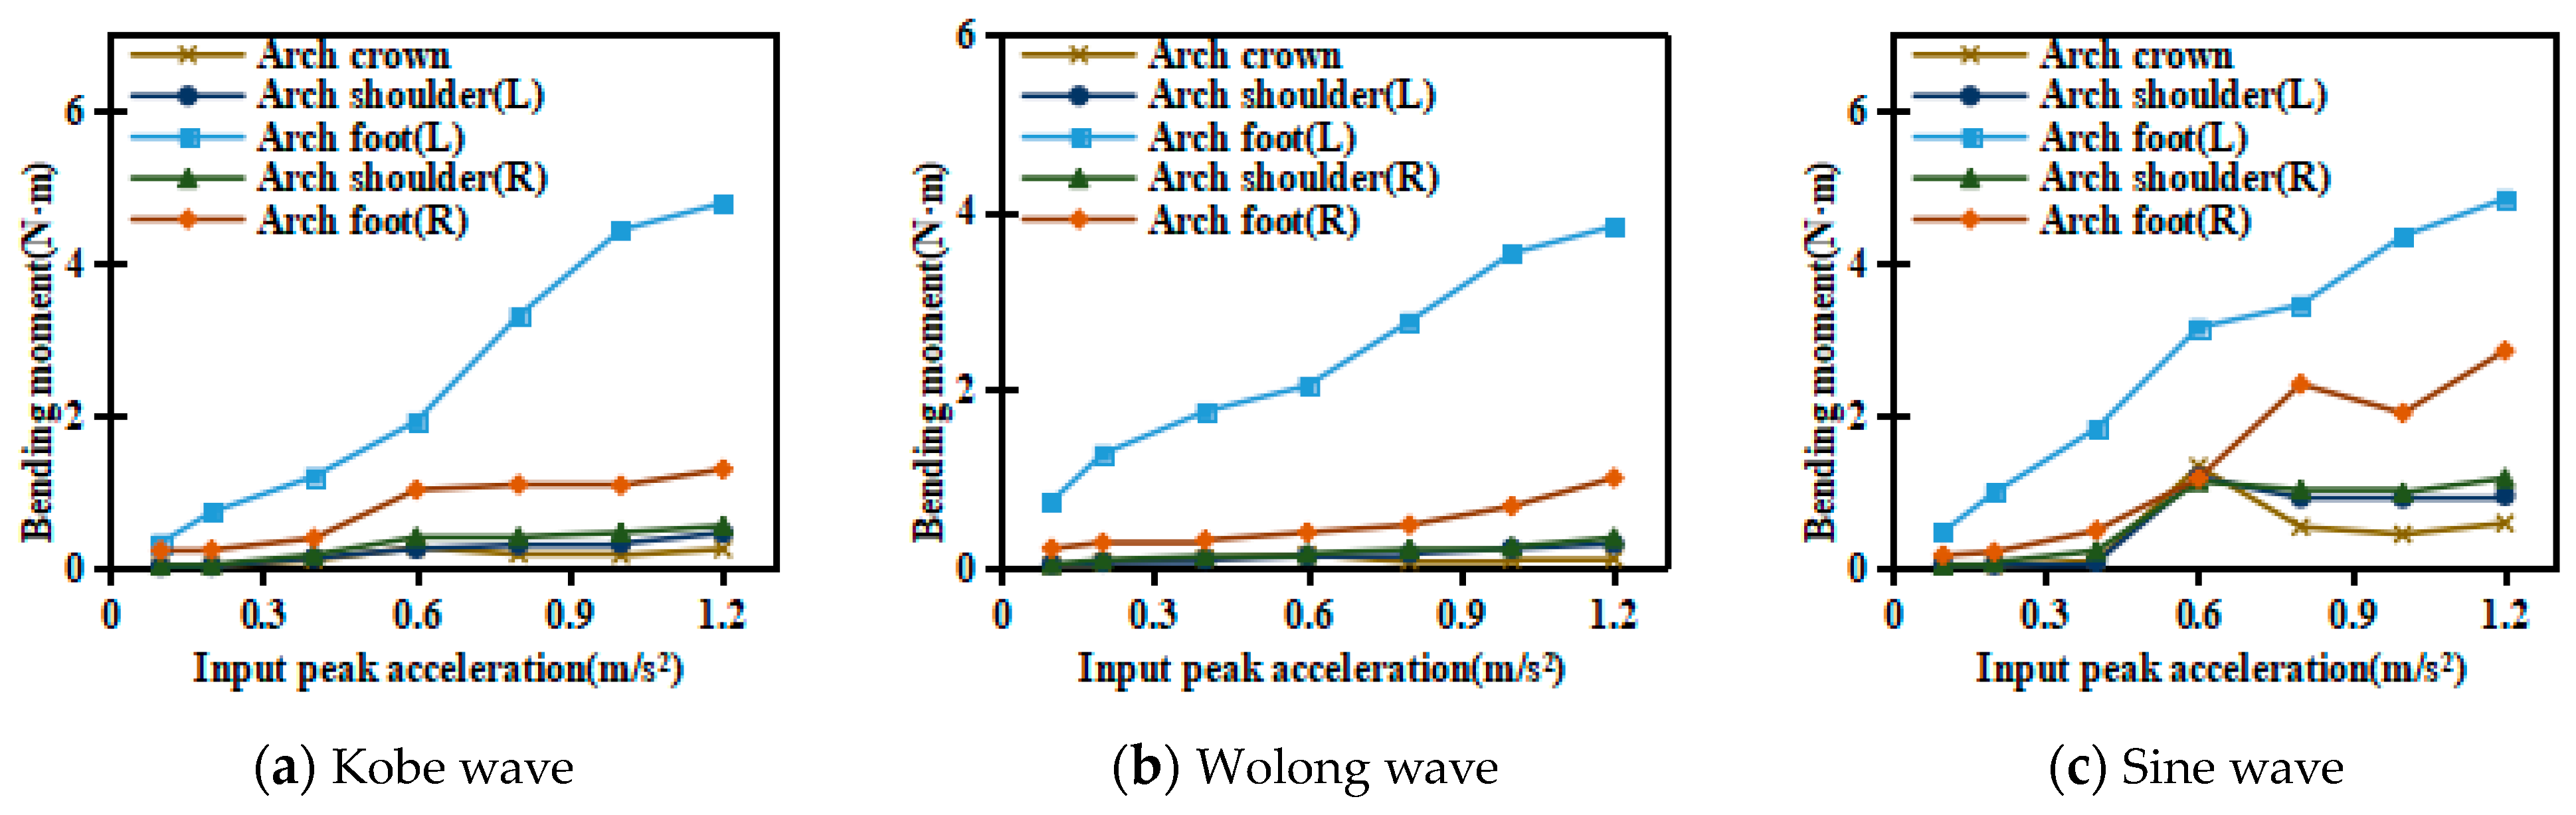
- (2)
- Bending moment acceleration response of tunnel lining
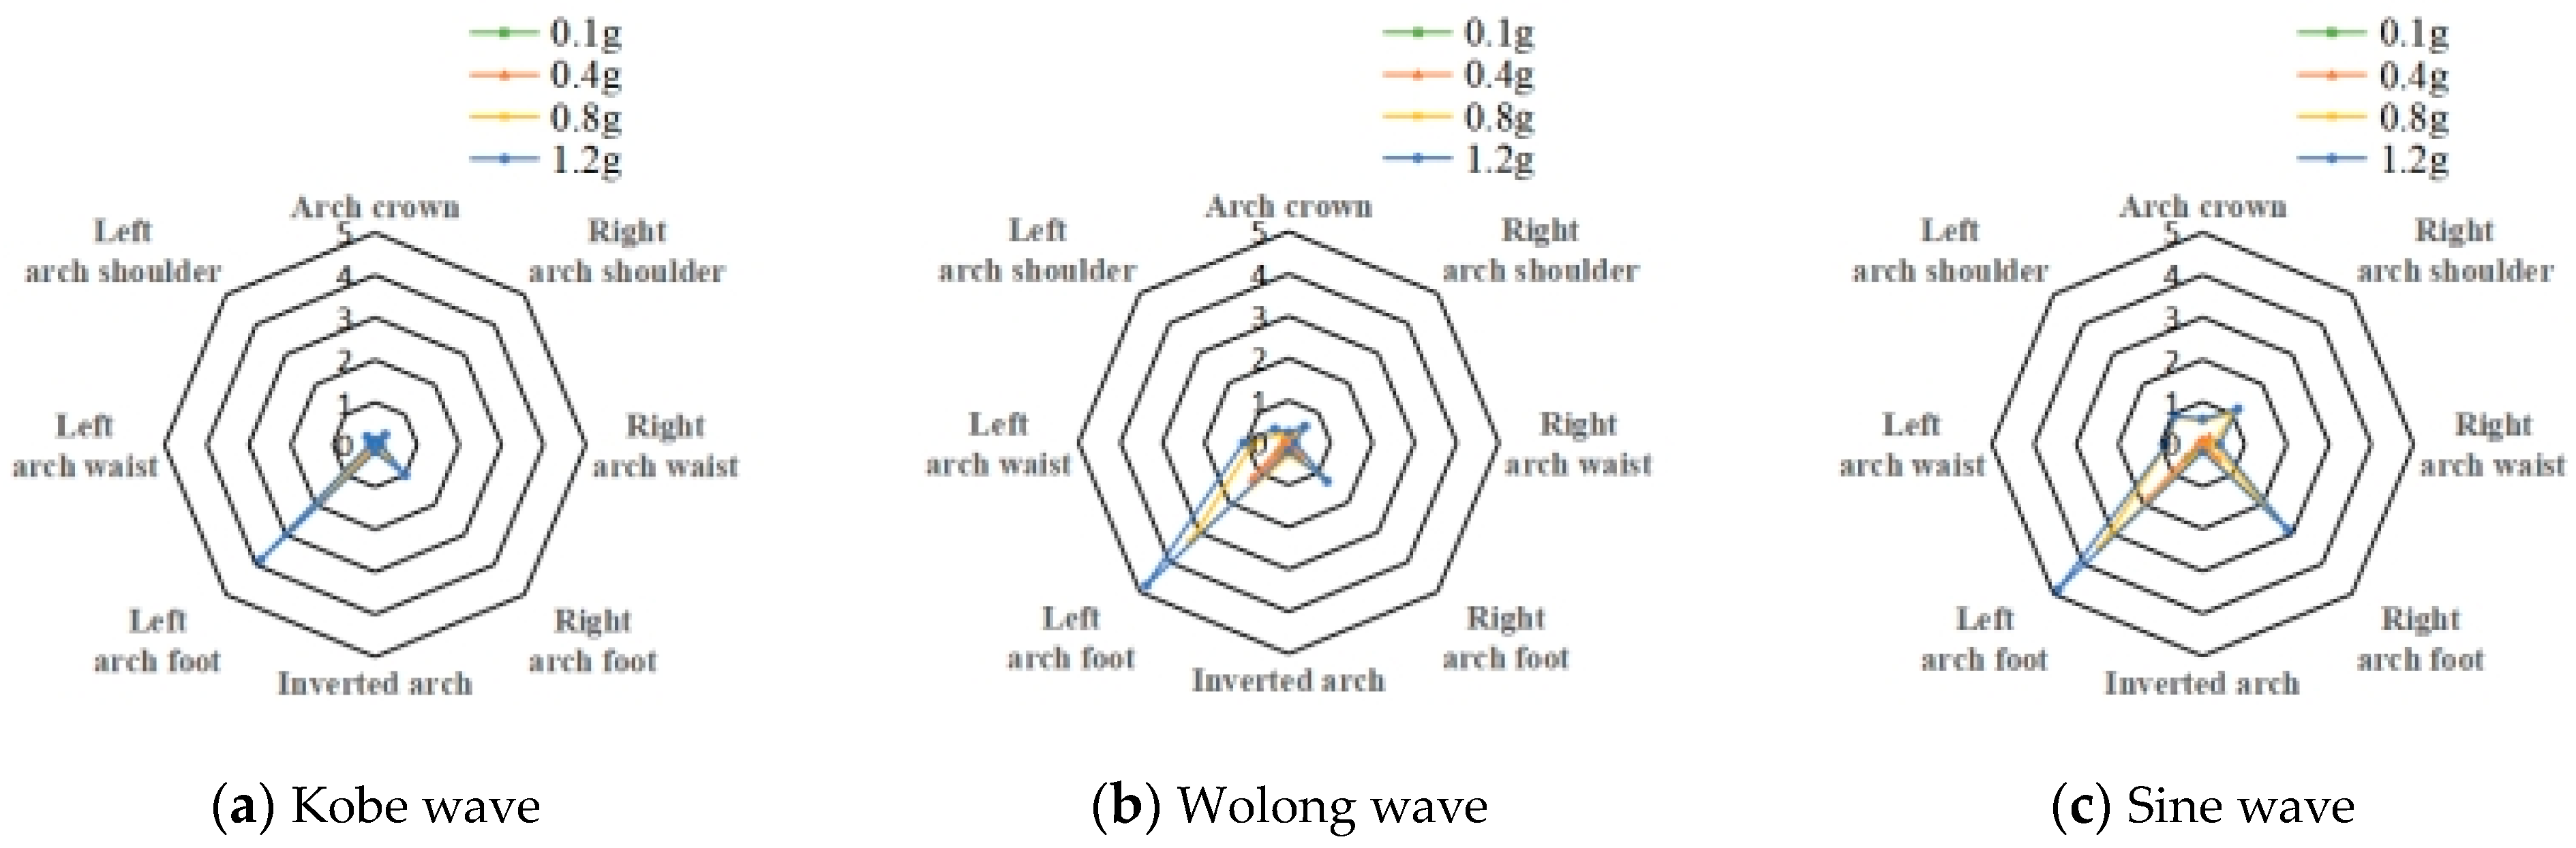
- (3)
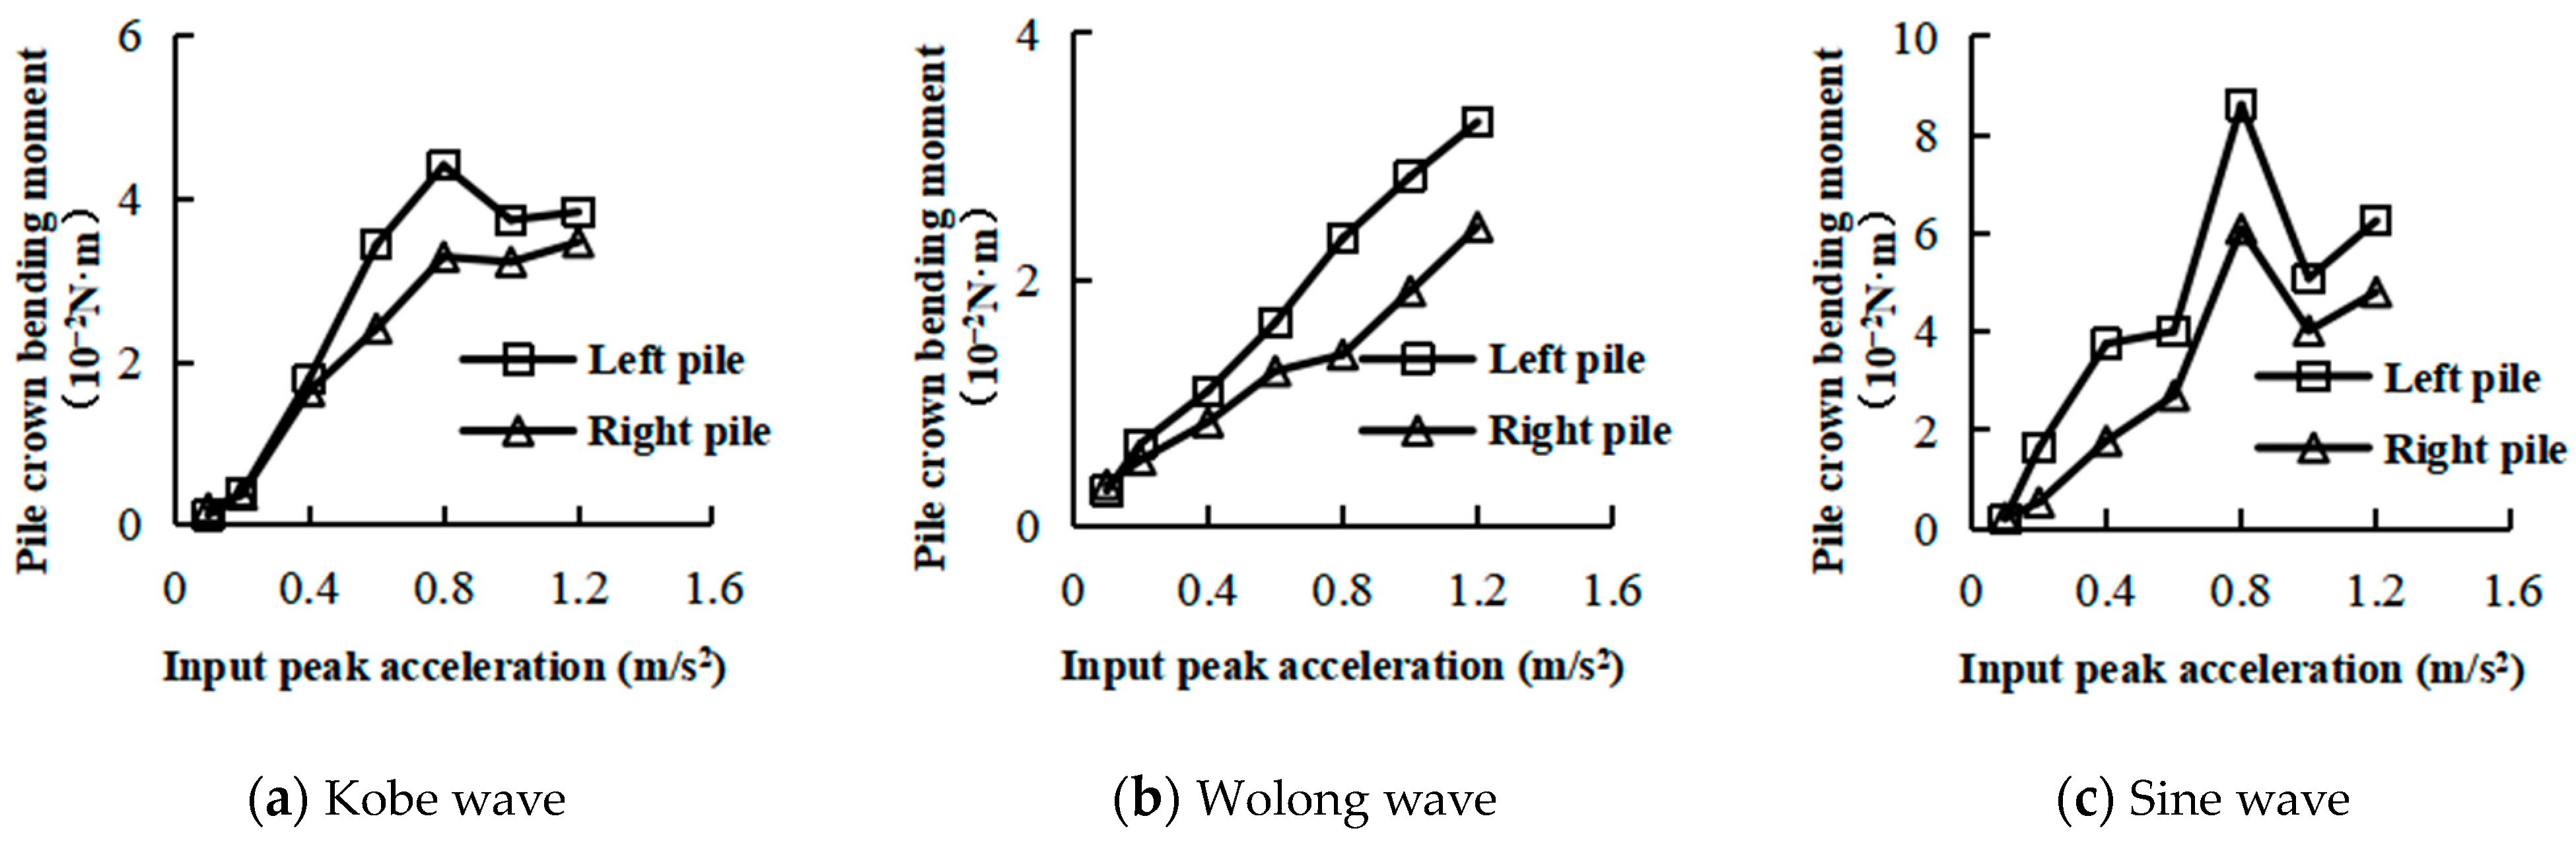
- Bending moment acceleration response of pile crown
4.3. Surface Settlement
5. Conclusions
- (1)
- Under the action of seismic waves, the acceleration response of soil–rock mixture stratum exhibited obvious “skin effect”, indicating that closer proximity to the surface led to heightened horizontal acceleration responses; however, with the increase in the peak value of input seismic waves, the plastic deformation occurred in the upper stratum of the soil–rock mixture; the grouting stratum was obviously affected by the tunnel–pile structure, and the horizontal peak acceleration of the stratum in the vertical direction changes in a “Z” shape.
- (2)
- The tunnel–pile structure had a weakening effect on the horizontal acceleration of both the stratum in its height range and the stratum above the tunnel.
- (3)
- Under the action of seismic waves, the peak strain values at the arch shoulder and arch foot of the tunnel were larger, and the peak strain response of the tunnel lining cross-section generally exhibited an “X” shape. In the direction of the tunnel axis, the bending moment at the arch foot was the largest, followed by the left and right arch shoulder, and the bending moment at the inverted arch and arch waist were smaller. The bending moment of the lining cross-section exhibited an inverted “V” shape.
- (4)
- The bending moment of the pile crown generally increased with the increase in the peak acceleration of the input seismic wave. When the peak acceleration of the input seismic wave exceeded 0.8 g, the increasing trend of the pile crown bending moment decreased.
- (5)
- The maximum surface settlement in the model test was 0.5~1 cm, and the tunnel–pile structure effectively reduced the surface settlement but lead to uneven surface settlement.
Author Contributions
Funding
Data Availability Statement
Conflicts of Interest
References
- Lai, J.; He, S.; Qiu, J.; Chen, J.; Wang, L.; Wang, K. Characteristics of seismic disasters and aseismic measures of tunnels in Wenchuan earthquake. Environ. Earth Sci. 2017, 76, 94. [Google Scholar] [CrossRef]
- Zhang, F. Analysis of Dynamic Response of Subway Underground Structure Under Seismic and Second Development of Software. Master’s Thesis, Huazhong University of Science & Technology, Wuhan, China, 2014. [Google Scholar] [CrossRef]
- Thoms, R.; Kuesel, F. Earthquake design criteria for subways. J. Struct. Div. Proc. Am. Soc. Civ. Eng. 1969, 95, 1225–1328. [Google Scholar]
- Pai, L.; Wu, H. Experimental study on dynamic response of tunnel lining structure orthogonal under-crossing a landslide under earthquake. J. Rock Mech. Geotech. Eng. 2022, 41, 979–994. [Google Scholar]
- Lai, T.; Lei, H.; Wu, H. Vibration Acceleration Responses of Crossing Tunnels of Highway and Railway under Different Directions of Seismic Loads. China Railw. Sci. 2021, 42, 95–104. [Google Scholar]
- Sun, T.; Yue, Z.; Gao, B.; Li, Q.; Zhang, Y. Model test study on the dynamic response of the portal section of two parallel tunnels in a seismically active area. Water Energy Int. 2011, 68, 74. [Google Scholar] [CrossRef]
- Yang, T.; Rao, Y.; Wu, H.; Zhang, J.; Lei, H.; Ding, H. Dynamic Response of Parallel Overlapped Tunnel under Seismic Loading by Shaking Table Tests. Shock Vib. 2021, 2021, 2535762. [Google Scholar] [CrossRef]
- Wu, H.; Pai, L.; Pang, W.; He, C.; Zhang, X.; Li, D. Vibration table tests on the acceleration response of a three-dimensional cross tunnel with small net spacing and small angle. J. Vib. Shock 2021, 40, 298–306. [Google Scholar] [CrossRef]
- Singh, D.K.; Mandal, A.; Karumanchi, S.R.; Murmu, A.; Sivakumar, N. Seismic behaviour of damaged tunnel during aftershock. Eng. Fail. Anal. 2018, 93, 44–54. [Google Scholar] [CrossRef]
- Zhou, H.; Wang, X.; He, C.; Huang, C.; Aenlle, M.L. Seismic Response of a Tunnel Embedded in Compacted Clay through Large-Scale Shake Table Testing. Shock Vib. 2018, 2018, 5968431. [Google Scholar] [CrossRef]
- Mya, D.C.; Tang, A.; Huang, D.; Zhang, J. Large scale shaking table model test and analysis on seismic response of utility tunnel in non-homogeneous soil. Earthq. Eng. Eng. Vib. 2021, 20, 505–515. [Google Scholar]
- Li, Y.; Ma, X.; Feng, N.; Shang, J.; Xu, X. Experimental Study on Seismic Response of Ji’nan Silty Clay and the Tunnel in It. Chin. J. Undergr. Space Eng. 2019, 15, 1652–1660. [Google Scholar]
- Simoni, A.; Houlsby, G.T. The Direct Shear Strength and Dilatancy of Sand–gravel Mixtures. Geotechn. Geol. Eng. 2006, 24, 523–549. [Google Scholar] [CrossRef]
- Huang, W. Large-Scale Triaxial Tests on Soil-Rock Aggregate Mixture Based on Orthogonal Design. Master’s Thesis, Hunan University, Changsha, China, 2015. [Google Scholar]
- Cao, W.G.; Huang, W.J.; Wang, J.Y.; Zhai, Y.C. Large-scale triaxial tests Study om Deformation and Intensity Characteristic of Soil-rock Aggregate Mixture. J. Hunan Univ. 2016, 43, 142–148. [Google Scholar]
- Xia, J.; Hu, R.; Qi, S.; Gao, W.; Sui, H. Large-scale triaxial shear testing of soil rock mixtures containing oversized particles. J. Rock Mech. Geotech. Eng. 2017, 36, 2031–2039. [Google Scholar]
- Xia, J.; Hu, R.; Gao, W. Research on Mechanical Characteristic of the Soil Rock Mixtures by Large-scale triaxial shear Tests. J. Eng. Geol. 2016, 24, 1211–1218. [Google Scholar]
- Hu, S.; Jin, X.; Sun, G.; Li, H.; Nie, Z. Triaxial test and PFC-FLAC coupling simulation study on material parameters and deformation characteristics of soil-rock mixture. J. Rock Mech. Geotech. Eng. 2021, 40, 3344–3356. [Google Scholar] [CrossRef]


| Materials | c (kPa) | φ (°) | E (MPa) | Density (g/cm3) | Poisson Ratio | Rock Content (%) | Uniaxial Compressive Strength (MPa) |
|---|---|---|---|---|---|---|---|
| SRM | 46.8 | 36.1 | 64 | 1.8 | 0.3 | 40–60 | |
| Grouting | 400–800 | 35.8 | 140–280 | 2.0 | 0.28 | ||
| Sandstone | 4000 | 41 | 5000 | 2.4 | 0.25 | 36.8 | |
| Lining | 32,500 | 2.5 | 0.3 | 26.8 | |||
| Pile | 32,500 | 2.5 | 0.3 | 26.8 |
| Materials | c (kPa) | φ (°) | E (MPa) | Density (g/cm3) | Poisson Ratio | Rock Content (%) | Uniaxial Compressive Strength (MPa) |
|---|---|---|---|---|---|---|---|
| Similarity relationship | Sc = SE | Sφ = 1 | SE = SlSρSa | Sγ = SρSg | Sφ = 1 | Sucs = SE | |
| Similarity ratio | 1/80 | 1 | 1/80 | 1 | 1 | 1/80 | |
| SRM | 0.58 | 36.1 | 0.8 | 1.8 | 0.3 | 40–60 | |
| Grouting | 5–10 | 35.8 | 1.75–3.5 | 2.0 | 0.28 | ||
| Sandstone | 50 | 41 | 62.5 | 2.4 | 0.25 | 0.46 | |
| Lining | 406 | 2.5 | 0.3 | 0.33 | |||
| Pile | 406 | 2.5 | 0.3 | 0.33 |
| Group | Main Ratio | Others | |
|---|---|---|---|
| Coarse Quartz Sand (1~2 mm)–Fine Quartz Sand (1~2 mm)–Fine Sand–Clay | Water Content | Rock Content | |
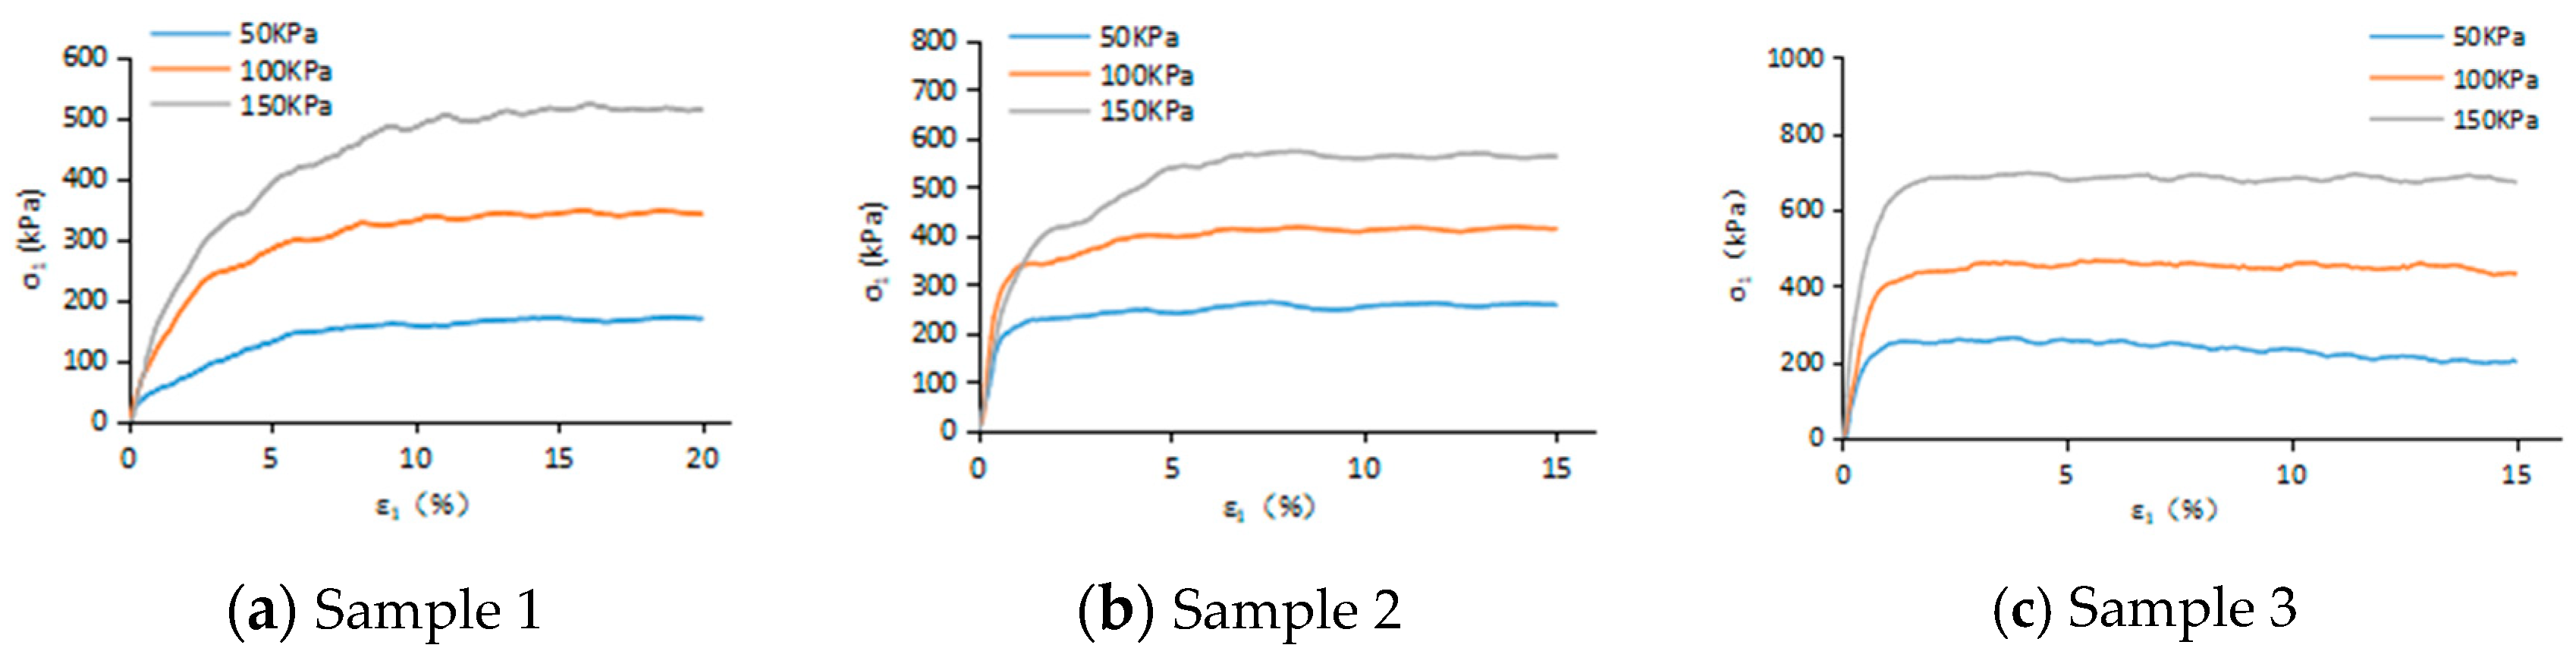
| Sample 1 | 2:2:5:1 | 7% | 40% |
| Sample 2 | 2:2:4:2 | 10% | 40% |
| Sample 3 | 2:3:3.5:1.5 | 10% | 50% |
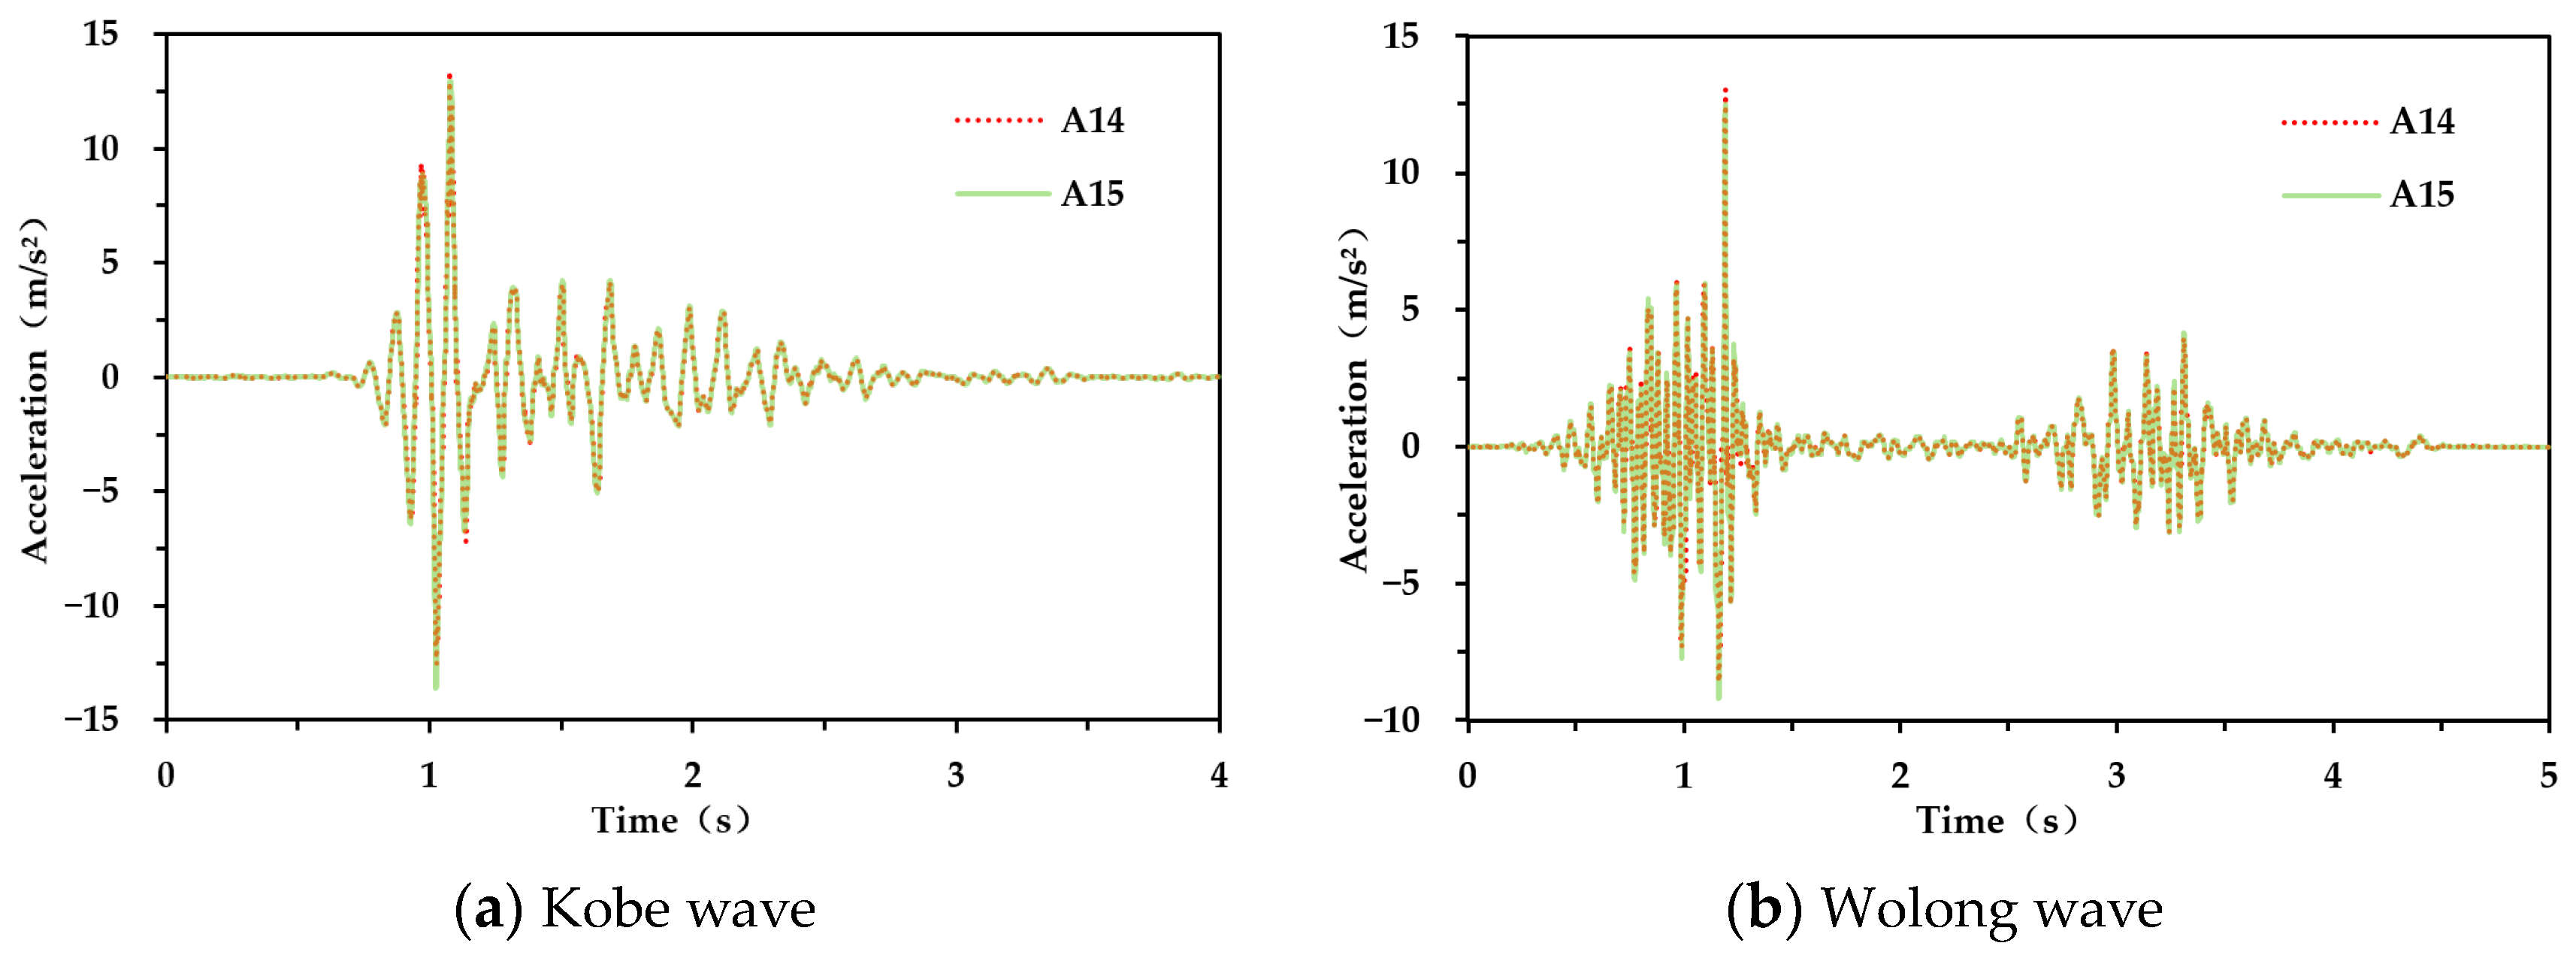
| Measuring Points | Height (mm) | Relative Difference Percentage of Peak Acceleration | ||
|---|---|---|---|---|
| Kobe Wave | Wolong Wave | Sine Wave | ||
| A14 A15 | 550 | 5.18% | 4.07% | 13.74% |
| A13 A16 | 450 | 12.61% | 14.43% | 13.08% |
| A12 A17 | 300 | 8.57% | 5.81% | 3.43% |
Disclaimer/Publisher’s Note: The statements, opinions and data contained in all publications are solely those of the individual author(s) and contributor(s) and not of MDPI and/or the editor(s). MDPI and/or the editor(s) disclaim responsibility for any injury to people or property resulting from any ideas, methods, instructions or products referred to in the content. |
© 2024 by the authors. Licensee MDPI, Basel, Switzerland. This article is an open access article distributed under the terms and conditions of the Creative Commons Attribution (CC BY) license (https://creativecommons.org/licenses/by/4.0/).
Share and Cite
Li, H.; Jin, X.; Sun, G.; He, J. A Study on Seismic Dynamic Response of Pile-Supported Tunnels in Deep Backfill Area of Soil–Rock Mixture Based on a Model Test. Buildings 2024, 14, 791. https://doi.org/10.3390/buildings14030791
Li H, Jin X, Sun G, He J. A Study on Seismic Dynamic Response of Pile-Supported Tunnels in Deep Backfill Area of Soil–Rock Mixture Based on a Model Test. Buildings. 2024; 14(3):791. https://doi.org/10.3390/buildings14030791
Chicago/Turabian StyleLi, Hanlin, Xiaoguang Jin, Guodong Sun, and Jie He. 2024. "A Study on Seismic Dynamic Response of Pile-Supported Tunnels in Deep Backfill Area of Soil–Rock Mixture Based on a Model Test" Buildings 14, no. 3: 791. https://doi.org/10.3390/buildings14030791