Article

Evaluation of Hysteretic Performance of Horizontally Placed Corrugated Steel Plate Shear Walls with Vertical Stiffeners

1
School of Civil Engineering, Liaoning Technical University, Fuxin 123000, China
2
Institute of Advanced Engineering Structures, Zhejiang University, Hangzhou 310058, China
*
Authors to whom correspondence should be addressed.
Buildings 2024, 14(3), 779; https://doi.org/10.3390/buildings14030779
Submission received: 21 December 2023 / Revised: 22 February 2024 / Accepted: 11 March 2024 / Published: 13 March 2024
(This article belongs to the Special Issue Research on Industrialization and Intelligence in Building Structures)

Abstract

:
Corrugated steel plate shear walls (CSPSWs) have been widely utilized as lateral-resistant and energy-dissipating components in multistory and high-rise buildings. To improve their buckling stability, shear resistance, and energy-dissipating capacity, stiffeners were added to the CSPSW, forming stiffened CSPSWs (SCSPSWs). Evaluating the hysteretic performances of SCSPSWs is crucial for guiding seismic design in engineering practice. In this paper, the dissipated energy values of the SCSPSWs with different parameters were calculated. Based on the obtained dissipated energy values, the elastoplastic design theory of stiffeners was established, and the evaluation of the hysteretic performance of the SCSPSWs was provided. Firstly, a finite element (FE) model for analyzing the hysteretic performance of the SCSPSWs was developed and validated against hysteretic tests of the CSPSW conducted by the authors previously. Subsequently, using the validated FE model, approximately 81 examples of SCSPSWs subjected to cyclic loads were analyzed. Hysteretic curves, skeleton curves, secant stiffness, stress distribution, and out-of-plane displacement were obtained and examined. Results indicate that increasing the bending rigidity of the vertical stiffeners and the thickness of the corrugated steel plates, as well as reducing the aspect ratio of the corrugated steel plates, is beneficial for enhancing the load-carrying capacity, stiffness, and energy dissipation capacity of the SCSPSWs. Finally, the transition rigidity ratio μ0,h was proposed to describe the hysteretic performances. When the rigidity ratio is μ = 50, dissipated energy values of the SCSPSW could achieve 95% of the corresponding maximum dissipated energy. In engineering practice, hence, it is recommended to use stiffeners with a rigidity ratio of μμ0,h = 50 to ensure desirable energy-dissipating capacity in the SCSPSW.

1. Introduction

In the 1970s, steel plate shear walls (SPSWs) began to be recognized by the civil engineering community and gradually developed into a mature lateral-resistant system for high-rise building structures. As a two-dimensional lateral-resistant system, the SPSW offers lower cost and more convenient production and construction compared to buckling-restrained braces (BRBs) [1,2], a one-dimensional lateral-resistant system. Therefore, despite both the BRB and the SPSW exhibiting desirable seismic behavior, the latter is more widely utilized in engineering practice. The traditional flat SPSW with a height-to-thickness ratio exceeding 100 is generally defined as a thin steel plate shear wall. In such cases, shear buckling of the plate occurs before yielding, and significant out-of-plane buckling is observed with the increase in shear deformations. Additionally, the hysteretic curves of the thin SPSW exhibit serious pinching phenomena under horizontal cyclic shear loads. To avoid the above problems existing in the thin SPSW, it is possible to arrange stiffeners on the plate to form stiffened steel plate shear walls (SSPSWs) [3] or to install concrete cover plate on both sides of the steel plate to form buckling-restrained steel plate shear walls (BRSPSWs) [4]. Additionally, other novel lateral-resistant systems and design methods were also proposed as alternatives to the SPSW [5,6,7,8]. In these ways, the ductility, energy dissipation, and shock absorption performance of the system could be improved. However, the mechanical performance of the shear wall could be affected by the welding residual stress and deformation existing in the SSPSW. Furthermore, the construction of the BRSPSW is relatively complicated, and the implementation cost is high. To address the issues of the out-of-plane buckling of the plate and pinching effect of the hysteretic curves in the thin SPSW, one effective improvement method is to replace the flat steel plate with a corrugated steel plate (CSP), forming a corrugated steel plate shear wall (CSPSW). The corrugated steel plate is obtained by cold rolling the flat steel plate to form out-of-plane corrugations in a certain direction. The commonly used shapes of corrugations include trapezoidal corrugation, sinusoidal corrugation, and re-entrant corrugation.
Compared to the flat SPSW, the CSPSW exhibits significantly higher bending rigidity in the strong axis direction due to the presence of out-of-plane corrugations. This effect is similar to the improvement achieved by placing stiffeners in a specific orientation on the flat SPSW to enhance bending rigidity in that direction [9]. The increased bending rigidity of the CSPSW leads to a substantial rise in its elastic buckling load when subjected to in-plane shear forces. Furthermore, the enhanced bending rigidity of the CSPSW contributes to its resistance against deformation caused by external forces. This characteristic facilitates the transportation, construction, and installation of components while minimizing the possibility of component deformation and initial geometrical imperfections.
Numerous investigations have examined the shear resistance and hysteresis behavior of the CSPSW. Shimizu et al. [10], Tian et al. [11], Zhang et al. [12], and Vigh et al. [13] conducted hysteretic tests on the CSPSW with small corrugated plate thicknesses. In these studies, the thicknesses of the CSPs ranged from 0.4 to 1.2 mm, and the test results exhibited significant local failure characteristics, resulting in a notable decrease in load-bearing capacities. With the advancements in cold-rolling technology, the manufacturing and utilization of thicker CSPs in engineering practice have become feasible. Several researchers conducted hysteresis tests on CSPSWs with thicknesses ranging from 2 to 4 mm to investigate the shear resistance and energy dissipation [14,15,16,17]. In these studies, localized failures could be avoided, and the hysteretic curves exhibited a more complete shape. Furthermore, researchers such as Berman et al. [18], Emami et al. [19,20], and Qiu et al. [21,22,23] performed comparative analyses between CSPSWs and SPSWs. The CSPSW exhibited higher buckling stability, greater ductility, increased lateral and out-of-plane stiffness, and more plump hysteretic loops. Zhao et al. [24] investigated the influence of pitting corrosion on the shear capacity of CSPs through stochastic numerical analysis. Dou et al. [25,26,27] conducted studies on the elastic buckling behavior, shear resistance, and post-buckling behavior of sinusoidal and trapezoidal corrugated steel plate shear walls.
In recent years, researchers have been exploring the application of CSPs in various innovative structural systems to maximize their advantages. These systems include stiffened CSPSWs [28], double-corrugated-plate shear walls [29], and CSP-concrete composite walls [30] and columns [31]. One notable system is the stiffened corrugated steel plate shear walls (SCSPSWs), which are formed by arranging stiffeners on the CSP, as depicted in Figure 1. The SCSPSWs typically consist of infilled corrugated steel plates, boundary frame members, and stiffeners. The infilled corrugated steel plate adopts trapezoidal corrugations, with the wave crest and trough usually of equal length. The corrugation ribs are oriented horizontally, allowing for the effective release of initial pre-pressure generated through the upper structure on the shear wall. In practical engineering, certain structural systems exhibit large spans, creating beam-column clearance areas with large aspect ratios. When CSPSWs are installed in these areas, the width-to-height ratio becomes large, making the plate prone to global buckling modes horizontally throughout its entire width when subjected to horizontal shear forces. These buckling modes are detrimental to the load-bearing and energy-dissipating capacities of the system. To mitigate this issue, the CSP can be divided into several zones horizontally by arranging vertical stiffeners. These stiffeners possess high bending rigidity and effectively prevent the occurrence of global shear buckling modes. Consequently, the shear-bearing capacity of the CSPSW can be significantly increased.
Several investigations have been conducted on the SCSPSWs. Tong et al. [32,33,34] investigated the elastic shear buckling behavior and elastoplastic shear resistance of the horizontal CSPSW with vertical stiffeners. They introduced a rigidity ratio to evaluate the restraining effect of the stiffeners. Feng et al. [35,36,37,38] conducted a series of elastic buckling analyses on the horizontal and vertical CSPSWs with steel strip stiffeners. Jin et al. [39] studied the shear load-bearing capacity of the CSPSW with longitudinal- and transverse-connecting stiffeners. Wen et al. [40] conducted experimental and numerical studies on the vertical CSPSW with horizontal stiffeners and provided a design method for the shear resistance.
As presented above, although some studies have been conducted on the shear-resistant performance of SCSPSWs, research on hysteretic performance and design methods remains limited. The authors conducted hysteretic tests on the SCSPSWs in the previous study [33], where the ultimate shear-bearing capacity and failure modes of the SCSPSWs were investigated. However, more detailed hysteretic design methods should be further studied according to extensive parametric analyses. Hence, in this paper, the dissipated energy values of the SCSPSWs with different parameters were calculated. Based on the obtained dissipated energy values, the elastoplastic design theory of stiffeners was established, and the evaluation of the hysteretic performance of the SCSPSWs was provided. This research can provide valuable support for calculating the damping ratio of SCSPSWs in high-rise buildings. Firstly, a finite element (FE) model was developed to analyze the hysteretic performance of SCSPSWs. The accuracy of the model was validated by comparing its results with tests that were previously conducted by the authors. Second, using the validated FE model, approximately 81 examples of SCSPSWs subjected to cyclic loads were analyzed. The analysis provided discussions about various aspects of the behavior, including hysteretic curves, skeleton curves, secant stiffness, and the distribution of stress and out-of-plane displacement. Then, the effects of key design parameters, such as the aspect ratio of the plate, the plate thickness, and the bending rigidity of stiffeners, on the hysteretic performance of the SCSPSWs were indicated. Finally, according to the research results, a transition rigidity value was recommended that ensures the dissipated energy value of the system stably reaches 95% of the upper limit.

2. Finite Element Model for Hysteretic Analysis

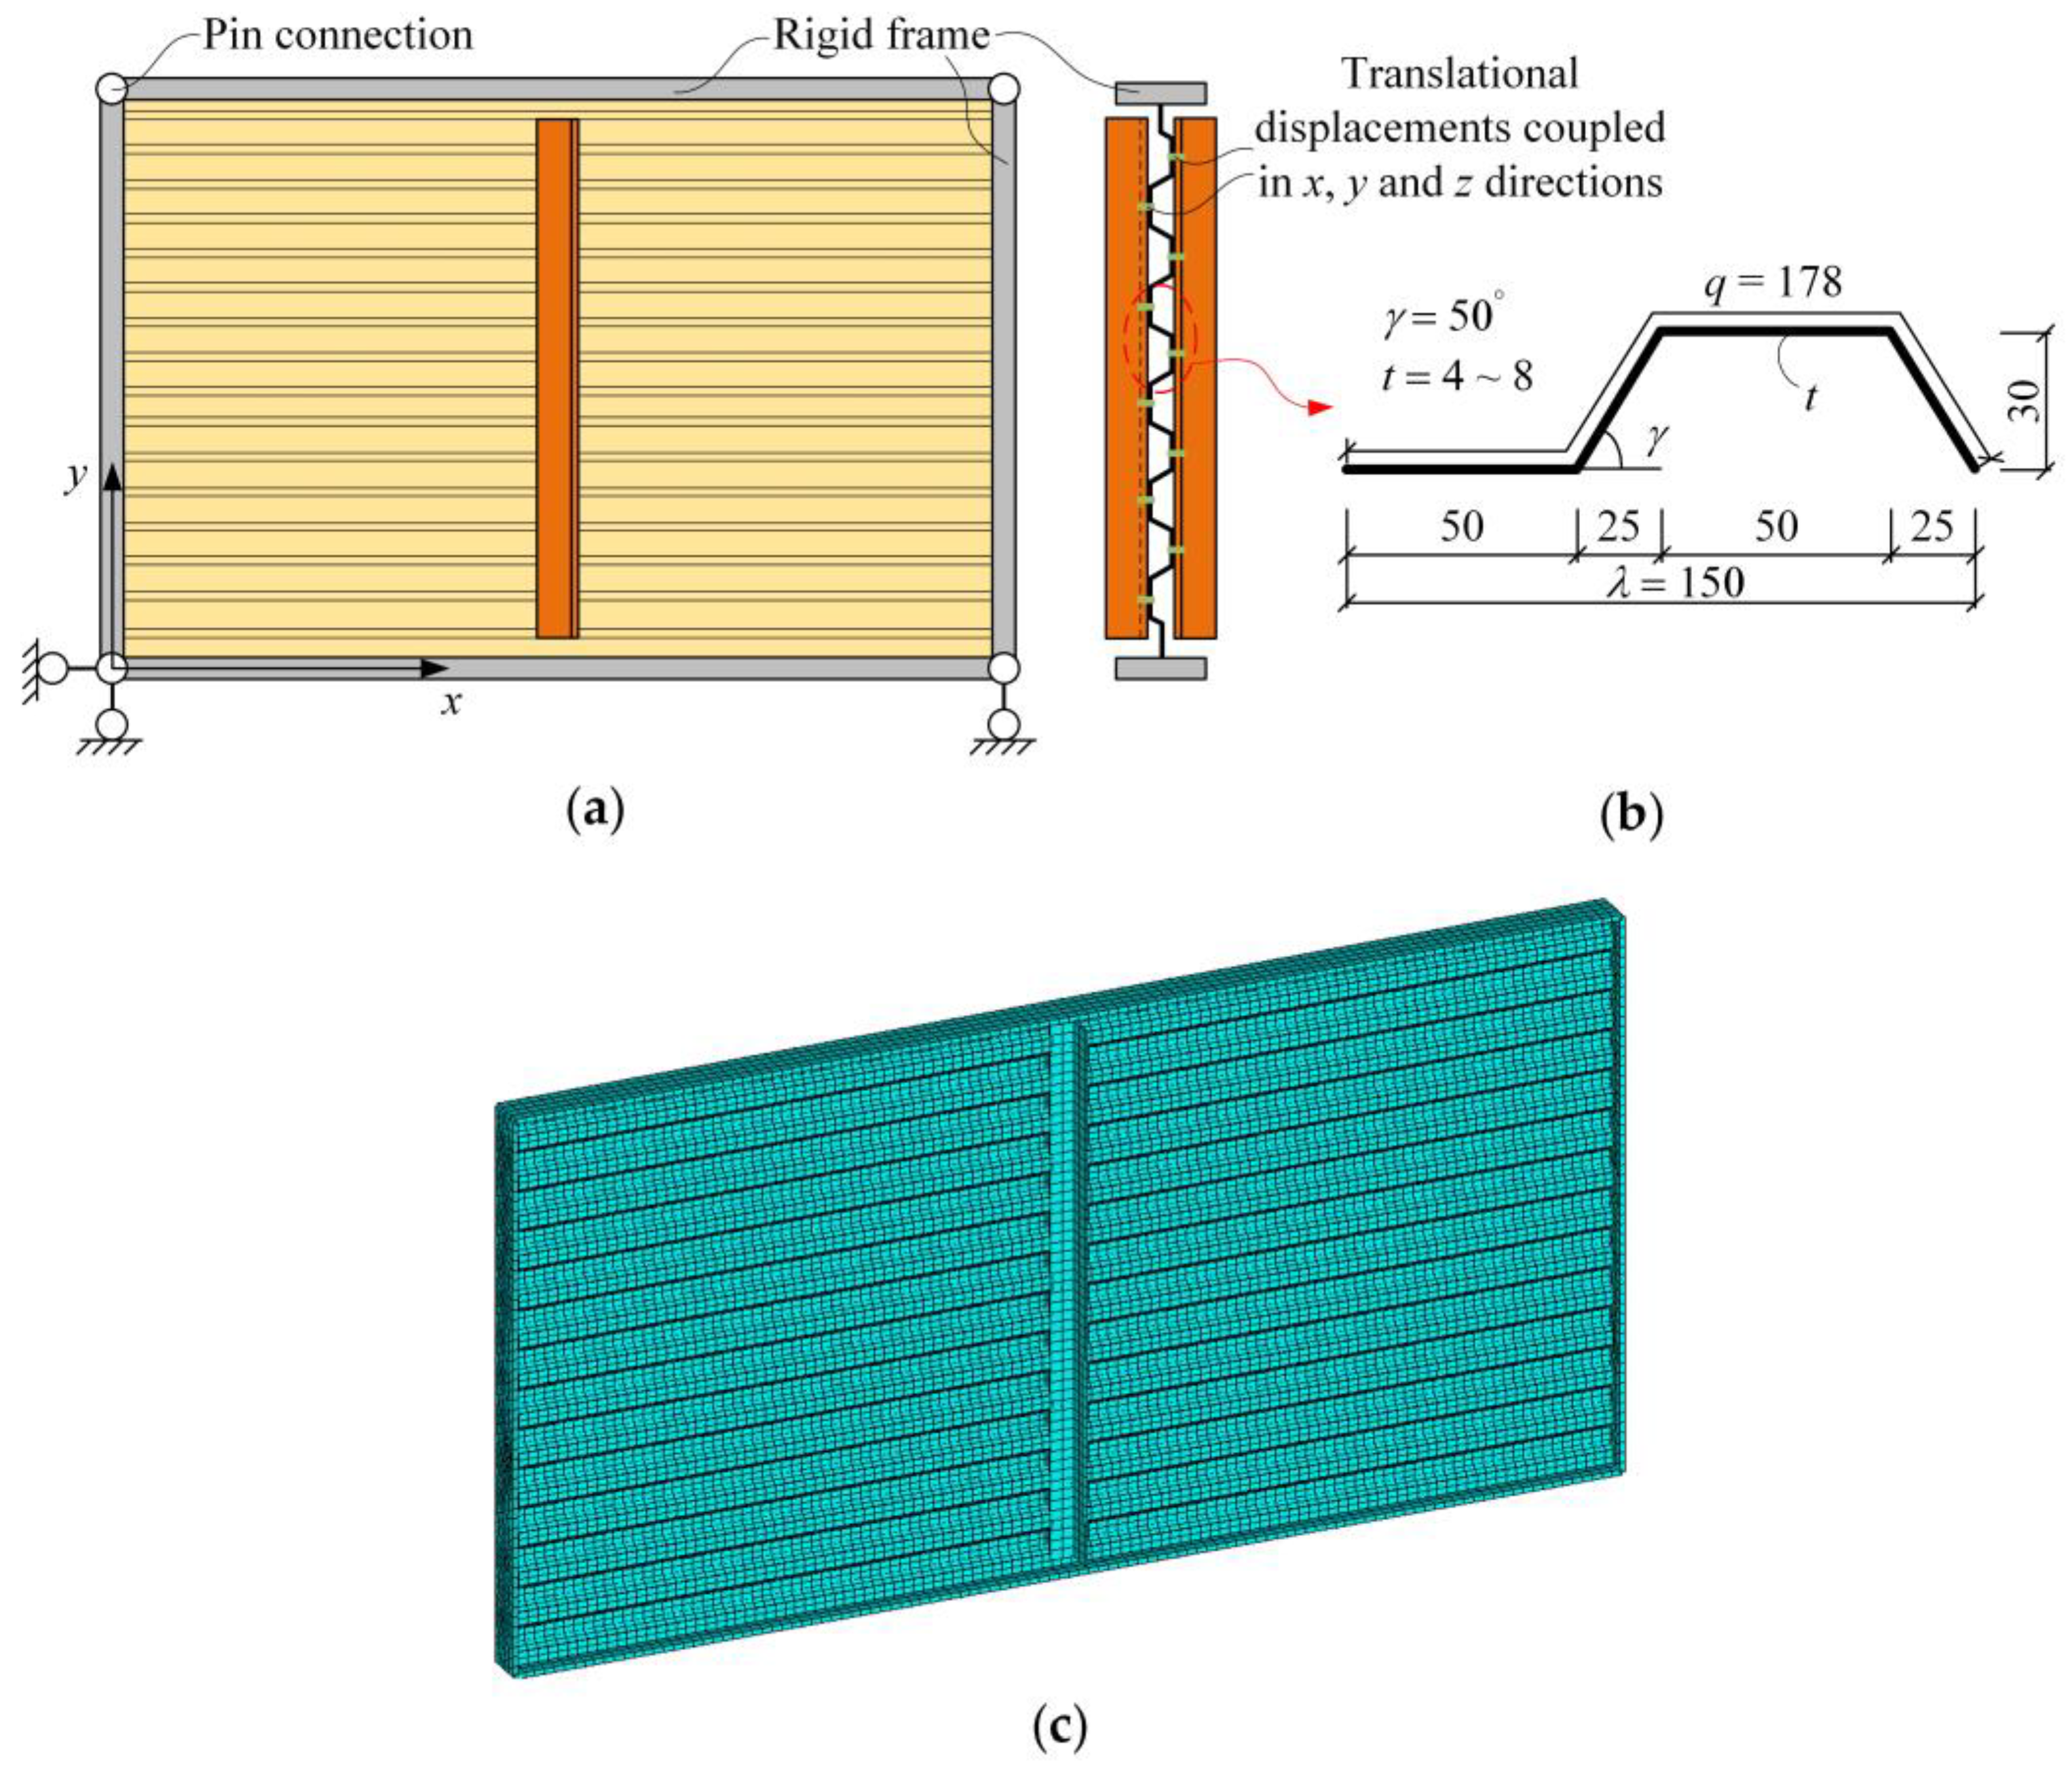
2.1. Introduction of Finite Element Model

The finite element (FE) model for conducting hysteretic analyses of SCSPSWs was established using the software ANSYS 12.1, as depicted in Figure 2. As the stress variation in the thickness direction of the plate was not studied, a shell element, SHELL181, was employed to simulate the infilled corrugated steel plate and boundary frame members to enhance calculation efficiency. Similarly, as the influence of the cross-section shape and local buckling of the stiffener was not studied, the vertical stiffeners were modeled using a beam element BEAM188, with the stiffener cross-section defined as equal-angle steel. To make the results of FE parametric analyses representative, the material properties of the infilled plate and stiffeners were set to ideal elastoplastic without considering the hardening effect of steel. According to material properties specified in the Chinese standard for the design of steel structures GB 50017−2017 [41], Young’s modulus (E) and Poisson’s ratio (υ) of the steel were taken as 206 GPa and 0.3, respectively. The yield stresses (fy) of the infilled corrugated steel and stiffeners were taken as 235 MPa and 355 MPa, respectively. The boundary frame members were set to infinite rigid elements to eliminate the influence of their deformations.
Additionally, beam-to-column joints were set to ideal pin connection by coupling the corresponding nodes to eliminate the contribution of the boundary frame to total shear loads. Hence, the obtained hysteretic responses are only the lateral-resistant and energy-dissipating capacities of the infilled stiffened CSP. Out-of-plane translational degrees of free (DOFs) of four corners of the boundary frame were constrained. In-plane translational DOFs of the two bottom joints of the boundary frame were also constrained. As high-strength bolts were used to connect the infilled plate and vertical stiffeners, the slip at the interface between them was considered negligible. The bolt connection was modeled by coupling three translational DOFs of the corresponding nodes at the bolted location. The torsional DOF with respect to the central axis of the stiffener was restrained to avoid the rigid rotation of the stiffener. Contact interactions were set between the stiffener and the corrugated steel plate in the normal direction. In-plane cyclic shear loads, denoted by N, were applied to the top frame beam. Mesh sensitivity analyses were performed by the authors, and the selected mesh size was proven to possess high accuracy and a reasonable computational cost [42].

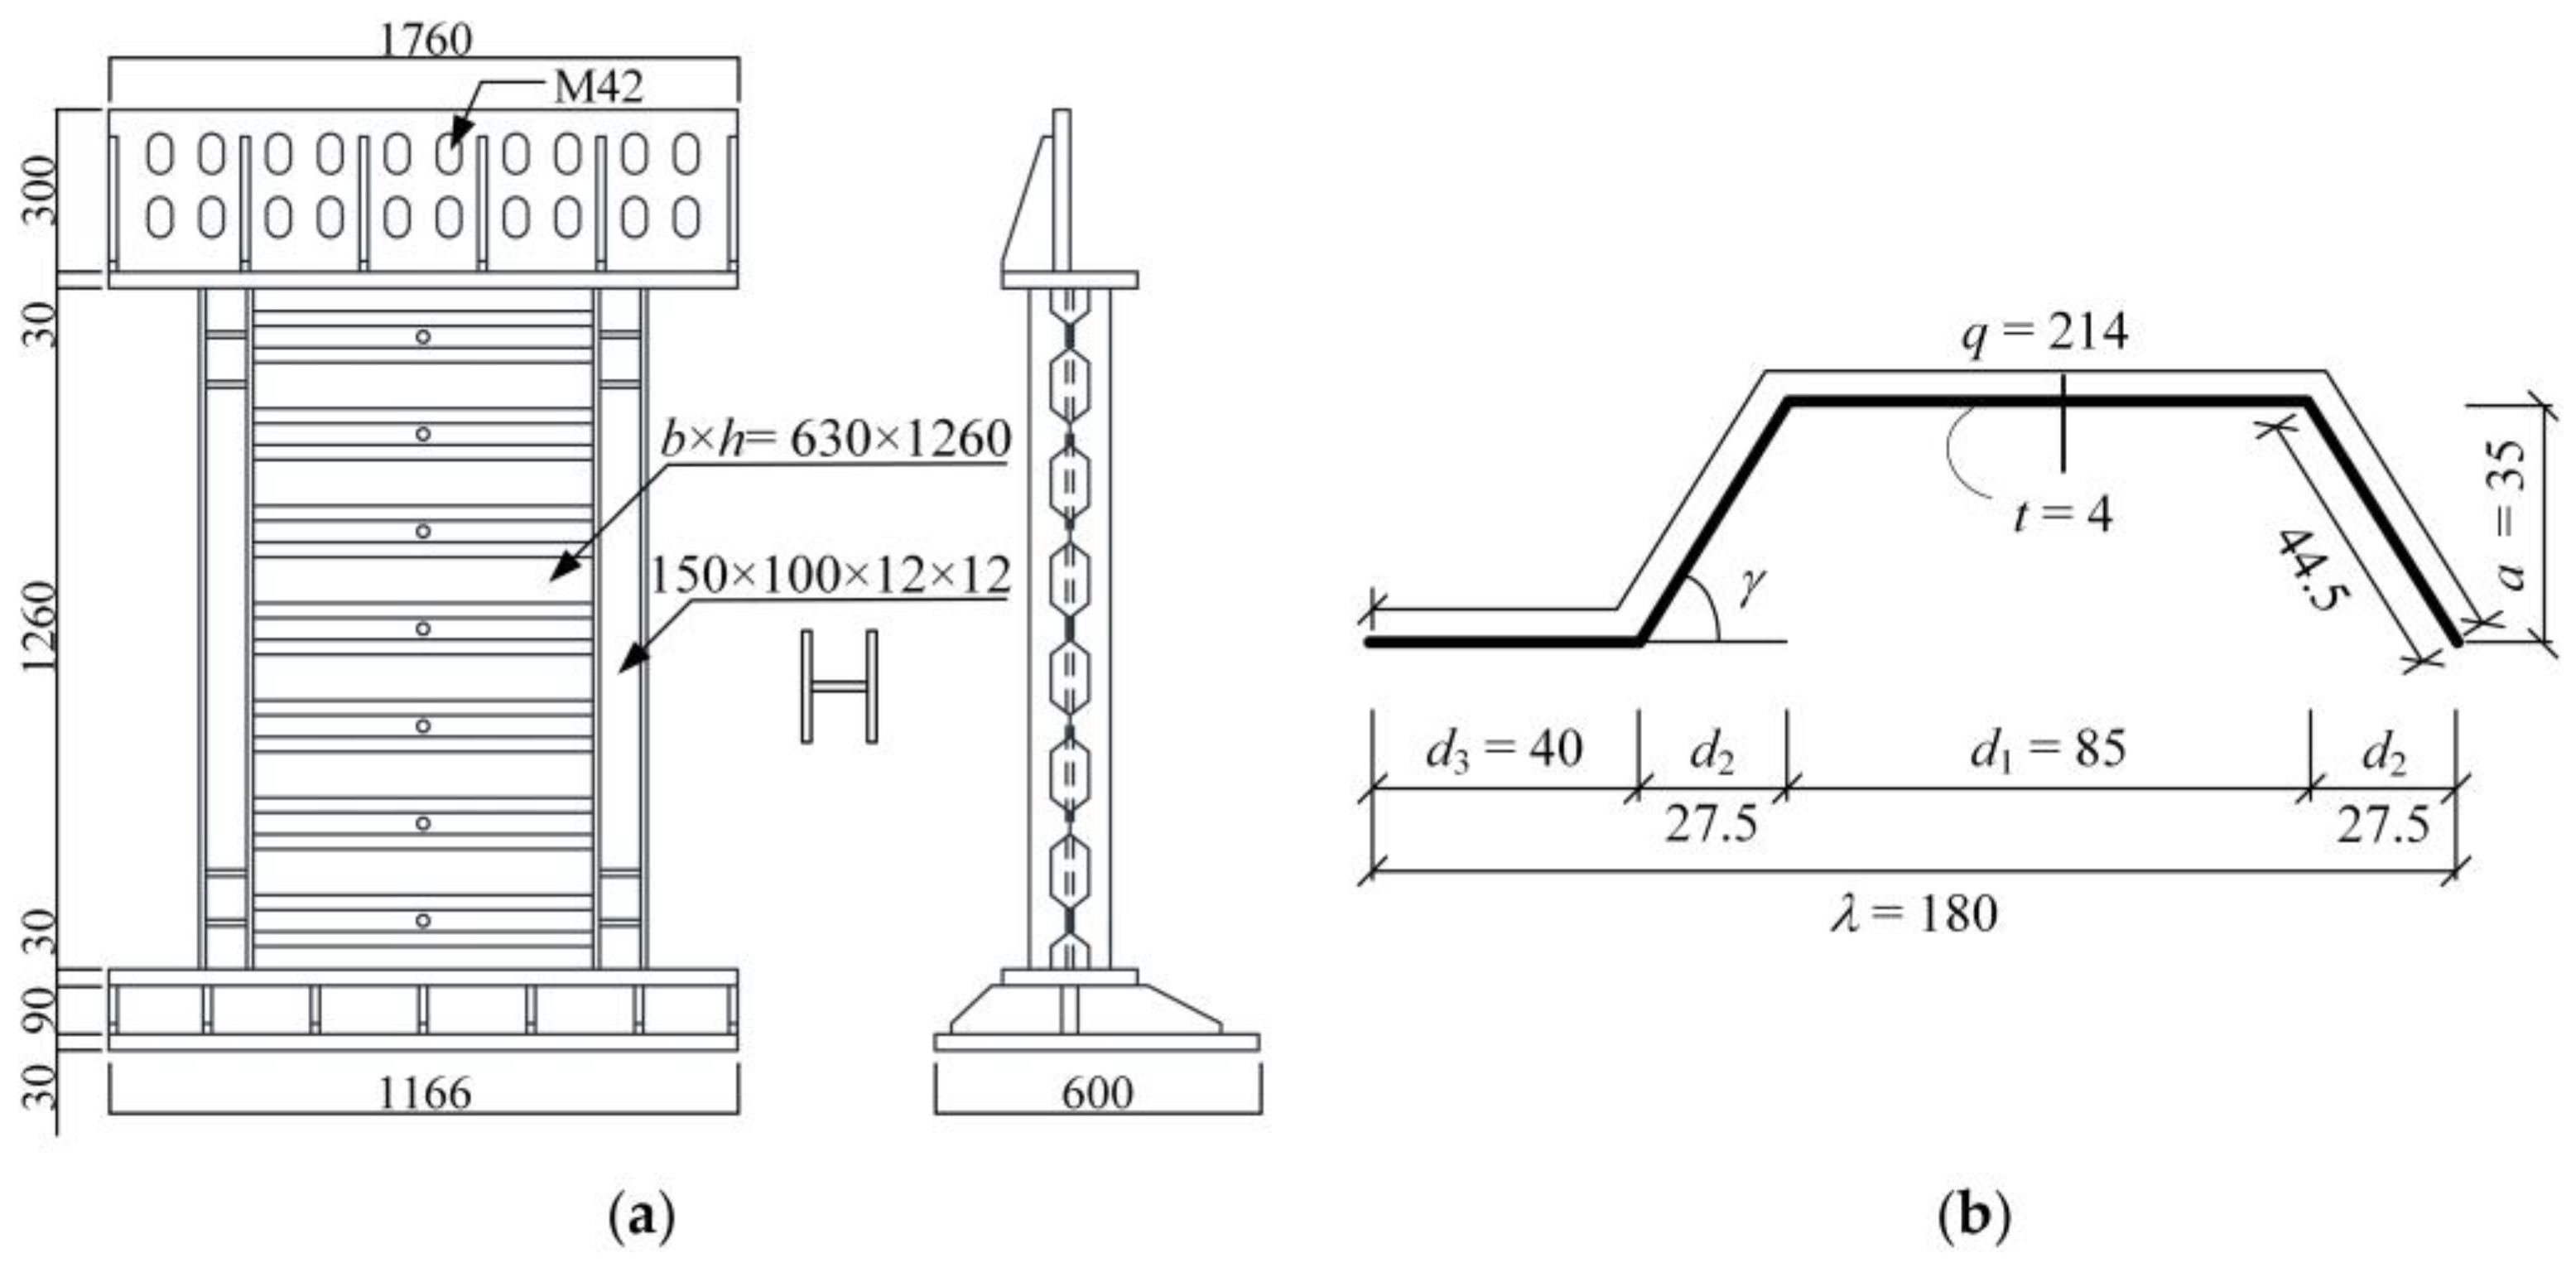
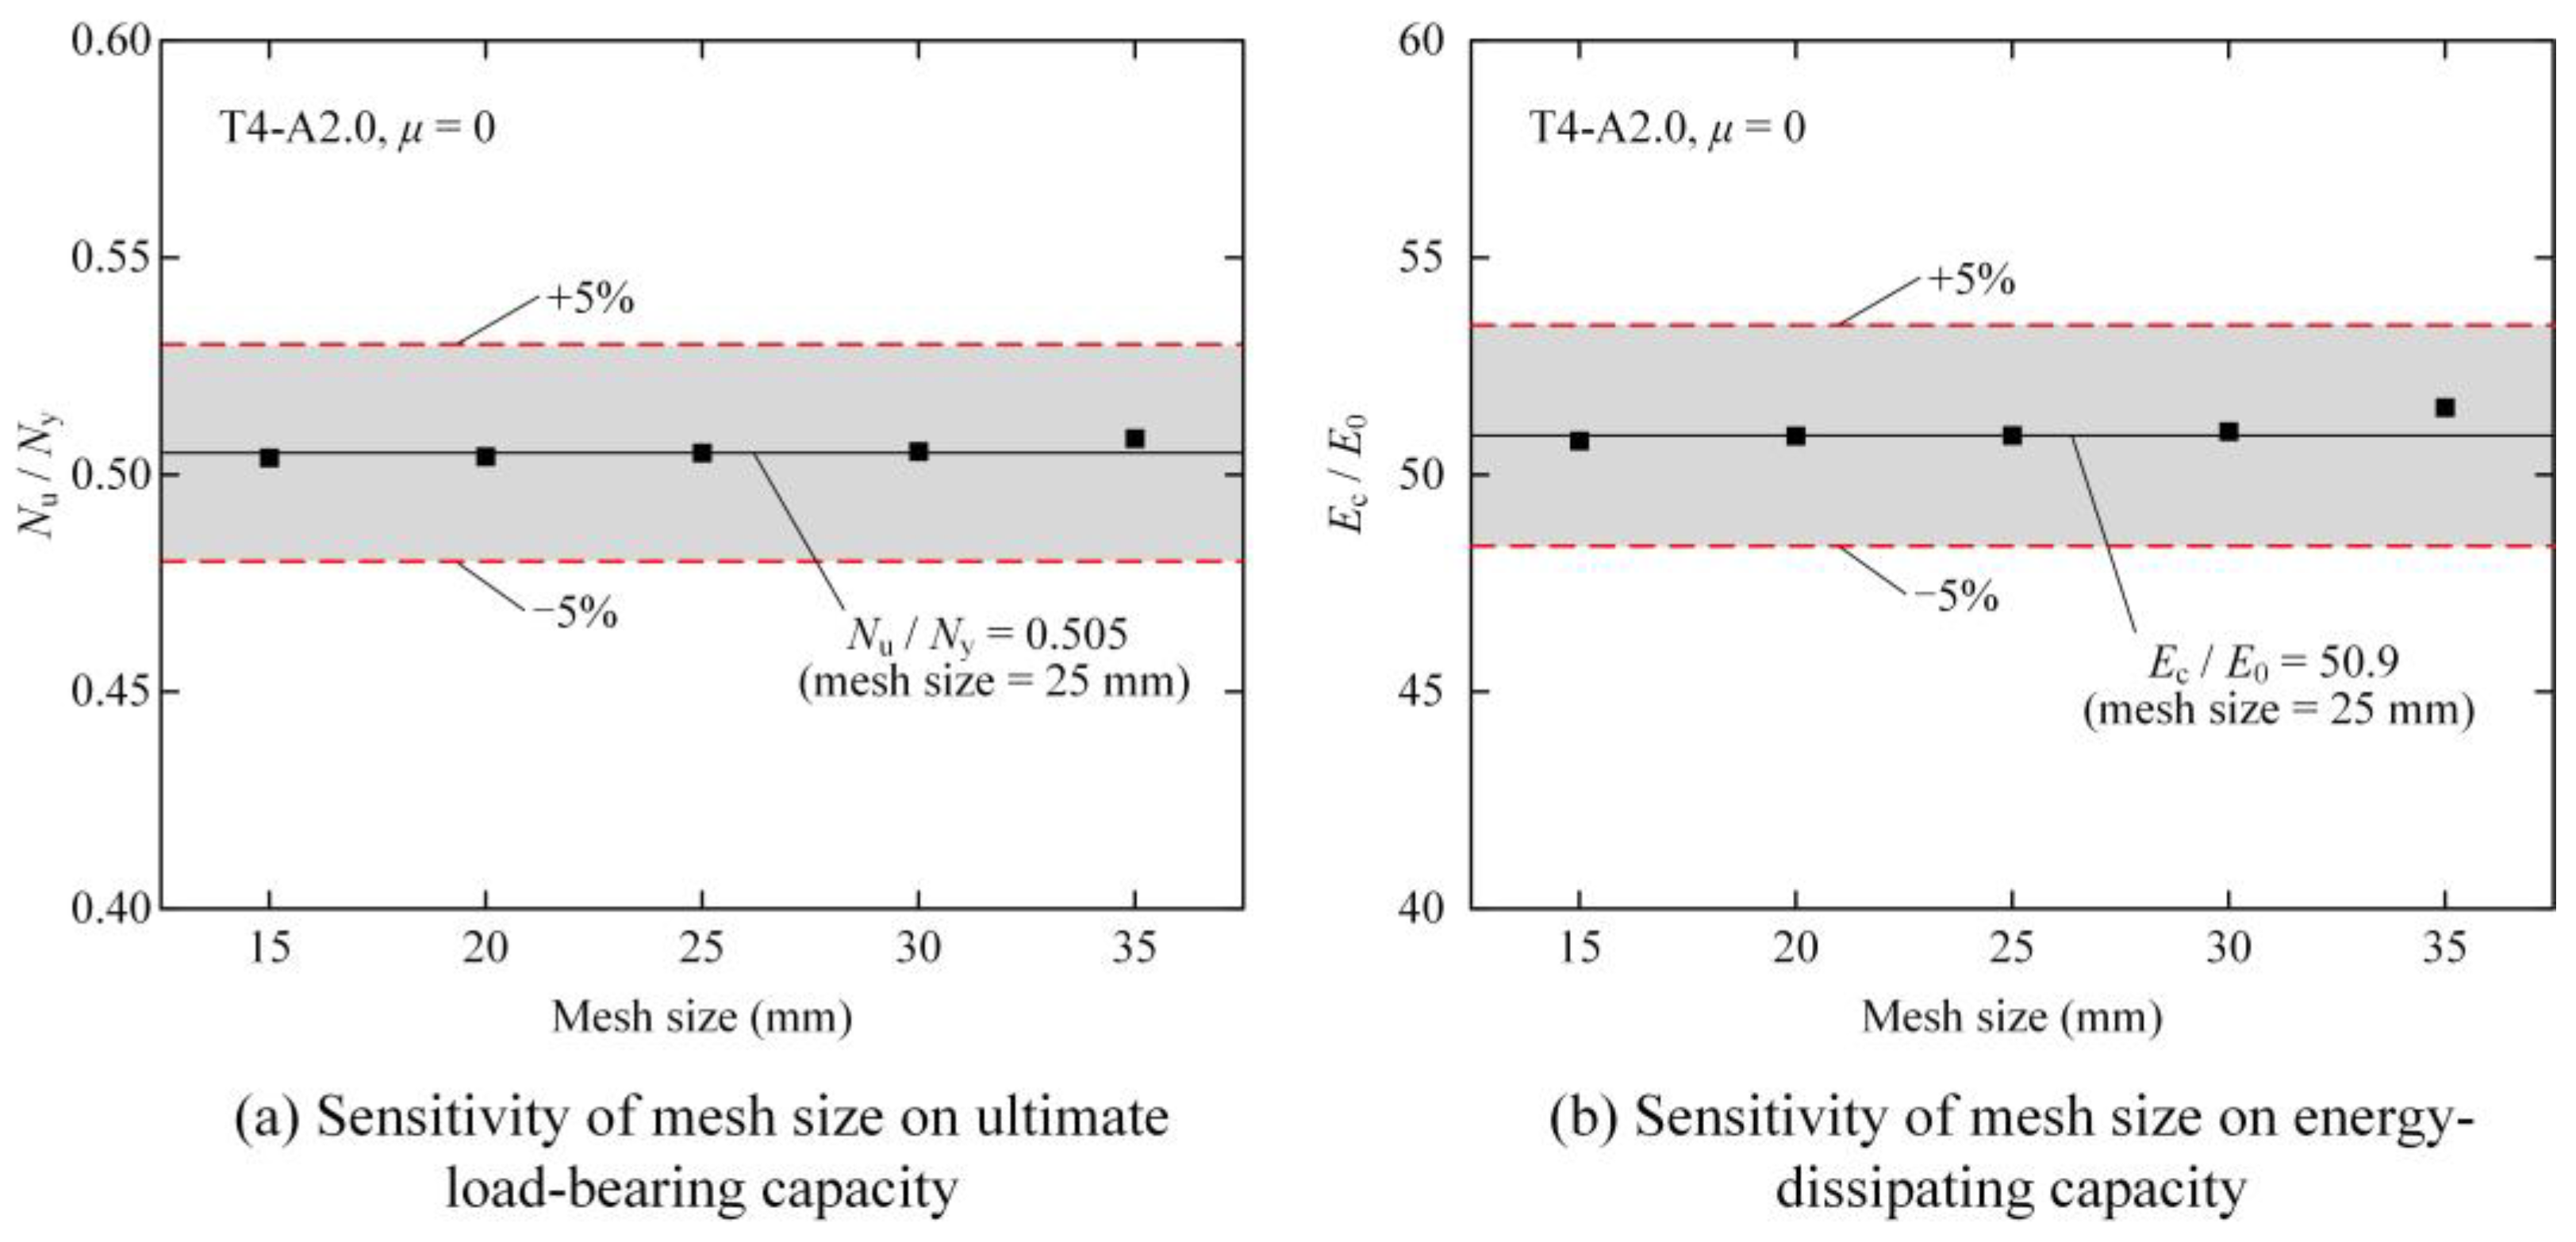
2.2. Verification of Finite Element Model

It is necessary to validate the FE model by comparing the FE results with the existing test results to ensure the accuracy of the following numerical analyses. Tong et al. [43] conducted hysteretic tests on the double-corrugated plate shear wall. The numerical simulation of this test was carried out based on the above FE modeling method. The FE result was compared with the test result to validate the FE model in this study.
The specimen of DCPSW-1 in the test conducted by Tong et al. [43] was simulated through the above FE modeling method. As shown in Figure 3a, the infilled corrugated plate had overall dimensions of 1260 mm × 630 mm, with a plate thickness of 4 mm. The detailed dimensions of the corrugation are shown in Figure 3b. A single row of high-rise bolts was vertically arranged on the corrugated plate at the 1/2 portion of the plate width, providing reliable connections between the two corrugated plates. This particular setup makes it possible to validate the FE model’s capability to simulate high-strength bolted connections through node coupling.
The verification of the FE model is presented in Figure 4, where a comparison is made between the FE results and the corresponding test results. The initial stiffness, ultimate shear resistance, and shape of the hysteretic curves obtained from the FE analysis were similar to those of the test results, as shown in Table 1. This indicated that the numerical analysis method utilized in this study was capable of accurately predicting the hysteretic performance of the CSPSW. Consequently, the FE model employed in this study can be considered reliable and suitable for subsequent numerical analyses.

3. Evaluation of Hysteretic Performance

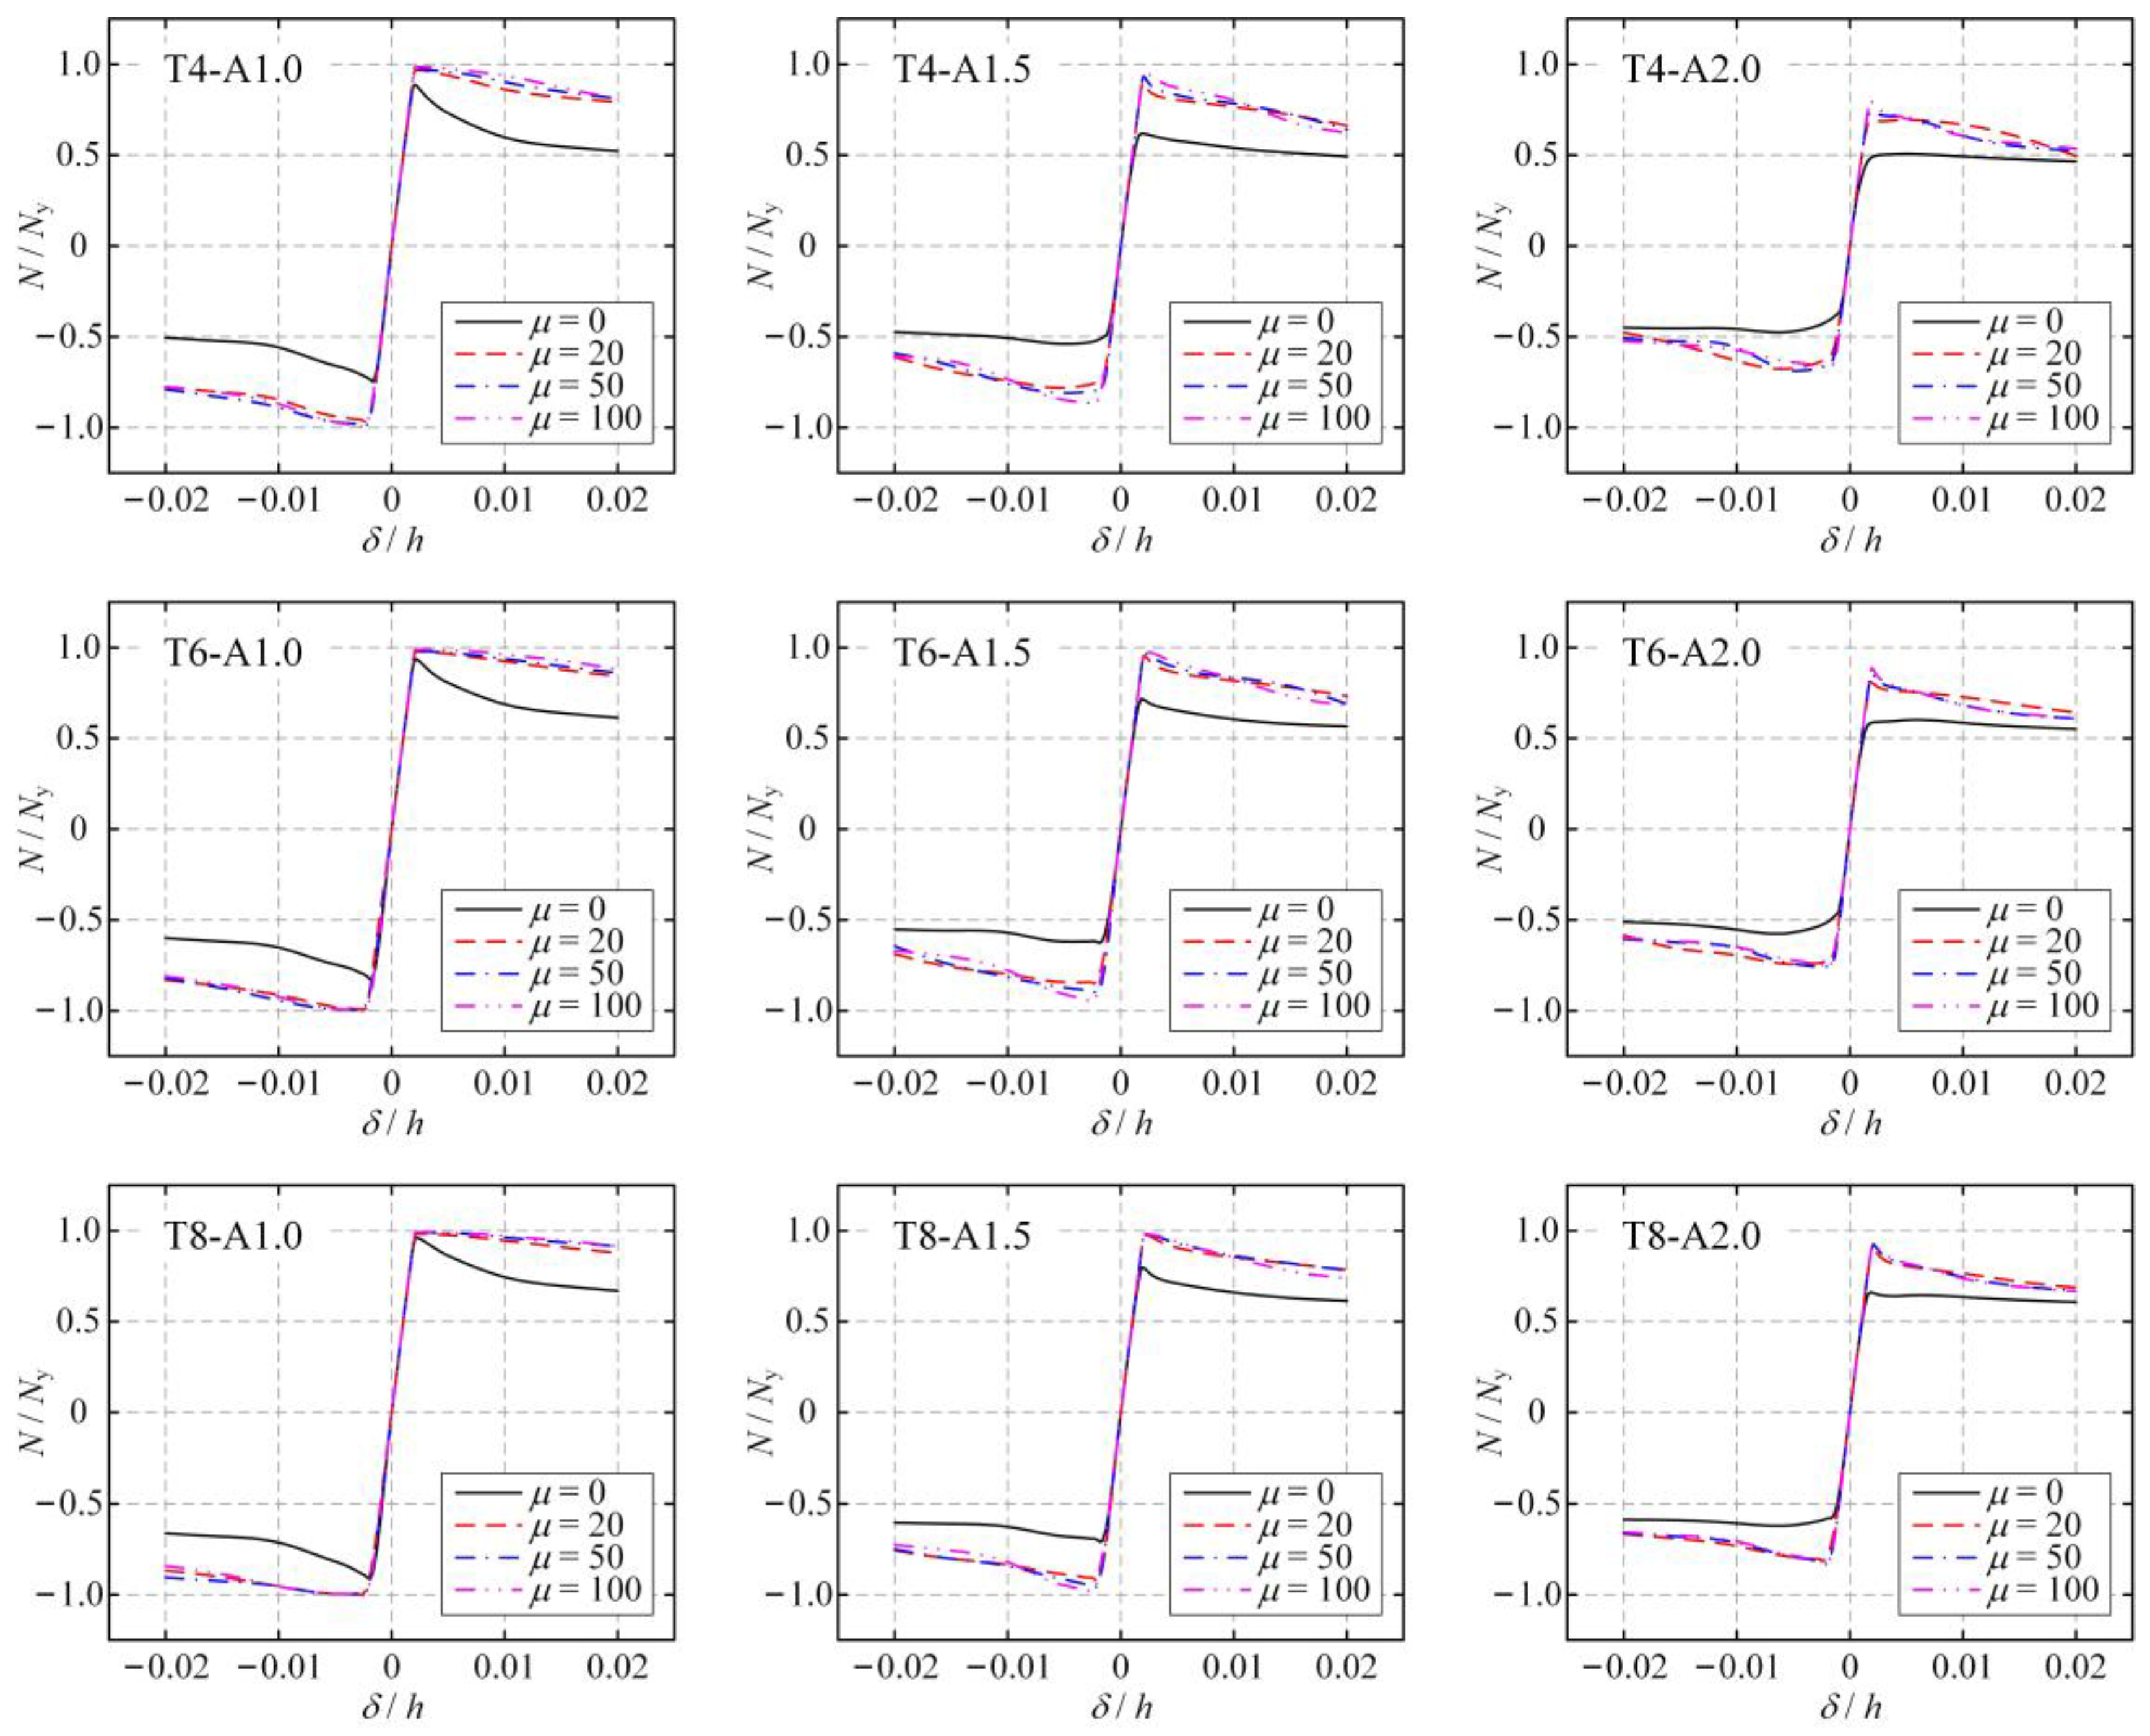
3.1. Hysteretic Curves of FE Models

The models for hysteresis analysis were divided into nine groups, and the specific examples are given in Table 2. The parameter selection in this study aims to uncover the factors influencing the hysteretic performance of the wall and encompasses the parameter range relevant to practical engineering design. Aspect ratio (b/h) and thickness (t), as representative dimensional parameters of CSPs, frequently vary in practical engineering design, making them suitable for parametric investigation. Additionally, the bending rigidity ratio (μ), which plays a crucial role in characterizing the buckling restraint effect of CSPs, is chosen to examine its influence on the hysteretic properties. As shown in Table 2, there were three types of corrugated plate thicknesses, t = 4, 6, and 8 mm, and the aspect (width to height) ratio b/h is 1.0, 1.5, and 2.0, respectively. This is because for a plate with an aspect ratio exceeding 2.0, the out-of-plane deformation is too significant during hysteretic loading, and the pinch effect of hysteretic curves is serious, which is not conducive to energy dissipation and shock absorption. Additionally, the rigidity ratio μ, which is defined as the ratio of bending rigidity of the stiffeners to the plate, was controlled in the range of 0 to 200 by changing the section dimensions of the stiffeners in each example. Each example was assigned a corresponding label for convenient identification. For example, T4–A1.0–R100 represents the example with the plate thickness of t = 4 mm, the aspect ratio of b/h = 1.0, and the rigidity ratio of μ = 100.
Each model is subjected to an initial out-of-plane geometric imperfection consistent with its first elastic buckling mode. The amplitude of the imperfection is set at 1/500 of the plate height. This value is obtained from the authors’ previous measurement of the initial imperfection of actual specimens [29]. Displacement loading is applied to each model, with a horizontal displacement δ imposed on the top boundary beam component. The loading is conducted in four levels, corresponding to inter-story drift ratios of δ/h = ±0.5%, ±1.0%, ±1.5%, and ±2.0%, representing different levels of shear wall displacement in the system.
Mesh condition is essential for the accuracy and efficiency of the FE simulation. Before the numerical analysis, convergence studies were performed to exclude the effect of mesh size. The model T4-A2.0 with μ = 0 was selected for the meshing convergence study. The influence of mesh size variation on the ultimate shear capacity and energy dissipation capacity of the models was investigated, as shown in Figure 5. In Figure 5a, the x-axis represents the mesh size, and the y-axis represents the non-dimensional ultimate shear capacity, Nu/Ny, and the ratio between the ultimate shear capacity (Nu) and shear yield capacity (Ny) of the shear wall. In Figure 5b, the x-axis represents the mesh size, and the y-axis represents the non-dimensional dissipated energy, Ec/E0, the ratio between the cumulative energy-dissipating value (Ec) and elastic energy-dissipating value (E0) of the shear wall. It can be observed that as the mesh size decreases from 35 mm to 15 mm, the non-dimensional ultimate shear load-carrying capacity and non-dimensional dissipated energy decrease by 1.0% and 1.5%, respectively. This indicates that the influence of mesh size variation on the ultimate shear capacity and energy dissipation capacity is minimal within this range. When the mesh size is 25 mm, the error in the computed results is within 5%. Considering the trade-off between accuracy and efficiency, a global mesh size of 25 mm was chosen for the subsequent studies.
The hysteretic curves of Groups 1 to 3 with a plate thickness of t = 4 mm are depicted in Figure 6. In each group, four typical examples with the rigidity ratio of μ = 0, 20, 50, and 100 were selected to exhibit. It could be seen that for examples with the same rigidity ratio, the ultimate shear-bearing capacity gradually decreases, and the pinch effect of hysteretic curves becomes more serious as the aspect ratio increases. For example, with the same aspect ratio, as the rigidity ratio increases, i.e., the bending rigidity of the stiffeners increases, the ultimate shear-bearing capacity gradually increases, and the hysteretic curves become more plump.
The hysteretic curves of Groups 4 to 6 with a plate thickness of t = 6 mm are depicted in Figure 7. In each group, four typical examples with a rigidity ratio of μ = 0, 20, 50, and 100 were selected to exhibit. Similar to the calculation results of examples with a plate thickness of t = 4 mm, for the example with the same rigidity ratio, the ultimate shear-bearing capacity gradually decreased, and the pinch effect of hysteretic curves became more serious as the aspect ratio increased. For the example with the same aspect ratio, as the rigidity ratio increased, the ultimate shear-bearing capacity gradually increased, and the hysteretic curves became more plump. Particularly, for the case with an aspect ratio of b/h = 1.0 and a rigidity ratio of μ = 100, the ultimate load-bearing state was close to the yield of the full section, and accordingly, the hysteretic curves were quite plump.
Similarly, the hysteretic curves of Groups 7 to 9 with a plate thickness of t = 8 mm are depicted in Figure 8. In each group, four typical examples with a rigidity ratio of μ = 0, 20, 50, and 100 were selected to exhibit. In this situation, for the examples with an aspect ratio of b/h = 1.0 and vertical stiffeners arranged, the ultimate load-bearing state was close to the full-sectional yield, and the hysteretic curves exhibited quite a plump shape. However, for the examples with aspect ratios of b/h = 1.5 and 2.0, the hysteretic curves still exhibited a significant pinch effect.

3.2. Deflection and Stress Distributions

3.2.1. Effect of Aspect Ratio

To study the hysteretic performance of SCSPSWs with different aspect ratios, the out-of-plane displacement and stress distribution of typical examples in the final state of the hysteresis process were compared, as shown in Figure 9 and Figure 10. Among them, Figure 9 shows the examples with the rigidity ratio of μ = 0, corresponding to the models without stiffeners. As shown in Figure 9, the examples with b/h = 1.0, 1.5, and 2.0 were compared, corresponding to Points A1, A2, and A3 in Figure 6. According to the out-of-plane displacement distribution of each example, it could be seen that the corrugated steel plate had an oblique buckling mode throughout the whole width direction, and the number of buckling waves in the vertical direction decreased with the increase in the aspect ratio. According to the von Mises stress distribution of each example, it could be seen that the corrugated steel plate essentially reached the full-sectional yield state at the final state of the hysteresis process.
Similarly, Figure 10 shows the examples with a rigidity ratio of μ = 50. As shown in Figure 10, the examples with b/h = 1.0, 1.5, and 2.0 were compared, corresponding to Points B1, B2, and B3 in Figure 6. According to the out-of-plane displacement distribution of each example, the buckling waves of the infilled corrugated plate were effectively separated using vertical stiffeners and occurred in two sub-panels, leading to a sub-panel buckling mode. This indicated that the rigidity ratio of μ = 50 could provide enough out-of-plane buckling constraints to the corrugated plate. According to the von Mises stress distribution of each example, it could be seen that the corrugated steel plate essentially reached the full-sectional yield state at the final state of the hysteresis process. The stress distribution near the stiffener was complicated due to the local bolt connection.

3.2.2. Effect of Stiffener Rigidity

To further study the hysteretic performance of SCSPSWs with different bending rigidities of stiffeners, the out-of-plane displacement and stress distribution of typical examples in the final state of the hysteresis process were compared, as shown in Figure 11. All three examples had the same aspect ratio of b/h = 1.0, and the rigidity ratios are μ = 0, 50, and 100, respectively, corresponding to Points C1, C2, and C3 in Figure 7. For the examples with μ = 0, no stiffener was applied to the corrugated steel plate. Accordingly, there was no out-of-plane displacement constraint on the plate, and the buckling mode consisted of the global waves that ran through the horizontal direction of the whole plate. As the rigidity ratio was μ = 50, it could be seen that the out-of-plane displacements decreased obviously at the location of stiffeners, and the buckling waves showed a tendency to be separated into the two sub-panels. As the rigidity ratio was μ = 100, the out-of-plane displacements at the location of stiffeners were quite small. It could be considered that the out-of-plane displacements of the plate have been effectively restrained in this case.

3.2.3. Effect of Plate Thickness

Furthermore, the out-of-plane displacement and stress distribution of examples with plate thicknesses of t = 4, 6, and 8 mm were compared to study the hysteretic performance of SCSPSWs with different plate thicknesses, as shown in Figure 12. All three examples had the same aspect ratio of b/h = 1.5 and the same rigidity ratio of μ = 100. The plate thickness of t = 4, 6, 8 mm corresponded to Point D1 in Figure 6, D2 in Figure 7, and D3 in Figure 8, respectively. As shown in the distribution of the out-of-plane displacement, the stability and load-bearing capacity of the shear wall gradually increased, and the out-of-plane displacement amplitude decreased obviously. Meanwhile, for these three examples, the bending rigidity of the stiffeners could be regarded as large enough, and the stiffeners could effectively restrain the out-of-plane displacements at the location of the stiffeners. The buckling waves were separated into the zones of two sub-panels, and the sub-panel buckling modes occurred.

3.3. Skeleton Curves and Secant Stiffness Developments

Based on the hysteretic curves of examples given in Figure 6, Figure 7 and Figure 8, the skeleton curves of each example under the hysteresis loading process were obtained, as shown in Figure 13. The horizontal coordinate of the skeleton curve is the drift ratio δ/h of the shear wall, and the vertical coordinate of the skeleton curve is the non-dimensional shear capacity N/Ny. Four typical examples with the rigidity ratios of μ = 0, 20, 50, and 100 were taken to draw skeleton curves.
As shown in Figure 13, applying stiffeners had a significant impact on the skeleton curves of the corrugated plate. For the shear wall without stiffeners, the shear capacities corresponding to the two ultimate displacement points were low. These values were significantly improved as the stiffeners were arranged, even if the rigidity ratio is μ = 20. In this situation, further increasing the rigidity ratio to μ = 50 or 100 had no significant effect on the skeleton curves.
For the hysteretic curves of each example, the slope of the line between the final state point of each loading level and the coordinate origin was defined as secant stiffness, denoted by Ks. The slope of the initial segment of the hysteretic curves was defined as initial rigidity, denoted by K0, as shown in Figure 14. The development of the secant stiffness during the loading process would largely determine the hysteretic performance of the model. For the calculation results of each hysteresis example given in Table 2, the comparison of the secant stiffness curves is shown in Figure 15. The horizontal coordinate of the secant stiffness curve is the amplitude value of the drift ratio, and the vertical coordinate of the skeleton curve is the non-dimensional secant stiffness value Ks/K0. It could be seen that the secant stiffness curves presented an overall trend of decline as the aspect ratio increased, whereas the secant stiffness curves showed an increasing trend as the plate thickness increased. For the example with the same aspect ratio and thickness of the plate, secant stiffness increased with the increase in the rigidity ratios, indicating that the out-of-plane constraints had a positive effect on the hysteretic properties of the shear wall. In addition, it could be observed that the secant stiffness corresponding to the rigidity ratio of μ = 20 was significantly larger than that corresponding to the rigidity ratio of μ = 0. However, further increasing the rigidity ratio had little effect on the improvement of the secant stiffness of the shear wall.

4. Design Recommendations

In the prior research, the transition rigidities corresponding to elastic buckling and shear-resistant behaviors were defined as μ0,e and μ0,p, respectively. In this study, the transition rigidity ratio μ0,h was proposed to describe the hysteretic performances and provide valuable design recommendations for practical engineering design.
The results of the above section indicated that the out-of-plane restraining effect of the stiffeners on the corrugated steel plate had a positive impact on the hysteretic performance of the SCSPSW. An important parameter to measure the hysteretic performance of a structural system is the energy-dissipating value, which is defined as the area enclosed by the hysteretic curves. Based on the hysteretic curves of examples given in Table 2, skeleton curves of each example under the hysteresis loading process were obtained, as shown in Figure 13.
For the calculation results of each hysteresis example given in Table 2, the corresponding energy-dissipating values were obtained. The correlation between the cumulative energy-dissipating value Ec and the rigidity ratio μ is shown in Figure 16. The vertical coordinate is non-dimensional dissipated energy Ec/E0, in which E0 is the elastic energy-dissipating value of a structural system, defined as
E 0 = 1 2 N y δ y
where Ny is the shear yield capacity of the shear wall, and δy is the horizontal displacement corresponding to the yield of the material.
As shown in Figure 16, the cumulative dissipated energy value gradually increases with the increase in the rigidity ratio and tends to stabilize as the rigidity ratio becomes large. The maximum value of cumulative dissipated energy in the range of μ = 0 to 200 is denoted by Ec,max, which could approximately represent the maximum energy-dissipating capacity obtained through the SCSPSW with the varying rigidity ratios. When the dissipated energy value reaches 95% of the maximum cumulative dissipated energy (Ec = 0.95Ec,max), the corresponding rigidity ratio is defined as the hysteretic transition rigidity ratio of the SCSPSW (μ0,h), as shown in Figure 17. It can be observed that as the rigidity ratio exceeds μ = 50, the cumulative energy-dissipating value no longer changes significantly but is essentially equivalent to the maximum cumulative dissipated energy. Therefore, the hysteretic transition rigidity ratio of the SCSPSW could be approximately determined as μ0,h = 50.
Figure 18 shows the validation of the recommended value for the hysteretic transition rigidity ratio. Each bar in the chart represents a specific example, and its value denotes the ratio between the cumulative dissipated energy (Ec) and the maximum cumulative dissipated energy (Ec,max). It can be found that almost all of the nine sets of examples meet the criterion of Ec ≥ 0.95Ec,max. For two examples with a plate thickness of t = 4 mm (aspect ratio of b/h = 1.0 and 1.5, respectively), the ratios of Ec to Ec,max were 94% and 87%, respectively, which could be considered to be approximately meet the definition given in Figure 17. In summary, it is reasonable to define the transition rigidity ratio corresponding to the hysteretic performance of the SCSPSW as μ0,h = 50. In engineering practice, it is recommended to properly select the section size of the stiffener to ensure that the bending rigidity of the stiffener is higher than the transition rigidity and that the system has excellent energy-dissipating capacity.

5. Conclusions

This study focused on numerically investigating the shear hysteretic performances of horizontally placed stiffened corrugated steel plate shear walls (SCSPSWs) with vertical stiffeners. The hysteretic performances of 81 finite element (FE) examples under cycle loads were analyzed. The effects of the aspect ratio of the plate, the plate thickness, and the bending rigidity of stiffeners on the hysteretic performances of the SCSPSW were indicated. Based on the research results, the design recommendations were provided for the engineering application of the SCSPSW. The following conclusions are drawn:
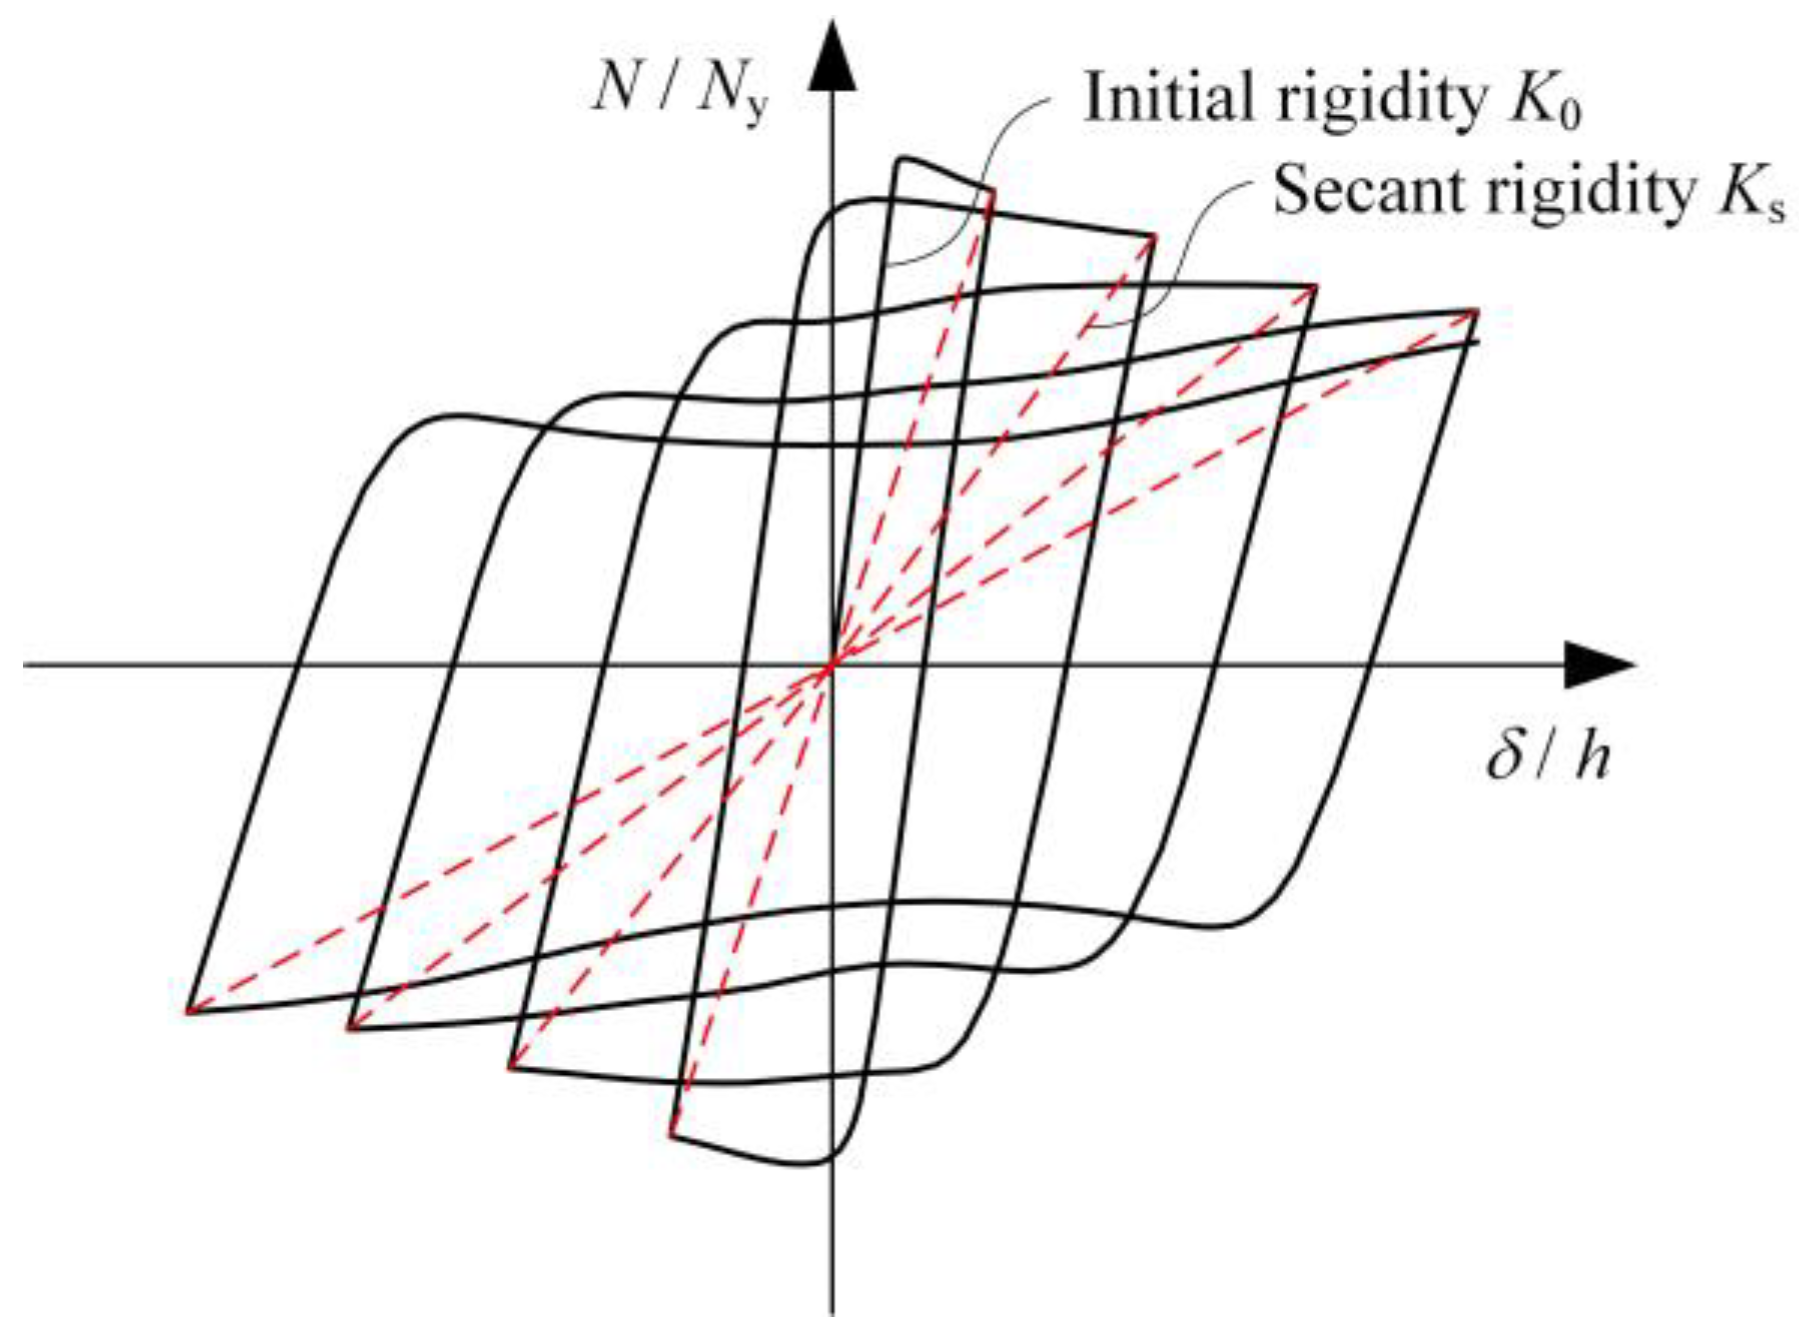
  • The out-of-plane restraining effect of the stiffeners on the corrugated steel plate has a positive impact on the hysteretic performance of the SCSPSW. With the increase in the stiffener rigidity, the SCSPSW has higher ultimate load-bearing capacities, more plump hysteretic curves, and higher secant rigidities. The application of stiffeners has a notable influence on the skeleton curves and secant rigidities of the corrugated steel plate shear wall. With the arrangement of stiffeners on the plate and a rigidity ratio of μ = 20, there is a significant enhancement observed in the skeleton curves and secant rigidities. Beyond this rigidity ratio, further increases no longer yield substantial effects on the skeleton curves.
  • The SCSPSW exhibits improved hysteretic performances, including higher stability and more plump hysteretic curves, as the aspect ratio decreases or the corrugated plate thickness increases. Notably, when the aspect ratio is large, or the corrugated thickness is small, the addition of stiffeners significantly influences the hysteretic performances of the SCSPSW.
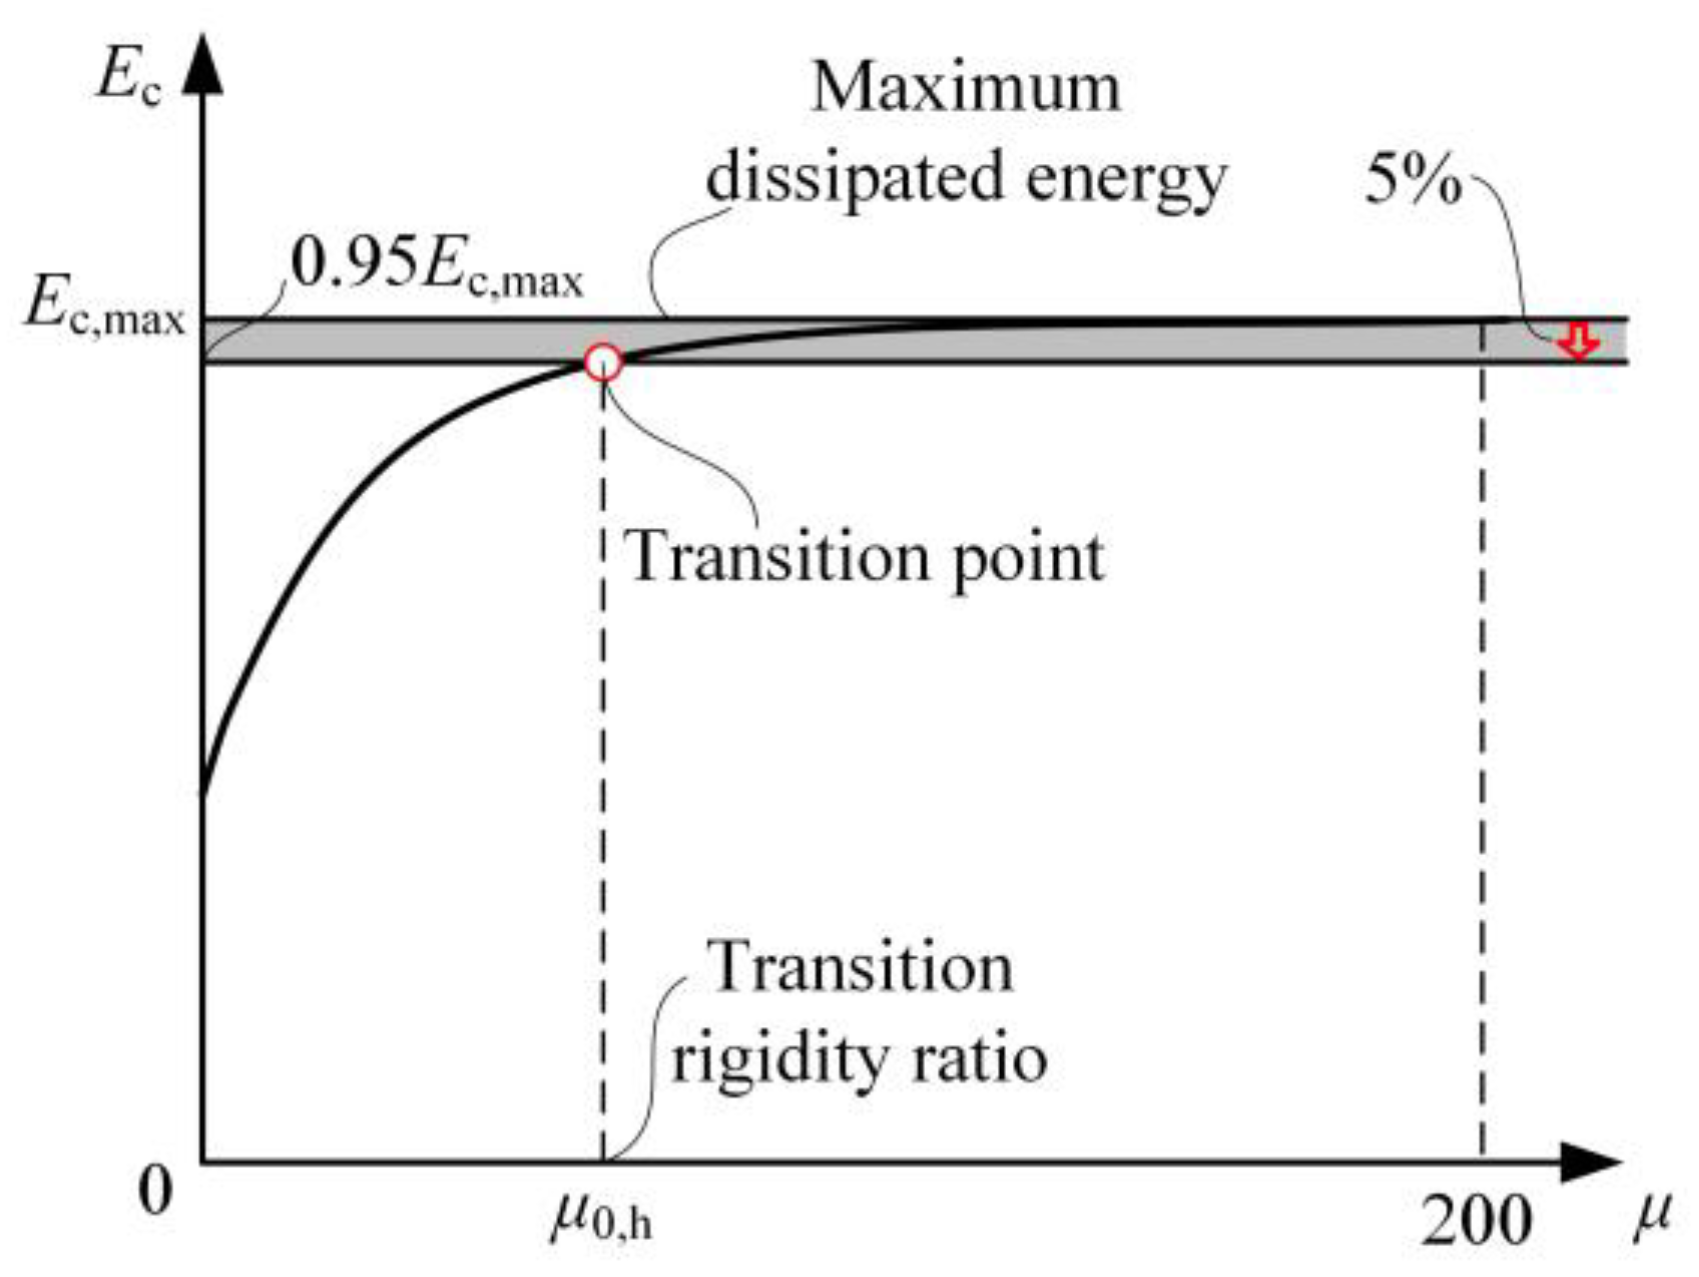
  • The cumulative dissipated energy increases with an increase in the rigidity ratio and tends to be stable as the rigidity is large. When the rigidity ratio exceeds 100, the cumulative energy remains constant approximately. By calculating the transition rigidity ratio values of different model groups, a transition value of μ0,h = 50 is recommended. When μ = 50, nearly all of these model groups could achieve 95% of the corresponding maximum dissipated energy Ec,max, and the model group with the least percentage still achieves 87% of Ec,max when μ = 50. Hence, in engineering practice, it is recommended to use stiffeners with a rigidity ratio of μ ≥ 50 to ensure desirable energy-dissipating capacity in SCSPSW.

Author Contributions

Conceptualization, R.W. and J.T.; methodology, Z.H. and J.T.; software, R.W. and J.T.; validation, R.W.; formal analysis, Z.H.; investigation, R.W. and J.T.; resources, J.T.; data curation, Z.H. and J.T.; writing—original draft preparation, R.W.; writing—review and editing, Z.H. and J.T.; supervision, Z.H. and J.T.; project administration, J.T.; funding acquisition, J.T. All authors have read and agreed to the published version of the manuscript.

Funding

The study has been supported by research grants from the National Natural Science Foundation of China (52108180).

Data Availability Statement

All data of this study are available upon reasonable request to the corresponding author. The data are not publicly available due to privacy.

Conflicts of Interest

The authors declare that they have no known competing financial interests or personal relationships that could have appeared to influence the work reported in this paper.

References

  1. Di Sarno, L.; Manfredi, G. Experimental tests on full-scale RC unretrofitted frame and retrofitted with buckling-restrained braces. Earthq. Eng. Struct. D 2012, 41, 315–333. [Google Scholar] [CrossRef]
  2. Saingam, P.; Matsuzaki, R.; Nishikawa, K.; Sitler, B.; Terazawa, Y.; Takeuchi, T. Experimental dynamic characterization of friction brace dampers and application to the seismic retrofit of RC buildings. Eng. Struct. 2021, 242, 112545. [Google Scholar] [CrossRef]
  3. Nie, J.G.; Zhu, L.; Fan, J.S.; Mo, Y.L. Lateral resistance capacity of stiffened steel plate shear walls. Thin Wall Struct. 2013, 67, 155–167. [Google Scholar] [CrossRef]
  4. Tong, J.Z.; Wang, L.Q.; Hou, J.; Li, Q.H.; Xu, S.L.; Tong, G.S. Flexural design of restraining panels in buckling-restrained steel plate shear walls considering high-order buckling modes. Thin Wall. Struct. 2023, 184, 110488. [Google Scholar] [CrossRef]
  5. Yu, C.Q.; Tong, G.S.; Tong, J.Z.; Zhang, J.W.; Li, X.G.; Xu, S.L. Experimental and numerical study on seismic performance of L-shaped multi-cellular CFST frames. J. Constr. Steel Res. 2024, 213, 108360. [Google Scholar] [CrossRef]
  6. Pan, W.H.; Wang, C.M.; Zhang, H. Matrix Method for Buckling Analysis of Frames Based on Hencky Bar-Chain Model. Int. J. Struct. Stab. Dyn. 2019, 19, 1950093. [Google Scholar] [CrossRef]
  7. Wang, C.M.; Pan, W.H.; Zhang, J.Q. Optimal Design of Triangular Arches against Buckling. J. Eng. Mech. 2020, 146, 4020059. [Google Scholar] [CrossRef]
  8. Dou, C.; Xie, C.; Wang, Y.; Yang, N. Cyclic loading test and lateral resistant behavior of flat-corrugated steel plate shear walls. J. Build. Eng. 2023, 66, 105831. [Google Scholar] [CrossRef]
  9. Chen, Y.L.; Tong, J.Z.; Li, Q.H.; Xu, S.L.; Gao, W.; Liu, X. Flexural behavior of novel profiled steel-UHTCC assembled composite bridge decks. J. Constr. Steel Res. 2024, 212, 108258. [Google Scholar] [CrossRef]
  10. Shimizu, N.; Kanno, R.; Ikarashi, K.; Sato, K.; Hanya, K. Cyclic Behavior of Corrugated Steel Shear Diaphragms with End Failure. J. Struct. Eng. 2013, 139, 796–806. [Google Scholar] [CrossRef]
  11. Tian, H.W.; Li, Y.Q.; Yu, C. Testing of steel sheathed cold-formed steel trussed shear walls. Thin Wall. Struct. 2015, 94, 280–292. [Google Scholar] [CrossRef]
  12. Zhang, W.Y.; Mahdavian, M.; Li, Y.Q.; Yu, C. Experiments and Simulations of Cold-Formed Steel Wall Assemblies Using Corrugated Steel Sheathing Subjected to Shear and Gravity Loads. J. Struct. Eng. 2017, 143. [Google Scholar] [CrossRef]
  13. Vigh, L.G.; Liel, A.B.; Deierlein, G.G.; Miranda, E.; Tipping, S. Component model calibration for cyclic behavior of a corrugated shear wall. Thin Wall. Struct. 2014, 75, 53–62. [Google Scholar] [CrossRef]
  14. Yu, Y.J.; Hu, C.J.; Zhao, F.T.; Jiang, L.Z. Research on the specially-shaped corrugated steel plate shear walls with horizontal corrugation. J. Constr. Steel Res. 2022, 188, 107012. [Google Scholar] [CrossRef]
  15. Wang, W.; Ren, Y.Z.; Lu, Z.; Song, J.L.; Han, B.; Zhou, Y. Experimental study of the hysteretic behaviour of corrugated steel plate shear walls and steel plate reinforced concrete composite shear walls. J. Constr. Steel Res. 2019, 160, 136–152. [Google Scholar] [CrossRef]
  16. Xie, C.; Dou, C.; Ru, Y. Cyclic test and lateral resistant design of corrugated plate shear walls. Structures 2023, 49, 748–764. [Google Scholar] [CrossRef]
  17. Cao, Q.; Huang, J.; Gu, B.; Li, D.; Huang, J. Experimental and numerical study on hysteretic behaviour of corrugated steel plate shear walls under lateral loads. J. Build. Eng. 2024, 82, 108297. [Google Scholar] [CrossRef]
  18. Berman, J.W.; Bruneau, M. Experimental Investigation of Light-Gauge Steel Plate Shear Walls. J. Struct. Eng. 2005, 131, 259–267. [Google Scholar] [CrossRef]
  19. Emami, F.; Mofid, M.; Vafai, A. Experimental study on cyclic behavior of trapezoidally corrugated steel shear walls. Eng. Struct. 2013, 48, 750–762. [Google Scholar] [CrossRef]
  20. Emami, F.; Mofid, M. On the hysteretic behavior of trapezoidally corrugated steel shear walls. Struct. Des. Tall Spec. Build. 2014, 23, 94–104. [Google Scholar] [CrossRef]
  21. Qiu, J.; Zhao, Q.H.; Yu, C.; Li, Z.X. Experimental Studies on Cyclic Behavior of Corrugated Steel Plate Shear Walls. J. Struct. Eng. 2018. [Google Scholar] [CrossRef]
  22. Qiu, J.; Zhao, Q.H.; Wang, Z.Y.; Yu, C. Lateral behavior of trapezoidally corrugated wall plates in steel plate shear walls, Part 1: Elastic buckling. Thin Wall. Struct. 2022, 174, 109104. [Google Scholar] [CrossRef]
  23. Qiu, J.; Zhao, Q.H.; Yu, C.; Wang, Z.Y. Lateral behavior of trapezoidally corrugated wall plates in steel plate shear walls, Part 2: Shear strength and post-peak behavior. Thin Wall. Struct. 2022, 174, 109103. [Google Scholar] [CrossRef]
  24. Zhao, Z.; Liu, J.; Zhao, B.; Jin, Z.; Jian, X.; Zhang, N. Shear capacity of corrugated steel plates with a random corrosion damage. Thin Wall. Struct. 2023, 193, 111264. [Google Scholar] [CrossRef]
  25. Dou, C.; Jiang, Z.Q.; Pi, Y.L.; Guo, Y.L. Elastic shear buckling of sinusoidally corrugated steel plate shear wall. Eng. Struct. 2016, 121, 136–146. [Google Scholar] [CrossRef]
  26. Dou, C.; Pi, Y.L.; Gao, W. Shear resistance and post-buckling behavior of corrugated panels in steel plate shear walls. Thin Wall. Struct. 2018, 131, 816–826. [Google Scholar] [CrossRef]
  27. Dou, C.; Cheng, X.; Zhao, Y.; Yang, A.N. Shear Resistance and Design of Infill Panels in Corrugated-Plate Shear Walls. J. Struct. Eng. 2021, 147, 04021179. [Google Scholar] [CrossRef]
  28. Tong, J.Z.; Guo, Y.L. Elastic buckling behavior of steel trapezoidal corrugated shear walls with vertical stiffeners. Thin Wall. Struct. 2015, 95, 31–39. [Google Scholar] [CrossRef]
  29. Tong, J.Z.; Guo, Y.L.; Zuo, J.Q.; Gao, J.K. Experimental and numerical study on shear resistant behavior of double-corrugated-plate shear walls. Thin Wall. Struct. 2020, 147, 106485. [Google Scholar] [CrossRef]
  30. Tong, J.Z.; Yu, C.Q.; Tong, G.S.; Xu, S.L. Experimental study on axial resistant behavior of multi-celled corrugated-plate CFST walls. Eng. Struct. 2023, 295, 116795. [Google Scholar] [CrossRef]
  31. Sun, Z.X.; Zou, Y.; Wang, C.Q.; Pan, J.; Wang, L. Axial Compression Behavior of Steel Angle-Corrugated Steel Plate-Confined Concrete Columns. Appl. Sci. 2022, 12, 10819. [Google Scholar] [CrossRef]
  32. Tong, J.Z.; Guo, Y.L. Shear resistance of stiffened steel corrugated shear walls. Thin Wall. Struct. 2018, 127, 76–89. [Google Scholar] [CrossRef]
  33. Tong, J.Z.; Wu, R.M.; Wang, L.Q. Experimental and numerical investigations on seismic behavior of stiffened corrugated steel plate shear walls. Earthq. Eng. Struct. D 2023, 52, 3551–3574. [Google Scholar] [CrossRef]
  34. Wu, R.M.; Wang, L.Q.; Tong, J.Z.; Tong, G.S.; Gao, W. Elastic buckling formulas of multi-stiffened corrugated steel plate shear walls. Eng. Struct. 2024, 300, 117218. [Google Scholar] [CrossRef]
  35. Feng, L.F.; Sun, T.S.; Ou, J.P. Elastic buckling analysis of steel-strip-stiffened trapezoidal corrugated steel plate shear walls. J. Constr. Steel Res. 2021, 184, 106833. [Google Scholar] [CrossRef]
  36. Feng, L.F.; Sun, T.S.; Ou, J.P. Method of determining the minimum number of stiffeners for stiffened corrugated steel walls. Structures 2021, 34, 3487–3500. [Google Scholar] [CrossRef]
  37. Feng, L.F.; Sun, T.S.; Ou, J.P. Elastic buckling analysis of horizontally-placed trapezoidally-corrugated steel shear walls stiffened with vertical steel strips. Thin Wall. Struct. 2022, 180, 109894. [Google Scholar] [CrossRef]
  38. Feng, L.F.; Yang, H.W.; Sun, T.S.; Ou, J.P. Performance of vertically-placed stiffened corrugated panels in steel plate shear walls: Shear elastic buckling analysis. J. Build. Eng. 2023, 69, 106269. [Google Scholar] [CrossRef]
  39. Jin, S.S.; Yang, C.H.; Bai, J.L. Experimental and numerical investigation of a novel PBL connection between the RC frame and corrugated steel plate shear wall. Structures 2022, 41, 1235–1246. [Google Scholar] [CrossRef]
  40. Wen, C.B.; Sun, H.J.; Liu, Y.Z.; Hou, Y.G.; Zuo, J.Q.; Guo, Y.L. Cyclic tests and shear resistance design of stiffened corrugated steel plate shear walls. Eng. Struct. 2024, 298, 117060. [Google Scholar] [CrossRef]
  41. GB 50017–2017; Standard for Design of Steel Structures. Ministry of Housing and Urban-Rural Development of the People’s Republic of China (MOHURD): Beijing, China, 2017.
  42. Tong, J.Z.; Guo, Y.L.; Pan, W.H. Ultimate shear resistance and post-ultimate behavior of double-corrugated-plate shear walls. J. Constr. Steel Res. 2020, 165, 105895. [Google Scholar] [CrossRef]
  43. Tong, J.Z.; Wu, R.M.; Xu, Z.Y.; Guo, Y.L. Subassemblage tests on seismic behavior of double-corrugated-plate shear walls. Eng. Struct. 2023, 276, 115341. [Google Scholar] [CrossRef]
Figure 1. SCSPSWs in frame structures.
Buildings 14 00779 g001
Figure 2. FE model for hysteretic analyses: (a) boundary conditions and interactions; (b) corrugation dimensions (Unit: mm); (c) FE model and meshing size.
Buildings 14 00779 g002
Figure 3. Information of specimen DCSPW-H1: (a) geometrical dimension of shear wall; (b) geometrical dimension of corrugation.
Buildings 14 00779 g003
Figure 4. Comparison of FE and test results: (a) numerical model; (b) FE and test results.
Buildings 14 00779 g004
Figure 5. Meshing convergence study.
Buildings 14 00779 g005
Figure 6. Hysteretic curves of SCSPSWs (t = 4 mm).
Buildings 14 00779 g006
Figure 7. Hysteretic curves of SCSPSWs (t = 6 mm).
Buildings 14 00779 g007
Figure 8. Hysteretic curves of SCSPSWs (t = 8 mm).
Buildings 14 00779 g008
Figure 9. Comparison of final states of models with different aspect ratios (without stiffening systems): (a) T4-A1.0-R0 (Point A1 in Figure 6); (b) T4-A1.5-R0 (Point A2 in Figure 6); (c) T4-A2.0-R0 (Point A3 in Figure 6).
Buildings 14 00779 g009
Figure 10. Comparison of final states of models with different aspect ratios (μ = 50): (a) T4-A1.0-R50 (Point B1 in Figure 6); (b) T4-A1.5-R50 (Point B2 in Figure 6); (c) T4-A2.0-R50 (Point B3 in Figure 6).
Buildings 14 00779 g010
Figure 11. Comparison of final states of models with different rigidity ratios: (a) T6-A1.0-R0 (Point C1 in Figure 7); (b) T6-A1.0-R50 (Point C2 in Figure 7); (c) T6-A1.0-R100 (Point C3 in Figure 7).
Buildings 14 00779 g011
Figure 12. Comparison of final states of models with different corrugated plate thicknesses: (a) T4-A1.5-R100 (Point D1 in Figure 6); (b) T6-A1.5-R100 (Point D2 in Figure 7); (c) T8-A1.5-R100 (Point D3 in Figure 8).
Buildings 14 00779 g012
Figure 13. Skeleton Curves of SCSPSWs.
Buildings 14 00779 g013
Figure 14. Definition of secant stiffness in the hysteretic curve.
Buildings 14 00779 g014
Figure 15. Development of secant rigidities of each loop in the hysteretic curves.
Buildings 14 00779 g015
Figure 16. Cumulative dissipated energy: (a) t = 4 mm; (b) t = 6 mm; (c) t = 8 mm.
Buildings 14 00779 g016
Figure 17. Definition of the hysteretic transition rigidity ratio.
Buildings 14 00779 g017
Figure 18. Validation of the recommended hysteretic transition rigidity ratio.
Buildings 14 00779 g018
Table 1. Comparison between test and FE results.
Loading
Direction
Initial Stiffness (kN/mm)Ultimate Load-Bearing Capacity (kN)
Test ResultFE ResultTest ResultFE Result
Positive107.6128.813791346
Negative139.1127.7−1397−1377
Table 2. Example parameter of model for hysteresis analysis.
GroupLabelt (mm)b/hμθβ
1T4-A1.041.00 to 2000.0800.284
2T4-A1.541.50 to 2000.0800.426
3T4-A2.042.00 to 2000.0800.568
4T6-A1.061.00 to 2000.1200.348
5T6-A1.561.50 to 2000.1200.522
6T6-A2.062.00 to 2000.1200.696
7T8-A1.081.00 to 2000.1590.402
8T8-A1.581.50 to 2000.1590.603
9T8-A2.082.00 to 2000.1590.804
Disclaimer/Publisher’s Note: The statements, opinions and data contained in all publications are solely those of the individual author(s) and contributor(s) and not of MDPI and/or the editor(s). MDPI and/or the editor(s) disclaim responsibility for any injury to people or property resulting from any ideas, methods, instructions or products referred to in the content.

