1. Introduction
To ensure the safety of bridges during operation, an increasing number of large-span bridges have been equipped with a considerable amount of monitoring devices. These devices are utilized for proactive and preventive monitoring and early warning. I the realms of both scientific research and engineering practice, the field of bridge health monitoring is rapidly advancing [
1,
2,
3]. With advancements in computing power, an increasing number of scholars are incorporating machine learning algorithms into the field of health monitoring, with the aim of conducting in-depth data mining on massive datasets [
4,
5]. It is undeniable that AI-based health monitoring represents a future trend in civil engineering. However, at present, there is a need to establish a large number of sample databases, which poses challenges for accurately predicting and identifying structural health conditions. Therefore, structural health monitoring based on mechanical fundamentals remains a research hotspot at this stage. Scholars have utilized static monitoring data to set up early warning thresholds [
6,
7], while others have utilized dynamic monitoring data to study structural seismic performance [
8], yielding positive results. However, most of those studies are based on the premise that sensors must cover the damaged areas, requiring a comprehensive sensor layout in practical operations. This is necessary for a small number of large bridges with high safety importance and complex structural loading. However, for continuous beam bridges of medium or small span, the “full coverage” monitoring approach used for large bridges cannot be directly applied. It is essential to choose a suitable set of monitoring indicators and methods, utilizing a limited number of sensors to capture the overall structural characteristics, and thereby address the regular monitoring and warning issues of medium- and small-span continuous beam bridges. Due to the simple load distribution in continuous beam bridges, where the bridge deck load is transmitted through the beam to the bearings and eventually to the foundation, bearing reactions might be a potential indicator to monitor the bridge’s condition. In addition to monitoring deformations and stresses in the beam, bearing reactions can also indicate various risks such as load distribution on the bridge deck, tendencies to beam overturning, and settlement of bridge piers. However, the monitoring of bearing reactions is challenging, and research on bridge safety monitoring based on bearing reactions is still lacking. Nevertheless, in recent years, many bearing reaction monitoring sensor devices have been developed, especially with the introduction of high-capacity intelligent force-measuring bearings, making bearing reaction monitoring more straightforward and feasible.
Bridge influence lines (ILs) can reflect the distribution of structural bending stiffness and are widely applied in bridge structural damage identification [
9]. Under the influence of moving loads, bridge ILs can utilize a single sensor to capture the full structural response, enabling a comprehensive assessment of the overall structural integrity. In recent years, in the field of structural health monitoring (SHM), damage identification and assessment based on ILs have experienced rapid development.
Zhou et al. [
10] derived and established the analytical solution for the thrust ILs of an arch. On this basis, an identification method using thrust ILs based on variational mode decomposition was introduced. The study proposed a new method and indicators for identifying damage to arch ribs and suspenders in arch bridges. Chen et al. [
11], relying on matrix decomposition methods, reconstructed the deflection ILs matrix, revealing the relationship between structural damage and changes in deflection ILs. Subsequently, through numerical examples and indoor experiments, the effectiveness of this method was validated in cases of single and multiple damages. Liu and Zhang [
12] first applied Brillouin optical time-domain analysis technology to bridge damage localization based on quasi-static strain ILs, proposing a damage localization indicator. Znidaric and Kalin [
13] introduced a method for calculating moment ILs under random traffic flow. With the support of Bridge Weigh-In-Motion (B-WIM), long-term data monitoring was conducted, verifying the feasibility of the B-WIM system. Nady et al. [
14] investigated the impact of analytical solutions for displacement ILs on the accuracy of structural damage identification. Through numerical simulations, the study analyzed the sensitivity of various indicators to damage identification parameters. That research aimed to achieve damage localization and quantification for bridges without the need for optimization algorithms. Zhang et al. [
15] utilized radar devices to capture the distributed displacement ILs. Subsequently, a differential method was employed to derive the ILs for multiple points of rotation. The moment envelope area and curvature envelope area methods were applied to determine the stiffness of the bridge. The study proposed a novel method that utilizes microwave interference radar technology and rotation ILs for identifying the spatial distribution of stiffness in the region. Zheng et al. [
16] derived theoretical expressions for the deflection, rotation, and strain ILs of general beam bridges. Additionally, based on the moment–curvature relationship and Betti’s law, the study estimated the distribution of flexural stiffness of the beam. A method for quantifying bridge damage was proposed as part of the research. Hozhabrossadati and Sani [
17], based on the general constrained Euler–Bernoulli beam and using Green’s function method, obtained ILs for deflection, rotation, moment, and shear force variations for different beams under various boundary conditions. The study proposed an analytical method for drawing multiple ILs.
The above-mentioned research provides theoretical support for the application of ILs in the assessment and warning monitoring of bridge integrity. However, there is limited research on structural integrity assessment based on bearing reaction influence lines (BRILs). Bearing indicators can effectively reflect the operational state of the bridge and are particularly sensitive to the spatial redistribution of loads caused by minor damage. Additionally, unlike other monitoring indicators (such as strain, deflection, etc.) that require a dense sensor layout to cover damage locations, BRILs can obtain comprehensive feature information with just a few force sensors. To enhance health-monitoring indicators, this study proposes a method for bridge integrity assessment and warning monitoring based on bearing reactions. By combining the use of existing monitoring equipment with multiple indicators, such as deflection, strain, and BRILs, this approach enables accurate damage localization. It provides theoretical and technical support for the normalization of bridge assessment and regular warning monitoring.
This paper focuses on an experimental three-span continuous steel box girder bridge. The experimental bridge was designed and constructed at a 1:7 scale, utilizing a specific in-service bridge as a prototype. The principle of the force method was applied to derive the analytical expression of the bearing reaction influence line differential curvature (BRILDC) for the experimental bridge. Subsequently, a finite element model was established to validate the effectiveness of BRILDC in structural integrity assessment. Finally, by utilizing the long-term monitoring data of bearing reactions from the experimental bridge, this study investigates monitoring and early warning methods for small- to medium-sized bridges based on bearing reaction indicators (see
Figure 1).
2. Research on Bridge Integrity Assessment Methods Based on Bearing Reaction Influence Lines
2.1. Derivation of Analytical Formula for the Theory of Bearing Reaction Influence Lines
Different theories of beam structures can influence the derivation of analytical formulas [
18,
19,
20]. The theory of influence lines is an essential concept in the field of structural mechanics for studying beam-type structures. Its fundamental assumptions are grounded in the Euler–Bernoulli beam theory [
17]. The core principles of the Euler–Bernoulli beam theory are suitable for analyzing beam structures, primarily focused on bending stiffness. This provides a crucial basis for the theory of ILs explored in this paper [
21]. Using the aforementioned three-span continuous steel box girder experimental bridge as an example, the analytical expressions for the BRILs were derived based on the Euler–Bernoulli beam assumption [
22].
The dimension of the bridge is given by
.
is the moving load,
is the distance from the moving load
to the bearing A,
is the length of the damage area, and the distance from the left end point of the damage area to the bearing A is
. It is assumed that the element stiffness after damage is
, and the stiffness at other locations where no damage occurs remains unchanged. For easy of calculation, let
and
(see
Figure 2).
By employing the force method and graphic multiplication, the fundamental equations of mechanics are established (Equation (1)):
The BRILs are (Equation (2)):
where
and
represent the BRILs at bearings B and C, respectively.
is the displacement at point B when a unit force is applied to bearing B,
is the displacement at point B when a unit force is applied to bearing C,
is the displacement at point C when a unit force is applied to bearing B,
is the displacement at point C when a unit force is applied to bearing C,
is the displacement at point B under the moving load
, and
is the displacement at point C under the moving load
.
Referring to the fundamental principles of structural mechanics, the aforementioned parameters can be determined through the analysis of the bending moment diagram (Equations (3)–(5)):
where
is the bending moment,
is the elastic modulus,
is the moment of inertia of an area, and
is the bending stiffness. The theoretical solutions for
and
are influenced by the moving load
and the location of damage, necessitating a detailed classification for discussion.
(1) When the damage is near the bearing (Equations (6) and (7)):
(2) When the damage is not near the bearing but within the span (Equations (8) and (9)):
Substituting the damage location and the position of the moving load into Equation (2), the BRILs can be obtained.
2.2. Derivation of Theoretical Formulas for Structural Integrity Assessment
Define
and
as constants in the formula (Equations (10) and (11)):
(1) When the damage element is within the span, the value of
has the following pattern: at the
node,
takes the value in the range of
(Equation (12)):
At the
-node (Equation (13)):
At the node
(Equation (14)):
At the node
(Equation (15)):
At the
node (right side of the damage element),
takes values in the range
(Equation (16))
It is observed that is constant at and nodes and variable at the damaged locations (, and node locations). Therefore, the location of damage can be determined from the anomalous variation points by calculating the corresponding value for the bearing reaction force.
(2) When the damage element is located next to the intermediate bearing, exhibits the following pattern: at the node, takes values in the range of .
At the
-node (Equation (17)):
At the node
(Equation (18)):
At the node
(Equation (19)):
At the
node,
takes values in the range
(Equation (20)):
The obtained indicator for damage localization based on the BRILDC is represented by
(Equation (21)):
In this section, the analytical solutions for BRILs for a three-span continuous beam are derived. Building upon this foundation, a damage indicator is formulated based on the BRILDC when structural damage occurs. The derivation process demonstrates the significance of BRILDC as a key indicator for structural damage monitoring.
When the structure is undamaged, the BRILDC at node remains unchanged. However, in the event of structural damage, the BRILDC at node undergoes alterations. Hence, the detection of changes in BRILDC serves as an indicator to determine the occurrence of damage. Additionally, the presence of damage can also be assessed by examining the concavity or convexity of the -value graph. By calculating the corresponding -values for bearing reactions and plotting the graph, the location of the damaged elements can be identified based on the points of variation in the graph.
3. Numerical Simulation of Finite Element Models
3.1. Engineering Overview and Finite Element Modelling
Numerical simulation analysis was conducted on a three-span continuous steel box girder experimental bridge at the Bridge Laboratory of Tsinghua University, aiming to verify the effectiveness of damage assessment based on BRILDC.
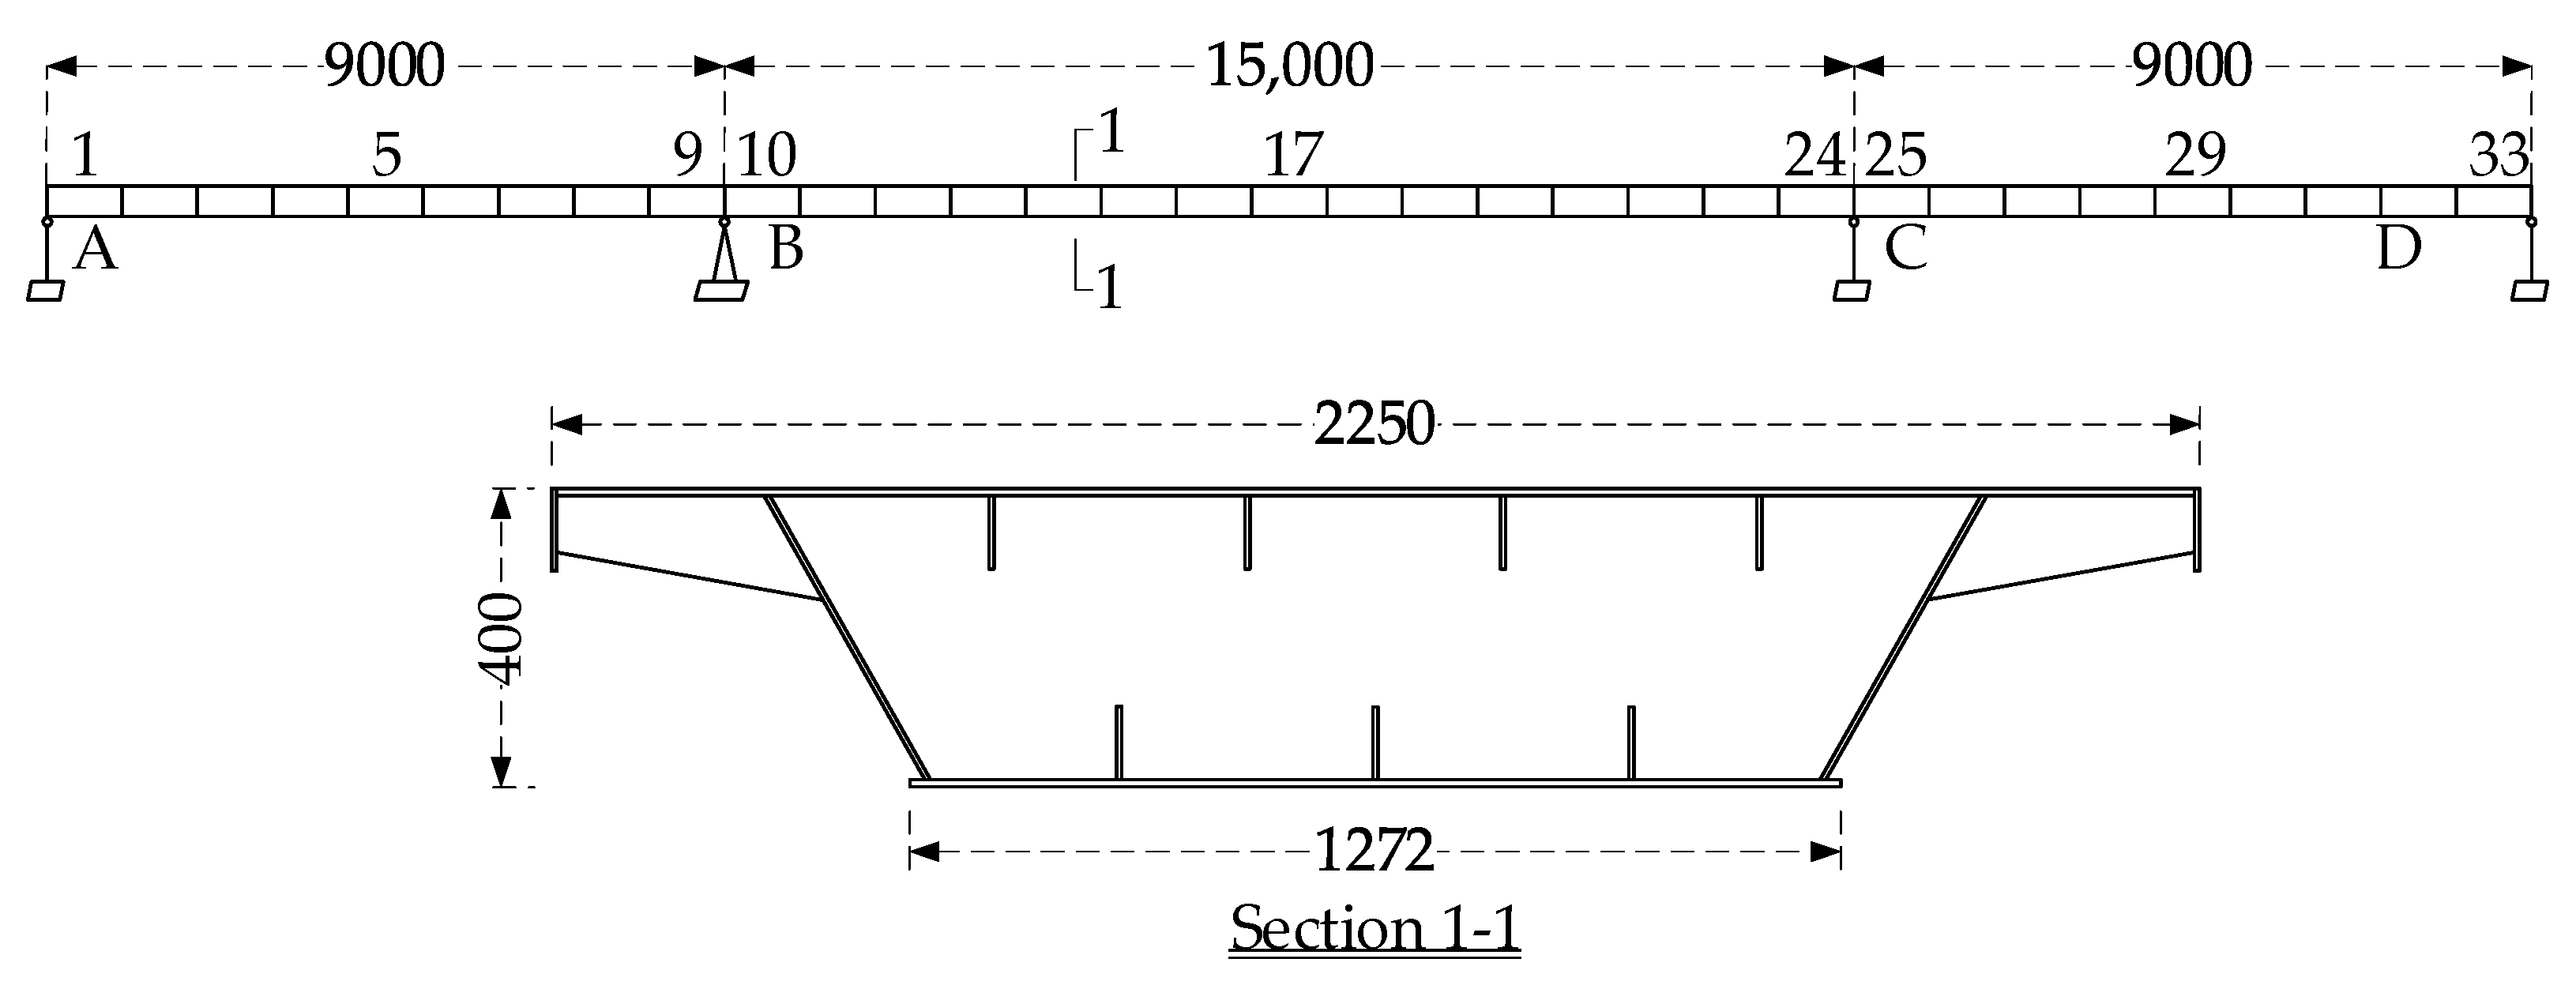
The experimental bridge was designed and constructed at a 1:7 scale, based on a specific actual bridge as a prototype (see
Figure 3). It has a length of 33 m, a width of 2.25 m, and a beam height of 0.4 m (see
Figure 4). The steel used is Q235C, and the concrete is C30.
The numerical model of the experimental bridge was established based on the fundamental assumptions of the Euler–Bernoulli beam theory, leveraging finite element analysis software. General beam elements simulate the main beam elements, considering only longitudinal–vertical plane bending. The elastic modulus of the main beam material was set to 205 GPa, with a material density of 7850 kg/m
3. The element division involved assigning one element per meter, resulting in a total of 33 elements for the entire bridge (see
Figure 5).
Considering that influence lines fall within the realm of statics in structural mechanics, and to avoid dynamic disturbances, a concentrated load = 20 kN was applied to the bridge structure in a quasi-static loading manner. The concentrated load was incrementally applied from element 1 to element 33. During this process, the bearing reaction values were extracted based on the loading sequence. The results were plotted with the element numbers on the horizontal axis and the bearing reaction values on the vertical axis to depict the BRILs in an undamaged state.
Considering that structural damage in actual bridges (such as cracks, corrosion, etc.) generally results only in a reduction in structural stiffness, with minimal impact on the size and mass of the structural cross-section, this study simulated the decrease in bending stiffness by reducing the elastic modulus of the elements. This approach was used to model the BRILs in the damaged state. Based on this, BRILDC was obtained through curvature differencing, aiming to validate the effectiveness of BRILDC as an indicator for damage assessment.
3.2. Single-Point Damage Conditions and Results
Assuming damage to a single element, the reduction in bending stiffness was simulated by decreasing the elasticity modulus of the damaged unit (see
Table 1).
Finite element computation results were extracted to obtain BRILs. Subsequently, curvature differentiation was applied to the results to derive BRILDC (see
Figure 6).
From the results, it can be observed that when damage occurs in elements 1, 5, 9, 13, and 19, with the corresponding reduction in the bending stiffness of these elements, BRILDC exhibits clear peaks at the respective locations.
Different extents of damage correspond to different peak values, indicating that the damage indicator can effectively track the development of damage.
However, due to constraints relating to damage location and bridge type, peak values of BRILDC currently cannot be used to quantify the damage.
3.3. Double-Point Damage Conditions and Results
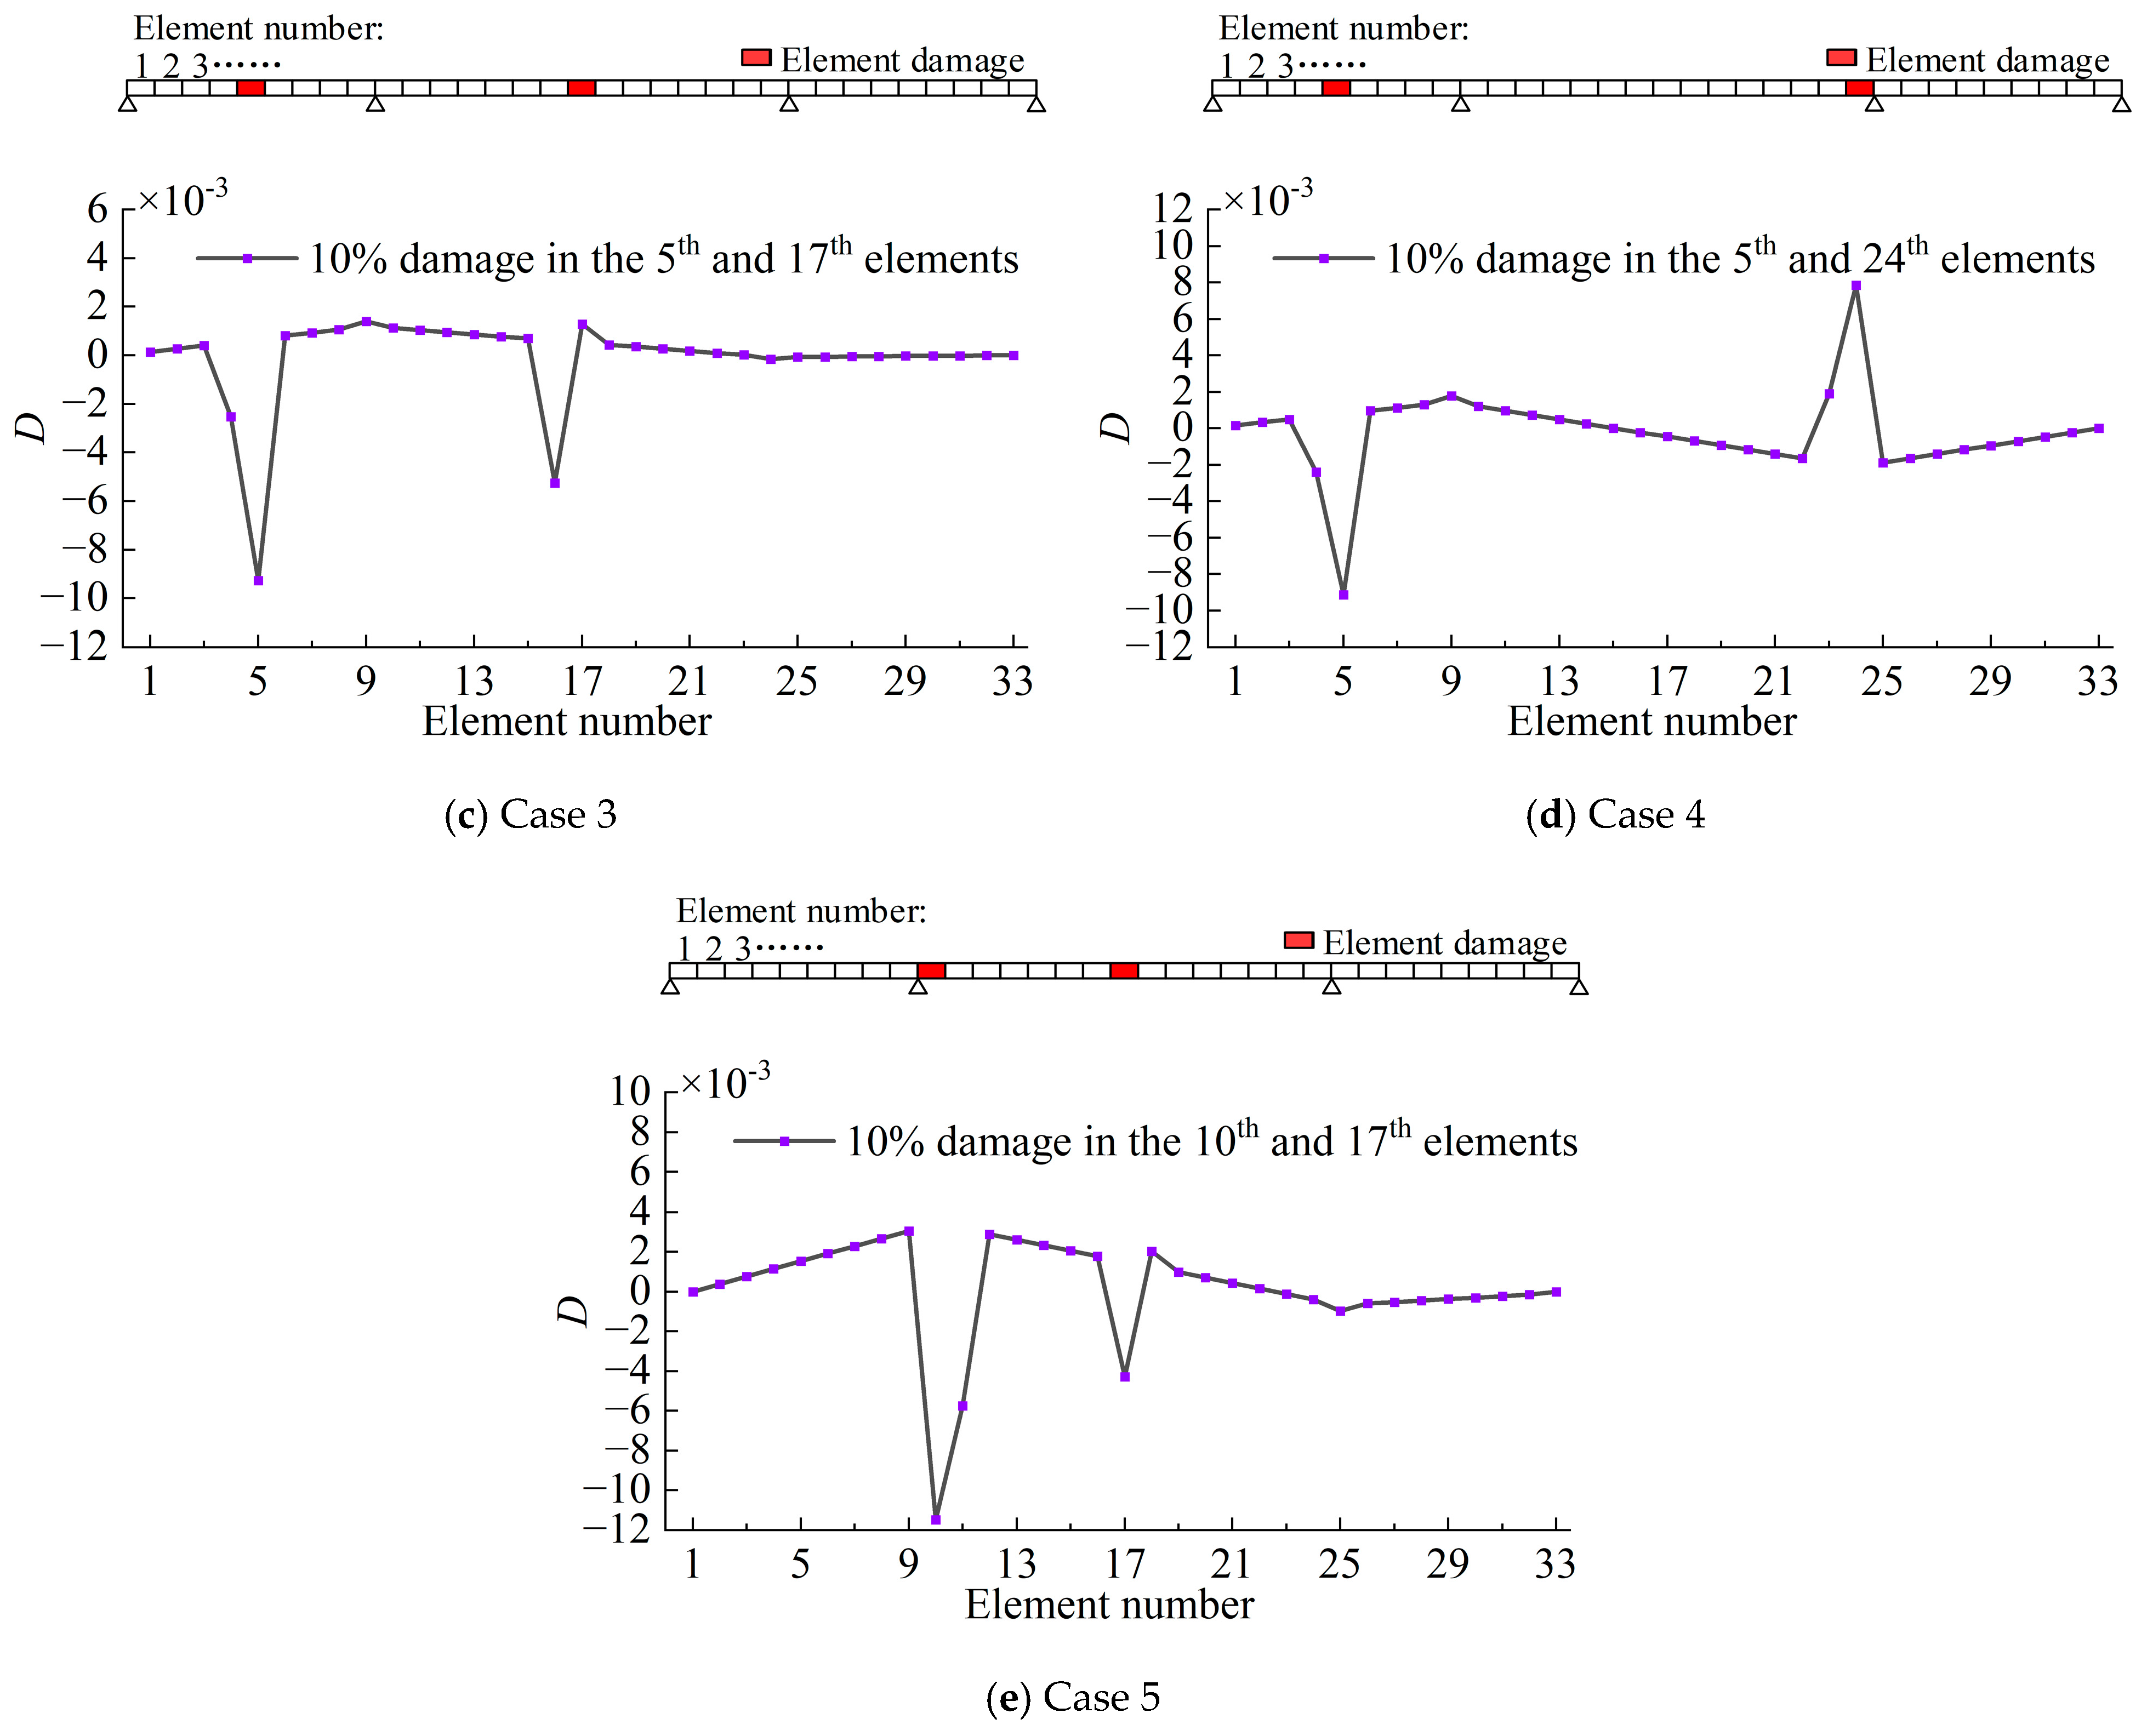
Conditions with double-point damage were further analyzed to verify the effectiveness of BRILDC (see
Table 2 and
Figure 7).
The results indicate that under double-point damage, BRILDC still exhibits pronounced peaks at the damaged locations, while other undamaged areas remain close to zero. This validates that the BRILDC indicator is equally applicable to scenarios with double-point damage.
The direction of the peaks does not provide any meaningful information, as it is primarily influenced by the location of the concentrated load and the location of the damage. Therefore, it is crucial to focus on the element positions corresponding to the peak values rather than their directional aspects (refer to Case 4).
At the same 10% damage extent, the extent of peak elevation varies, primarily depending on the damage location. However, this discrepancy does not imply differences in the extent of damage. As mentioned earlier, quantifying damage based on BRILDC remains a challenge.
3.4. Multiple-Point Damage Conditions and Results
Conditions with multiple-point damage were further analyzed to verify the effectiveness of BRILDC (see
Table 3 and
Figure 8).
The results suggest that despite the presence of multiple damage scenarios, BRILDC still exhibits significant peaks at the damaged locations, while remaining close to zero in undamaged regions. Additionally, higher BRILDC values are observed for more pronounced degrees of damage. This confirms the effectiveness of the indicator under scenarios with multiple points of damage.
However, under multiple-point damage conditions, the elements surrounding the points of damage are influenced to some extent, leading to non-zero values. Nevertheless, overall, this noise is significantly smaller than the damage values, ensuring that the effective information is not overshadowed.
4. Loading Test Based on Experimental Bridge
4.1. Experimental Overview
The experiment focused on the three-span continuous steel box girder mentioned in
Section 3, conducting BRILs loading tests. In contrast to conventional bridge bearings, bearings 1–8 of the experimental bridge were equipped with intelligent force-measuring bearings. The intelligent force-measuring bearing, manufactured on the basis of steel bearings, incorporates an adjustable device and force-measuring core. It can simulate typical damage to bridge piers, such as settlement and bearing voiding. The force-measuring core directly measures the bearing force (see
Figure 9) and, through the internet, enables real-time online data retrieval and processing across regions (see
Figure 10).
In the numerical simulation, the loading condition was emulated through quasi-static loading, employing a concentrated force of 20 kN. To replicate this process experimentally, a forklift was utilized to apply counterweights, totaling 2 tons, to simulate the 20 kN load.
Theoretical ILs represent the response of a structure to unit concentrated loads. However, in the real world, the loading often comes from vehicle loads, requiring prior knowledge of information about vehicle weight, wheelbase, etc., to further reconstruct unit concentrated loads using IL identification techniques. This process can be achieved through dynamic weighing systems or machine learning [
23]. As the wheelbase and tracks of the experimental forklift are relatively small, it can be assumed to be a concentrated load.
Calculating BRILs under vehicle loading necessitates the consideration both of dynamic parameters and the forced motion of the structure [
24,
25]. This differs from the basic assumptions of ILs in structural mechanics. To simplify this process, the experiment adopted a slow loading approach during vehicle movement, employing a move–stop–move procedure with increments of 1 m. This simulated quasi-static loading during the driving process, aiming to mitigate the bearing reaction fluctuations induced by the coupling vibrations between the vehicle and the bridge.
4.2. Experimental Results
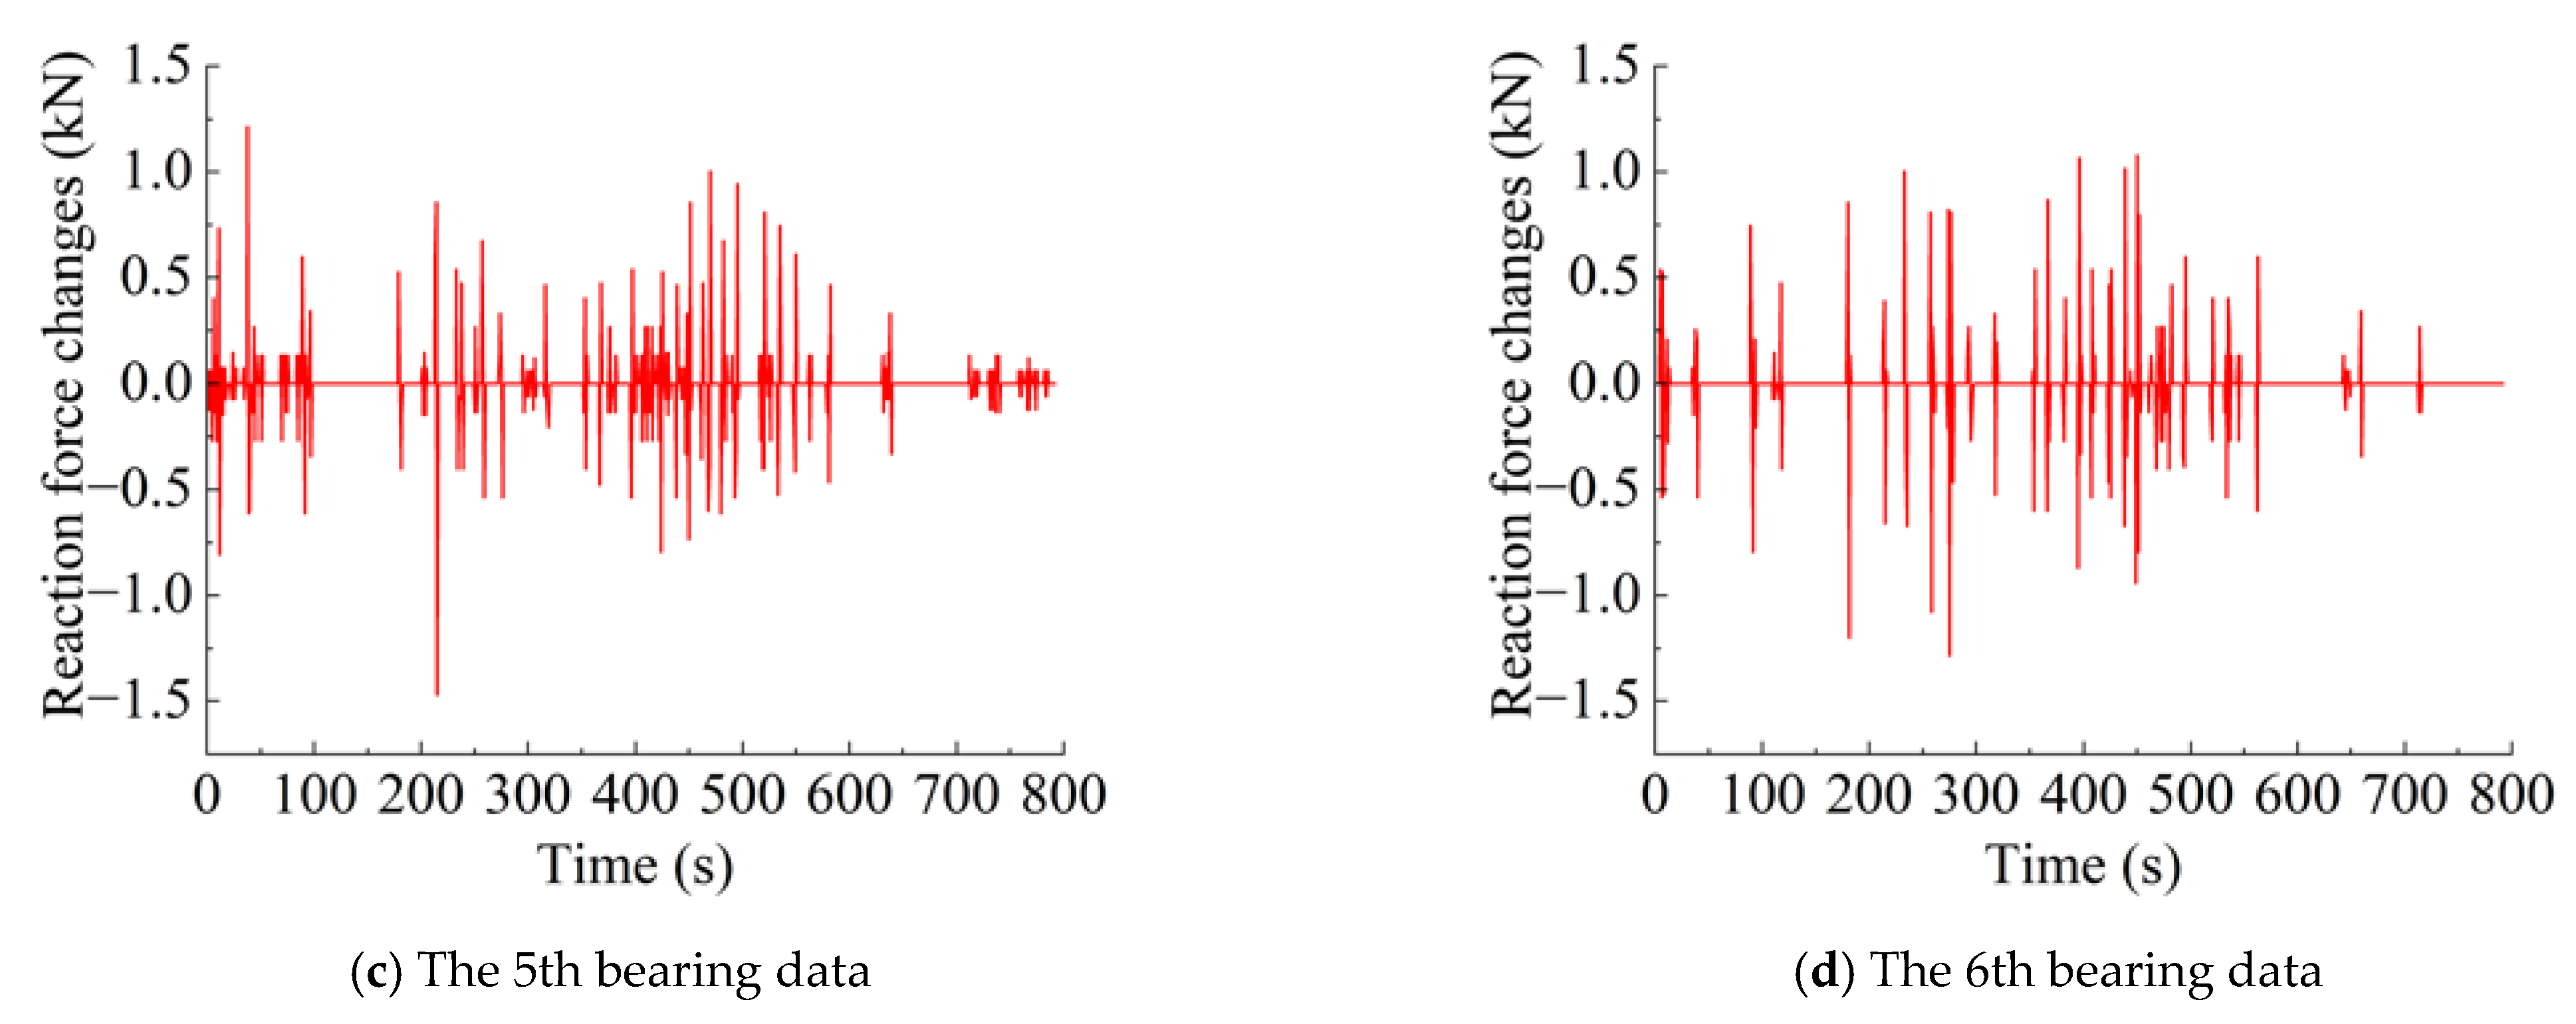
The bearing reaction data of the mid-span bearing were extracted (see
Figure 11).
It is evident that the sum of the bearing reaction change indicators at the same pier closely approximates the value of the bridge deck load. Overall, the peak wave patterns indicate the typical recognition and reading of the deck load by the bearings. Furthermore, the bearings exhibit sensitivity to the load, making them a valuable reference for structural integrity assessment based on BRILDC.
In-service bridges are often designed as hyperstatic structures, and the vertical support reactions of hyperstatic structures may change with variations in local stiffness parameters. Specifically, when local stiffness experiences a reduction, the vertical reactions at different positions may reflect corresponding changes. However, from a practical perspective, it is currently challenging to achieve a genuine reduction in the actual stiffness of a bridge. Nonetheless, it is conceivable to propose a hypothesis. Initially, obtain the BRILs of the bridge at any given moment as a baseline. Over an extended period, the bridge is bound to undergo structural fatigue and aging, resulting in BRILs differing from the baseline. Thus, this indicator holds the potential to assess the integrity of the bridge based on its long-term performance.
5. Research on Early Warning Monitoring Method Based on Bearing Reaction Force
5.1. Principles of Bearing Reaction Monitoring and Early Warning Methods
With the rapid development of sensor technology, the complex responses and characteristics of certain bridge structures can be acquired. Building upon this foundation, an increasing number of bridges have been assessed in research on monitoring, early warning, and operational status based on data information [
26,
27].
Considering the characteristics of bridge structural damage in conjunction with bearing monitoring data, the fundamental principles for setting thresholds in the early warning monitoring method are established as follows:
(1) The measured values of the support monitoring data are used along with the normal force and displacement conditions of each bearing in the bridge design. These conditions are generally at normal levels and serve as references for determining the first-level warning threshold.
(2) The measured values of the support monitoring data are utilized. They are combined with abnormal bridge design conditions, such as when the anti-overturning coefficient approaches the standard value or the support displacement approaches the allowable design value. These conditions serve as references for determining the second-level warning threshold.
(3) The measured values of the support monitoring data are combined with critical bridge design safety conditions, such as when the anti-overturning coefficient exceeds the standard value or the support displacement exceeds the maximum allowable value. These conditions serve as references for determining the third-level warning threshold.
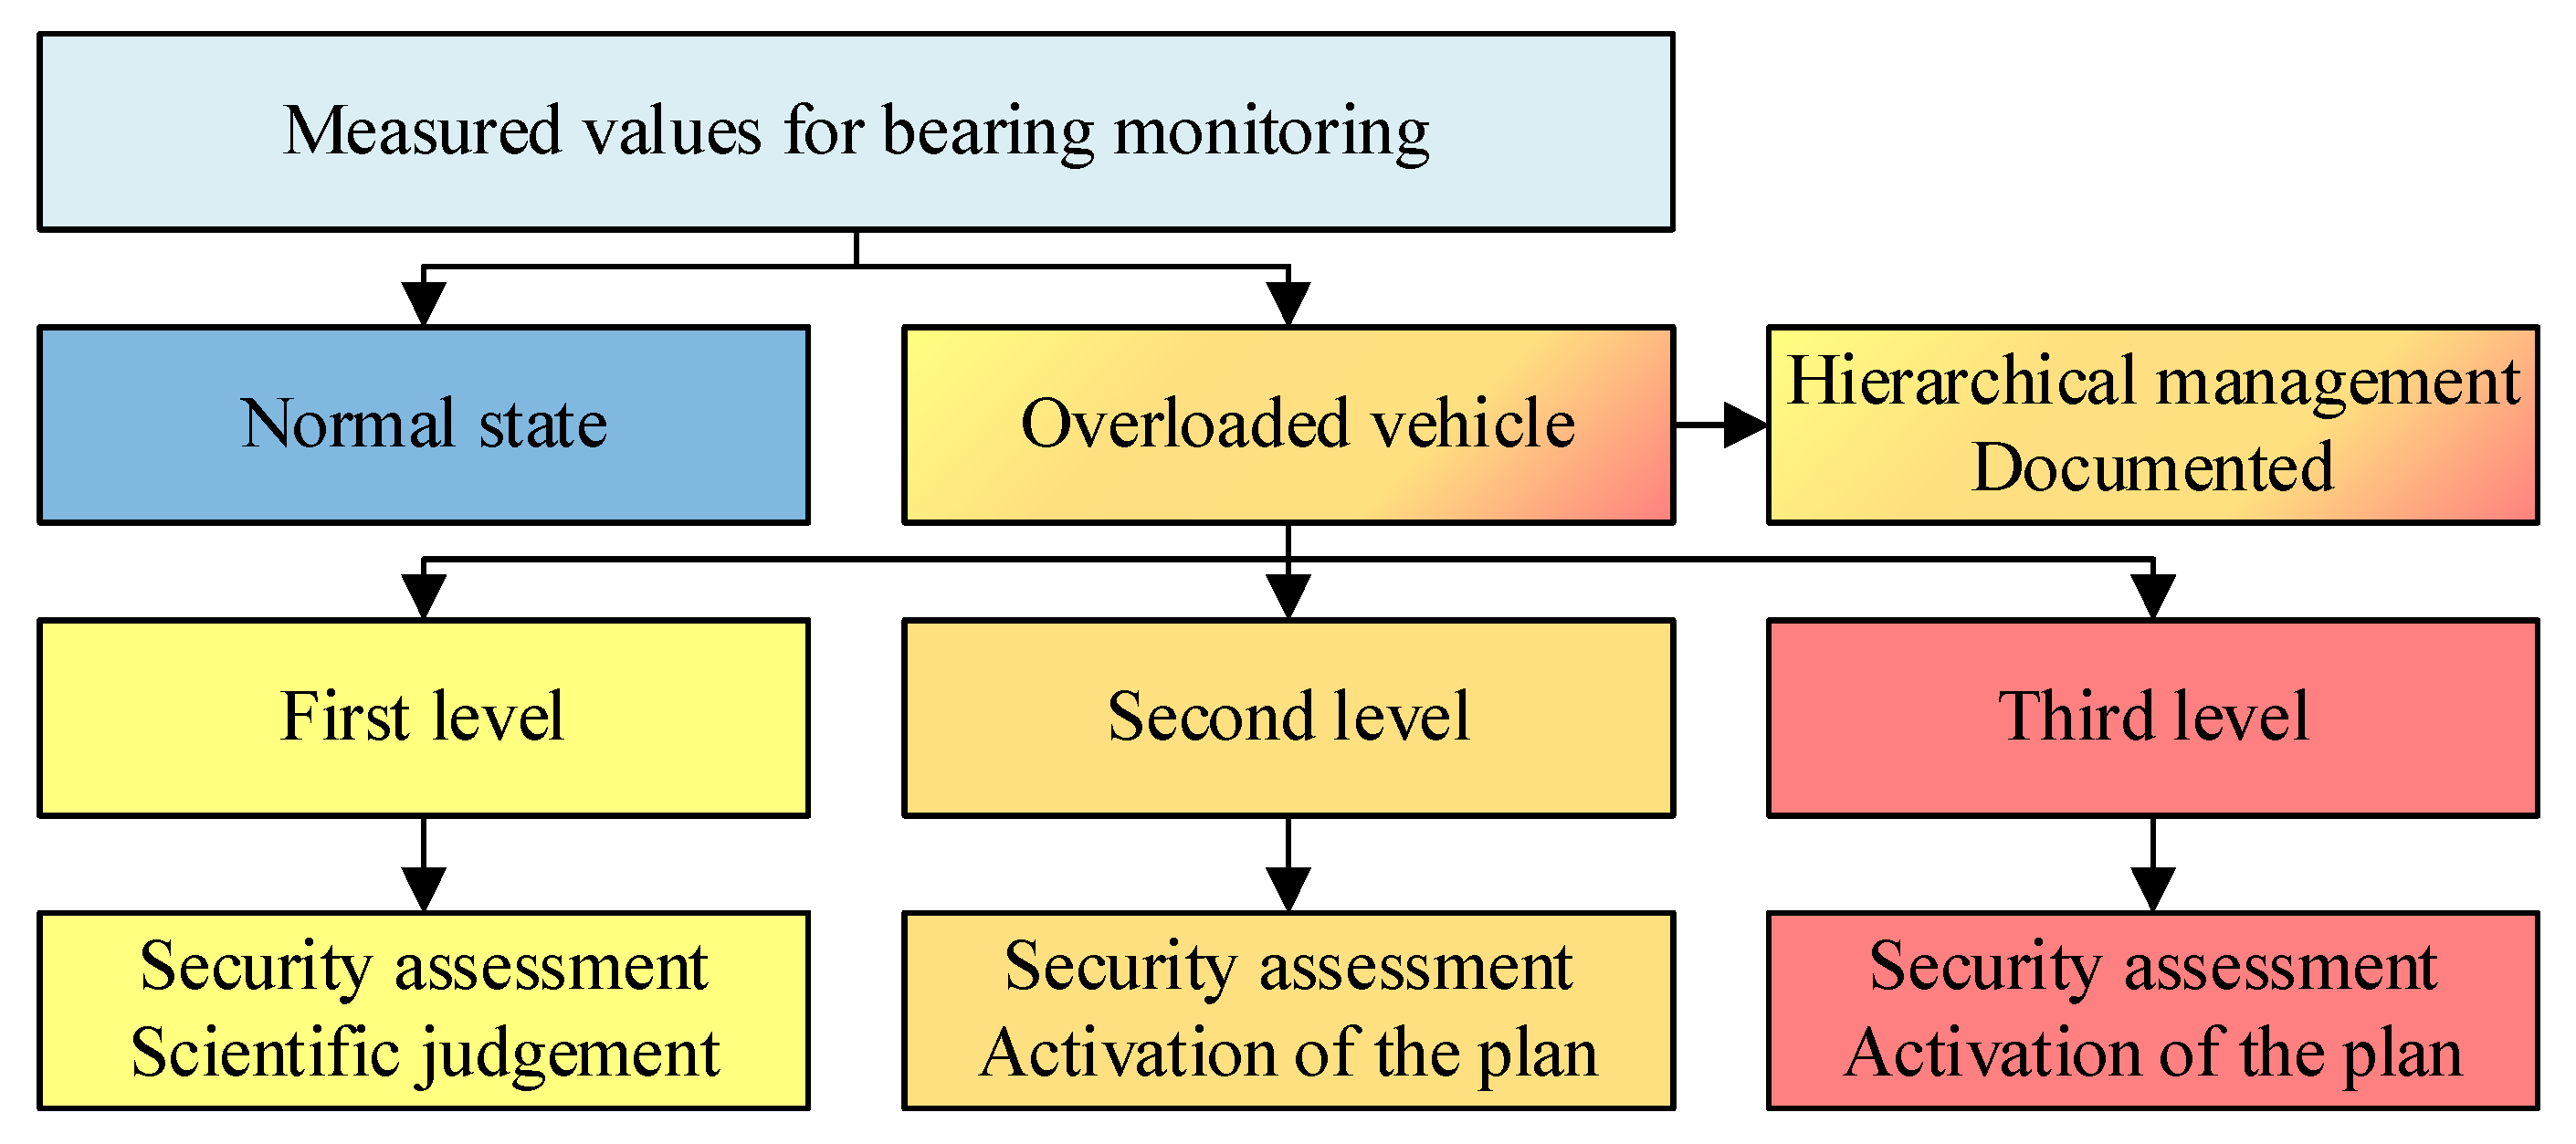
5.2. Grading of Bearing Reaction Monitoring and Early Warning Methods
When considering the warning process, the primary focus lies on the bearing reaction force warnings, supplemented by temperature and displacement warnings. The warning status can be categorized into five levels based on varying circumstances (see
Table 4):
(1) Normal State: Normal state denotes the condition where the force indicators and displacements in the bridge-bearing force monitoring system fall within established normal ranges. This signifies that all bridge bearings are operating as expected.
(2) First-Level Warning: A first-level warning occurs when the bridge-bearing force monitoring system detects a bearing force measurement exceeding the first-level warning threshold, yet not reaching the thresholds of the second or third levels. Such an occurrence may be triggered by fluctuations in traffic volume during peak commuting hours, leading to traffic congestion and elevated support force readings beyond normal daily averages.
(3) Second-Level Warning: A second-level warning occurs when multiple bearing reaction force monitoring values exceed the first-level dynamic threshold in the monitoring system, or when a single bearing consistently surpasses the first-level threshold. Alternatively, a bearing reaction force monitoring value exceeds the secondary threshold. This situation may arise due to intensive overloading, such as concentrated convoys or stoppages on the bridge side, potentially impacting the calculated overturning resistance coefficient. Continuous monitoring is crucial to prevent exceeding the early warning limit. Simultaneously, a safety assessment of the entire bridge must be conducted, and the results reported to the relevant authorities, preparing to activate the corresponding plan if necessary.
(4) Third-Level Warning: A third-level warning occurs when bearing reaction force monitoring values exceed the third-level fixed threshold in the monitoring system, indicating potential serious overloading or main girder displacement beyond the limit, suggesting possible structural damage within the bridge. Immediate reporting to the relevant department is imperative, initiating the corresponding plan. Concurrently, an assessment involving other bridge health monitoring indicators (e.g., acceleration, strain, main girder horizontal tilt) triggered by the third-level warning status indicates a synthetic warning, warranting a comprehensive activation of the bridge alarm and emergency plan.
(5) Overloaded Vehicle Warning: A single or combined overall bearing reaction force monitoring value surpasses the set warning threshold for overloaded vehicles in the bridge’s monitoring system. This condition implies the passage of overloaded vehicles or convoys, mandating classification into one of three levels of early warning for appropriate action, and inclusion in overloaded traffic statistics.
By contrasting the early warning monitoring values of each bearing against the pre-established thresholds, the level of early warning status for the bridge can be identified. A corresponding processing flow for the early warning status is further developed based on the identified level of status (see
Figure 12).
5.3. Setting Warning Thresholds for Vehicle Loads
During the operational period of a bridge, one of the most significant anthropogenic events impacting the structure is the frequent occurrence of heavy vehicle overloads. It is noteworthy that vehicles with weights ranging from 55 to 75 tons constitute a significant portion of overload, exceeding the allowable load by 20% to 30%, thereby exerting a sustained impact on the bridge’s fatigue damage (see
Table 5). Therefore, with the surge in overloaded heavy vehicles, real-time monitoring and management of bridge loads become imperative. Simultaneously, the growing concern among researchers regarding vertical load-bearing capacity has injected new vitality into the study of support reaction monitoring systems [
28,
29].
When establishing warning thresholds for vehicle loads, initial warning thresholds can be determined based on statistical data for vehicle loads. According to the research findings, 1.5 times the threshold for the first level can be used as the threshold for the second level (see
Table 6).
5.4. Setting Warning Thresholds for Bearing Reactions
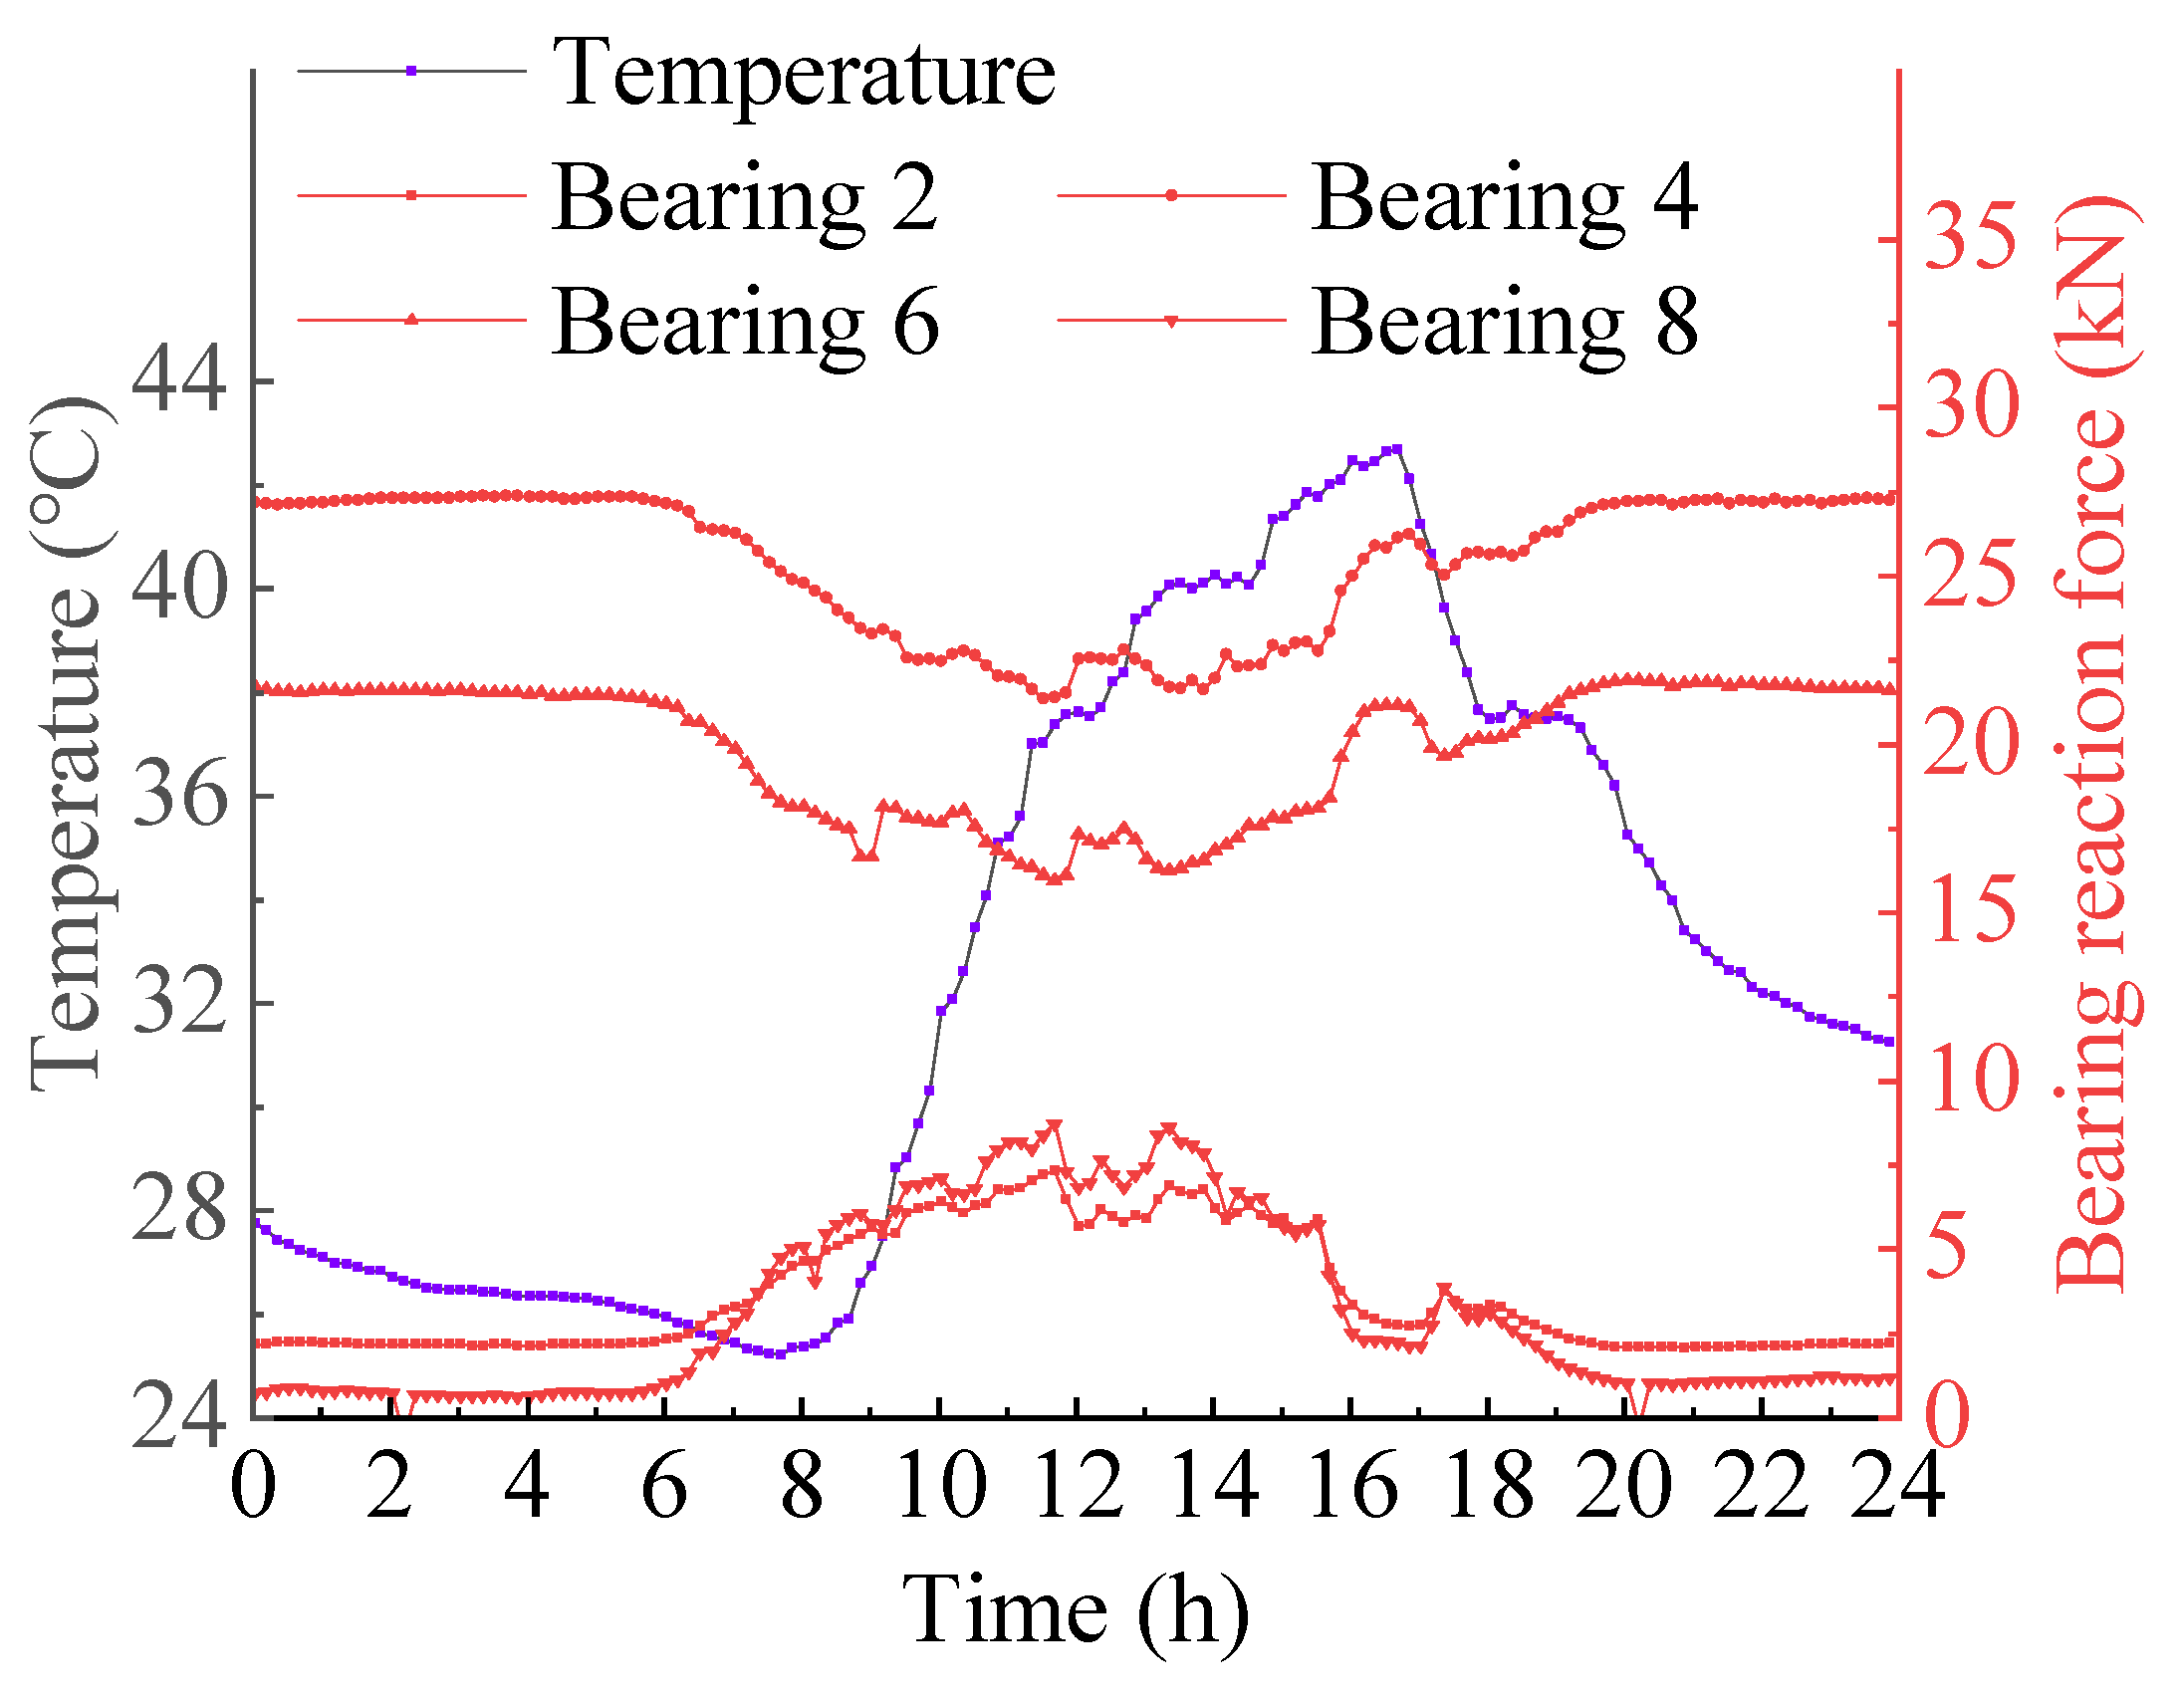
Let us proceed with analyzing the long-term bearing reactions and temperature monitoring data of the experimental bridge, in accordance with the principles and grading of the aforementioned monitoring and early warning methods (see
Figure 13).
Due to the influence of temperature, there is a noticeable cyclic variation in the bearing reactions on one side. During the periods 0:00–6:00 and 18:00–24:00, the bearing reactions remain stable with no significant changes. However, between 6:00 and 18:00, as the temperature rises, the reactions of bearings 2 and 8 initially increase and then decrease, while those of bearings 4 and 6 initially decrease and then increase before stabilizing.
Furthermore, through the off-center loading experiment with a forklift, the impact of lane loading on support reactions was analyzed and evaluated (see
Figure 14).
Analyzing the bearing reaction of bearing 1 under different off-center loading conditions reveals that the bearing reaction data are sensitive to vehicle loads. Different conditions result in different peak bearing reactions, with right off-center loading causing more significant fluctuations. Therefore, through data accumulation, vehicle load identification based on bearing reaction data can be achieved.
Based on the above conclusions, bearing reaction thresholds were set using the experimental bridge as an example (see
Table 7). The establishment of the first-level threshold for bearing reaction force was based on finite element modeling and experimental data, primarily accounting for temperature effects. The second-level thresholds were designed considering the design overloads and bias loads of the experimental bridges. Lastly, the third-level thresholds were focused on scenarios involving bearing dislodgement.
In this section, the experimental bridge served as the research subject. Combining the principles and grading of the aforementioned monitoring and early warning methods, the influence of temperature on long-term monitoring and early warning was examined. The threshold values for the experimental bridge have been established, providing insights and references for long-term monitoring and early warning for actual bridges.


