Article

Revealing Urban Color Patterns via Drone Aerial Photography—A Case Study in Urban Hangzhou, China

1
School of Communication & Design, China Academy of Art, Hangzhou 310009, China
2
College of Information Engineering, Zhejiang University of Technology, Hangzhou 310023, China
3
College of Control Science and Engineering, Zhejiang University, Hangzhou 310027, China
*
Author to whom correspondence should be addressed.
Buildings 2024, 14(2), 546; https://doi.org/10.3390/buildings14020546
Submission received: 29 November 2023 / Revised: 23 January 2024 / Accepted: 10 February 2024 / Published: 18 February 2024

Abstract

:
Urban color, primarily emanating from building façades and roofs, plays a pivotal role in shaping a city’s image and influencing people’s overall impression. Understanding the nuances of color patterns contributes significantly to unraveling the uniqueness and identity of a city. This study introduces a statistical method for the systematic analysis of urban color and macroscopic urban structure. Specifically, we employ drones to collect and extract building roof and façade colors in the main urban area of Hangzhou, mapping these colors to the HSV color space. Subsequently, we establish a random walk model and an origin–destination trip model within the urban transportation network to simulate the movement of people. Our experiments reveal robust correlations between façade and roof values and passing frequency (with the Pearson correlations reaching 0.70). Through a rigorous statistical analysis, we gain insights into the distribution of urban color and the impact of architectural structures on color variations, identifying potential patterns or trends. By integrating color data with architectural structure data, our systematic research method deepens the understanding of the visual features that define cities. Beyond theoretical exploration, this approach offers practical insights for building planning and design. This study not only sheds light on the relationship between architectural structures and urban color but also provides valuable guidance for future urban development initiatives.

1. Introduction

Urban color research primarily focuses on the colors of building façades and roofs, constituting a multifaceted subject that intersects various disciplines, including urban planning, design, psychology, and culture [1,2,3]. Diverse perspectives contribute to the exploration of urban color, yielding numerous compelling results. Boeri outlined a theoretical framework and operational concepts in a study aimed at exploring and validating the prerequisites of an urban color approach [4]. This underscores the pivotal role that urban color plays in the realm of planning and design. Researchers and planners delve into how color influences people’s perceptions, shaping their experiences within the urban environment and guiding the functionality of urban spaces [5,6,7]. From a psychological standpoint, urban color exerts an impact on individual emotions, mental well-being, and behaviors. Through psychological experiments and surveys, researchers scrutinize the effects of different colors on people’s emotions and cognition, seeking to comprehend the public’s responses to color choices in urban settings [8,9]. In the cultural dimension, colors carry diverse meanings within various cultural and social contexts [10]. Researchers explore the intricate connections between color, cultural values, historical traditions, and social identities.
Wang et al. conducted a comprehensive study on the color attributes of residential buildings through field investigations, introducing evaluation factors for grading [11]. The authors then found that Shanghai residential buildings are “warm-colored” in hue, “bright” in lightness, and “partially white” in chromatics. Subsequent research expanded on this to include samples of traditional buildings and residences featuring a fusion of Chinese and Western elements in Shanghai, Suzhou, and Nanxun, as illustrated in Figure 1. The selection of urban colors is acknowledged as a reflection of local cultural and social characteristics [12]. Moreover, certain studies delve into the pivotal role of urban colors in promoting sustainable urban development. Considerations such as enhancing building energy efficiency, incorporating urban greenery, and mitigating the heat island effect are explored [13,14]. These diverse investigations contribute collectively to a holistic understanding of urban color, underscoring its multifaceted significance within the urban environment.
With the advent of information technology, researchers can conduct comprehensive analyses of color distribution in urban areas, leveraging modern technologies such as satellite imagery, drones, and computer simulations. These advanced approaches facilitate an objective and quantitative exploration of the urban color environment, contributing to a nuanced understanding of spatial distribution and trends. Chen et al. pioneered a method to quantitatively measure color harmony in five global metropolises—London, Tokyo, Chicago, Paris, and Beijing—utilizing a Python program and Sentinel-2A data [15]. However, this top–down approach presents challenges in terms of accurately capturing the colors of building façades. In order to address this limitation, Zhong et al. proposed a deep learning-based technique to map urban façade colors using street-view imagery. They introduced the concept of the dominant color of the urban façade (DCUF), adopted as an indicator for describing urban façade color. A case study in Shenzhen demonstrated the measurement of urban façade color using Baidu Street View panoramas, resulting in city-scale mapping across irregular geographical units and regular grids [16]. Despite its merits, street-view imagery data have limitations, including potential insufficient real-time updates, potential obstructions between buildings or from vegetation, and variations in lighting conditions due to the time of capture and weather conditions.
The exploration of urban colors extends into the realms of social science and cultural studies, where researchers delve into the symbolic meanings of colors across different cultures and social contexts. The choices of colors are scrutinized for their reflection of and impact on the social structure and cultural identity of a city. Gou et al. conducted a comprehensive survey and evaluation of present architectural colors in real urban spaces, assessing aspects such as materials, functions, environmental relationships, and color codes while investigating residents’ attitudes toward current and future architectural colors [17]. Li et al. delved into the harmony of building façade colors in the CIELAB color space, exploring the relationships between color attributes (hue, lightness, and chroma) and harmony, as well as the differences in color attributes and harmony [18]. Zhou et al. proposed an efficient approach for evaluating the harmoniousness of building façade colors on a large scale, employing street-view images and a deep learning algorithm [19]. Leveraging digital image processing and computer vision technologies enables the automation of large-scale urban image data analysis. For instance, Zhang et al. introduced a quantitative method to study the color of landmark landscape architecture, demonstrated through a case study on Sacred Heart Cathedral Jinan [20]. Yang explored people’s visual experiences of seasonal color changes in the environment, presenting an approach that combines color analysis and information visualization for analyzing and communicating environmental colors [21]. Shen et al. selected four typical urban parks in Nanjing to study color characteristics using color harmony and suitability degrees, quantitatively evaluated based on the Moon–Spencer (MS) color harmony theory [22].
When it comes to collecting and correcting color data for extensive urban building areas, traditional methods, such as manual measurement and manned aerial photography, exhibit certain limitations. The recent advancements in drone technology offer a transformative solution, enhancing both the precision and efficiency of color data collection while reducing personnel workload. The robust development of drone technology provides us with an opportunity to acquire richer visual information, including detailed insights into building colors and textures. This capability allows for a more accurate representation of the desired external features related to building colors. Subsequently, our analysis of urban color employs two models: the random walk model and the origin–destination trip model. These models simulate the movement of people within a transportation network [23,24]. Given that citizens’ travel patterns are inherently intertwined with urban structure dynamics [25], these models find extensive applications in areas such as traffic planning and urban design. They enable researchers to investigate how individuals navigate and choose paths in urban environments, contributing valuable insights to urban planning practices [26].
The urban transportation network is a pivotal determinant of people’s travel patterns, influencing architectural styles, functional layouts, and color configurations along roads [27]. This study uniquely focuses on roads as intentional elements, integrating them into the broader exploration of urban color. While traditional road projects in urban design primarily center on static analysis, elements like the rational degree, the hierarchical relationship of road design, and the scale proportion between roads and building façades remain crucial for understanding urban color dynamics. The random walk model, a classical dynamical model in network analysis, serves as a mathematical tool to simulate the random walking behavior of individuals in an urban environment [28]. Grounded in randomness, this model attempts to replicate citizens’ behavior in choosing paths without predefined destinations. Individuals move along the urban transportation network, randomly selecting directions for their next step, influenced by factors such as the attractiveness of the environment, road width, and population density. Through extensive simulations, the model generates statistical insights into citizens’ behaviors, providing valuable information about urban transportation network characteristics, including hotspots and congestion [29]. In contrast, the origin–destination (OD) trip model in urban transportation networks simulates the purposeful walking behavior of individuals with specific destinations [30]. Unlike the random walk model, the OD trip model assumes that citizens have specific goals or destinations, considering factors such as the shortest path, quickest arrival time, or other relevant considerations in their decision-making process. This model is versatile, accounting for a wide range of individual destinations, including workplaces, business districts, and residential areas. The choice of starting points and endpoints in the destination trip is influenced by functional areas within the urban context [31]. It incorporates individual preferences, the mode of transportation choices, and other factors influencing travel decisions. It is also revealed that trip purpose is anticipated by income, size, distance, and travel time via statistics [32]. In this study, we employ both the random walk model and the origin–destination trip model in a transportation network, analyzing the relationship between activities and urban color by simulating the movement of people. This approach facilitates the calculation of roads with the highest passing frequency, helping identify primary and secondary regions. Moreover, it enables the identification of core research directions and actual carriers at the macro scale.
In this paper, we meticulously articulate our study’s objectives as follows: (i) Our primary goal is to delve into the intricacies of urban color dynamics, with a specific focus on the hues adorning building façades and roofs in the bustling urban hub of Hangzhou. (ii) We aspire to establish meaningful correlations between urban color patterns and the broader scope of macroscopic urban structures. This entails unraveling the influence of architectural features on the kaleidoscope of colors that grace the urban environment. (iii) Our study is geared toward the development and application of advanced statistical methods, providing a systematic and in-depth analysis of urban color. This entails harnessing the capabilities of drones for precise data collection and employing sophisticated statistical models to simulate the nuanced movements of people within the intricate web of the urban transportation network. By enumerating and explicitly articulating these objectives in the introduction, our intent is to furnish readers with a clear and navigable roadmap, ensuring that the aspirations of our study are evident and readily accessible.

2. Materials and Methods
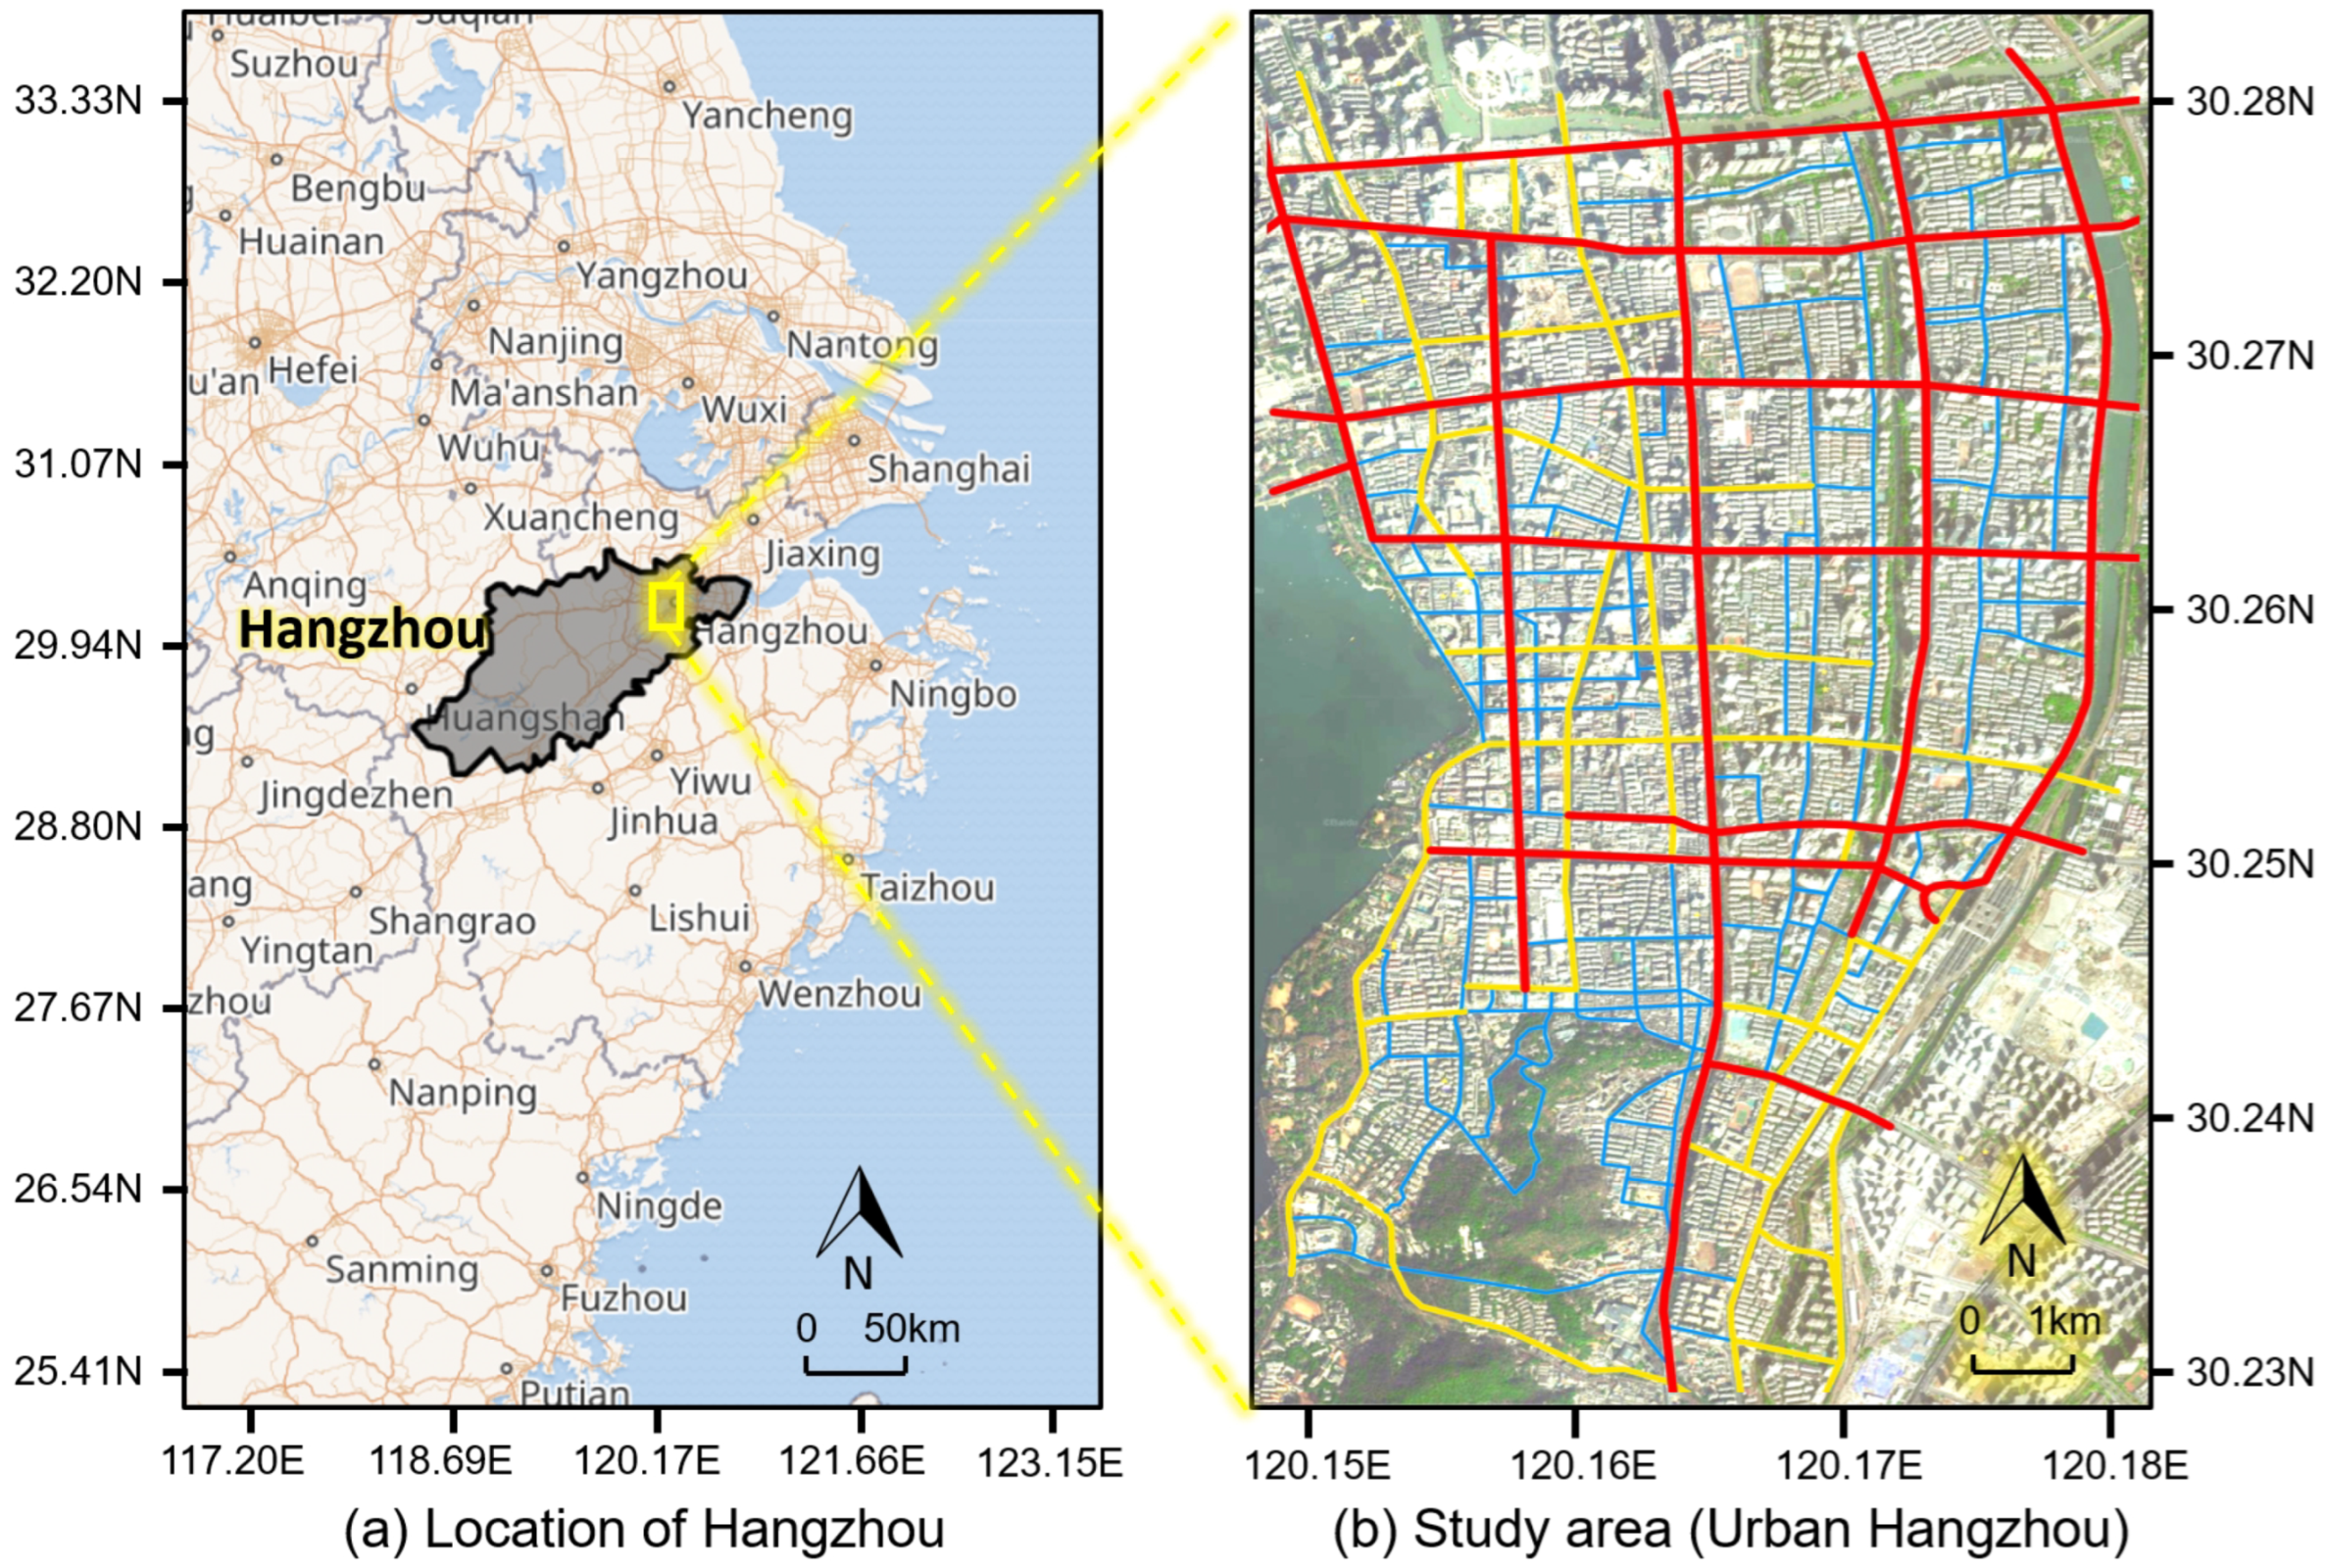
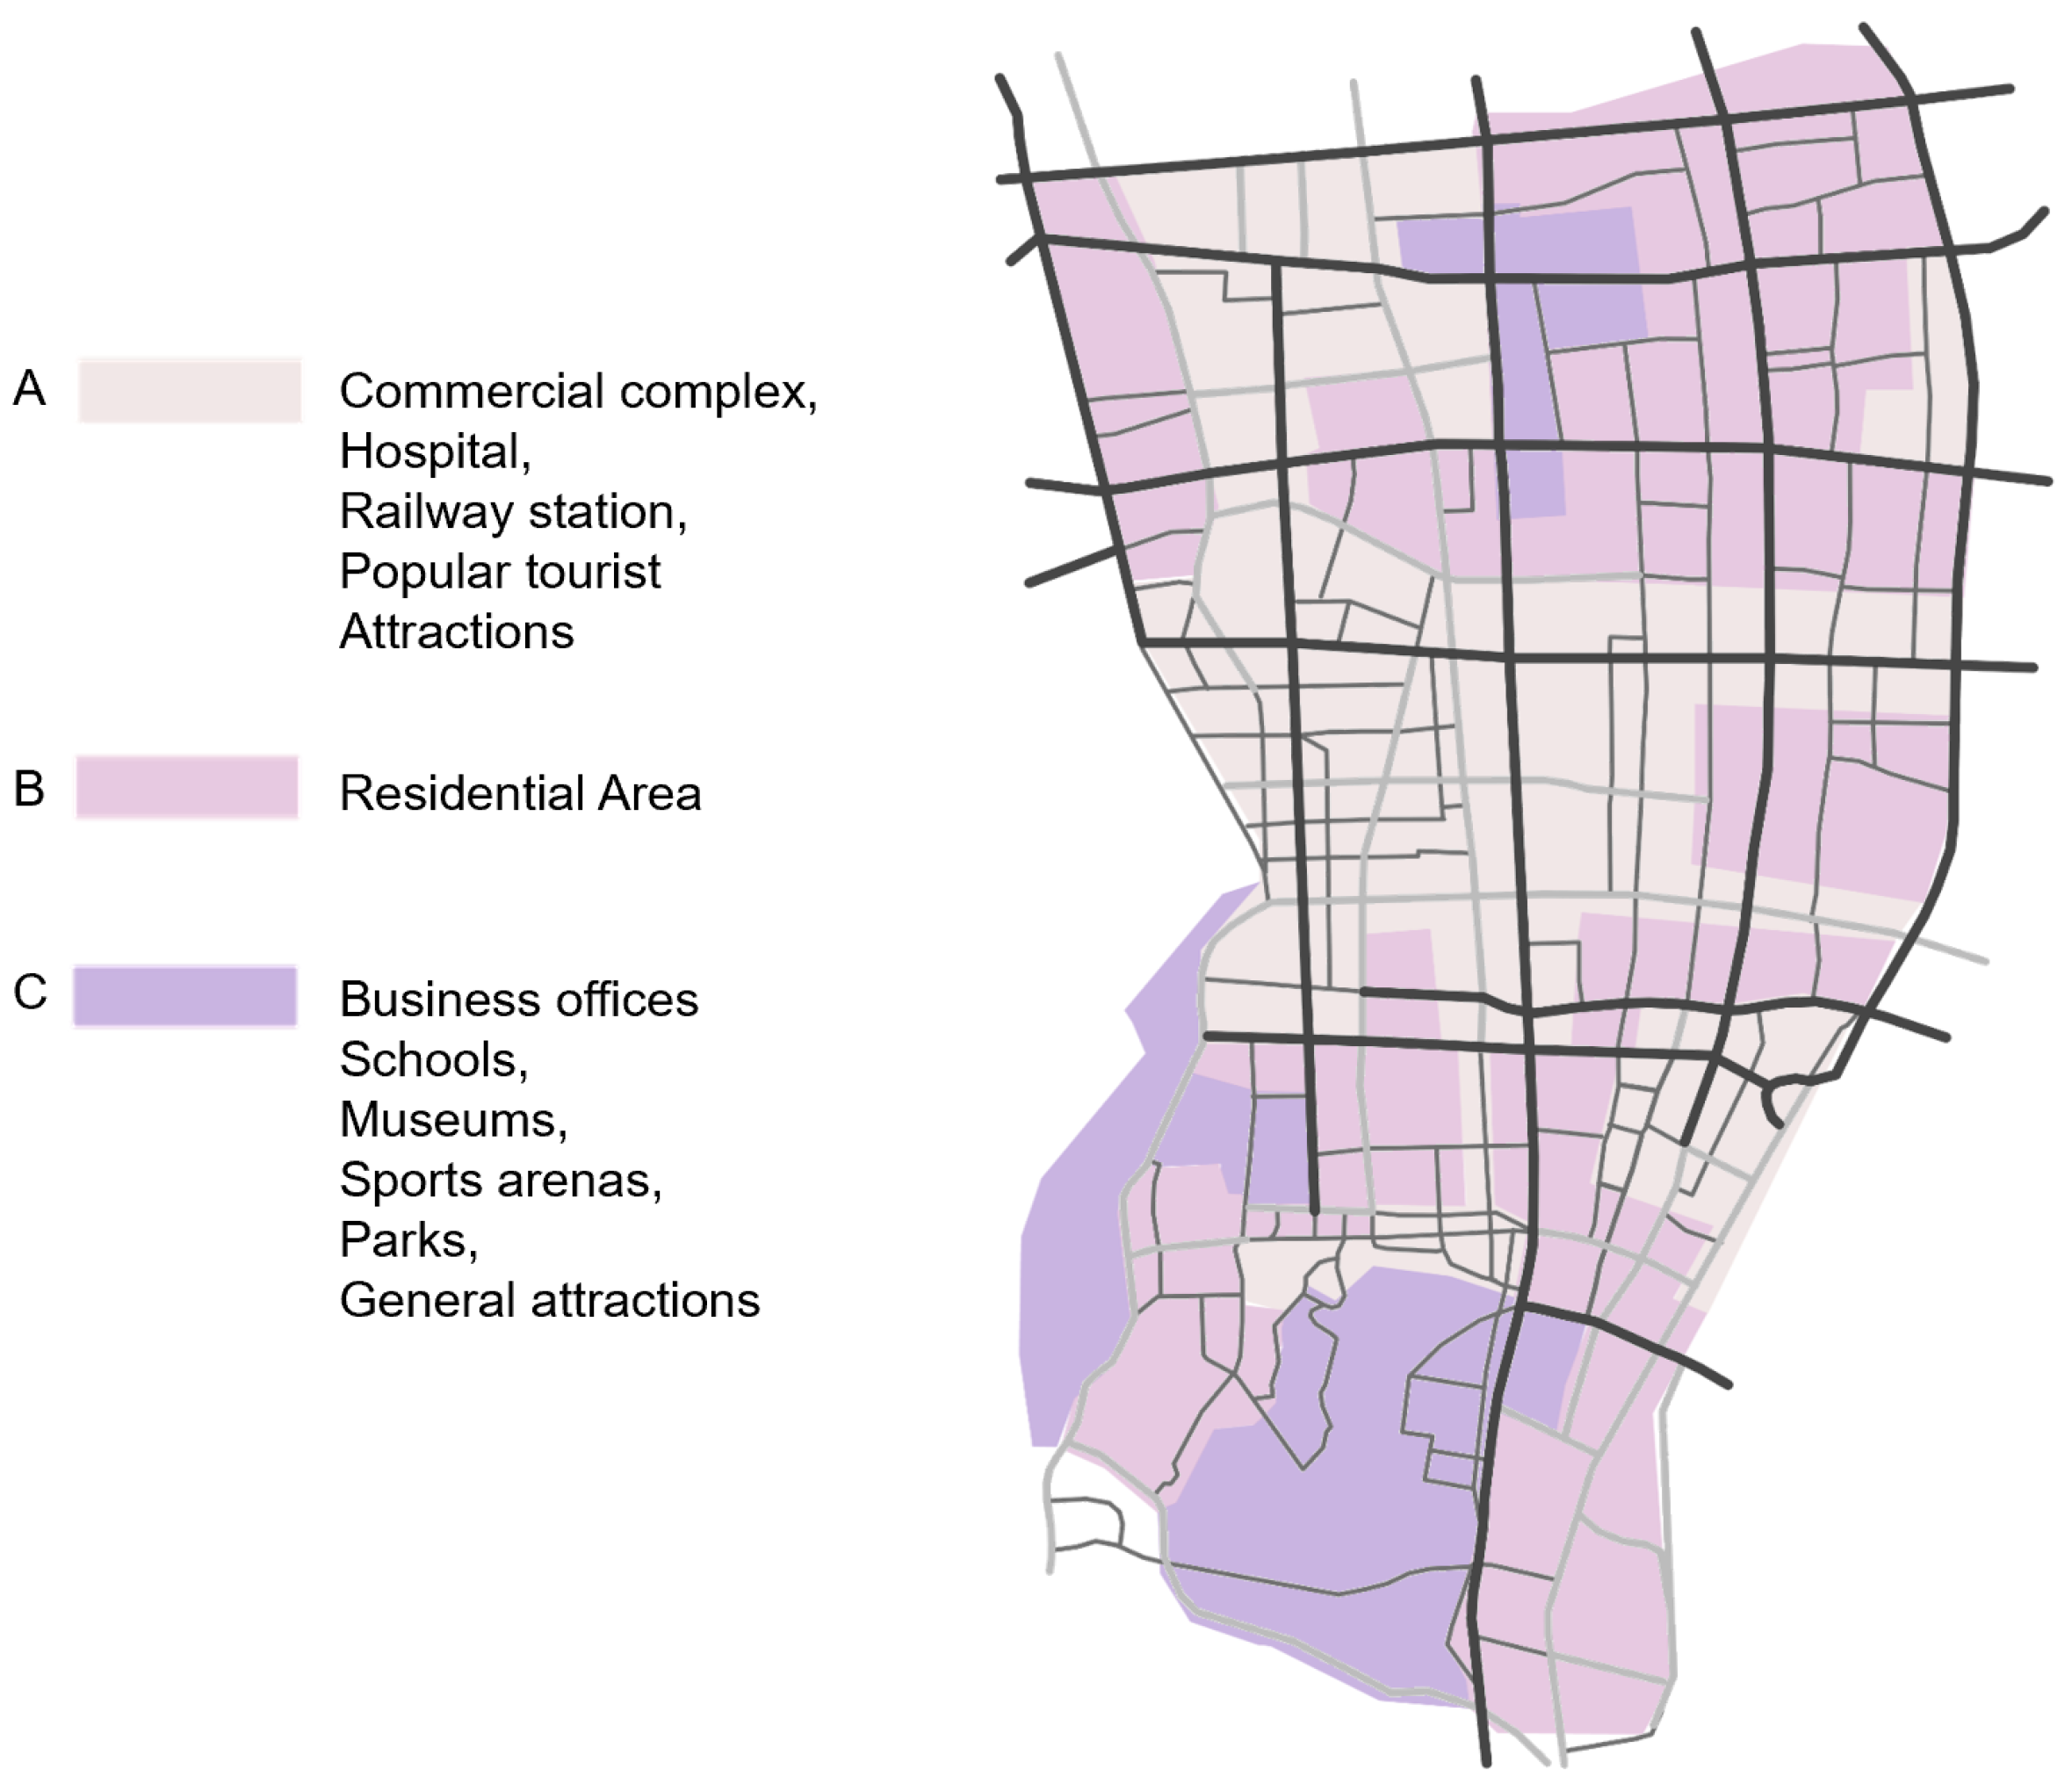
2.1. Study Area

In this research, we chose the urban area of Hangzhou as our study area. Hangzhou, situated in Zhejiang Province, People’s Republic of China, holds significance as a prefecture-level city, provincial capital, and subprovincial city. It stands out as a pivotal political, economic, cultural, scientific, educational, and financial center, along with being a transportation hub in Zhejiang Province [33]. Recognized as a national megacity and the central city in the southern wing of the Yangtze River Delta, Hangzhou’s strategic location and multifaceted role make it a compelling focus for our study. Located in the northern part of Zhejiang Province along the southeast coast of China, Hangzhou is positioned at the lower reaches of the Qiantang River. By encompassing a total land area of 16,853 km2, with the urban area covering 8292 km2, Hangzhou’s geographical co-ordinates range from approximately 29°11’ to 30°34’ north latitude and 118°20’ to 120°44’ east longitude. As of the end of 2020, the city boasted a permanent population of 11.94 million, with 10.71 million residing in the urban area [34].
Being the economic, cultural, technological, and educational nucleus of Zhejiang Province, Hangzhou experiences high-density urban development, resembling the environmental characteristics typical of major cities in developing countries. Renowned as a key national scenic tourist city, Hangzhou features the iconic West Lake Scenic Area located in its central part, showcasing diverse street types [35]. The city’s global prominence is underscored by hosting events like the 2016 G20 Summit and the 2018 World Short Track Speed Skating Championships and its upcoming role as the host city for the 2023 Asian Games [36].
Our choice of Hangzhou as the study area is rooted in several key considerations: (i) Architectural diversity: Hangzhou’s rich tapestry of architectural styles, ranging from traditional structures to modern designs, provides a unique opportunity to investigate a wide spectrum of building colors. This diversity enables us to capture nuances in urban aesthetics that may not be present in more homogeneous urban environments. (ii) Cultural significance: Hangzhou’s deep cultural history presents an intriguing case for studying the interplay between architectural color and cultural identity. The color choices in buildings may be influenced by cultural values and historical traditions, contributing to a more nuanced understanding of urban color dynamics. (iii) Economic and technological hub: As a prominent economic and technological hub in China, Hangzhou represents a city at the forefront of development. This provides an opportunity to explore how economic factors and technological advancements influence urban color patterns, contributing insights that may be applicable to rapidly growing urban centers globally. (iv) Aesthetic appeal: Hangzhou’s scenic beauty and its status as a tourist attraction make it an ideal setting to study how visual elements such as building colors contribute to the overall impression of a city. (v) Transportation network: The intricate transportation network in Hangzhou provides a complex urban structure for analysis. Studying the correlation between building colors and the transportation network allows us to explore how visual elements may be influenced by (and, in turn, influence) the city’s macroscopic structure. In summary, Hangzhou’s architectural diversity, cultural significance, economic prominence, aesthetic appeal, and the complexity of its urban structure collectively position it as an optimal location for our research on urban color dynamics.
The specific focus of our study is the core block bordering the central urban area and the West Lake Scenic Area, as depicted in Figure 2. This area extends from the East Ring Road and Jiangcheng Road in the east to the West Ring Road and Nanshan Road in the west, the North Ring Road in the north, and the area within Wansongling Road in the south, covering an area of approximately 10   km 2 . Roughly demarcated by West Lake, Phoenix Mountain, the Beijing–Hangzhou Grand Canal, and the Tiesha River, it remains the most representative urban area in Hangzhou. This area exhibits high development density and significant human activities and has been studied from various aspects [37,38,39]. The overlap of a high-density urban center with a scenic area results in various differences in land use types, influencing the pattern of urban color [40].

2.2. The Collection of Urban Color

Following the introduction of the study area and materials, our next focus is on describing the methods employed in this research. Figure 3 presents a comprehensive method flow chart, providing a visual overview of the research process.
Utilizing drones for the collection of rich and highly generalized color data is a critical step in extracting accurate principal component colors, establishing precise architectural color visualization models, and mapping the relationship between color spaces before and after calibration. Therefore, drone collection operations require meticulous control over specific drone flight variables while ensuring maximum diversity in the collected drone aerial images [41]. In general, assuming the target architectural area to be photographed is a rectangular region, the flight altitude is initially determined based on the height and scale of the target architectural area. At this altitude, multiple zigzag paths are flown at regular intervals to cover the corresponding rectangular area [42]. Along each path, photos are taken at regular intervals, maintaining a constant overlap rate in both the horizontal and vertical flight directions.
Before the actual drone deployment, the selection of an appropriate time is crucial considering that weather conditions significantly impact the shooting results. It is advisable to fly the drone on clear or overcast days, with a preference for noon flights to minimize the shadow area cast by buildings. Subsequently, the drone is launched, following the planned route and capturing photos at regular intervals. During the actual flight, fixing the tilt angle of the drone camera gimbal, usually set at 45 degrees, is crucial. Additionally, camera parameters, such as the aperture, shutter speed, white balance, ISO, etc., are properly configured and fixed for consistency [43]. The use of the shutter priority mode during shooting is recommended to avoid exposure time discrepancies that may lead to shooting errors.

2.3. Image Preprocessing

The collected photos undergo image preprocessing using software, such as Photoshop (https://www.adobe.com/products/photoshop.html, accessed on 28 November 2023), leveraging the distortion correction files provided by the drone camera to rectify image distortions [44]. Because images acquired at different time intervals may exhibit varying brightness and color effects due to distinct lighting conditions, illumination compensation becomes crucial during the image preprocessing stage to enhance the accuracy of the captured images [45].
In the first step, the images are mapped into the HSV space, and the hue, saturation, and value channel values of each pixel are recorded as h x y , s x y , and v x y , where x and y denote the horizontal and vertical co-ordinates of the pixel, respectively. Taking a single image as an example, the illumination compensation module represents the pixels on the image using HSV color space co-ordinates and calculates the overall illumination gain for the entire image set by
V i = 1 w i · h i x = 0 w i y = 0 h i v i ( x , y ) .
Here, V i indicates the illumination gain of image i, w i represents the width, h i represents the height of image i, and v i ( x , y ) represents the value in the HSV color space for the pixel ( x , y ) of image i. Subsequently, the average illumination gain for the entire set of images is calculated as
V a v e = 1 N i = 1 N V i ,
where V a v e represents the illumination gain for the entire set of images, and N represents the total number of images in the set.
Following this, the illumination compensation module computes the scaling factor k i V based on the illumination gain V i of each image in the set in the HSV color space and the average illumination gain V a v e of the entire set
k i V = V i V A v e .
Finally, the illumination compensation module multiplies the V co-ordinates of all the pixels in the image in the HSV color space by the scaling factor k i V , resulting in an image set with color balance for further calibration.

2.4. Color Extraction

The oblique aerial images captured by drones include GPS co-ordinates and camera poses for each image acquisition, and these contain inherent geographic information data for the buildings. This allows for the precise localization of architectural areas by leveraging the geographic information data obtained from the captured oblique aerial images. In this process, regions corresponding to the buildings are extracted from the oblique aerial images [46]. Specifically, oblique aerial data of the buildings and their corresponding semantic segmentation masks are acquired. These masks are then employed to designate colors in the oblique aerial data that do not belong to the building areas as black [47,48].
At this juncture, urban color comprises phenomenological data representing all building colors and pertinent urban characteristics. These characteristics are parametrically expressed in digital space after being identified by computers. The data encompass the location of urban buildings and the values of the three channels of the HSV color space for the façade color and roof color. Additionally, it includes the urban population density, the structure of the urban transportation network, and the positions of the urban building clusters. The images depicting the collected façade and roof colors in Hangzhou’s main urban area are illustrated in Figure 4. Notably, the roof color of the buildings in the main urban area of Hangzhou appears much darker than the façade color overall. In the subsequent section, we will delve into the analysis of the correlation coefficients between the urban human flow characteristics and the three-channel values of the HSV color space for the urban façade and roof colors.

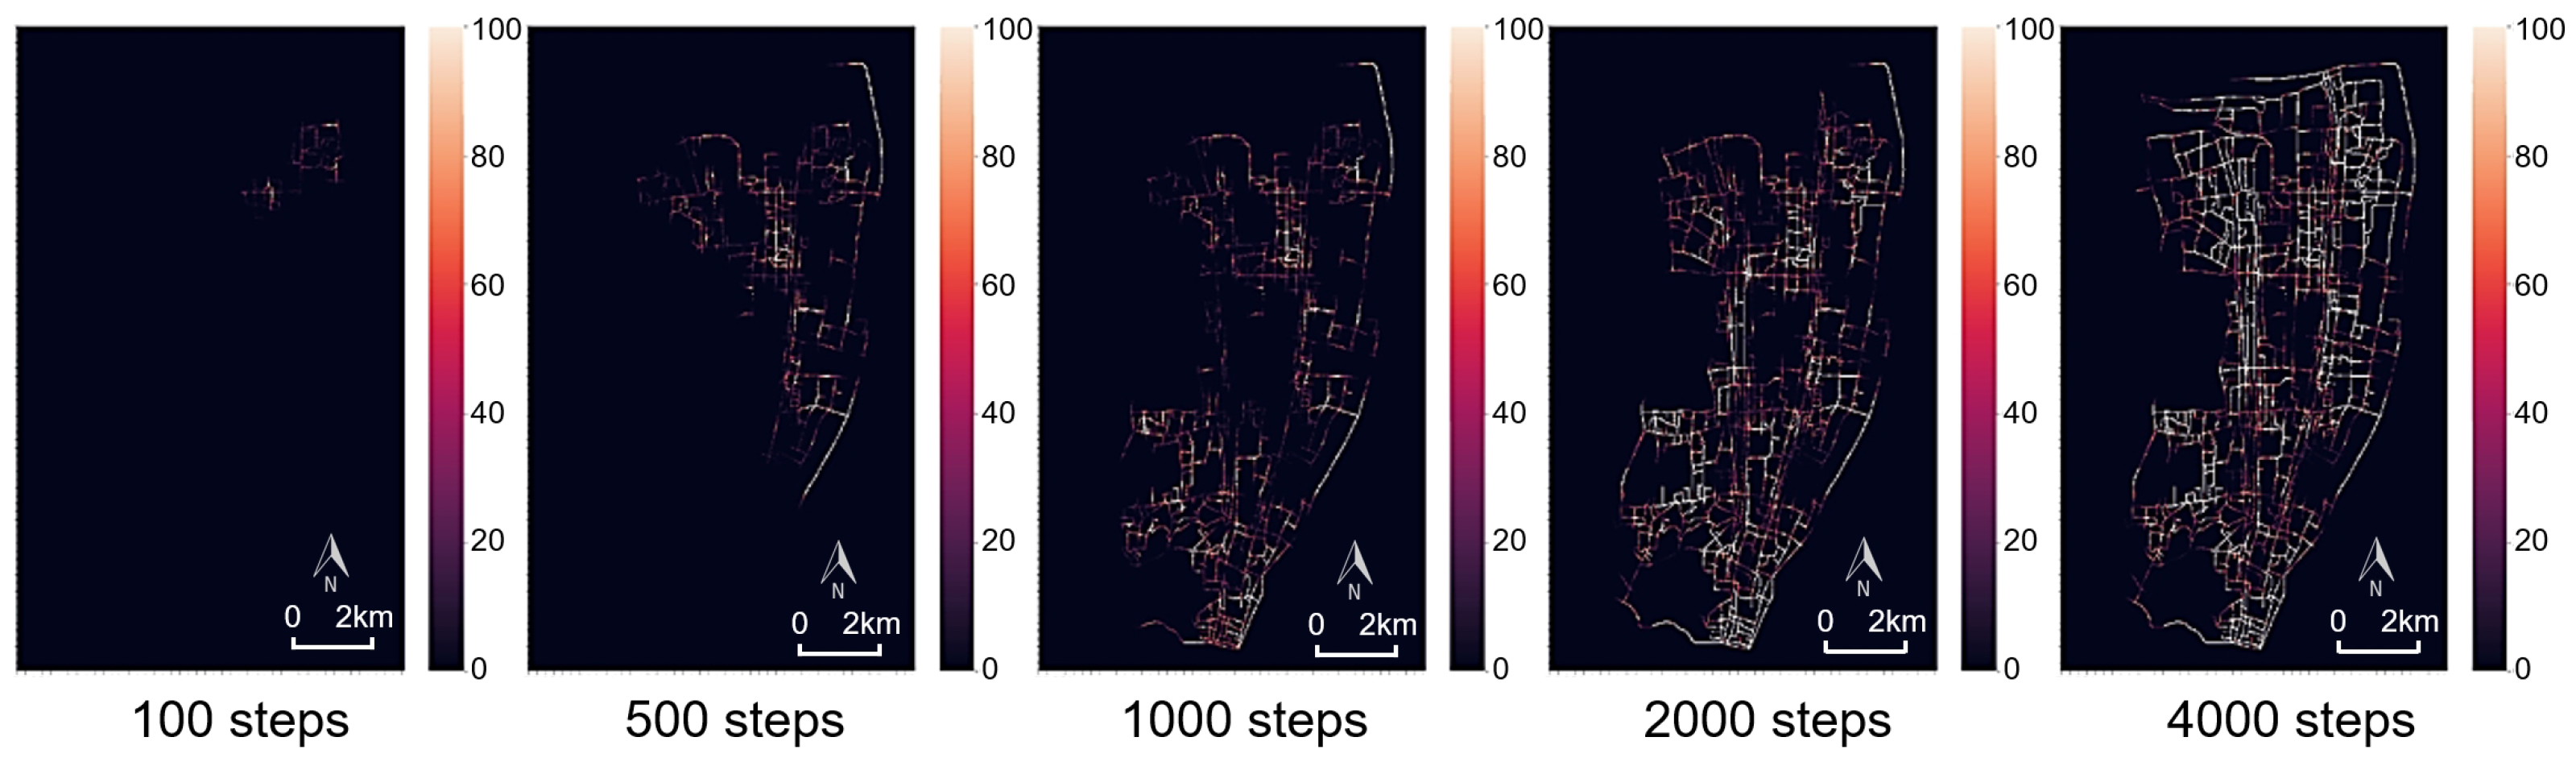
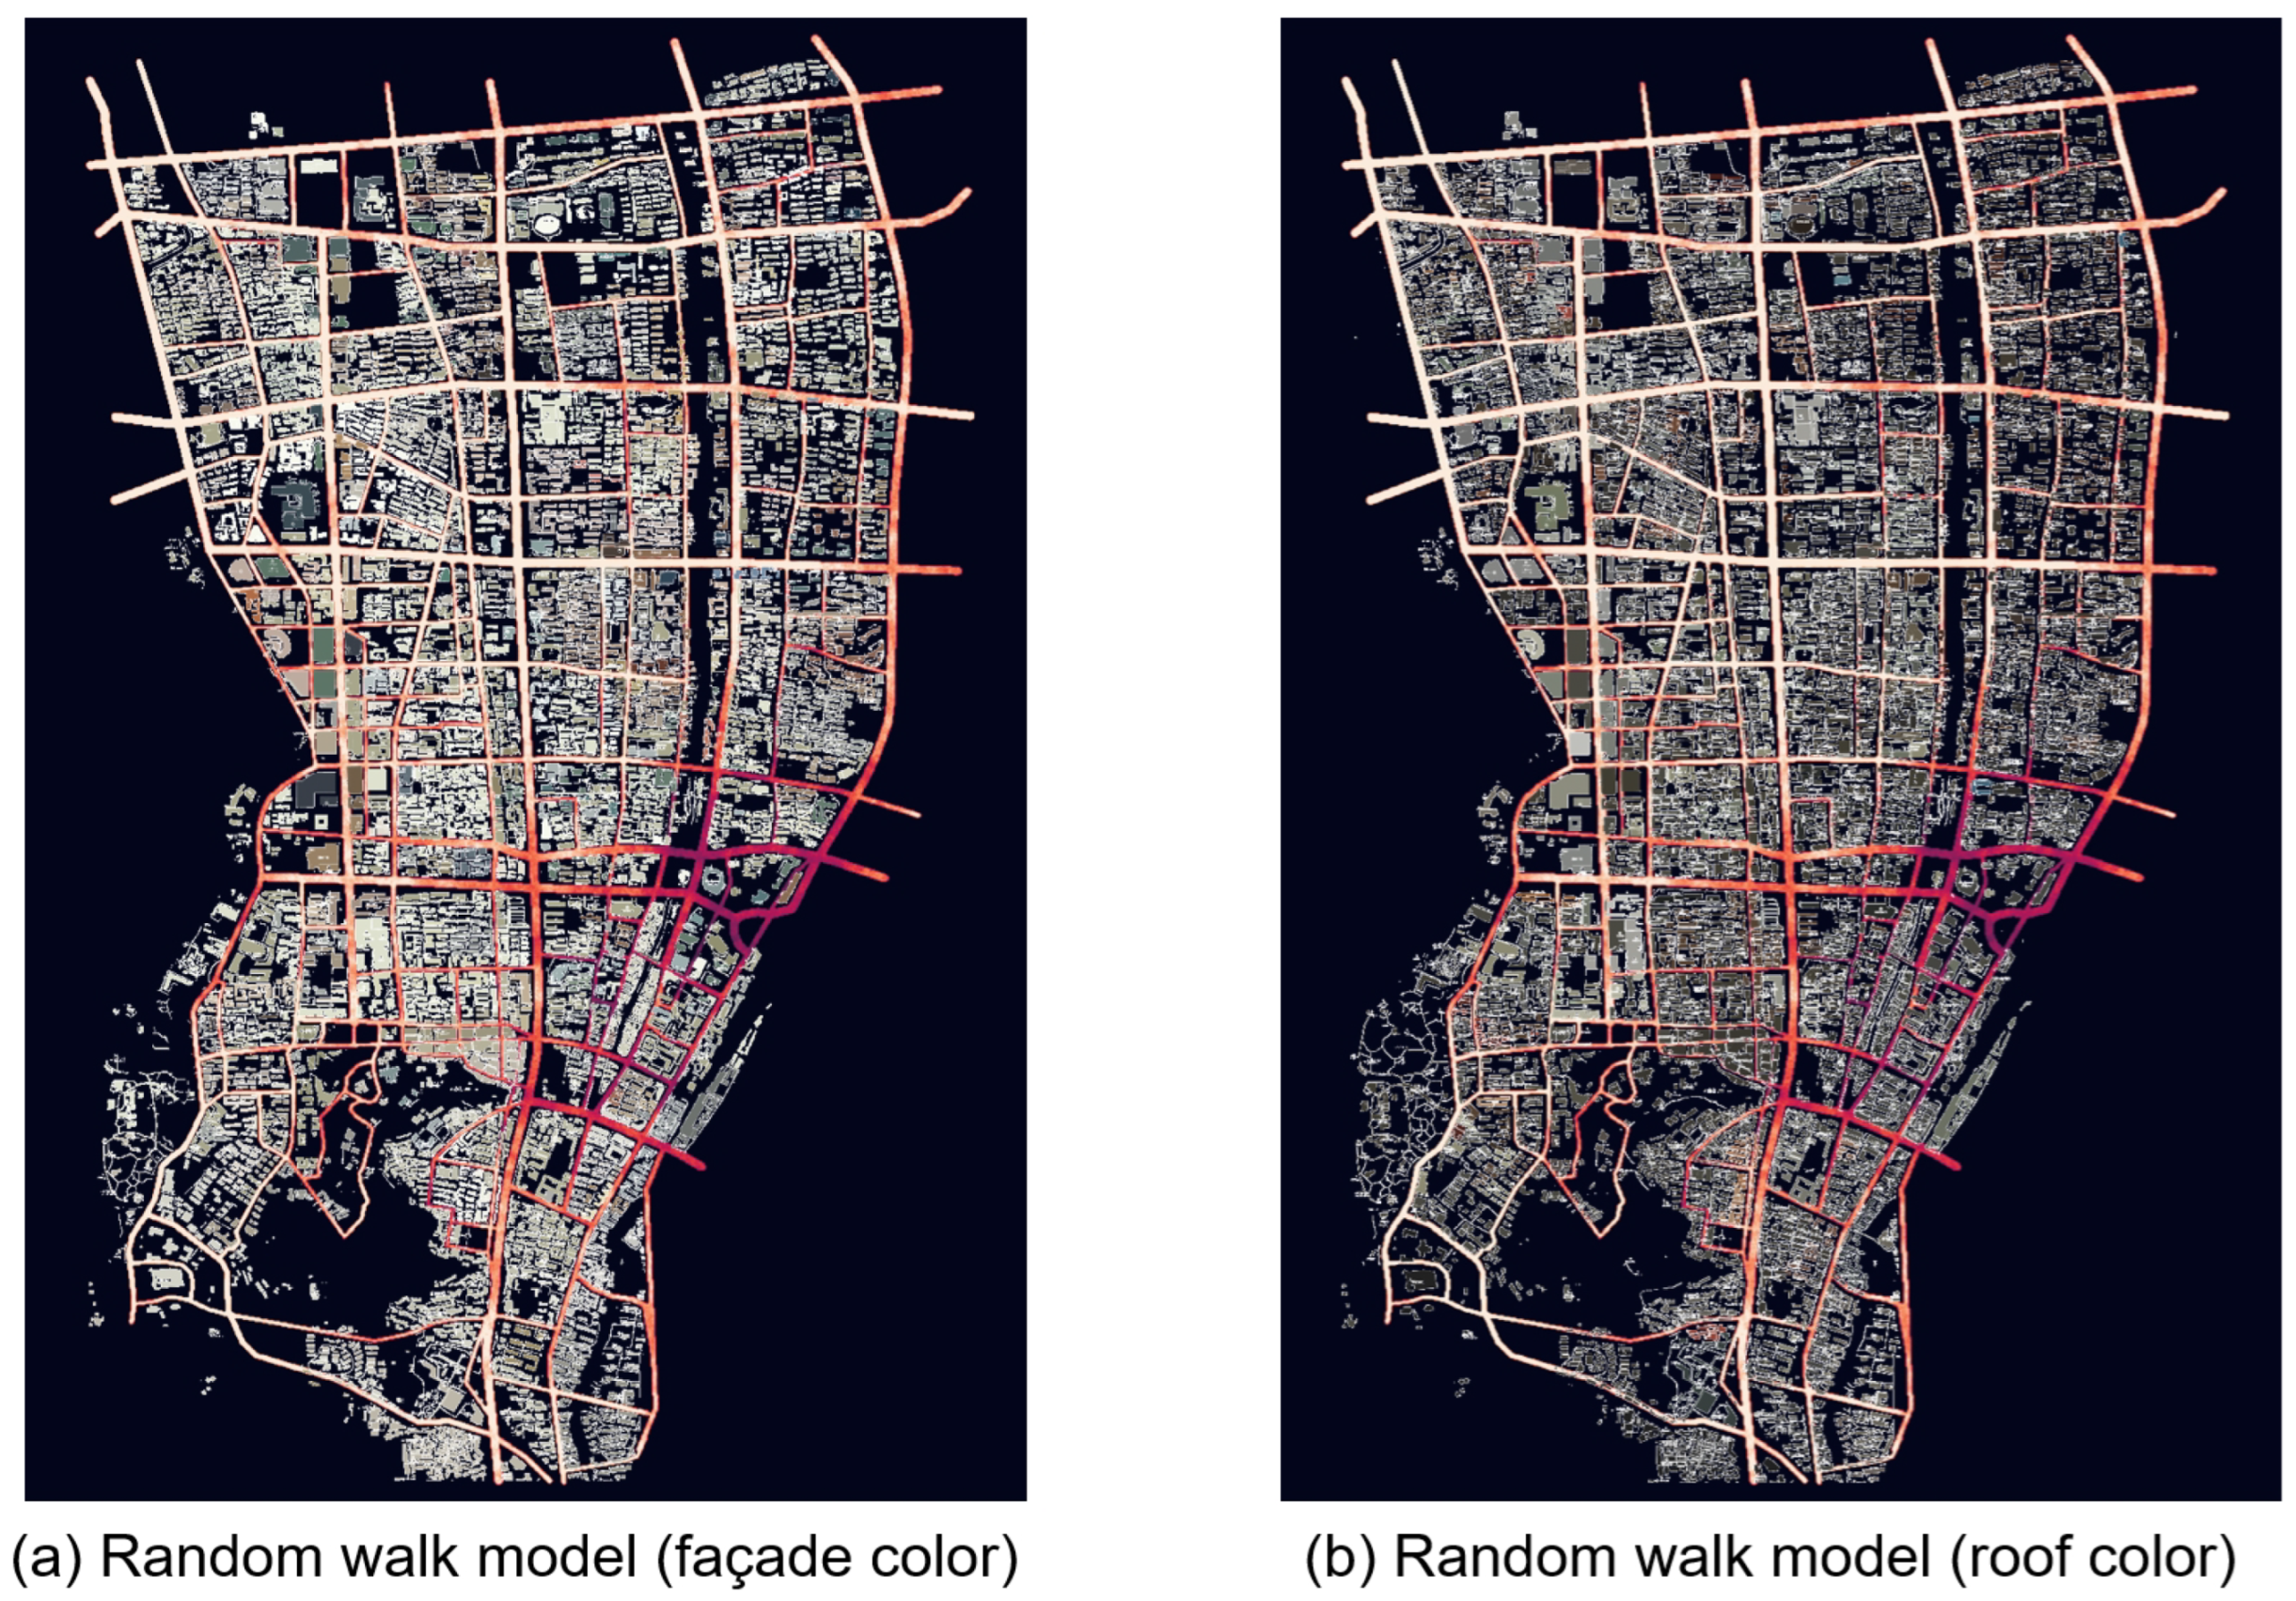
2.5. Random Walk Model in a Transportation Network

In this section, we employ the classic random walk model in the urban transportation network to simulate people’s movement [28], analyzing their passing frequency and its correlation with the color of the surrounding building roofs and façades. Initially, we obtain the structure of the transportation network in the study area, describing it using the adjacency matrix A. The elements of the adjacency matrix A i j are defined as 1 if there are edges between node i and node j and 0 if there are no edges between them. Suppose that at time step t, an individual is at node i in the network. In the subsequent step, t + 1 , the individual will randomly traverse an edge of the node, i, with an equal probability of reaching a specific neighbor of node i. If p i ( t ) denotes the probability of someone being at node i in step t, then the probability of being at node j in step t + 1 is given by
p j ( t + 1 ) = p i ( t ) · A i j Σ j = 1 n A i j .
When a person walks randomly for T steps, we record the frequency of passing through each node and edge, enabling us to calculate the frequency and conduct quantitative research on the main nodes and edges in the network.
Figure 5 illustrates a random walk process in the study area in the form of a heat map, with T set to 4000. When observing the progression, after 100 steps, only a small portion of the entire network has been traversed. By the 500th step, approximately half of the entire transportation network is covered. After 1000 steps, the passed intersections and road sections encompass most of the area. At 2000 steps, the trajectory covers the majority of the transportation network and starts repeating at certain intersections or sections. Notably, whiter sections in the heat map indicate higher frequencies of passing. After 4000 steps, almost all intersections and sections have been traversed, with the process continually repeating at several key intersections and sections. The higher the frequency of repetition, the more crucial these intersections and sections are deemed in the transportation network.

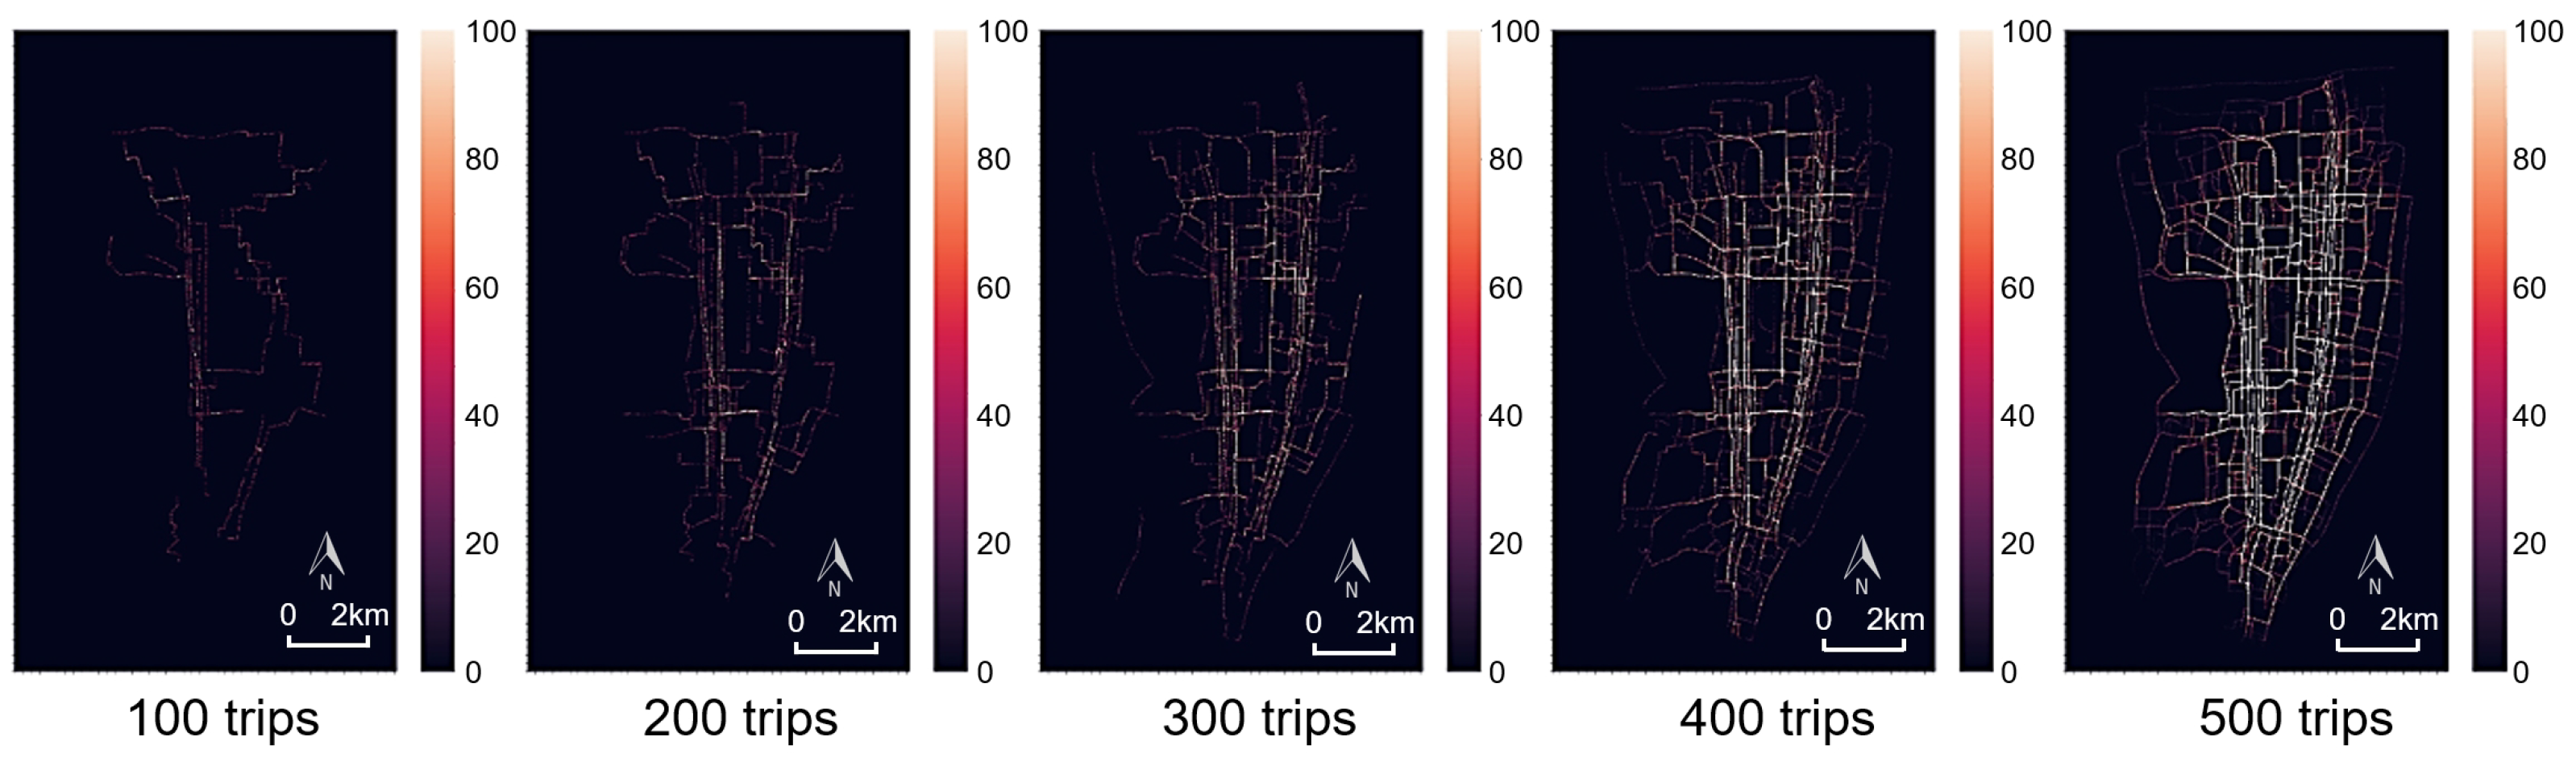
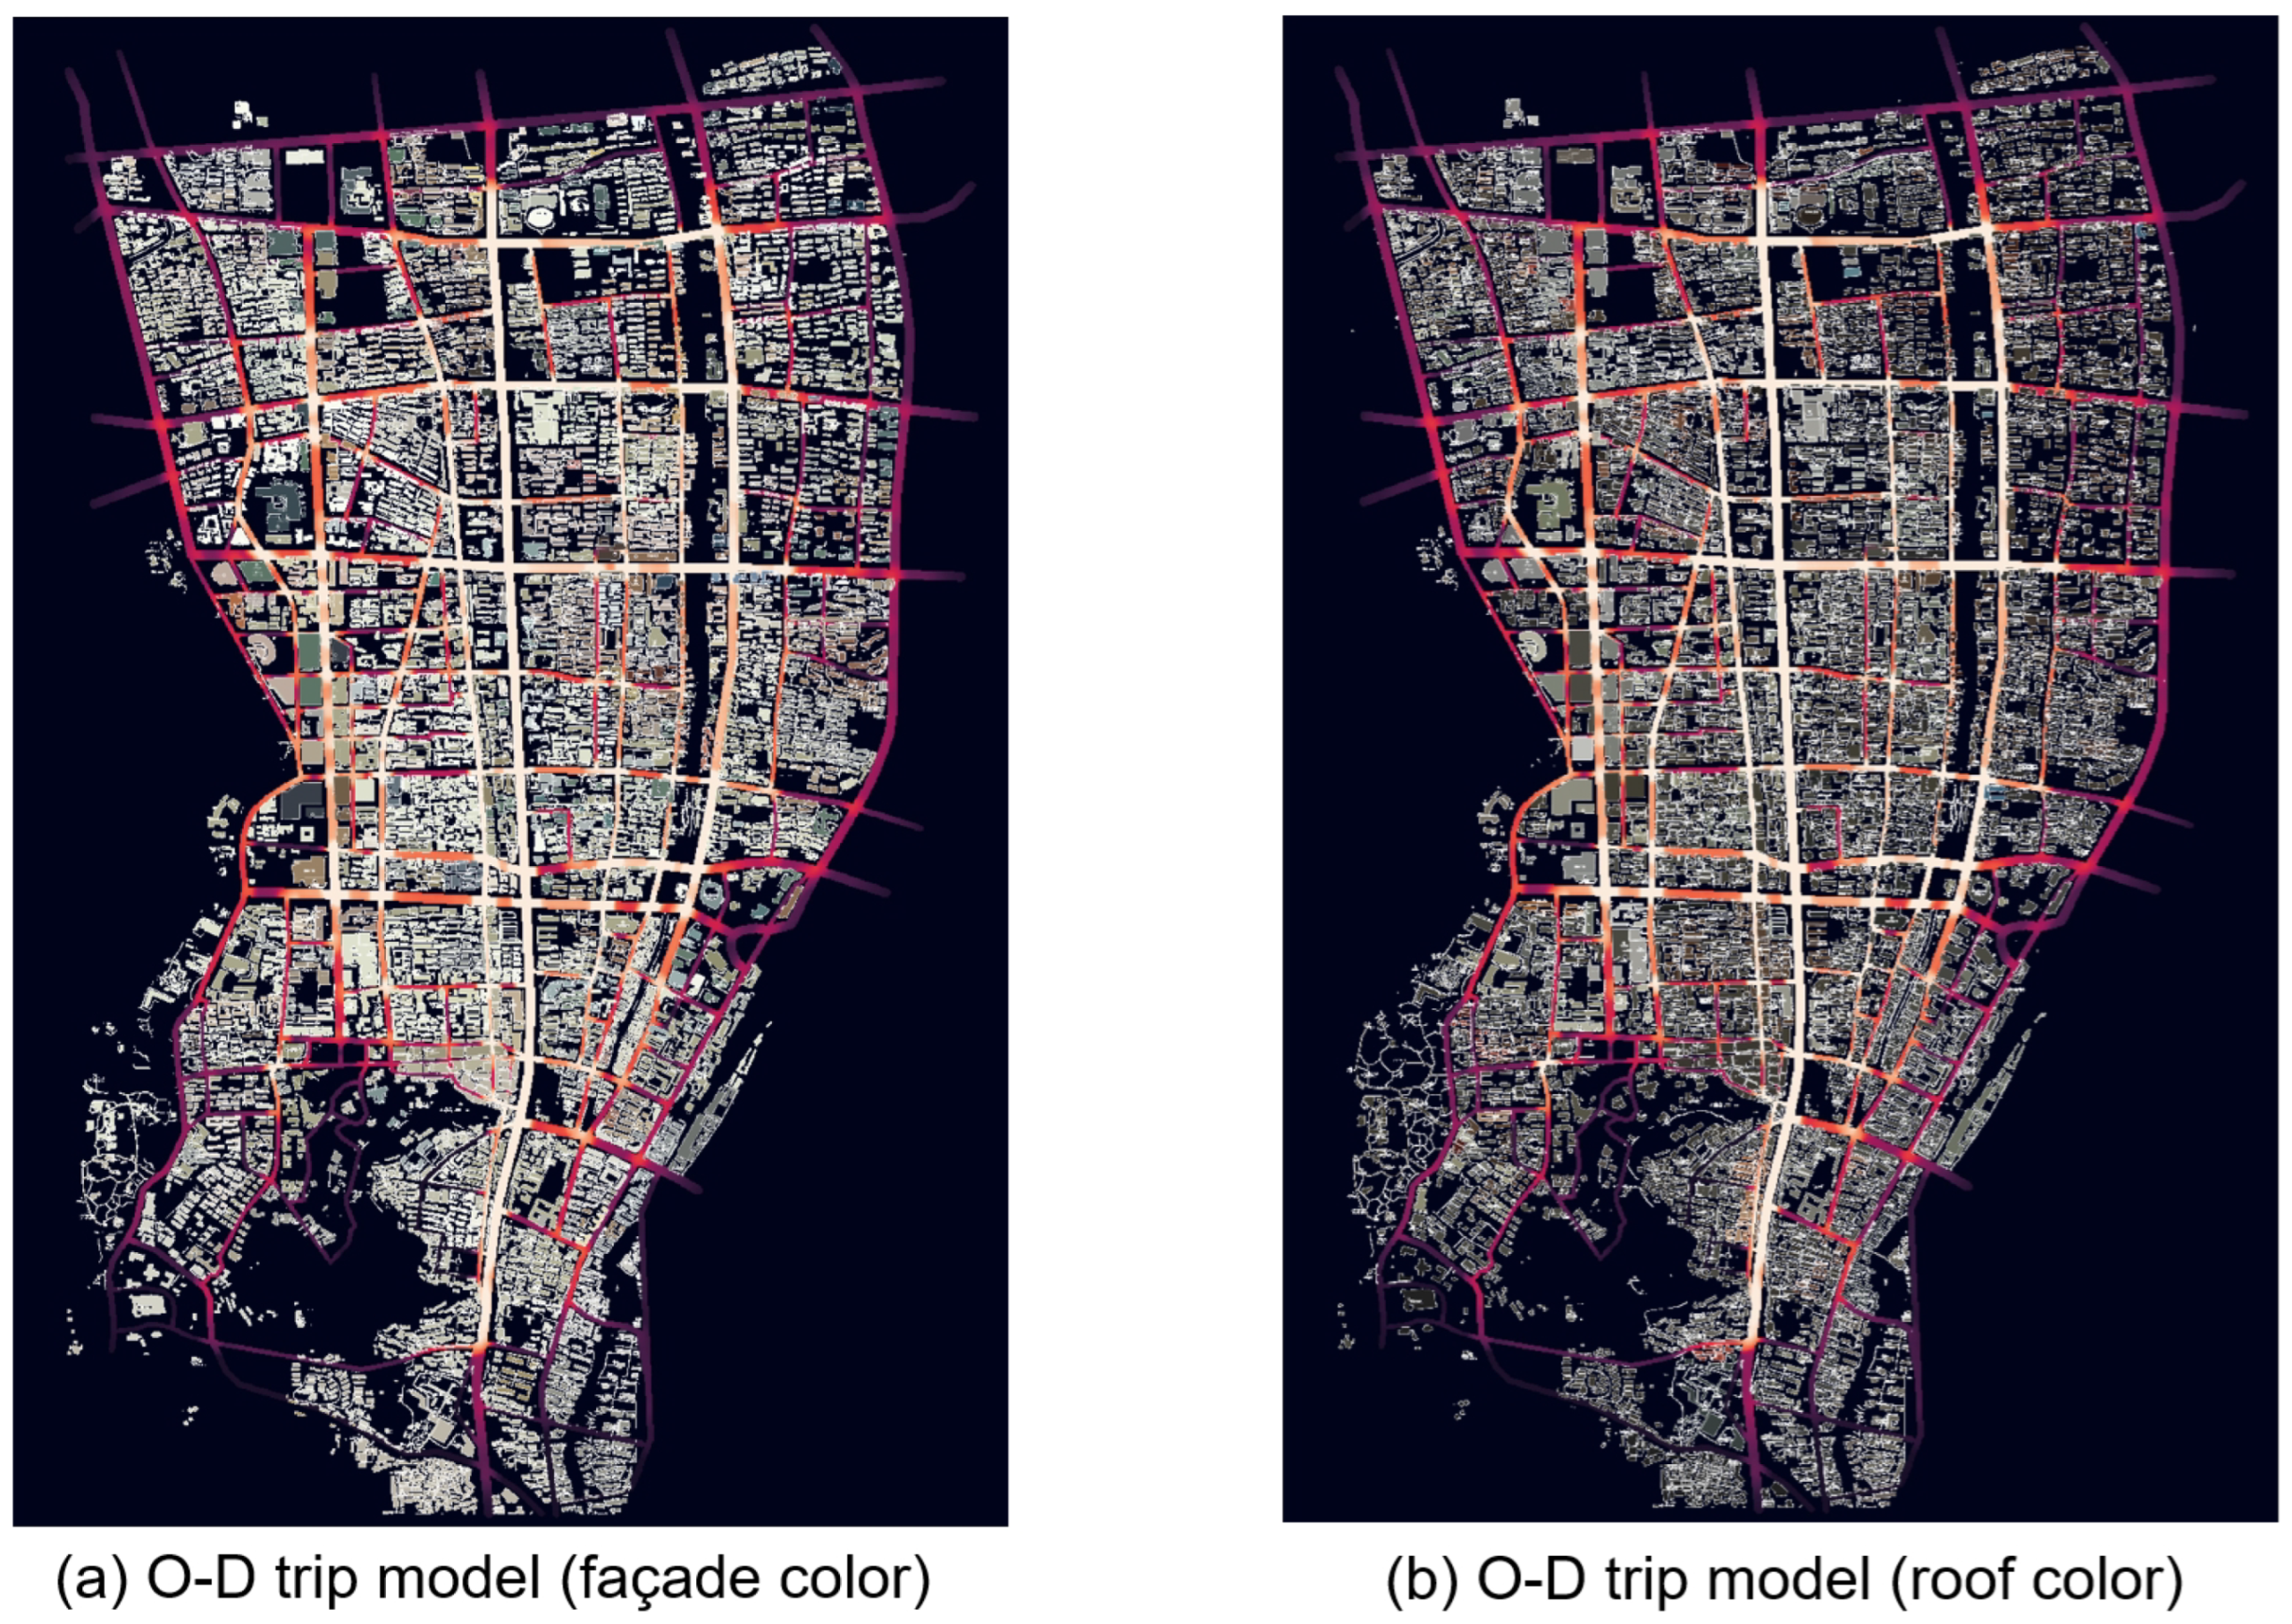
2.6. Origin–Destination Trip Model

In this study, we leverage the origin–destination (OD) trip model in the urban transportation network to simulate the organized movements of people [49]. Our analysis focuses on their passing frequency and the correlation with the color of the surrounding building roofs and façades. Additionally, we consider functional areas, illustrating them in the main urban area of Hangzhou in Figure 6.
In Figure 6, the gray area (A) represents commercial complexes, hospitals, railway stations, and attractions, indicating the highest population density. The pink area (B) generally signifies residential areas with a moderate population density. The purple area (C) corresponds to business offices, schools, and public institutions, indicating a relatively lower population density. During the OD trip process, the probability distribution of the starting and ending points is set as π = [ 0.4 , 0.3 , 0.2 , 0.1 ] . This implies that for each trip, the probability of the intersection within the gray area (A) as the starting and ending point is 0.4, the probability of the intersection within the pink area (B) is 0.3, and the probability within the purple area (C) is 0.2. The probability of other intersections as starting and ending points is 0.1. Subsequently, we apply the OD trip model to the transportation network in urban Hangzhou, where a person randomly selects a pair of starting and ending points for each trip according to the probability distribution π .
Figure 7 illustrates an OD trip process in the study area in the form of a heat map, with a total of 500 trips considered. After 100 random trips, only a few main roads in the central part of the network are traversed. By the 200th trip, coverage extends to roughly half of the central area of the network. After 300 trips, the passed road sections encompass the majority of the area. Following 400 trips, the intersections and sections covering most of the transportation network are traversed, with the whiter sections indicating a higher frequency of passing. Upon reaching 500 trips, the person has traversed nearly all intersections and sections in the entire transportation network, repeatedly passing through key intersections in the central area. Ultimately, our observation reveals that the higher the frequency of repeated intersections and roads, the more significant these intersections and roads are in the transportation network, according to this model.

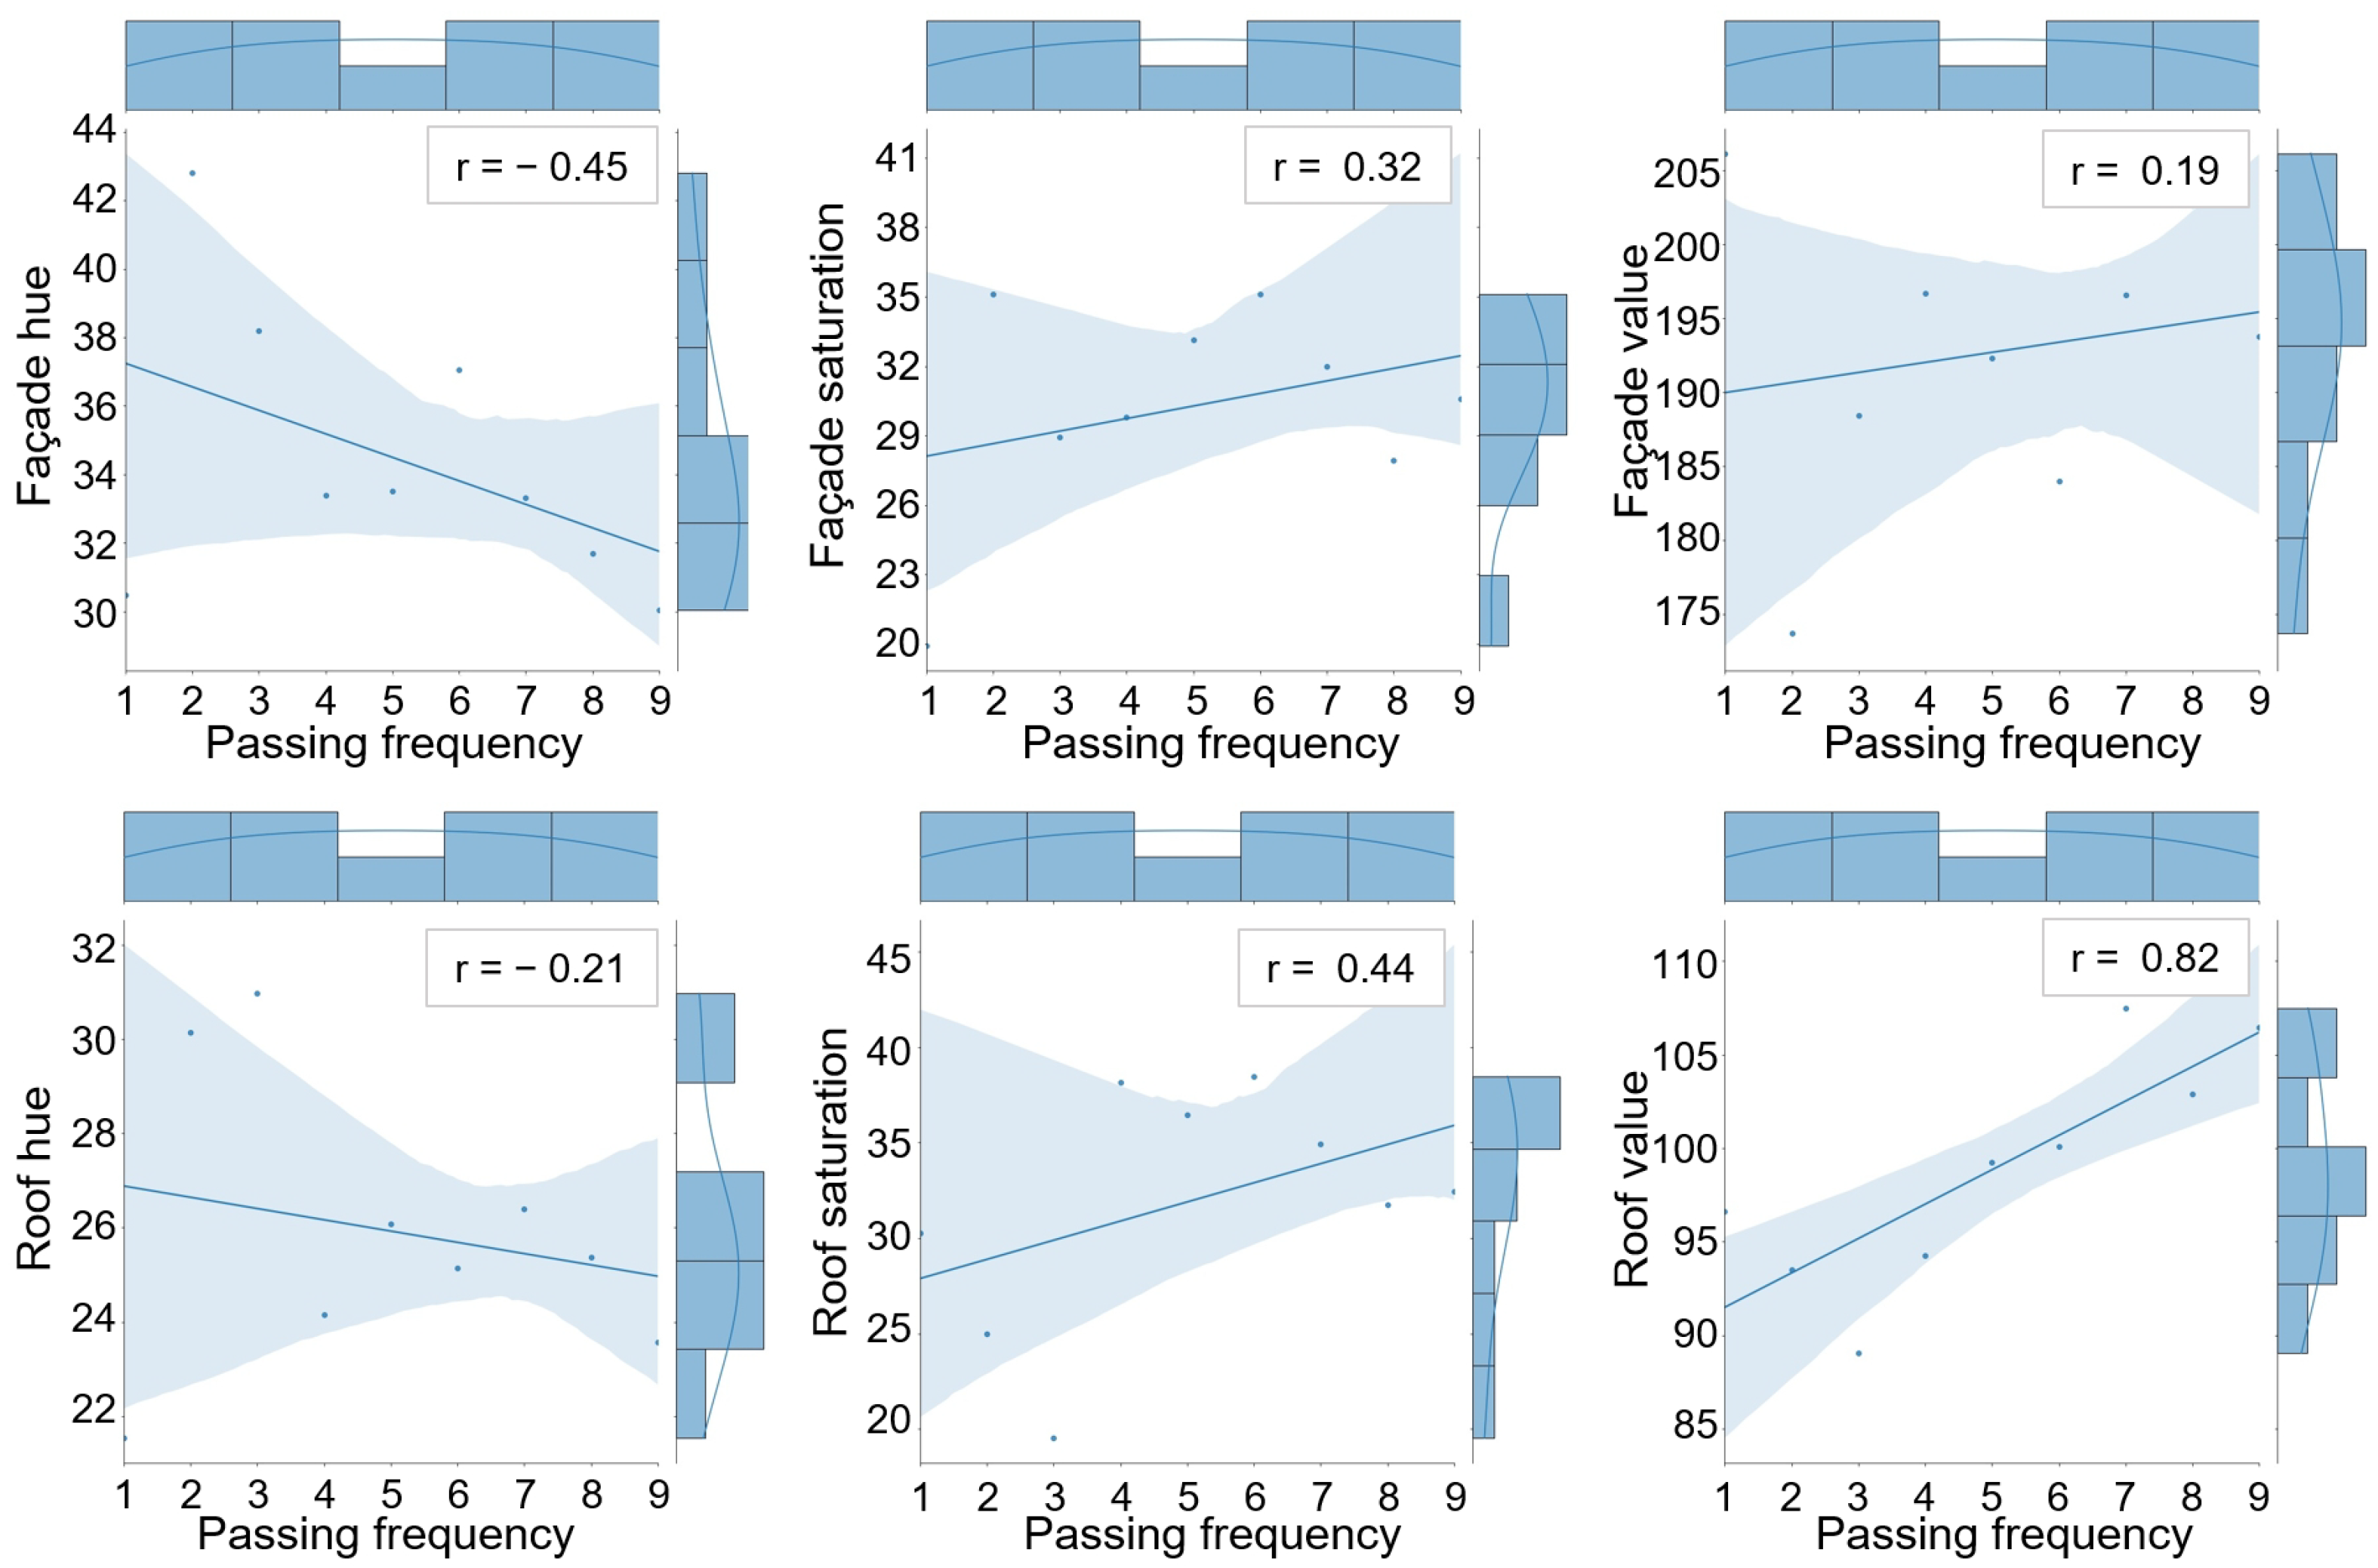
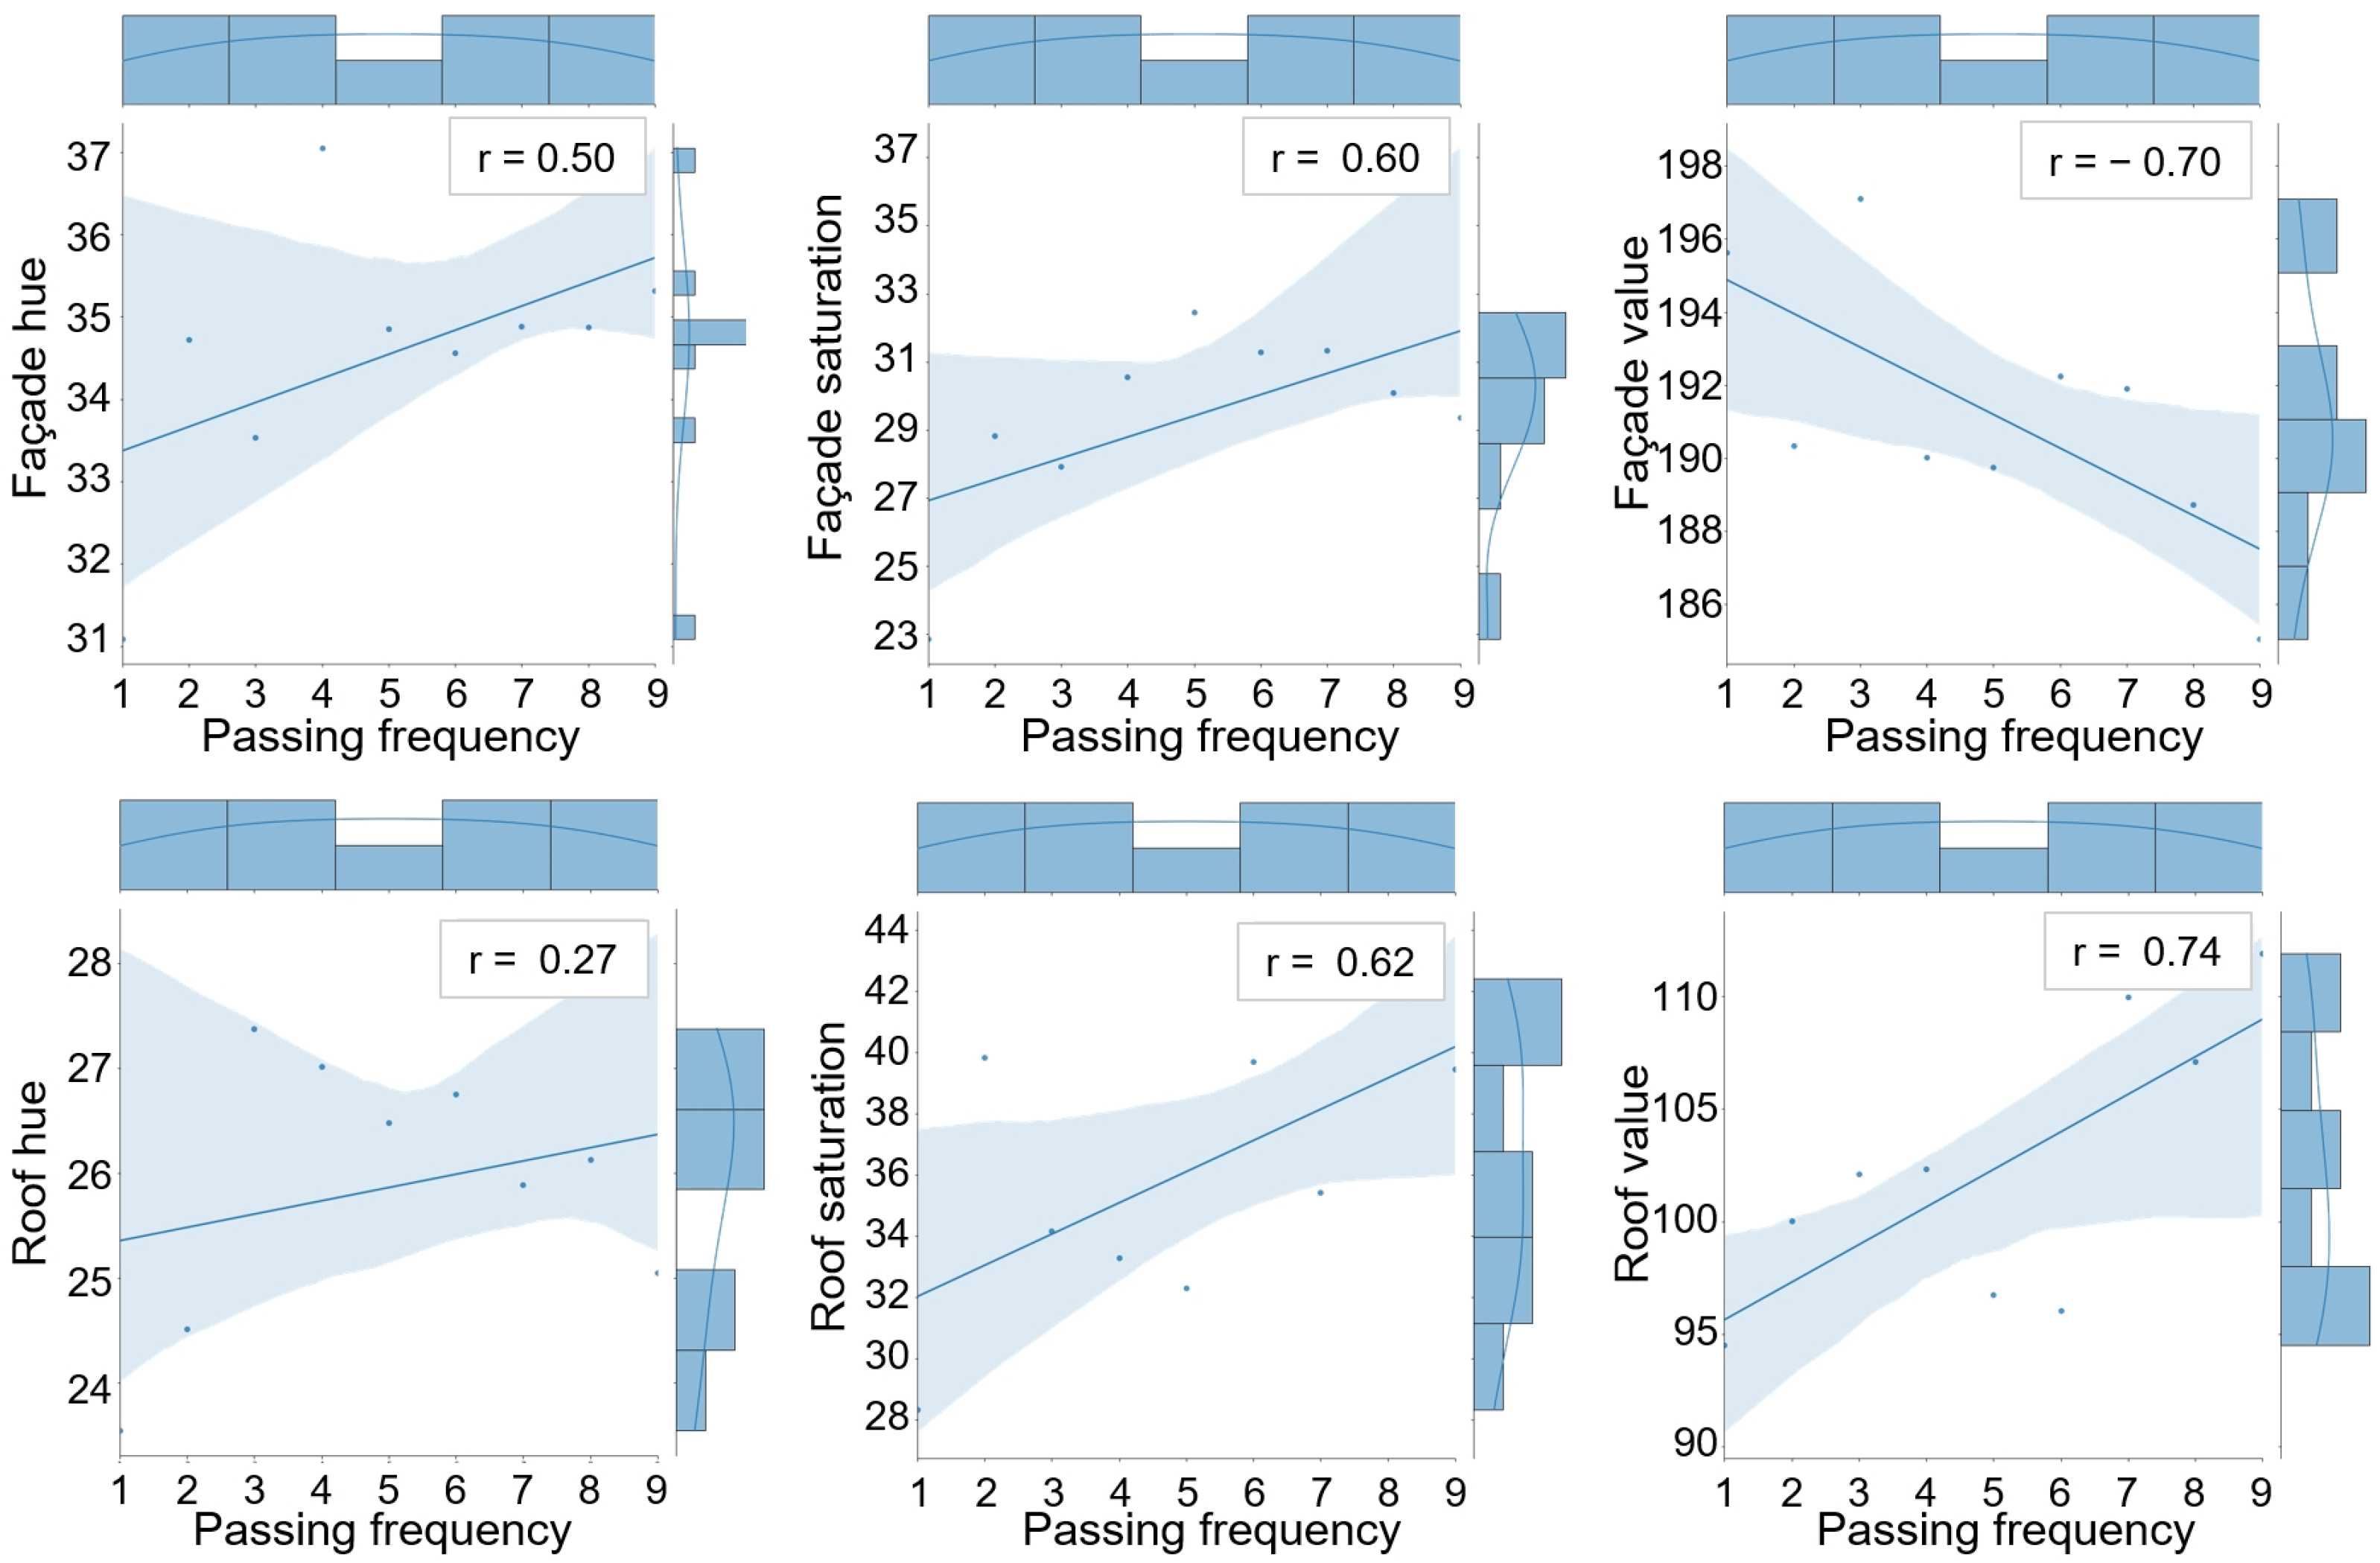
2.7. Correlation Analysis

The Pearson correlation coefficient ( ρ ) is a widely used statistical measure to assess the degree of correlation between two variables, with values ranging from −1 to 1 [50]. In this article, our analysis focuses on the passing frequency of people’s movement in the urban structure and the three-channel values of the roof and façade color of the surrounding buildings in the HSV space. For a passing frequency vector, X, and a certain channel value vector, Y, the Pearson correlation coefficient ρ is calculated as follows:
ρ = Σ i = 1 n ( X i X ¯ ) · ( Y i Y ¯ ) Σ i = 1 n ( X i X ¯ ) 2 · Σ i = 1 n ( Y i Y ¯ ) 2 ,
where X i represents the i-th value of variable X, and X ¯ represents the average value of the variable. It is important to note that the positive or negative value of ρ indicates the correlation properties of the two variables. If ρ > 0 , it signifies a positive correlation, indicating that as one variable increases, the other also increases. Conversely, if ρ < 0 , the two variables exhibit a negative correlation, implying that as one variable increases, the other decreases. Additionally, the absolute value of ρ represents the degree of correlation between the two variables. The greater the absolute value, the stronger the correlation. A correlation with an absolute value greater than 0.7 is considered strong, between 0.4 and 0.7 is moderate, between 0.2 and 0.4 is weak, and less than 0.2 indicates a very weak or uncorrelated relationship between the two variables.
In summary of the methods, the research methodology follows a systematic process flow. Initially, we acquired urban color metadata, followed by image preprocessing and color extraction procedures. Simultaneously, the metadata of urban structures was obtained, leading to the application of mathematical models and the extraction of statistical characteristics. Finally, a correlation analysis was conducted to examine the relationships between urban color features and urban structure features.

3. Results

We commence our analysis by examining the Pearson correlation coefficients between the random walk process in the transportation network and the three-channel values of the HSV color space for the urban façade and roof colors.
The outcomes of the random walk process are presented in the form of a heat map in Figure 8, showcasing the frequency of each road section in the random walk model. The intensity of the road section’s color indicates the frequency of passage, with the whiter sections signifying higher frequencies. Subsequently, we delve into the correlation coefficients between the passing frequency in the random walk model and the façade and roof colors in the HSV color space, as depicted in Figure 9. Our analysis reveals a moderate correlation between the passing frequency and façade hue (a Pearson correlation coefficient of −0.45). However, the correlation with the façade saturation is only weak (a Pearson correlation coefficient of 0.32), and the correlation with the façade value is very weak (a Pearson correlation coefficient of 0.19). Turning to roof color, we observe a weak correlation with the passing frequency for the roof hue (a Pearson correlation coefficient of −0.22) and a moderate correlation for the roof saturation (a Pearson correlation coefficient of 0.44). The highest correlation is noted between the passing frequency and roof value, indicating a strong correlation (a Pearson correlation coefficient of 0.82).
In the subsequent analysis, we focus on scrutinizing the Pearson correlation coefficients between the OD trip process in the transportation network and the three-channel values of the HSV color space for urban façade and roof colors. By employing computational tools, we extract the color information of the façades and roofs along high-frequency road sections, and the results are illustrated in Figure 10. In this context, each iteration of a person’s travel, determined by the probability distribution π , contributes to recording the frequency of passage through each node and edge. This allows us to conduct a quantitative exploration of the key intersection sections in the network based on the OD trip mode. Subsequently, the simulation results for the main urban area of Hangzhou are presented in the form of a heat map in Figure 10, where a whiter road section indicates a higher passing frequency.
Ultimately, we delve into the correlation coefficients between the passing frequency of the OD trip model and the façade color, as well as the roof color in the HSV color space, as illustrated in Figure 11. Notably, there are at least moderate correlations between the passing frequency and all three channels of the façade color. Specifically, the Pearson correlation coefficient between the passing frequency and façade hue is 0.50, and the Pearson correlation coefficient between the passing frequency and façade saturation is 0.60. The coefficient between the passing frequency and façade value is −0.70, indicating a negative but strong correlation. Regarding the roof color, we observe a weak correlation between the passing frequency and roof hue (a Pearson correlation coefficient of 0.27) and a moderate correlation between the passing frequency and roof saturation (a Pearson correlation coefficient of 0.62). The correlation between the passing frequency and roof value is the highest, indicating a strong correlation (a Pearson correlation coefficient of 0.74).
Our research uncovers a significantly stronger correlation between the color of building façades and the structure of the transportation network compared to the relationship between the color of building roofs and the network structure. Additionally, we observe a more pronounced correlation between urban color and the origin–destination trip model in the city, as opposed to the correlation between urban color and the random walk model. A key finding emphasizes that, during travel to destinations, the frequency of road segments is linked to the color attributes of façades. Specifically, a higher frequency is associated with bluer façades, increased saturation, and lower brightness. These correlation coefficients fall within the moderate range of 0.5 to 0.7, indicating meaningful correlations. These findings imply a direct proportionality between the utilization of main roads and urban color, underscoring a substantial relationship between the structure of the transportation network and urban color.

4. Discussion

Our research brings forth several distinctive aspects that set it apart from the existing work in the field. First and foremost, we leverage drone technology in an innovative manner to systematically analyze urban color dynamics. While drones have found applications in urban studies, our approach stands out by focusing on the collection of high-resolution data, specifically from building façades and roofs. This emphasis allows us to uncover nuanced color patterns that contribute to a more comprehensive understanding of urban aesthetics. A second key differentiator is our effort to bridge the gap between studies that typically examine urban color or macroscopic urban structures in isolation. In our research, we establish correlations between building colors and macroscopic urban structures, offering a holistic perspective on the intricate interplay between visual aesthetics and architectural features. Lastly, our study introduces and applies statistical methods to systematically analyze urban color patterns. By mapping colors to the HSV color space and establishing correlations with building structures, we contribute a nuanced understanding of how architectural features influence the overall aesthetic composition of urban environments.
Despite these notable contributions, it is essential to acknowledge certain limitations for the sake of research transparency. Firstly, our study focused exclusively on the main urban area of Hangzhou, and while the findings are indicative, they may not fully encapsulate the diversity present across the entire city. Generalizing our results to the broader cityscape should be approached with caution. Secondly, the sensitivity of drone imagery to weather conditions and the time of capture poses a challenge. While efforts were made to account for these variations, factors such as cloud cover and seasonal changes may have introduced some level of variability in the collected data. Lastly, caution is warranted when generalizing our findings to other cities. Urban color dynamics are intricately influenced by unique cultural, geographical, and developmental factors. The transferability of our results to different contexts may necessitate further exploration.

5. Future Recommendations

Notwithstanding the above limitations, we firmly believe that our study contributes substantially to the field by providing in-depth insights into the correlation between urban color patterns and macroscopic urban structures. Meticulous measures were taken to address and mitigate potential challenges, and our findings enrich the existing body of knowledge in urban studies. In future work, we aim to explore methodologies that allow for a more nuanced classification of building types, considering factors such as architectural style, function, building materials, and cultural significance [51,52,53,54]. Additionally, our study area, characterized by distinctive urban color patterns and macroscopic urban structures, is also influenced by water-related features. The presence of rivers and lakes plays a significant role in shaping the visual aesthetics of the city. By acknowledging these factors, our future research aims to provide a comprehensive analysis that considers the interplay between water elements and the identified urban characteristics.

6. Conclusions

This article provides a systematic elucidation of the general methodology employed for the quantitative exploration of the intricate relationship between urban color and macroscopic urban structures through the application of statistical methods. The overarching goal of this method is to enhance our understanding of color variations across diverse urban areas. Through the integration of color data with architectural structure data, we can gain a comprehensive insight into the city’s structure and unveil potential correlations between urban color and architectural features. Our approach commences with the utilization of drones to collect and extract colors from the roofs and façades of buildings in the main urban area of Hangzhou. These colors are then meticulously mapped to the HSV color space. Subsequently, we introduce both a random walk model and an origin–destination trip model within the urban transportation network to simulate the movement of people in the city. The random walk model simulates individuals navigating aimlessly through the city, moving randomly along its roads. Conversely, the OD trip model involves individuals generating an origin–destination pair based on functional areas, following a predetermined probability distribution, and traversing from the initial location to the destination along the shortest path in the transportation network.
Next, we delve into the analysis of the correlation between the color spaces of building façades and roofs and the outcomes derived from the random walk model and origin–destination trip model, respectively. Our study reveals a notably higher correlation between the building façade color and the transportation network structure compared to that between the building roof color and the network structure. Moreover, we identify a more substantial correlation between urban color and the origin–destination trip model in the city than between urban color and the random walk model. A pivotal discovery underscores that as people travel to their destinations, the frequency of road segments correlates with the color attributes of façades. Specifically, a higher frequency corresponds to bluer façades, increased saturation, and lower brightness. These correlation coefficients fall within the range of 0.5 to 0.7, indicating moderate correlations.
The outcomes of our research bear meaningful implications for both research and practice. Firstly, our study contributes to the expanding realm of research on urban color dynamics. The unveiled correlations between building colors and macroscopic urban structures pave the way for further exploration into the visual features that define cities. Furthermore, the application of statistical methods to analyze urban color patterns provides a systematic approach for future studies in this domain. Researchers can leverage similar methodologies to gain profound insights into the relationships between architectural structures and visual aesthetics. Turning to practical implications, our adept use of drones for color data collection and analysis contributes to validating drone technology in urban research. This may serve as inspiration for future studies to explore the potential of drones in capturing high-resolution data for urban planning and design. Additionally, the observed correlations between building colors and passing frequency offer valuable input for urban planning and design guidelines. City planners and architects may integrate these findings into decision-making processes related to color schemes and architectural elements to enhance the visual appeal of urban spaces.

Author Contributions

Conceptualization, R.L.; data curation, R.L.; formal analysis, R.L.; funding acquisition, M.W.; methodology, M.W.; project administration, R.L. and M.W.; software, M.W.; validation, R.L.; visualization, M.W.; writing—original draft, M.W.; writing—review and editing, R.L. All authors have read and agreed to the published version of the manuscript.

Funding

This research was supported by the NSFC under grant No. 62203388.

Institutional Review Board Statement

Not applicable.

Informed Consent Statement

Not applicable.

Data Availability Statement

The code and datasets used for the numerical experiments are available upon the publication.

Conflicts of Interest

The authors declare no conflicts of interest.

References

  1. Jung, C.; Mahmoud, N.S.A.; El Samanoudy, G.; Al Qassimi, N. Evaluating the color preferences for elderly depression in the United Arab Emirates. Buildings 2022, 12, 234. [Google Scholar] [CrossRef]
  2. Wan, J.; Zhou, Y.; Li, Y.; Su, Y.; Cao, Y.; Zhang, L.; Ying, L.; Deng, W. Research on color space perceptions and restorative effects of blue space based on color psychology: Examination of the yijie district of dujiangyan city as an example. Int. J. Environ. Res. Public Health 2020, 17, 3137. [Google Scholar] [CrossRef]
  3. Xu, Z.; Zheng, X. Roadmap of moving urban colour toward cultural sustainability in China. Color Res. Appl. 2021, 46, 222–239. [Google Scholar] [CrossRef]
  4. Boeri, C. Color loci placemaking: The urban color between needs of continuity and renewal. Color Res. Appl. 2017, 42, 641–649. [Google Scholar] [CrossRef]
  5. Gou, A.; Wang, J. Research on the location characters of urban color plan in China. Color Res. Appl. 2008, 33, 68–76. [Google Scholar] [CrossRef]
  6. Dong, X.; Kong, Y. Urban Colourscape Planning: A Colour Study of the Architecture of Karlskrona. In Urban Colourscape Planning; Blekinge Institute of Technology: Karlskrona, Sweden, 2019. [Google Scholar]
  7. Gou, A. Method of urban color plan based on spatial configuration. Color Res. Appl. 2013, 38, 65–72. [Google Scholar] [CrossRef]
  8. Nowghabi, A.S.; Talebzadeh, A. Psychological influence of advertising billboards on city sight. Civ. Eng. J. 2019, 5, 390–397. [Google Scholar] [CrossRef]
  9. Ma, B.; Hauer, R.J.; Xu, C. Effects of design proportion and distribution of color in urban and suburban green space planning to visual aesthetics quality. Forests 2020, 11, 278. [Google Scholar] [CrossRef]
  10. Odetti, J.V. The study of color as a component of urban cultural construction: A theoretical reflection and methodological proposal. Color Res. Appl. 2023, 48, 453–467. [Google Scholar] [CrossRef]
  11. Wang, J.; Zhang, L.; Gou, A. Study of the color characteristics of residential buildings in Shanghai. Color Res. Appl. 2021, 46, 240–257. [Google Scholar] [CrossRef]
  12. Peng, Z.; Sun, H.; Pan, D.; Tao, W.; Zeng, F.; Yang, J.; Wang, H. The Use of Quantitative Methods to Study the Colours of Mani Heaps in Tibet: A Dêngqên County Case Study. Int. J. Humanit. Arts Comput. 2021, 15, 152–169. [Google Scholar] [CrossRef]
  13. Mu, Y.; Lin, W.; Diao, X.; Zhang, Z.; Wang, J.; Lu, Z.; Guo, W.; Wang, Y.; Hu, C.; Zhao, C. Implementation of the visual aesthetic quality of slope forest autumn color change into the configuration of tree species. Sci. Rep. 2022, 12, 1034. [Google Scholar] [CrossRef]
  14. Yang, J.; Wang, X.R.; Zhao, Y. Leaf color attributes of urban colored-leaf plants. Open Geosci. 2022, 14, 1591–1605. [Google Scholar] [CrossRef]
  15. Naige, C.; Xiaofan, X.; Minghong, T.; Xianming, W. A Spatial Analysis of Urban Color Harmony in Five Global Metropolises. J. Resour. Ecol. 2022, 13, 238–246. [Google Scholar] [CrossRef]
  16. Zhong, T.; Ye, C.; Wang, Z.; Tang, G.; Zhang, W.; Ye, Y. City-scale mapping of urban façade color using street-view imagery. Remote. Sens. 2021, 13, 1591. [Google Scholar] [CrossRef]
  17. Gou, A.; Wang, J. A comparison between wishes and status: Gray is not the preference for residents while the city shows neutral colors. Color Res. Appl. 2017, 42, 650–663. [Google Scholar] [CrossRef]
  18. Li, K.R.; Yang, Y.Q.; Zheng, Z.Q. Research on color harmony of building façades. Color Res. Appl. 2020, 45, 105–119. [Google Scholar] [CrossRef]
  19. Zhou, Z.; Zhong, T.; Liu, M.; Ye, Y. Evaluating building color harmoniousness in a historic district intelligently: An algorithm-driven approach using street-view images. Environ. Plan. Urban Anal. City Sci. 2023, 50, 1838–1857. [Google Scholar] [CrossRef]
  20. Zhang, L.; Cheng, Y.; Ma, L. A Quantitative Study on the Colour of City Landmark Landscape Architectures. In Journal of Physics: Conference Series; IOP Publishing: Bristol, UK, 2019; Volume 1288, p. 012011. [Google Scholar]
  21. Yang, M. Investigating seasonal color change in the environment by color analysis and information visualization. Color Res. Appl. 2020, 45, 503–511. [Google Scholar] [CrossRef]
  22. Shen, S.; Yao, Y.; Li, C. Quantitative study on landscape colors of plant communities in urban parks based on natural color system and M-S theory in Nanjing, China. Color Res. Appl. 2022, 47, 152–163. [Google Scholar] [CrossRef]
  23. Riascos, A.P.; Mateos, J.L. Random walks on weighted networks: A survey of local and non-local dynamics. J. Complex Netw. 2021, 9, cnab032. [Google Scholar] [CrossRef]
  24. Yamamoto, T.; Takamura, S.; Morikawa, T. Structured random walk parameter for heterogeneity in trip distance on modeling pedestrian route choice behavior at downtown area. Travel Behav. Soc. 2018, 11, 93–100. [Google Scholar] [CrossRef]
  25. Shaikh, S.; Talpur, M.A.H.; Baig, F.; Tariq, F.; Khahro, S.H. Adoption of Electric Motorcycles in Pakistan: A Technology Acceptance Model Perspective. World Electr. Veh. J. 2023, 14, 278. [Google Scholar] [CrossRef]
  26. Gordon, J.B.; Koutsopoulos, H.N.; Wilson, N.H. Estimation of population origin–interchange–destination flows on multimodal transit networks. Transp. Res. Part C Emerg. Technol. 2018, 90, 350–365. [Google Scholar] [CrossRef]
  27. Farahani, R.Z.; Miandoabchi, E.; Szeto, W.Y.; Rashidi, H. A review of urban transportation network design problems. Eur. J. Oper. Res. 2013, 229, 281–302. [Google Scholar] [CrossRef]
  28. Noh, J.D.; Rieger, H. Random walks on complex networks. Phys. Rev. Lett. 2004, 92, 118701. [Google Scholar] [CrossRef]
  29. Zhong, C.; Arisona, S.M.; Huang, X.; Batty, M.; Schmitt, G. Detecting the dynamics of urban structure through spatial network analysis. Int. J. Geogr. Inf. Sci. 2014, 28, 2178–2199. [Google Scholar] [CrossRef]
  30. Mohammed, M.; Oke, J. Origin-destination inference in public transportation systems: A comprehensive review. Int. J. Transp. Sci. Technol. 2023, 12, 315–328. [Google Scholar] [CrossRef]
  31. Bhellar, M.G.; Talpur, M.A.H.; Khahro, S.H.; Ali, T.H.; Javed, Y. Visualizing Travel Accessibility in a Congested City Center: A GIS-Based Isochrone Model and Trip Rate Analysis Considering Sustainable Transportation Solutions. Sustainability 2023, 15, 16499. [Google Scholar] [CrossRef]
  32. Talpur, M.A.H.; Khahro, S.H.; Ali, T.H.; Waseem, H.B.; Napiah, M. Computing travel impendences using trip generation regression model: A phenomenon of travel decision-making process of rural households. Environ. Dev. Sustain. 2023, 25, 5973–5996. [Google Scholar] [CrossRef]
  33. Qian, Z. Hangzhou. Cities 2015, 48, 42–54. [Google Scholar] [CrossRef]
  34. Yao, L.; Li, X.; Zheng, R.; Zhang, Y. The impact of air pollution perception on urban settlement intentions of young talent in China. Int. J. Environ. Res. Public Health 2022, 19, 1080. [Google Scholar] [CrossRef]
  35. Liu, Q.; Tang, X.; Li, K. Do Historic Landscape Images Predict Tourists’ Spatio-Temporal Behavior at Heritage Sites? A Case Study of West Lake in Hangzhou, China. Land 2022, 11, 1643. [Google Scholar] [CrossRef]
  36. Tai, Z.; Ye, L.; Wang, Z. How can mega-events contribute to urban tourism in developing countries? A case study of the 2016 G20 Summit in Hangzhou, China. Int. Plan. Stud. 2023, 28, 268–280. [Google Scholar] [CrossRef]
  37. Zhang, S.; Guo, Y.; Wang, Z. Correlation between flood frequency and geomorphologic complexity of rivers network–a case study of Hangzhou China. J. Hydrol. 2015, 527, 113–118. [Google Scholar] [CrossRef]
  38. Sun, D.; Hu, C.; Wang, Y.; Wang, Z.; Zhang, J. Examining spatio-temporal characteristics of urban heat islands and factors driving them in Hangzhou, China. IEEE J. Sel. Top. Appl. Earth Obs. Remote. Sens. 2021, 14, 8316–8325. [Google Scholar] [CrossRef]
  39. Bao, J.; Xu, L.; Shi, Y.; Ma, Q.; Lu, Z. The Influence of Street Morphology on Thermal Environment Based on ENVI-met Simulation: A Case Study of Hangzhou Core Area, China. ISPRS Int. J. -Geo-Inf. 2023, 12, 303. [Google Scholar] [CrossRef]
  40. O’Connor, Z. Façade colour and judgements about building size and congruity. J. Urban Des. 2011, 16, 397–404. [Google Scholar] [CrossRef]
  41. Rakha, T.; Gorodetsky, A. Review of Unmanned Aerial System (UAS) applications in the built environment: Towards automated building inspection procedures using drones. Autom. Constr. 2018, 93, 252–264. [Google Scholar] [CrossRef]
  42. Kuang, Q.; Wu, J.; Pan, J.; Zhou, B. Real-time UAV path planning for autonomous urban scene reconstruction. In Proceedings of the 2020 IEEE International Conference on Robotics and Automation (ICRA), Paris, France, 31 May–31 August 2020; pp. 1156–1162. [Google Scholar]
  43. Daftry, S.; Hoppe, C.; Bischof, H. Building with drones: Accurate 3D facade reconstruction using MAVs. In Proceedings of the 2015 IEEE International Conference on Robotics and Automation (ICRA), Seattle, WA, USA, 26–30 May 2015; pp. 3487–3494. [Google Scholar]
  44. Ricchiardi, S. Distorted picture: Thanks to Photoshop, it’s awfully easy to manipulate photographs, as a number of recent scandals make painfully clear. Misuse of the technology poses a serious threat to photojournalism’s credibility. Am. Journal. Rev. 2007, 29, 36–44. [Google Scholar]
  45. Vonikakis, V.; Kouskouridas, R.; Gasteratos, A. On the evaluation of illumination compensation algorithms. Multimed. Tools Appl. 2018, 77, 9211–9231. [Google Scholar] [CrossRef]
  46. Bittner, K.; Cui, S.; Reinartz, P. Building extraction from remote sensing data using fully convolutional networks. Int. Arch. Photogramm. Remote. Sens. Spat. Inf. Sci. 2017, 42, 481–486. [Google Scholar] [CrossRef]
  47. Chen, J.; Wang, G.; Luo, L.; Gong, W.; Cheng, Z. Building area estimation in drone aerial images based on mask R-CNN. IEEE Geosci. Remote. Sens. Lett. 2020, 18, 891–894. [Google Scholar] [CrossRef]
  48. Jung, H.; Choi, H.S.; Kang, M. Boundary enhancement semantic segmentation for building extraction from remote sensed image. IEEE Trans. Geosci. Remote. Sens. 2021, 60, 1–12. [Google Scholar] [CrossRef]
  49. Idri, A.; Oukarfi, M.; Boulmakoul, A.; Zeitouni, K.; Masri, A. A new time-dependent shortest path algorithm for multimodal transportation network. Procedia Comput. Sci. 2017, 109, 692–697. [Google Scholar] [CrossRef]
  50. Pandey, S. Principles of correlation and regression analysis. J. Pract. Cardiovasc. Sci. 2020, 6, 7–11. [Google Scholar]
  51. Kaya, N.; Crosby, M. Color associations with different building types: An experimental study on American college students. Color Res. Appl. 2006, 31, 67–71. [Google Scholar] [CrossRef]
  52. Samavatekbatan, A.; Gholami, S.; Karimimoshaver, M. Assessing the visual impact of physical features of tall buildings: Height, top, color. Environ. Impact Assess. Rev. 2016, 57, 53–62. [Google Scholar] [CrossRef]
  53. Chang, Y.H.; Huang, P.H.; Wu, B.Y.; Chang, S.W. A study on the color change benefits of sustainable green building materials. Constr. Build. Mater. 2015, 83, 1–6. [Google Scholar] [CrossRef]
  54. Aste, N.; Leonforte, F.; Piccolo, A. Color rendering performance of smart glazings for building applications. Sol. Energy 2018, 176, 51–61. [Google Scholar] [CrossRef]
Figure 1. Samples of traditional buildings and dwellings in a combination of Chinese and Western elements in Shanghai, Suzhou, and Nanxun, respectively.
Buildings 14 00546 g001
Figure 2. (a) The geographical location of Hangzhou (study city), accompanied by longitude and latitude coordinates. (b) The transportation network structure in urban Hangzhou (study area). The geographic data are provided by OpenStreetMap.
Buildings 14 00546 g002
Figure 3. Process flow of the research.
Buildings 14 00546 g003
Figure 4. (a) Façade color drawn by the collected colors in the main urban area of Hangzhou. (b) Roof color drawn by the collected colors in the same area.
Buildings 14 00546 g004
Figure 5. A random walk process in the transportation network of urban Hangzhou.
Buildings 14 00546 g005
Figure 6. The main functional area in urban Hangzhou.
Buildings 14 00546 g006
Figure 7. An origin–destination trip process in the transportation network of urban Hangzhou.
Buildings 14 00546 g007
Figure 8. Frequency heat maps of each road in urban Hangzhou based on the random walk model in the transportation network, accompanied by the (a) façade color and (b) roof color, respectively.
Buildings 14 00546 g008
Figure 9. Correlation analysis between passing frequency based on the random walk model and urban color in the HSV color space.
Buildings 14 00546 g009
Figure 10. Frequency heat maps of each road in urban Hangzhou based on the OD trip model in the transportation network, accompanied by the (a) façade color and (b) roof color, respectively.
Buildings 14 00546 g010
Figure 11. Correlation analysis between passing frequency based on the OD trip model and urban color in the HSV color space.
Buildings 14 00546 g011
Disclaimer/Publisher’s Note: The statements, opinions and data contained in all publications are solely those of the individual author(s) and contributor(s) and not of MDPI and/or the editor(s). MDPI and/or the editor(s) disclaim responsibility for any injury to people or property resulting from any ideas, methods, instructions or products referred to in the content.

