Article

Effects of Prestressing Magnitude and Position on Seismic Performance of Unbonded Prestressed Concrete Beams

1
College of Civil Engineering, Xi’an University of Architecture and Technology, Xi’an 710055, China
2
Central Research Institute of Building and Construction Co., Ltd., MCC, Beijing 100088, China
*
Author to whom correspondence should be addressed.
Buildings 2024, 14(2), 431; https://doi.org/10.3390/buildings14020431
Submission received: 20 November 2023 / Revised: 20 December 2023 / Accepted: 18 January 2024 / Published: 4 February 2024

Abstract

:
To study the effects of the jacking stress level, height and strength ratio of the prestress tendons (λ) on the seismic performance of unbonded prestressed concrete (UPC) beams, six UPC beams and one reinforced concrete (RC) beam were tested under cyclic loads. The hysteretic characteristics, skeleton curves, ductility properties, energy dissipation capacity, strain distribution of reinforcement and self-centering capability of the specimens were studied and discussed. Numerical parameter analysis was also carried out by using OpenSees. The results indicate that three failure modes of UPC beams under cyclic loading were observed, namely the tension-failure mode involving a broken rebar, the compression-failure mode involving concrete crushing and the balanced failure. By considering the influence of the prestress position and magnitude, the modified reinforcing index ω was proposed to determine the failure mode. The ω is suggested to be less than 0.3 to ensure sufficient ductility. The effective stress level is linearly and positively related to the stiffness from cracking to yield Kcr and the ultimate bearing capacity of the UPC beam under cyclic loading. The stiffness of the UPC beam is slightly larger than that of the RC beam before yielding, and significantly greater than that of the RC beam after yielding. Due to the large strength reserve after yielding, the integrated seismic performance of the UPC beam is similar to that of the RC beam. When the λ was unchanged, the increase in the relative height of the prestressed tendons αh is beneficial for the overall performance factor F, ductility and crack control. The stiffness degradation performance depends on the λ but is independent of the αh. The total energy dissipation of the non-tensioned UPC specimen was 59% higher than that of the RC beam. The cumulative total energy dissipation of the tensioned UPC specimen was only 13% lower than that of the RC beam with the same number of cycles, indicating that the UPC specimen had a considerable energy dissipation capacity.

1. Introduction

Stepping into an eco-friendly society, there is an increasing demand for material and energy saving, such as recycled aggregate and mineral tailings, which show great potential in mortar and concrete production [1,2,3]. Construction material, prestressed concrete (PC) with such virtue, has had an expanded usage market in recent years, including in public buildings, industrial and civil buildings [4,5,6] and railway bridges. Due to the complexity regarding the seismic performance of PC structures in previous studies, the installation and safety evaluation of PC structures in earthquake fortification areas and high-intensity areas is facing remarkable obstacles, which makes the application and promotion of PC technology greatly restricted [7,8,9]. Therefore, studies on the seismic performance of PC structural components are worthwhile in order to provide a reliable design and evaluation reference.
As one of the features of PC that most stands out, the precompression stress caused by the tension of prestress tendons has received a certain level of study. A close connection between the jacking stress and the natural vibration frequency has been reported by Saiidi M [10], Kim [11] and Ricles et al., and they reached the conclusion that the flexural stiffness of an unbonded prestressed concrete (UPC) component would increase [11,12]. Even so, the well-investigated variations in the natural vibration frequency are not capable of reflecting the stress distribution characteristics of the component. To advance the study on the influence of the prestressed force on the flexural stiffness of prestressed concrete beams, a series of mono loading tests have been conducted by Han [13]. The results showed that the jacking stress level had a significant effect on the flexural stiffness of unbonded prestressed concrete (UPC) components after cracking. However, due to the loading pattern, it is not sufficient to provide evidence for the seismic performance of the UPC component, which is normally treated as cyclic loading. Many scholars have studied the narrow range of tensioning, and reached the conclusion that the tensioning effect has little effect on the stiffness and bearing capacity of the component. In addition to the inadequate testing for the seismic performance of the UPC component, the design code also has certain incomplete details. That is, only the effective area, position of the prestress tendons and ordinary reinforcement in the component of the UPC component have been taken into consideration in the calculation of the UPC structure stiffness of the AASHTO code [14], the British BS5400 code [15], etc., and assuming that the stiffness had nothing to do with the actual effective prestressed strength of the prestress tendons. By doing so, the neglection of the influence on the stiffness by the actual effective prestressed strength of the prestress tendons will produce a deviation to some extent from the actual stiffness estimation of PC components. In practical engineering, the prestress in prestressing tendons may experience significant loss over long-term service conditions, or the tendons may not be fully tensioned during the construction phase. This wide range of prestress variation needs to be thoroughly studied. To conclude, most of the existing research on the effect of tension has focused on the natural vibration and static properties of prestressed concrete beams, and there is no research on the seismic performance of components with a wide range of tension changes.
To be detailed, Gilbert, Pirayeh, Kim et al. [16,17,18] claimed that the tension of prestress could only increase the cracking load of components, but not affect the ultimate flexural capacity of components. Xiong [19] indicated that the increment of unbonded reinforcement is an effective way to improve the bearing capacity. However, the tension of the prestress tendons may affect the height of the section’s compression zone to some extent and cause the bearing capacity to change. Tanchann et al. stated that the application of effective prestressing would reduce the ductility and energy dissipation of components [20,21,22]. Nevertheless, the prestress tendons in UPC components have the characteristics of high strength, so it is not conservative to only consider the deformation reserve. Moreover, it is not comprehensive enough to use the equivalent viscous damping coefficient of each cycle of the hysteresis curve as an index to judge the energy dissipation capacity of a component. The cumulative energy dissipation at the key points of stress can better reflect the energy dissipation capacity. Therefore, there is little research on the effect of the tensile response of unbonded prestressed beams on the seismic performance of UPC components such as the bearing capacity, ductility and energy dissipation under cyclic loading.
Although there are standardized operational protocols for PC design currently in use, missing specifics also exist. The ”Dual control method” suggested and adopted by the Chinese code limits the relative compression zone height and prestress strength ratio of the frame beam end section to ensure the seismic performance of PC. In view of the influence of the reinforcement height on the mechanical performance and crack resistance of the component, the current Chinese standard “Standard for seismic design of prestressed concrete structures” (JGJ/T 140-2019) has included the height of the prestress tendons and the height of the longitudinal rebar when estimating the influence of the reinforcement height on the mechanical performance and crack resistance of the component. However, most of the previous studies on the influence of the prestressed strength ratio on the seismic performance of components has overlooked the impact of the prestress tendons’ height. The local high-stress state caused by prestressed tendons of different heights will actually affect the seismic performance of the whole beam. To better understand the UPC performance, the investigation of the correlation between the height of the prestress tendons and the strength ratio of the prestress tendons, as well as the revelation of the interplay lying between the bearing capacity and ductility, deserves further investigation.
In previous studies, UPC components and RC components are usually compared with identical section parameters. It is concluded that UPC components are superior in strength, and it is difficult to achieve the goal of a “strong column and weak beam” owing to the existence of prestress tendons. Therefore, in the current design method [23] based on an RC frame structure design system for the design of PC structures and components, a large increased coefficient of the column end bending moment is adopted to achieve the design objectives of a “strong column and weak beam” [24,25,26]. However, this design concept of using suitably reinforced concrete beams as ideal ductile components and directly comparing them with prestressed beams is not entirely reasonable, as it overlooks the characteristic of high strength in the prestressing tendons in prestressed beams. This brings about a series of problems such as dense reinforcement, which increases the construction difficulty and sensitivity of the shear damage of joints. Accordingly, comparing the RC component to the PC component with the same design conditions should receive further study.
In this paper, six UPC beams and one equivalent-designed reinforced concrete (RC) beam with different parameters were designed and manufactured. To filter the background noise induced by tension, a UPC specimen with prestress tendons but no tension served as the blank group. In order to unify the comparison criteria, an RC specimen with the same design strength and section as the UPC beam was set up. Through quasi-static tests, the seismic properties of the specimens were analyzed, and the effects of different tensile forces, the reinforcement height and prestressed strength ratio on the seismic properties of the UPC beams were obtained. And through the collaborative evaluation with the RC beam, a reasonable comparison of the seismic performance of the PC and RC components was carried out. The conclusion of the specimen study can provide the basis for the popularization and application of prestressing technology in concrete structures.

2. Experimental Program

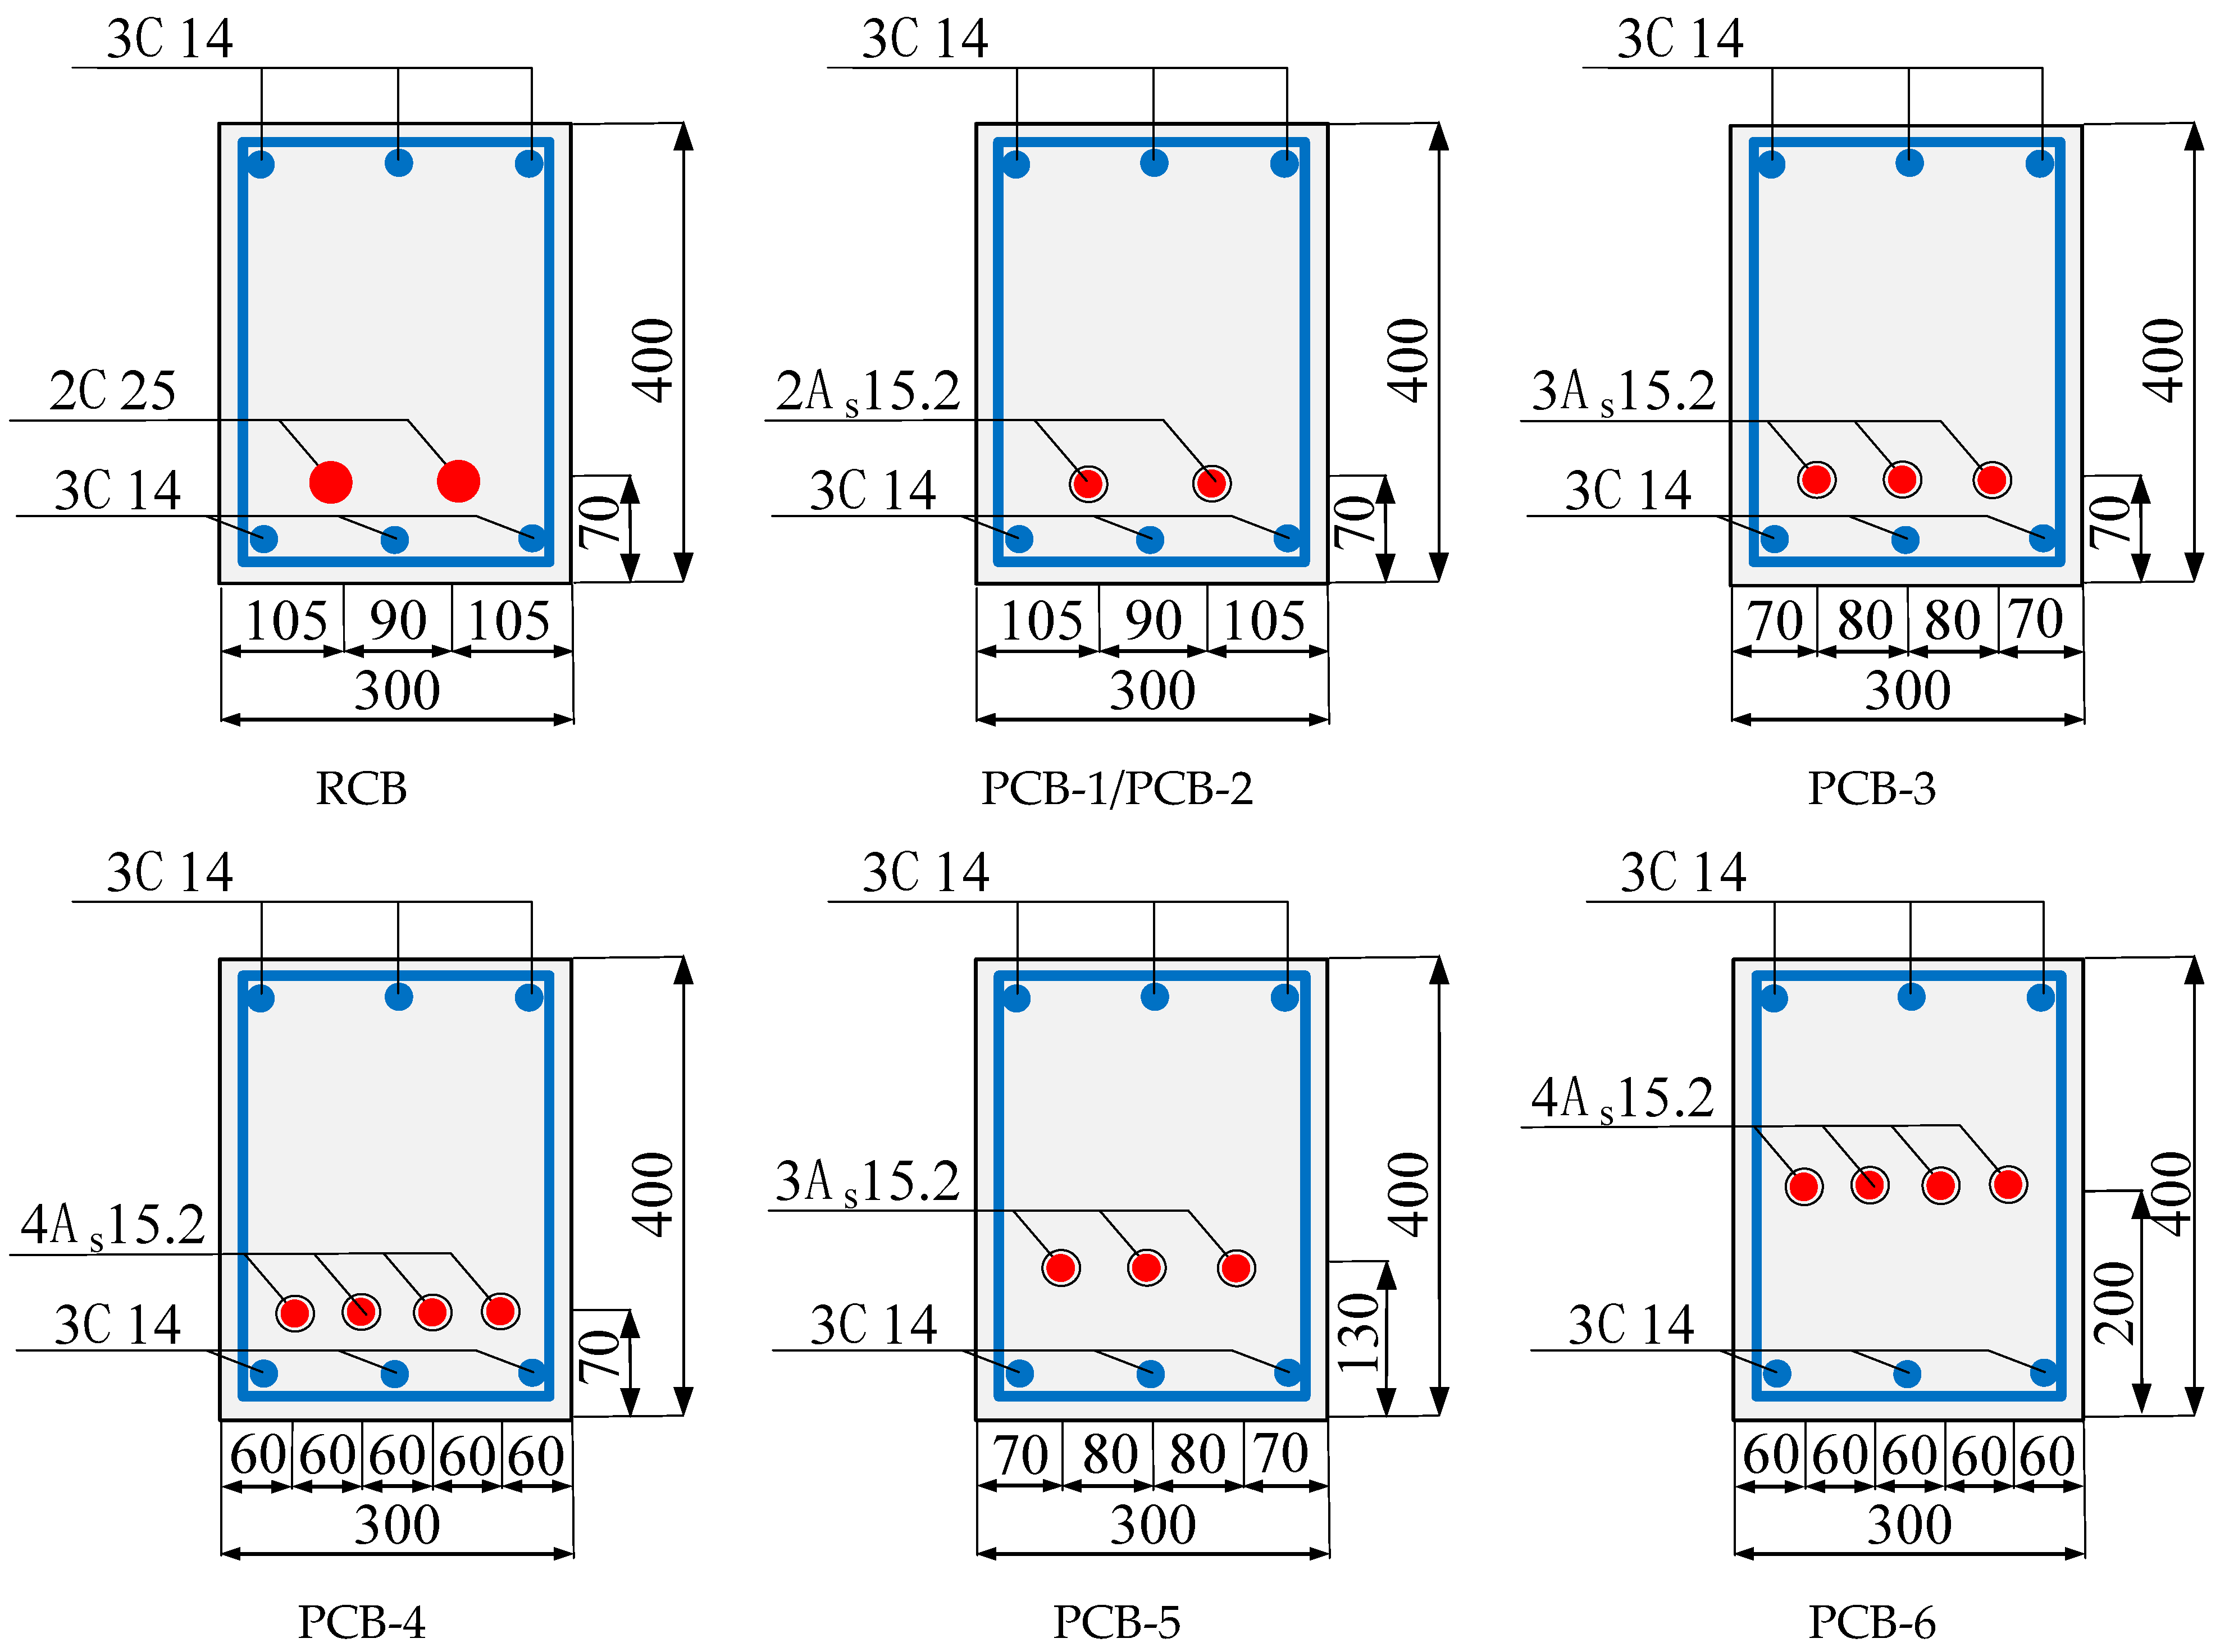
2.1. Specimen Design and Production

In this test, 6 UPC and RC specimens have been designed. Table 1 records the geometry information of the testing members, which describes the width as 300 mm, height as 400 mm, length as 6.3 m, t span as 6.0 m. Longitudinal rebar groups with a diameter of 14 mm are placed at both the top and bottom of those specimens. Hinged supports were used for boundary conditions in this test. To emphasize, the longitudinal rebar, located in the second row at the bottom of the RC specimens, was in consistency with the conversion. Specifically, it was achieved by converting the design value of the tensile strength of the longitudinal prestress tendons at the bottom of the PCB-1 and PCB-2 specimens to the value of the non-prestress tendons:
A p f pe = A s f y
The experimental parameters were prestressing action and three horizontal prestress tendon heights. More attention would be paid to tensile force level 0, 0.70fptk and prestressed strength ratio, while the concerned heights were 200 mm, 270 mm and 330 mm. According to the “Standard for seismic design of prestressed concrete structures”, the prestressed strength ratio could be calculated by Equation (2):
λ = f py A p h p f py A p h p + f y A s h s
In which, fpy represents the design value of the tensile strength of the prestress tendons, while fy is the yield stress of the longitudinal rebar. The area of the prestress tendon and the area of the longitudinal rebar can be represented by Ap and As, respectively. hp is the distance from the resultant point of the prestress tendons to the compression edge of the section, hs is the distance from that of the longitudinal rebars to the compression edge of the section and the relative height of the prestressed tendons αh = hp/h. Details of the specimen cross-sections are shown in Figure 1.

2.2. Material Properties

In this test, the strength grade of concrete was C50, while the compressive strength was 58 MPa and the elastic modulus was 3.45 × 10⁴ MPa. HRB400 was used for the longitudinal rebar, and HPB300 was adopted for the stirrups. The mechanical properties of the reinforcement are shown in Table 2. Low relaxation steel strands with the strength of 1860 Mpa were used for the tendons, of which, the mechanical properties can be found in Table 3 and Figure 2.

2.3. Test Setup and Loading System

In the test, the MTS 100 T loading system was used, and cyclic loading was applied to the specimens under the third point, as shown in Figure 3. The downward displacement was defined as positive for the convention. The loading mode of the whole process was the displacement control. Before yielding, the displacement increment of the midspan of each level was 10 mm. For each level, one-time loading was applied to the specimen. At the post-yield stage, the displacement control was the multiples of the upward and downward yield displacements. In this case, loading was applied three times for each level. When the bearing capacity dropped to 85% of its ultimate load or the concrete was extremely spalling, the test was stopped. The loading system is shown in Figure 4.

2.4. Arrangement of Measuring Points and Measurement Scheme

The displacement meter was arranged in the midspan position of the specimen, aiming to measure the change in the midspan deflection during the test. On the surface of the concrete and the longitudinal tensile steel bars, several strain gauges were located. Meanwhile, in both sections of the prestressed bars, there was a through-core force sensor to monitor the changes in the prestressed steel bars during the tensioning and loading processes. All of them could be used to detect changes in stress in the concrete, steels and prestress tendons. In addition, three orthogonal embedded vibrating wire strain gauges were set on the top of the beam to measure the strain in different directions inside the concrete. The arrangement of the measuring points is shown in Figure 5.

3. Test Results

3.1. Test Phenomena and Failure Modes

The failure process of each specimen could be divided into the following three stages:
(1)
After loading, the first bending crack appeared in the pure bending section. An inclined crack could appear in the flexural shear zone, only if a certain number of bending cracks had developed. Due to the tensile force of the prestress tendons, the bending cracks at the bottom of the concrete appear later than or at the same time as those at the top.
(2)
When the crack developed to a certain extent, the longitudinal bars in the specimens yielded, and the generation of new cracks was blocked. As the load increased, the length and width of the original crack of the specimen increased gradually, and the upper and lower cracks were basically connected, with the concrete spalling around the cracks. As shown in Figure 3, in the pure bending section, the crack development in the top part and that in the bottom part were basically symmetrical in all specimens. The general cracks of some specimens, including the symmetrically reinforced PCB-6 specimen, the RCB and non-tensioned UPC PCB-1 specimen, were symmetrical longitudinally. For the specimens with asymmetric reinforcements and the prestressing reinforcements in tension, the inclined cracks in the flexural shear section were asymmetrical, as a result of the eccentricity of the prestress. This showed that the prestress would significantly affect the formation position and the development degree of cracks in the beams, while the longitudinal rebar had little impact on the crack resistance of the specimens.
(3)
As the loading displacement continued to increase, in the compression section of the concrete, horizontal cracks could be found. When the load dropped to less than 85% of the ultimate load, the specimen could be identified to be failed. The failure mode of the beam was characterized by the compression-controlled failure marked by the concrete crushing and the tension-controlled failure marked by the fracture of the rebar in the tension area. According to Figure 6a, the concrete damage in the compression zone of the RCB, PCB-1, PCB-2 and PCB-3 was limited, and the beams failed due to the longitudinal rebar fracture. The concrete in the compression zone and the reinforcement in the tension zone of the PCB-4 member were almost simultaneously damaged, and the failure state is shown in Figure 6b. As shown in Figure 6c, the concrete in the compression zone of the PCB-5 and PCB-6 specimens was destroyed before the longitudinal rebar, and then the longitudinal rebar was broken or buckling. This indicates that, with the same height of prestress tendons, the higher the λ was, the more serious the failure at the bottom of the beam would occur. When the λ was similar, the closer the tendon was to the centroid of the section, the more serious the damage would be. In addition, the anchorages did not fail before the specimens in the test, which showed that the anchorages were reliable under repeated loads. The test results of the specimens are shown in Table 4.

3.2. Hysteretic Curves and Skeleton Curve

Figure 7 depicts the load-midspan deflection (P-Δ) hysteretic curve and load-deflection skeleton curve of the seven sets of specimens. According to the load-deflection skeleton curve (Figure 7h), characteristic points, such as cracking, yielding, ultimate condition and failure, could be obtained (as shown in Table 4).
As shown in Figure 7:
(1)
The hysteresis curves of the RCB and PCB-1 were plump fusiform, and the area of the hysteresis loop was relatively larger under the same cycle. This meant that the ability of the energy dissipation was good. For other specimens, the hysteresis curves were arcuate, and the pinching effect appears in the process of upward unloading and downward loading. This was obvious in PCB-5 and PCB-6, followed by PCB-4. For the same specimen, the larger the loading displacement was applied, the more significant the pinching effect could be observed.
(2)
By a comparison of PCB-2, PCB-3 and PCB-4, it could be seen that, with the same height of prestress tendons, the full degree of the hysteresis curve decreases gradually with the increase in the prestress strength ratio λ. This was because, with the same hp, the higher the λ was, the more obvious the limitation on the energy dissipation of an ordinary steel bar could be. By comparing PCB-5 and PCB-6, it could be discovered that, with the same λ, the fullness of the hysteresis curve decreases with the decrease in hp. This was because, with the same λ, the smaller the hp was, the smaller the bearing capacity under the same deformation would be, resulting in a smaller area surrounded by the curve.
(3)
The upward loading curves of all specimens could be divided into four stages: elasticity uncracked stage, cracked to yield stage, yield to peak stage and peak to failure stage. All specimens failed under upward loading, and the downward curve did not contain a failure stage.

3.3. Yield Point

In the process of loading, the yield point of the longitudinal rebar and the yield point of the whole concrete beam could be reached. In this paper, in order to determine the integral yield point of the beam, the widely used equal energy method was adopted [27], as shown in Figure 8. From the load-deflection skeleton curve (shown in Figure 7), the yield displacements of the longitudinal rebar for each specimen are close to each other. For the balanced-reinforced RCB, when the steel bars in the tension zone yield, the bending properties of the whole beam will change abruptly. It could be considered that the beam yielded at this point. For the non-tensioned PCB-1 specimen, the yield point of this specimen was basically the same as that of the RCB specimen. This was because the stress growth in the prestress tendons was small before yielding. Due to the high strength of the prestressed bars and the large height of the compression zone, the whole PC beam would reach the yield state only if the concrete plasticity of the compression area developed to a certain extent. This would cause the yield point of the RC beam to lag behind that of the longitudinal rebar.
By comparing the PCB-2, PCB-3 and PCB-4 specimens, the result shows that, with the same height of the prestress tendons, there was a linear relationship between Py-Psy and the prestress strength ratio. Psy was the yield load of the reinforcements, and Py represented the yield load of the components. In this case, Py-Psy was the difference between the yield point of the prestressed concrete beam and the bearing capacity at the yield point of the longitudinal rebar. The relationship is shown in Figure 9. This indicated that the higher the λ of the PC beam was, the less sufficient the concrete develops plastically in the compression area.

3.4. Dissipation Capacity

The cumulative hysteretic energy dissipation Q was the sum of the areas surrounded by the hysteretic curves at all levels when a specimen finally fails. This indicated the actual total energy dissipation in the beam test. Figure 10 shows the cumulative energy dissipation of each specimen when it reaches the yield point, limit point and failure point, respectively. From Figure 10, it could be discovered that:
(1)
The cumulative energy dissipation of PCB-1 at the upward yield point, peak point and limit point is 67.2%, 88.1% and 121.3% of that of the RCB, respectively. The cumulative energy dissipation of PCB-2 was 107.2%, 100.1% and 88.2% of that of the RCB. It could be seen that, from the peak to failure stage, the cumulative energy dissipation capacity of the non-tensioned PC specimen increases greatly. Although the tensile PC specimen had small deformation, the cumulative energy dissipation capacity of the PC beam was greater than that of the RCB component before reaching the peak point, due to the improvement in the bearing capacity. At the time of failure, the cumulative energy dissipation of the PC beam was slightly lower than that of the RCB component; this was because the concrete damage of PC in the compression zone was more serious than that of the RCB component. However, there was no obvious disadvantage to the energy-consuming capacity of the PC beams.
(2)
Compared with the PCB-2 specimen, the cumulative energy dissipation of the PCB-4 specimen at the upward yield point increased by 24.4%. The cumulative energy consumptions of PCB-3 and PCB-4 at the positive peak point decreased by 99.6% and 123.8%, while at the failure point, they decreased by 61.2% and 44.1%, respectively. This indicated that with the same height of prestress tendons, the higher the λ was, the lower the positive energy dissipation capacity was. One reason towards the result was, with the same amount of deflection, the compressive stress of the concrete in the top compression zone increased with the increase in the λ, and the damage would correspondingly be more serious.
(3)
Compared with the PCB-3 specimen, the cumulative energy dissipation of the PCB-5 and PCB-6 specimens at the positive peak point increased by 28.2% and 25.8%, while at the positive failure point, they increased by 7.3% and 18.0%, respectively. This meant that, with the similar value of the λ, the higher the prestress tendons were arranged, the better the positive energy dissipation performance was.
(4)
When considering the reverse energy dissipation capacity, the total cumulative energy consumption of the PCB-1 specimen was 59.0% higher than that of the RCB specimen, while the cumulative energy dissipation of PCB-2 was only 13.4% lower than that of the RCB. This reflected that the energy dissipation capacity of the tensioned PC specimen was reasonable, and the energy dissipation capacity of the non-tensioned specimen was significantly higher than that of the RCB specimen. It could be inferred that the total cumulative energy dissipation capacity of the specimens was greater than that of the RCB specimens when the tension was less than a certain value.

3.5. Rebar Strain and Prestress Tendons Strain

Figure 11a,b show the strain variations in the reinforcement and prestress tendons with load. To be more exact, they demonstrate the strain variations in the reinforcement and prestress tendons, located at the bottom of the non-tensioned and tensioned beams. From Figure 11, it can be seen that the longitudinal tensile bar yields when the strain reaches 2000 με. The strain increment of the prestress tendons lagged behind that of the longitudinally strained reinforcement before yielding. The crack of the PCB-1 specimen in the tensile area extended up quickly after the concrete cracked, resulting in a sudden change in the strain increment of the prestress tendons. The PCB-2 specimen was under better control regarding the crack development, which made the strain of the prestress tendons develop more continuously. Therefore, the higher tension degree was advantageous to the bearing capacity of the beam in the use stage. After the steel bar yielded, the deformation of the beam was large. At this time, the strain increment of the prestress tendons increased intensely, and the prestress tendons began to play a major role in the tension area. This was also the main reason why the bearing capacity of the PCB-2 specimen was higher than that of the RCB. In addition, due to the Bauschinger effect, the compression stiffness of the bottom steel bars would decrease gradually under reverse load. There was a marginal change in the strain of the prestress tendons in the PCB-1 specimen under reverse load, and the prestress tendons had little contribution toward reversing the bearing capacity and stiffness.
A comparison of the strain increments of the prestress tendons of PCB-1 and PCB-2 under different loads and midspan deflections is shown in Figure 12. The curve slopes of the PCB-1 and PCB-2 specimens were basically the same, which manifests that, for the same beam, the stress increment in the prestress tendons, caused by the deformation, is the same. The difference was that the loading path of the PCB-1 specimen did not change until the specimen was damaged, while for the PCB-2 specimen, the strain of the prestress tendons changed abruptly with the application of each level of load, due to the plastic development of the concrete after yielding.

3.6. Self-Centering Behavior

Self-centering capability could characterize the deformation recovery performance of a system under cyclic loading, which could be defined by the relative self-centering efficiency (RSE). The RSE could be expressed as:
RES = 1 u r e s + u r e s u u + u u
where u r e s + and u r e s stood for the upward and downward residual displacement, respectively. The higher the RES value of the system, the stronger its self-centering ability.
As shown in Figure 13, the RES of all specimens showed a decreasing trend when the midspan displacement reached Δy. The comparison between the RCB specimen and PCB specimen indicated that prestressing could substantially enhance the self-centering ability of the beams. The RES of the non-prestressed PCB-1 specimen was small, but its self-centering ability decreased slowly due to the gradual increase in prestress in the late loading period. It could be seen from the PCB-1, PCB-2 and PCB-3 specimens that the self-centering ability of members with prestressed tendons in the same position increased with the increase in the λ value. By comparing the PCB-3, PCB-5 and PCB-6 specimens, it could be summarized that when the λ values were similar, the closer the prestressed position in the specimen was to the centroid, the stronger its self-centering ability was.

3.7. Stiffness Kcr

Figure 14 shows the load-deflection skeleton curves of the PCB-1, PCB-2 and RCB specimens.
By comparing the slopes of the tangent lines at each stage of the specimens, it can be discovered that:
(1)
Before cracking, the tangent slope of the tensioned specimen was 1.1 times as much as that of the non-tensioned specimen. At this time, the tension force had little effect on the stiffness kcr. This was because all the beams were in the elastic state when the specimen was not cracked. The prestress tendons in PCB-1 were almost stress-free due to small deformation, and the cross-section stress state was basically the same as that of the RCB specimen. The height of the compressed region in PCB-1 was about h/2. The concrete at the bottom of the specimen could withstand tensile stress for the moment. The area of the prestress tendons Ap was very small compared with the area of concrete in the tension area, which had little effect on the moment-bearing capacity. Therefore, compared with the PCB-1 specimen, there was only a slight increase in the height of the compressed region and the net section moment of inertia of PCB-2, while the section stiffness of the specimens increased finitely. The model of cross-section analysis is shown in Figure 15b.
(2)
In the stage from cracking to yielding of the longitudinal rebar, the tangent slope of the tensioned specimen was 1.62 times as much as that of the non-tensioned specimen. At this time, the tensile force had a great influence on the stiffness. This was because, after cracking, the cracked part of the concrete could not withstand tension anymore, while due to the proximity to the centroid of the section, the uncracked concrete had less contribution to the bending moment. Thus, the influence of the concrete could be ignored, and the tension was borne only by the steels and prestressed bars. The bending moment generated by the tension of the prestress tendons took a large proportion of the total bending moment of the section, which led to a significant increase in the height of the compressed region and the converted cross-section moment of inertia. The model of cross-section analysis can be found in Figure 15c.
(3)
When the tensioned steel bars yielded, the tangent slope of the tensioned specimen was basically the same as that of the non-tensioned specimen. This was because, after yielding, the tensile stress of the steel bar hardly increased, so the tension increment in the tensile area of the specimen was completely provided by the prestress tendons. At this time, the prestress tendons were still in the elastic stage, and there was a linear correlation between the stress increment and the specimen deformation. With the same deformation of specimens, the increments of stress in PCB-1 and PCB-2 were the same, while the increments of the internal force of the prestress tendons were also the same. Before the concrete collapsed in the compression zone, pressure could be provided. The amount of pressure was equal to that of the tension of the prestress tendons, while the directions were totally opposite. The only difference between them was the internal moment arm. Thus, the increase in the height of the concrete’s compressed region, caused by tension, had little effect on the converted cross-section moment of inertia, and the tangent stiffness was basically the same.
(4)
When the frame structure was subjected to a minor or moderate earthquake, most beams were in the cracking to yield stage. At this time, the influence on the flexural stiffness of the UPC beams, caused by the tensile force of the prestress tendons, would change the internal force distribution of the joints. Therefore, it should be considered.
The Chinese standard [27] determines the short-term stiffness of components, denoted as Bs, through the effective moment of inertia:
B s = 0.85 E c I 0 κ cr + ( 1 κ cr ) ω , κ cr = M cr M k , ω = 1.0 + 0.21 α E ρ 1 + 0.45 γ f 0.7
M cr = σ pc + γ f tk W 0
The expression for the effective moment of inertia Ie-code obtained through the standard is:
I e - code = I 0 / κ cr + ( 1 κ cr ) ω
The bending load-bearing capacity of the component is:
M u = σ pu A p h p x 2 + f y A s h 0 x 2
The effective moment of inertia (Ie) obtained from the experiment is derived using Equation (8):
M E 0 I e = Φ
Comparing the experimental results with the standard, it is found that the cracking moment and bending load-bearing capacity obtained from the tests are 23% and 11% lower than calculated, respectively. This is due to the cumulative damage under cyclic loading being greater than under monotonic loading. For PCB-6, with the prestressing tendon close to the centroid, the reductions are 31% and 22%, respectively. Moreover, when the prestressing tendon is far from the centroid, the experimental effective moment of inertia (Ie) is close to the calculated value (Ie-code), with Ie/Ie-code ranging from 0.91 to 1.11. However, when the tendon is near the centroid, Ie/Ie-code is 0.67, suggesting the standard’s consideration of the tendon position is inadequate. This phenomenon warrants further investigation.

3.8. Bearing Capacity

According to Table 4:
(1)
The ultimate loads of the PCB-1 specimen and RCB specimen were almost the same, which were 202.0 kN and 207.3 kN, respectively. At this time, the amount of longitudinal rebar stress, located in the second row at the bottom of the RCB, was basically the same as that of the prestress tendons in the PCB-1 specimen. The ultimate displacement of the PCB-1 specimen was increased by 15.6% compared with that of the RCB specimen. This result was attributed to the continuous increase in stress in the prestress tendons leading to a more fully plastic development of the concrete in the compression zone.
(2)
The peak load of the PCB-2 specimen was 251.9 kN, which increased by 21.2% compared with the PCB-1 specimen. It demonstrated that the application of prestress would lead to the increase in the peak load of the specimen. To explain the increase in the peak load, a certain degree of tension would result in an increase in the height of the concrete’s compression zone and prevent the concrete from collapsing in advance. Therefore, in the limit state, the moment arm between the concrete and the longitudinal rebar in the compression zone, as well as the moment arm between the concrete and the prestress tendons in the compression zone, would increase. Meanwhile, the constraining effect of the stirrup on the concrete could increase the ultimate compressive strain of the concrete εcu. Scott et al. [28] suggested that the εcu for stirrup-restrained concrete was shown as Equation (9):
ε cu = 0.004 + 0.9 ρ s ( f y h / 300 )
where fyh was the yield strength of the stirrup; ρs was the stirrup ratio. This showed that the tension of prestress tendons could improve the restraining effect of stirrups. According to Figure 16, compared with the y-direction strain of the top concrete, the strain of PCB-2 was larger than that of PCB-1 under the same load. However, once the strain exceeds the testing range of the strain gauge, the data reference can be regarded as less reliable.
Compared with PCB-1 and the RCB, the ultimate displacement of PCB-2 decreased by 24.2% and 6.9%, respectively. It showed that the application of tensile force could reduce the ultimate displacement of the specimen. Therefore, the application of tensile force would affect the flexural and seismic properties of the specimen, while the reasonable application of prestress could help the concrete achieve a better compression performance and improve the ultimate bearing capacity of the specimens to a certain extent.

3.9. Ductility and Integrated Performance

As an important embodiment of seismic performance, ductility has been studied extensively. In order to evaluate the ductility of traditional reinforced concrete structures or beams, the ductility ratio, which is the ratio of the ultimate deformation Du to the initial yield deformation Dy [29], is usually adopted. Due to the limitation only considering the deformation reserve, this ratio is less informative. Based on this, many scholars have carried out research on different factors, such as the strength of the concrete in PC beams, the reinforcement rate of prestressed and non-prestress tendons and the λ of different materials. It is generally believed that the ductility of UPC beams is low and decreases with the increase in the prestressed strength ratio. Therefore, it was concluded that the distribution of prestress tendons would reduce the seismic performance of the beam [20,30]. However, some studies suggested that the rotational deformation and flexibility of PC beams could meet the requirements if they were designed properly [31,32,33,34].
The yield point of the UPC beam was not obvious, and the ultimate bearing capacity of the prestress tendons was high. Generally, the prestress tendons were always in the elastic stage during the whole process of loading. Therefore, only the deformation reserve was considered as conservative. Accordingly, the integrated performance index proposed by Mufti [35] and Feng et al. [36] was used. The factor took into account both the deformation reserve and the bearing capacity reserve of the beam and was more reasonable in describing the ductility performance of this kind of beam, as shown in Equation (10):
F = Φ u Φ y M u M y
In this equation, Φu and Mu were the curvature (or generalized deformation) and bending moment (or generalized force) at the failure limit state of the beam, while Φy and My were the parameters corresponding to the beam at its design target state.
From Table 4, it can be seen that the overall performance factor F of PCB-2 was lower than that of the corresponding RCB component. However, when the safety reserve of the load-carrying capacity was considered, the ductility ratio of the PCB-2 and RCB components increased from 0.60 to 0.79. With the same height of the prestress tendons, the value of the integrated performance index increased as the number of prestress tendons increased, and the comprehensive ductility property of PCB-3 and PCB-4 was significantly greater than that of the corresponding RCB.

4. Numerical Simulation

4.1. Finite Element Model

The OpenSees V3.5.0 software was used for the numerical simulation of the specimens, and the influence of the tensile force on the stiffness of the cracking to yield stage and bearing capacity of the PC beams was analyzed. Since the unbonded prestress tendons and the surrounding concrete did not meet the strain coordination relationship, the concrete structure and the prestress tendons were modeled separately during the numerical simulation, the rigid arm was set between them and then the deformation coordination between the concrete and the prestress tendons was simulated by means of the degree of freedom coupling.
As is shown in Figure 17a, “Concrete01”, which is based on the modified Kent–Park stress–strain model, was adopted to simulate concrete [28], which allowed for the constraint effects to be taken into account. The skeleton curve expressions of the ascending, descending and horizontal sections are, respectively, shown in Equations (11)–(13).
f c = K f c 2 ε c ε 0 ε c ε 0 2   ( ε c ε 0 )
f c = K f c 1 Z ( ε c 0.002 )   ( ε 0 ε c ε 20 )
f c = 0.2 K f c   ( ε c ε 20 )
where ε0 was the strain corresponding to the peak stress of the concrete, which was 0.002 for unconfined concrete and 0.002K for confined concrete; K was the strength improvement coefficient of the concrete due to constraints; and fc′ was the compressive strength of the cylindrical concrete.
“Steel02”, based on the uniaxial Giuffre–Menegotto–Pinto constitutive model, was adopted for the prestress tendons and rebars [37], as shown in Figure 17b,c. The “nonlinearBeamColumn” element based on the flexibility method was selected for the concrete component and the “truss” element was selected for the prestress tendon, and the “elasticBeamColumn” was adopted for the rigid arm. Gao [38] confirmed that this model could accurately simulate the material properties of steel.
In addition, equal DOF was used to carry out the degrees of freedom coupling between the master and slave joints of the unbonded prestress tendons and the surrounding concrete. Except for the complete coupling of nodes at the beam ends, the other master–slave nodes were partially coupled, that is, the longitudinal translative freedom along the prestressed tendons was released to simulate the relative sliding between the unbonded prestress tendons and the concrete structure.

4.2. Numerical Simulation Results and Validation

The numerical simulation results of the hysteresis curves of the specimens are shown in Figure 7a–g. It can be seen that the OpenSees results can well reflect the characteristic points of the bearing capacity and the pinching phenomenon and are in good agreement with the experimental results. Based on this, extensive numerical analysis of different beams was carried out, and the detailed parameter settings of the beams are shown in Table 5.

4.3. Stiffness Kcr and Ultimate Bearing Capacity Analysis

Figure 18 shows that the tangent stiffness of the cracking to yield stage Kcr and the ultimate bearing capacity of the beam under cyclic loading was practically in a linear relation with the tensile force of the prestress rebar. The Kcr and ultimate bearing capacity of the beams increased with the increase in the prestress degree, and the linear relationship was basically satisfied. The greater the value and location eccentricity of the prestress, the more significant the influence on the growth trend of the Kcr and bearing capacity. It was verified that the existence of initial stress affects both the stiffness and bearing capacity of components by increasing the height of the compression zone and the constraint effect of concrete. When λ = 0.80 and αh = 0.825, the Kcr and ultimate bearing capacity of 70% fptk beams increased by 153.1% and 43.2%, respectively, compared with the non-tensioning members.

4.4. Ductility and Integrated Performance Analysis

A parametric evaluation of the section’s ductility was carried out using the above finite element analysis model. Comprehensively considering the influence of the prestressing magnitude and the position of the prestressed tendons on the ductility and other properties of the beam, the modified reinforcing index is defined as
ω = A p f p h p + A s f s h s A s f s h s A n f c h e
where As′ was the area of compressive rebars; fp was the tensile stress in the prestress tendon at a nominal flexural resistance; fs and fs′ could, respectively, be replaced by yield strength values fy and fy′ according to the ACI Building Code; and An was the net section of the beam. Considering the binding effect of the tensile action of the prestressed tendons on the concrete in the tensile area, the effective height he is defined as:
h e = A p f p h s + A s f s h p A p f p + A s f y
The effects of the strength ratio of the prestress tendons λ, modified reinforcement index ω and effective prestressing stress fpe on the ductility and overall performance of the beams were studied. Figure 19 illustrates the change in the ductility and factor F of the beams with modified reinforcement index ω under different fpe. For the tension-controlled failure section, the increase in the ω would lead to the increase in the ductility and factor F of the beam, while for the compression-controlled failure section, the increase in the ω would lead to the decrease in the ductility and factor F. At the same time, the ω of balanced failure would increase with the increase in the fpe, which indirectly verified that the increase in the fpe made the height of the balanced depth of the compression zone and the ultimate bearing capacity of the member increase. However, the increase in the fpe decreases the ductility and factor F due to reducing the ultimate displacement of the member. When the fpe increased from 0 to 0.7fptk, the ductility and factor F decreased by about 43.2% and 26.1%, respectively. It was generally believed that the ductility of the concrete members should reach at least 3.0~4.0. To achieve a minimum ductility of 3.0, the reinforcement index ω was required to be less than 0.30.

5. Conclusions

In this paper, the influence of the prestress magnitude and position on the seismic performance of an unbonded prestressed concrete (UPC) beam under cyclic loading is studied experimentally and numerically. The conclusions are as follows:
(1)
Three failure modes of UPC beams under cyclic loading were observed, namely the tension-failure mode involving the broken rebar, the compression-failure mode involving concrete crushing and the balanced failure. The introduction of the modified reinforcing index ω, considering the comprehensive influence of the prestress position and magnitude, is a novel approach to determine the failure mode. The tensile-failure mode was more preferable than the compressive-failure mode.
(2)
The effective stress level is linearly and positively related to the stiffness from cracking to yield the Kcr and the ultimate bearing capacity of the UPC beam under cyclic loading. The stiffness Kcr, yield-bearing capacity and ultimate bearing capacity of the PCB-2 specimen with 0.7fptk as the effective prestress increased by 62.1%, 137.5% and 21.2%, compared with those of the PCB-1 specimen without jacking. This relation underscores the significant role of the prestress magnitude in enhancing the structural performance of UPC beams.
(3)
The ultimate bearing capacity of the UPC beam with jacking is 20% higher than that of the equivalent-designed reinforced concrete (RC) beam with the same section and design strength, and the ultimate displacement is 24% lower. It is worth noting that the stiffness of the UPC beam is almost the same as that of the RC beam before yielding, and significantly greater than that of the RC beam after yielding. Due to the large strength reserve after yielding, the integrated seismic performance of the UPC beam is similar to that of the RC beam.
(4)
When the prestress strength ratio λ was unchanged, the increase in the relative height of the prestressed tendons αh is beneficial for the overall performance factor F, ductility and crack control. The stiffness degradation performance depends on the λ, but is independent of the αh.
(5)
The total energy dissipation of the non-tensioned UPC specimen was 59% higher than that of the RC specimen. The energy dissipation per cycle of the tensioned UPC specimen was less than that of the RC specimen, while the cumulative total energy dissipation of the tensioned UPC specimen was only 13% lower than that of the RC beam with the same number of cycles, indicating that the UPC specimen had a considerable energy dissipation capacity.

Author Contributions

Conceptualization, B.Z.; methodology, B.Z. and Q.X.; software, D.C.; validation, X.X.; formal analysis, D.C.; investigation, M.X.; resources, X.X.; data curation, D.C.; writing—original draft preparation, D.C.; writing—review and editing, D.C.; visualization, D.C.; supervision, Q.X.; project administration, Q.X.; funding acquisition, B.Z. All authors have read and agreed to the published version of the manuscript.

Funding

The project is supported by the National Key Research and Development Program of China (NO. 2022YFC3801800), the National Natural Science Foundation of China (NO. 52038010) and the National Natural Science Foundation of China (NO. 52308334), which are gratefully acknowledged.

Data Availability Statement

All data included in this study are available upon request via contact with the corresponding author. The data are not publicly available due to privacy.

Conflicts of Interest

Author Bin Zeng, Qing Xu, Xiaoda Xu and Man Xu were employed by the company Central Research Institute of Building and Construction Co., Ltd. The remaining authors declare that the research was conducted in the absence of any commercial or financial relationships that could be construed as a potential conflict of interest.

References

  1. Gao, S.; Zhao, G.; Guo, L.; Zhou, L.; Yuan, K. Utilization of coal gangue as coarse aggregates in structural concrete. Constr. Build. Mater. 2021, 268, 121212. [Google Scholar] [CrossRef]
  2. Shan, G.; Cui, X.; Kang, S.; Ding, Y. Sustainable applications for utilizing molybdenum tailings in concrete. J. Clean. Prod. 2020, 266, 122020. [Google Scholar]
  3. Gao, S.; Li, W.; Yuan, K.; Rong, C. Properties and application of thixotropic cement paste backfill with molybdenum tailings. J. Clean. Prod. 2023, 391, 136169. [Google Scholar] [CrossRef]
  4. Seo, J.; Rogers, L.P. Comparison of curved prestressed concrete bridge population response between area and spine modeling approaches toward efficient seismic vulnerability analysis. Eng. Struct. 2017, 150, 176–189. [Google Scholar] [CrossRef]
  5. Holan, J.; Bílý, P.; Štefan, R.; Vácha, P. Feasibility study of a prestressed-concrete containment vessel for a novel GFR nuclear reactor. Eng. Struct. 2023, 286, 116119. [Google Scholar] [CrossRef]
  6. de Lana, J.A.; Júnior, P.A.A.M.; Magalhães, C.A.; Magalhães, A.L.M.A.; de Andrade Junior, A.C.; de Barros Ribeiro, M.S. Behavior study of prestressed concrete wind-turbine tower in circular cross-section. Eng. Struct. 2021, 227, 111403. [Google Scholar] [CrossRef]
  7. Chira, A.; Puskás, A.; Bompa, D.V. Load-deformation response of long span prestressed concrete wide beams. J. Build. Eng. 2023, 65, 105631. [Google Scholar] [CrossRef]
  8. Zheng, J.; Huang, L.; Zhou, Z.; Huang, L. Seismic resilience assessment of self-centering prestressed concrete frame with different energy dissipation ratio and second stiffness. J. Build. Eng. 2023, 63, 105516. [Google Scholar] [CrossRef]
  9. Liu, X.; Li, J.; Tsang, H.-H.; Wang, J.; Zhong, J. Experimental evaluation of seismic performance of unbonded prestressed reinforced concrete column. Eng. Struct. 2020, 208, 109913. [Google Scholar] [CrossRef]
  10. Saiidi, M.; Douglas, B.; Feng, S. Prestress Force Effect on Vibration Frequency of Concrete Bridges. J. Struct. Eng. 1994, 120, 2233–2241. [Google Scholar] [CrossRef]
  11. Kim, J.-T.; Ryu, Y.-S.; Yun, C.-B. Vibration-based method to detect prestress loss in beam-type bridges. In Smart Structures and Materials 2003: Smart Systems and Nondestructive Evaluation for Civil Infrastructures; SPIE: Bellingham, WA, USA, 2003; pp. 559–568. [Google Scholar]
  12. Ricles, J.; Kosmatka, J. Damage detection in elastic structures using vibratory residual forces and weighted sensitivity. AIAA J. 1992, 30, 2310–2316. [Google Scholar] [CrossRef]
  13. Han, Z.; Guo, W.; Liu, Z. Experiment on Effect of Pre-tension on Flexural Stiffness of Prestressed Concrete Beam. China J. Highw. Transp. 2016, 29, 103–109. [Google Scholar]
  14. Units, C.; Edition, T. AASHTO LRFD Bridge Design Specifications; AASHTO: Washington, DC, USA, 2010. [Google Scholar]
  15. BS 5400-3:2000; Steel, Concrete and Composite Bridges, Part 3: Code of Practice for Design of Steel Bridges. British Standards Institution: London, UK, 2000.
  16. Dong Lee, J. The effect of tension stiffening in moment-curvature responses of prestressed concrete members. Eng. Struct. 2022, 257, 114043. [Google Scholar] [CrossRef]
  17. Kim, K.S.; Lee, D.H. Nonlinear analysis method for continuous post-tensioned concrete members with unbonded tendons. Eng. Struct. 2012, 40, 487–500. [Google Scholar] [CrossRef]
  18. Gilbert, R.I.; Mickleborough, N.C. Design of Prestressed Concrete; CRC Press: Boca Raton, FL, USA, 1990. [Google Scholar]
  19. Yao, G.; Xiong, X. Detailed numerical research on the performance of unbonded prestressed SRC frame beam under vertical cyclic load. Eng. Struct. 2018, 177, 61–71. [Google Scholar] [CrossRef]
  20. Tanchan, P. Flexural Behavior of High-Strength Concrete Beams Prestressed with Unbonded Tendons; Rutgers The State University of New Jersey, School of Graduate Studies: New Brunswick, NJ, USA, 2001. [Google Scholar]
  21. Priestley, M.; Tao, J.R. Seismic Response of Precast Prestressed Concrete Frames with Partially Debonded Tendons. PCI J. 1993, 38, 58–69. [Google Scholar] [CrossRef]
  22. JGJ/T 140-2019; Standard for Seismic Design of Prestressed Concrete Structures. Ministry of Housing and Urban-Rural Development of the People’s Republic of China: Beijing, China, 2019.
  23. Cen, E. Design of Structures for Earthquake Resistance—Part 1: General Rules, Seismic Actions and Rules for Buildings; British Standards Institution: London, UK, 2004. [Google Scholar]
  24. ACI 318R-19; Building Code Requirements for Structural Concrete (ACI 318-19): An ACI Standard; Commentary on Building Code Requirements for Structural Concrete (ACI 318-19). American Concrete Institute: Indianapolis, IN, USA, 2020.
  25. GB 50011-2010; Code for Seismic Design of Buildings (2016 edition). Ministry of Housing and Urban-Rural Development of the People’s Republic of China: Beijing, China, 2016.
  26. Park, R. State-of-the-art report: Ductility evaluation from laboratory and analytical testing. In Proceedings of the 9th World Conference on Earthquake Engineering, Kyoto, Japan, 2–6 August 1988. [Google Scholar]
  27. JGJ 92-2016; Technical Specification for Concrete Structures Prestressed with Unbonded Tendons. Ministry of Housing and Urban-Rural Development of the People’s Republic of China: Beijing, China, 2016.
  28. Scott, B.D.; Park, R.; Priestley, M. Stress-Strain Behavior of Concrete Confined by Overlapping Hoops at Low and High Strain Rates. ACI J. 1982, 79, 13–27. [Google Scholar]
  29. Guo, Z. Principle of Reinforced Concrete, 3rd ed.; Butterworth-Heinemann: Oxford, UK, 2013. [Google Scholar]
  30. Paranagama, D.; Edwards, A.D. Moment-Deformation Characteristics of Pretensioned Concrete Beams Subject to Fluctuating Loads. Pci J. 1969, 14, 62–74. [Google Scholar] [CrossRef]
  31. Burns, N.H.; Pierce, D.M. Strength and behavior of prestressed concrete members with unbonded tendons. PCI J. 1967, 12, 15–29. [Google Scholar] [CrossRef]
  32. Lv, Z.; Xue, W. Study on seismic performance of prestressed concrete Gantry and shelving structures. China Civ. Eng. J. 1996, 29, 6. [Google Scholar]
  33. Xue, W.; Cheng, B.; Li, J. Experimental studies and FEM analysis of seismic behavior of prestressed and non-prestressed high performance concrete beams. J. Build. Struct. 2004, 25, 1–8. [Google Scholar]
  34. Mo, Y.L.; Han, R.H. Cyclic load tests on prestressed concrete model frames. Eng. Struct. 1996, 18, 311–320. [Google Scholar] [CrossRef]
  35. Mufti, A.A.; Newhook, J.P.; Tadros, G. Deformability versus ductility in concrete beams with FRP reinforcement. In Proceedings of the 2nd International Conference on Advanced Composite Materials in Bridges and Structures, Montréal, QC, Canada, 11–14 August 1996. [Google Scholar]
  36. Feng, P.; Ye, L.; Huang, Y. Deformability and new performance indices of flexural members. Eng. Mech. 2005, 22, 28–36. [Google Scholar]
  37. Menegotto, M.; Pinto, P. Method of analysis for cyclically loaded reinforced concrete plane force and bending. In Proceedings of the IABSE Symposium on Resistance and Ultimate Deformability of Structures Acted on by Well Defined Repeated Loads, Lisbon, Portugal, 13–14 September 1973; pp. 15–22. [Google Scholar]
  38. Gao, S. Nonlinear finite element failure analysis of bolted steel-concrete composite frame under column-loss. J. Constr. Steel Res. 2019, 155, 62–76. [Google Scholar] [CrossRef]
Figure 1. Details of specimen cross-sections.
Buildings 14 00431 g001
Figure 2. Tensile stress–strain curve of strand steel.
Buildings 14 00431 g002
Figure 3. Test loading device.
Buildings 14 00431 g003
Figure 4. Test loading system.
Buildings 14 00431 g004
Figure 5. Arrangement of measuring points.
Buildings 14 00431 g005
Figure 6. Failure pattern and crack distribution of specimen.
Buildings 14 00431 g006aBuildings 14 00431 g006b
Figure 7. Hysteretic curves and skeleton curve of specimen.
Buildings 14 00431 g007aBuildings 14 00431 g007b
Figure 8. The yield point of beam determined by equal energy method.
Buildings 14 00431 g008
Figure 9. The relationship between Py-Psy beam and λ.
Buildings 14 00431 g009
Figure 10. Energy dissipation of specimens.
Buildings 14 00431 g010
Figure 11. Load–strain increments of bars and tendons curve.
Buildings 14 00431 g011
Figure 12. Load–strain increment curve and midspan deflection–strain increment curve.
Buildings 14 00431 g012
Figure 13. RES of specimen.
Buildings 14 00431 g013
Figure 14. Load-displacement skeleton curve of specimen.
Buildings 14 00431 g014
Figure 15. Analysis model of specimen section.
Buildings 14 00431 g015
Figure 16. y-direction strain of vibrating wire strain gauge.
Buildings 14 00431 g016
Figure 17. Material constitutive model.
Buildings 14 00431 g017
Figure 18. Stiffness kcr and bearing capacity under different tensile forces.
Buildings 14 00431 g018
Figure 19. Relationship between reinforced index and beam performance.
Buildings 14 00431 g019
Table 1. Detailed list of specimens.
Specimen No.hp/mmαhλSteel Strand
RCB330 mm0.825/2C25
PCB-1330 mm0.825non-tension2As15.2
PCB-2330 mm0.8250.652As15.2
PCB-3330 mm0.8250.753As15.2
PCB-4330 mm0.8250.804As15.2
PCB-5270 mm0.6750.703As15.2
PCB-6200 mm0.5000.704As15.2
Table 2. The measured values of mechanical parameters of rebar.
RebarYield Stress
fy/MPa
Ultimate Stress
fu/MPa
Modulus of Elasticity
Es/MPa
C14418.69603.962.10 × 105
C25403.44605.172.10 × 105
A8319.88437.542.10 × 105
Table 3. Experimental value of steel strand.
Non-Proportional Strain Starting Point Stress/MPaStress at 0.20% of Non-Proportional Strain/MPaElongation at BreakBreaking Stress/MPa
1860130017426.4%1936
Table 4. Main test results.
Specimen No.DirectionPcr/kNΔy/mmΔu/mmPsy/kNPy/kNPu/kNDuctilityFactor F
RCBupward37.736.8221.978.7188.1186.23.68 4.57
downward−42.6−95.8−223.8−88.32−89.9−102.12.65 /
PCB-1upward18.031.6255.9178.278.7203.98.109.74
downward−26.6−32.4−285.0−81.2−88.3−123.28.80/
PCB-2upward75.980.3160.3183.7215.4240.53.21 3.63
downward−42.6−65.1−138.8−104.1−105.0−118.22.40 /
PCB-3upward29.657.1157.8245.1262.2258.82.93 5.32
downward−25.3−40.2−137.8−99.34−100.3−106.03.62 /
PCB-4upward28.547.3137.3300.9309.6350.74.60 6.61
downward−42.7−53.4−164.8−110.1−117.4−138.23.63 /
PCB-5upward129.657.7187.7209.1220.0259.33.83 3.92
downward−30.9−38.7−160.2−130.3−133.3−141.94.41 /
PCB-6upward35.448.5122.5177.2181.8212.82.53 3.72
downward−39.4−46.9−112.3−213−217.5−247.52.39 /
Table 5. Detailed list of numerical analysis beams.
αhλfpeω
0.8250.6510~60% fptk0.05~0.45
0.8250.750~60% fptk
0.8250.800~60% fptk
0.8250.700~70% fptk
0.6750.700~60% fptk/
0.5000.700~60% fptk/
Disclaimer/Publisher’s Note: The statements, opinions and data contained in all publications are solely those of the individual author(s) and contributor(s) and not of MDPI and/or the editor(s). MDPI and/or the editor(s) disclaim responsibility for any injury to people or property resulting from any ideas, methods, instructions or products referred to in the content.

