
Assessment of the Carbon Storage Potential of Portuguese Precast Concrete Industry

Abstract
:1. Introduction
2. Methods
2.1. Scope
2.2. Methodology and Data
3. Results and Discussion
4. Conclusions
- Storing carbon in precast elements is beneficial for reducing CO2 emissions from the precast concrete industry.
- The carbonation curing of precast concrete is viable, assuming that CO2 will become a waste product in the future.
- Additional emissions from carbonation curing are only 10% of the stored amount, resulting in an average net reduction of 90%.
- The Portuguese precast concrete industry has the potential to store 76,000 tonnes of CO2 yearly.
- The overall net reduction in the concrete life cycle averages 9.4% and 8.8% for precast elements and non-structural elements only, respectively.
- A low cement dosage, coupled with carbonation curing technology, produces an estimated net reduction in carbon of 45%.
Author Contributions
Funding
Data Availability Statement
Acknowledgments
Conflicts of Interest
References
- International Energy Agency; World Business Council for Sustainable Development. Cement Technology Roadmap 2009: Carbon Emissions Reductions up to 2050; IEA: Paris, France, 2009. [Google Scholar]
- Di Filippo, J.; Karpman, J.; DeShazo, J. The impacts of policies to reduce CO2 emission within the concrete supply chain. Cem. Concr. Compos. 2019, 101, 67–82. [Google Scholar] [CrossRef]
- Global Cement and Concrete Association. Societal Demand for Cement and Concrete. Available online: https://gccassociation.org/concretefuture/societal-demand-for-cement-and-concrete/ (accessed on 31 December 2022).
- Lehne, J.; Preston, F. Making Concrete Change. Innovation in Low-Carbon Cement and Concrete; Chatham House; The Royal Institute of International Affairs: London, UK, 2018. [Google Scholar]
- Sustainable Concrete Forum. Concrete Industry Sustainability Performance Report; MPA The Concrete Centre: London, UK, 2019. [Google Scholar]
- Hasanbeigi, A.; Arens, M.; Cardenas, J.C.; Price, L.; Triolo, R. Comparison of carbon dioxide emissions intensity of steel production in China, Germany, Mexico, and the United States. Resour. Conserv. Recycl. 2016, 113, 127–139. [Google Scholar] [CrossRef]
- Lippiatt, N.; Ling, T.-C.; Pan, S.-Y. Towards carbon-neutral construction materials: Carbonation of cement-based materials and the future perspective. J. Build. Eng. 2020, 28, 101062. [Google Scholar] [CrossRef]
- Kwon, E.; Ahn, J.; Cho, B.; Park, D. A study on development of recycled cement made from waste cementitious powder. Constr. Build. Mater. 2015, 83, 174–180. [Google Scholar] [CrossRef]
- He, Z.; Zhu, X.; Wang, J.; Mu, M.; Wang, Y. Comparison of CO2 emissions from OPC and recycled cement production. Constr. Build. Mater. 2019, 211, 965–973. [Google Scholar] [CrossRef]
- Scrivener, K.L.; Kirkpatrick, R.J. Innovation in use and research on cementitious material. Cem. Concr. Res. 2008, 38, 128–136. [Google Scholar] [CrossRef]
- UN Environment; Scrivener, K.L.; John, V.M.; Gartner, E.M. Eco-efficient cements: Potential economically viable solutions for a low CO2 cement-based materials industry. Cem. Concr. Res. 2018, 114, 2–26. [Google Scholar] [CrossRef]
- Andrew, R.M. Global CO2 emissions from cement production. Earth Syst. Sci. Data 2018, 10, 195–217. [Google Scholar] [CrossRef]
- Andrew, R.M. Global CO2 emissions from cement production, 1928–2018. Earth Syst. Sci. Data 2019, 11, 1675–1710. [Google Scholar] [CrossRef]
- Guo, R.; Wang, J.; Bing, L.; Tong, D.; Ciais, P.; Davis, S.J.; Andrew, R.M.; Xi, F.; Liu, Z. Global CO2 uptake by cement from 1930 to 2019. Earth Syst. Sci. Data 2021, 13, 1791–1805. [Google Scholar] [CrossRef]
- Olivier, J.G.J.; Janssens-Maenhout, G.; Muntean, M.; Peters, J.A. Trends in Global CO2 Emissions: 2016 Report; PBL Netherlands Environmental Assessment Agency: The Hague, The Netherlands, 2016. [Google Scholar]
- International Energy Agency; Cement Sustainability Initiative. Technology Roadmap: Low-Carbon Transition in the Cement Industry; IEA: Paris, France, 2018. [Google Scholar]
- Boden, T.; Andres, R.; Marland, G. Global, Regional, and National Fossil-Fuel CO2 Emissions. Carbon Dioxide Inf. Anal. Cent. 1999, 2017, 1751–2013. [Google Scholar]
- USGS. USGS Minerals Yearbook 2019, v. I, Metals and Minerals, 13 December 2021. Available online: https://d9-wret.s3.us-west-2.amazonaws.com/assets/palladium/production/s3fs-public/media/files/myb1-2019-cemen-adv.xlsx (accessed on 31 December 2022).
- Liu, X.; Yuan, Z.; Xu, Y.; Jiang, S. Greening cement in China: A cost-effective roadmap. Appl. Energy 2017, 189, 233–244. [Google Scholar] [CrossRef]
- Global Cement and Concrete Association. Global Cement and Concrete Industry Announces Roadmap to Achieve Groundbreaking ‘Net Zero’ CO2 Emissions by 2050. 2021. Available online: https://gccassociation.org/news/global-cement-and-concrete-industry-announces-roadmap-to-achieve-groundbreaking-net-zero-co2-emissions-by-2050/ (accessed on 31 December 2022).
- Ashraf, W. Carbonation of cement-based materials: Challenges and opportunities. Constr. Build. Mater. 2016, 120, 558–570. [Google Scholar] [CrossRef]
- Šavija, B.; Lukovic, M. Carbonation of cement paste: Understanding, challenges, and opportunities. Constr. Build. Mater. 2016, 117, 285–301. [Google Scholar] [CrossRef]
- Oikonomou, N.D. Recycled concrete aggregates. Cem. Concr. Compos. 2005, 27, 315–318. [Google Scholar] [CrossRef]
- Lu, B.; Shi, C.; Zhang, J.; Wang, J. Effects of carbonated hardened cement paste powder on hydration and microstructure of Portland cement. Constr. Build. Mater. 2018, 186, 699–708. [Google Scholar] [CrossRef]
- Mehdizadeh, H.; Ling, T.-C.; Cheng, X.; Mo, K.H. Effect of particle size and CO2 treatment of waste cement powder on properties of cement paste. Can. J. Civ. Eng. 2020, 48, 522–531. [Google Scholar] [CrossRef]
- Silva, A.; Nogueira, R.; Bogas, A.; Abrantes, J.; Wawrzyńczak, D.; Ściubidło, A.; Majchrzak-Kucęba, I. Valorisation of recycled cement paste: Feasibility of a short duration carbonation process. Materials 2022, 15, 6001. [Google Scholar] [CrossRef] [PubMed]
- Monkman, S. Sustainable Ready Mixed Concrete Production Using Waste CO2: A Case Study. In Proceedings of the Recent Advances in Concrete Technology and Sustainability Issues: Fourteenth International Conference, Beijing, China, 30 October–2 November 2018. [Google Scholar]
- Silva, A.; Nogueira, R.; Bogas, J.A.; Rodrigues, M. Influence of carbon dioxide as a mixture component on the cement hydration. In Proceedings of the 4th International RILEM Conference: Microstructure Related Durability of Cementitious Composites, Delft, The Netherlands, 29 April–25 May 2021. [Google Scholar]
- Lippiatt, N.; Ling, T.-C. Rapid hydration mechanism of carbonic acid and cement. J. Build. Eng. 2020, 31, 101357. [Google Scholar] [CrossRef]
- CarbonCure. CarbonCure Technologies. 2021. Available online: https://www.carboncure.com/technology/ (accessed on 7 June 2021).
- Liu, Z.; Meng, W. Fundamental understanding of carbonation curing and durability of carbonation-cured cement-based composites: A review. J. CO2 Util. 2021, 44, 101428. [Google Scholar] [CrossRef]
- Zhang, D.; Ghouleh, Z.; Shao, Y. Review on carbonation curing of cement-based materials. J. CO2 Util. 2017, 21, 119–131. [Google Scholar] [CrossRef]
- Rostami, V.; Shao, Y.; Boyd, A.J. Carbonation Curing versus Steam Curing for Precast Concrete Production. J. Mater. Civ. Eng. 2012, 24, 1221–1229. [Google Scholar] [CrossRef]
- Carriço, A.; Bogas, J.A.; Guedes, M. Thermoactivated cementitious materials—A review. Constr. Build. Mater. 2020, 250, 118873. [Google Scholar] [CrossRef]
- Hanifa, M.; Agarwal, R.; Sharma, U.; Thapliyal, P.C.; Singh, L.P. A review on CO2 capture and sequestration in the construction industry: Emerging approaches and commercialised technologies. J. CO2 Util. 2023, 67, 102292. [Google Scholar] [CrossRef]
- Plaza, M.G.; Martínez, S.; Rubiera, F. CO2 Capture, Use, and Storage in the Cement Industry: State of the Art and Expectations. Energies 2020, 13, 5692. [Google Scholar] [CrossRef]
- Simoni, M.; Wilkes, M.D.; Brown, S.; Provis, J.L.; Kinoshita, H.; Hanein, T. Decarbonising the lime industry: State-of-the-art. Renew. Sustain. Energy Rev. 2022, 168, 112765. [Google Scholar] [CrossRef]
- Sizirici, B.; Fseha, Y.; Cho, C.-S.; Yildiz, I.; Byon, Y.-J. A Review of Carbon Footprint Reduction in Construction Industry, from Design to Operation. Materials 2021, 14, 6094. [Google Scholar] [CrossRef] [PubMed]
- Sumner, J.; Bird, L.; Dobos, H. Carbon taxes: A review of experience and policy design considerations. Clim. Policy 2011, 11, 922–943. [Google Scholar] [CrossRef]
- Associação Portuguesa das Empresas de Betão Pronto (APEB). APEB-Associação Portuguesa das Empresas de Betão Pronto. 2020. Available online: http://www.apeb.pt/ (accessed on 31 December 2021).
- Associação Técnica da Indústria de Cimento (ATIC). ATIC-Associação Técnica da Indústria de Cimento. 2018. Available online: https://www.atic.pt/ (accessed on 31 December 2021).
- Shao, Y.; Monkman, S.; Boyd, A.J. Recycling carbon dioxide into concrete: A feasibility study. In Proceedings of the Concrete Sustainability Conference, Tempe, Ariz, 13–15 April 2010. [Google Scholar]
- Shao, Y.; Monkman, S.; Wang, S. Market analysis of CO2 sequestration in concrete building products. In Proceedings of the Second International Conference on Sustainable Construction Materials and Technologies, Ancona, Italy, 28–30 June 2010. [Google Scholar]
- Monkman, S.; Shao, Y. Integration of carbon sequestration into curing process of precast concrete. Can. J. Civ. Eng. 2010, 37, 302–310. [Google Scholar] [CrossRef]
- Rostami, V.; Shao, Y.; Boyd, A.J. Durability of concrete pipes subjected to combined steam and carbonation curing. Constr. Build. Mater. 2011, 25, 3345–3355. [Google Scholar] [CrossRef]
- El-Hassan, H.; Shao, Y. Carbon storage through concrete block carbonation curing. J. Clean Energy Technol. 2014, 2, 287–291. [Google Scholar] [CrossRef]
- Ravikumar, D.; Zhang, D.; Keoleian, G.; Miller, S.; Sick, V.; Li, V. Carbon dioxide utilization in concrete curing or mixing might not produce a net climate benefit. Nat. Commun. 2021, 12, 855–868. [Google Scholar] [CrossRef] [PubMed]
- International Energy Agency. Global Energy Review 2021: Assessing the Effects of Economic Recoveries on Global Energy Demand and CO2 Emissions in 2021; International Energy Agency: Paris, France, 2021. [Google Scholar]
- Ember. Global Electricity Review 2022; Ember: London, UK, 2022. [Google Scholar]
- U.S. Energy Information Administration. Annual Energy Outlook 2022. 3 March 2022. Available online: https://www.eia.gov/outlooks/aeo/pdf/AEO2022_ReleasePresentation.pdf (accessed on 31 December 2022).
- U.S Energy Information Administration. EIA Projects Renewables Share of U.S. Electricity Generation Mix Will Double by 2050. 8 February 2021. Available online: https://www.eia.gov/todayinenergy/detail.php?id=46676 (accessed on 31 December 2022).
- International Energy Agency. International Energy Agency Sweden. 2020. Available online: https://www.iea.org/countries/sweden (accessed on 31 December 2022).
- International Energy Agency. International Energy Agency Norway. 2020. Available online: https://www.iea.org/countries/norway (accessed on 31 December 2022).
- International Renewable Energy Agency. Energy Profile Iceland. 2021. Available online: https://www.irena.org/IRENADocuments/Statistical_Profiles/Europe/Iceland_Europe_RE_SP.pdf (accessed on 31 December 2022).
- Mousavi, S.; Kara, S.; Kornfield, B. Energy Efficiency of Compressed Air Systems. Procedia CIRP 2014, 15, 313–318. [Google Scholar] [CrossRef]
- European Environment Agency. Greenhouse Gas Emission Intensity of Electricity Generation by Country. 2021. Available online: https://www.eea.europa.eu/data-and-maps/daviz/co2-emission-intensity-9#tab-googlechartid_googlechartid_googlechartid_googlechartid_chart_11111 (accessed on 31 December 2022).
- APREN. Boletim Energias Renováveis: Edição Mensal Dezembro de 2017; APREN: Lisboa, Portugal, 2017. [Google Scholar]
- APREN. Boletim Energias Renováveis: Edição Mensal Dezembro de 2018; APREN: Lisboa, Portugal, 2018. [Google Scholar]
- APREN. Boletim Eletricidade Renovável; APREN: Lisboa, Portugal, 2019. [Google Scholar]
- APREN. Boletim Eletricidade Renovável; APREN: Lisboa, Portugal, 2020. [Google Scholar]
- Wild, P. Recommendations for a future global CO2-calculation standard for transport and logistics. Transp. Res. Part D Transp. Environ. 2021, 100, 103024. [Google Scholar] [CrossRef]
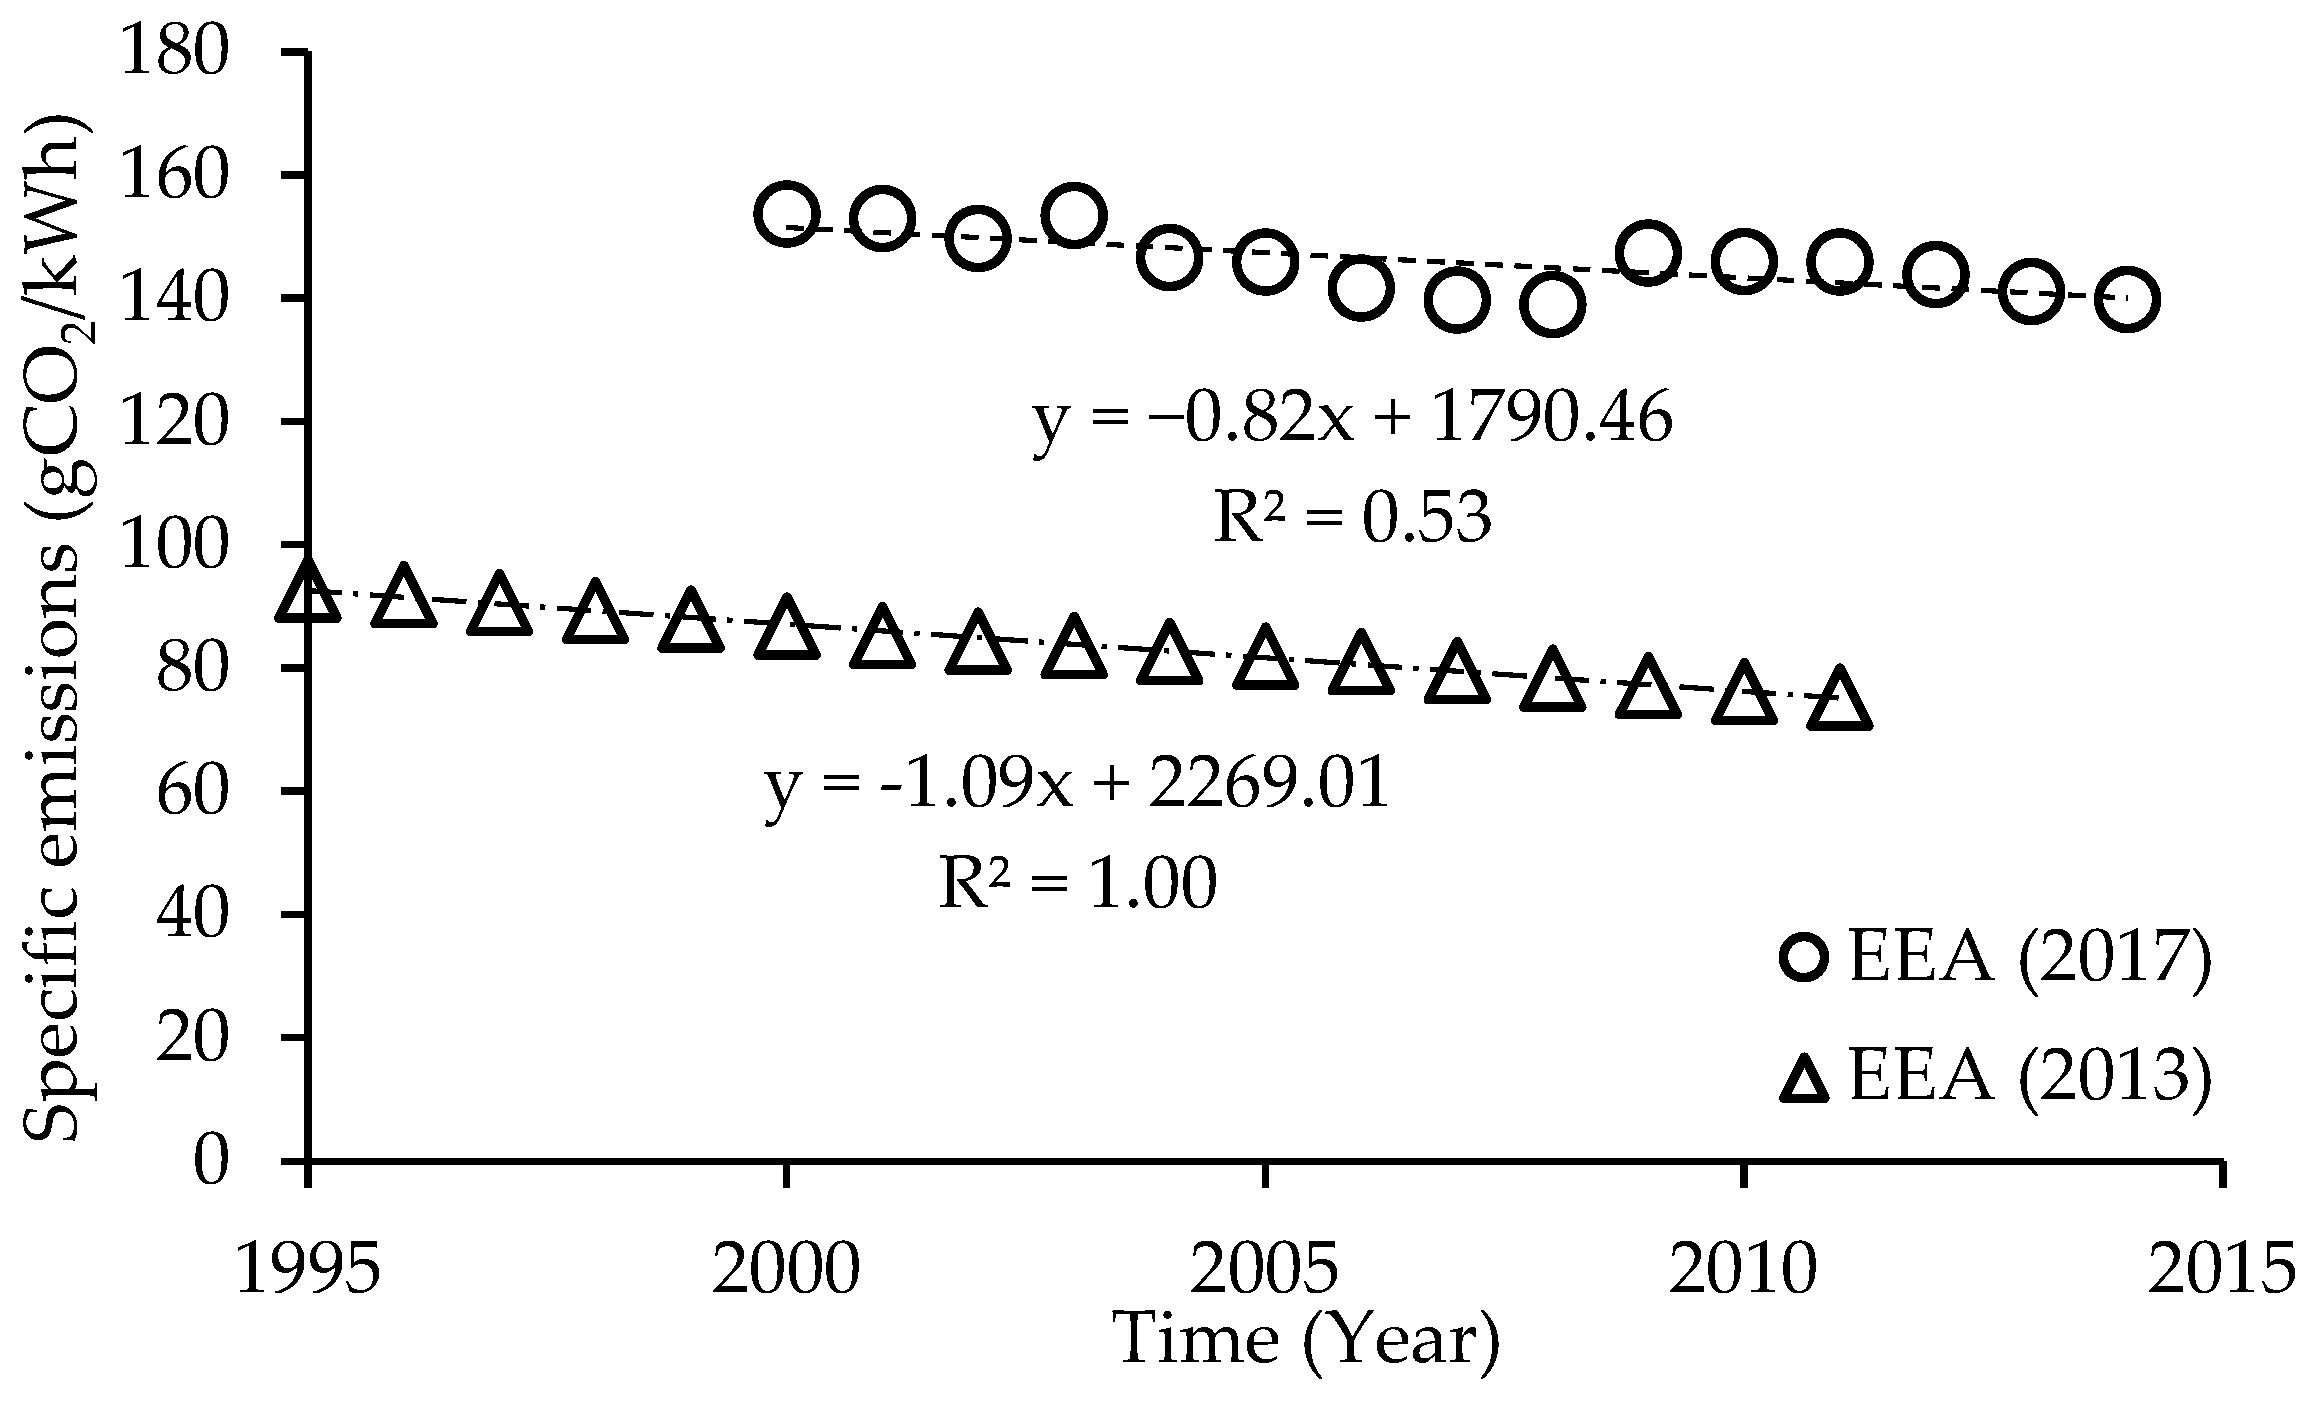
- European Environment Agency. Specific CO2 Emissions per tonne-km and per Mode of Transport in Europe. 2017. Available online: https://www.eea.europa.eu/data-and-maps/daviz/specific-co2-emissions-per-tonne-2/#tab-chart_1 (accessed on 31 December 2022).
- European Environment Agency. Specific CO2 Emissions per tonne-km and per Mode of Transport in Europe, 1995–2011. 2013. Available online: https://www.eea.europa.eu/data-and-maps/figures/specific-co2-emissions-per-tonne-2 (accessed on 31 December 2022).
- Transport & Environment. Easy Ride: Why the EU Truck CO2 Targets are Unfit for the 2020s; European Federation for Transport and Environment AISBL: Brussels, Belgium, 2021. [Google Scholar]
- Mckinnon, P.A.; Piecyk, M. Measuring and Managing CO2 Emissions of European Chemical Transport; Logistics Research Centre: Edinburgh, Scotland, 2018. [Google Scholar]
- Sims, R.; Schaeffer, R. “Transport,” in Climate Change 2014: Mitigation of Climate Change; Cambridge University Press: Cambridge, UK, 2014; pp. 599–670. [Google Scholar]
- International Energy Agency. Railway Handbook 2012: Energy Consumption and CO2 Emissions; International Energy Agency: Paris, France, 2012. [Google Scholar]
- Erik, L.; Eldrup, N.; Adhikari, U.; Bentsen, M.H.; Badalge, J.L.; Yang, S. Simulation and Cost Comparison of CO2 Liquefaction. Energy Procedia 2016, 86, 500–510. [Google Scholar]
- Monkman, S.; MacDonald, M. On carbon dioxide utilization as a means to improve the sustainability of ready-mixed concrete. J. Clean. Prod. 2017, 167, 365–375. [Google Scholar] [CrossRef]
- Mendelsohn, R.; Sedjo, R.; Sohngen, B. Forest Carbon Sequestration. In Fiscal Policy to Mitigate Climate Change: A Guide for Policymakers; International Monetary Fund: Washington, DC, USA, 2021; pp. 89–102. [Google Scholar]


| Cement | |||
|---|---|---|---|
| Dosage | Type | Total Consumption [kg/Year] | |
| [kg/m3] | [-] | Non-Structural | Structural |
| 100 to 200 | CEM I 52.5 R | 406,458 | 45,162 |
| CEM I 42.5 R | 191,250 | 63,750 | |
| CEM II/A-L 42.5 R | 5,589,600 | 891,900 | |
| 200 to 300 | CEM I 52.5 R | 714,525 | 1,538,175 |
| CEM I 42.5 R | 1,243,125 | 1,519,375 | |
| CEM II/A-L 42.5 R | 5,241,750 | 915,750 | |
| 300 to 400 | CEM I 52.5 R | 948,402 | 8,535,618 |
| CEM I 42.5 R | 1,770,125 | 312,375 | |
| CEM II/A-L 42.5 R | 2,115,575 | 9,864,925 | |
| >400 (average 450) | CEM I 52.5 R | 1,151,631 | 203,229 |
| CEM I 42.5 R | 650,250 | 114,750 | |
| CEM II/A-L 42.5 R | 4,459,275 | 1,381,725 | |
| Total | 24,481,966 | 25,386,734 | |
| 49,868,700 | |||
| Mode | Maximum | Minimum | Units | Sources | |
|---|---|---|---|---|---|
| Liquefaction | 22.60 | 50.88 | 12.98 | g CO2/kg CO2 | Calculated |
| Emission factor (electricity) | 253.9 | 355.3 | 162.2 | g CO2/kWh | [56,57,58,59,60] |
| Electricity consumption | 0.089 | 0.143 | 0.080 | kWh/kg CO2 | [47,68,69] |
| Transportation | 15.14 | 125.87 | 3.42 | g CO2/kg CO2 | Calculated |
| Emission factor (fuel) | 82.0 | 300.0 | 40.0 | g CO2/tkm | [47,64,65,67] |
| Distance | 120.0 | 300.0 | 50.0 | km | Estimated 1 |
| Efficiency | 0.650 | 0.715 | 0.585 | kg CO2/kg transported | [47,64,65,67] |
| Vaporization | 1.79 | 3.13 | 0.86 | g CO2/kg CO2 | Calculated |
| Emission factor (electricity) | 253.95 | 355.31 | 162.19 | g CO2/ kWh | [56,57,58,59,60] |
| Electricity consumption | 0.007 | 0.0088 | 0.0053 | kWh/kg CO2 | [47,68,69] |
| Injection | 9.40 | 14.46 | 5.40 | g CO2/kg CO2 | Calculated |
| Emission factor (electricity) | 253.9 | 355.3 | 162.2 | g CO2/kWh | [56,57,58,59,60] |
| Electricity consumption | 0.037 | 0.041 | 0.033 | kWh/kg CO2 | [47,68,69] |
| Specific emission | 0.051 | 0.204 | 0.023 | kg CO2 emitted/kg CO2 used | Calculated |
| Mode | Maximum | Minimum | Units | Sources | |
|---|---|---|---|---|---|
| Vacuum | 4780 | 70,937 | 745 | kg CO2/year | Calculated |
| Emission factor (electricity) | 253.95 | 355.31 | 162.19 | g CO2/kWh | [56,57,58,59,60] |
| Electricity consumption | 0.025 | 0.1 | 0.015 | kWh/m3 air | [66] |
| Volume of air | 752,864 | 1,996,462 | 306,246 | m3 air/year | Estimated 1 |
| Losses | 0.40 | 0.80 | 0.20 | m3 CO2/m3 concrete | Estimated 2 |
| Specific emission | 0.036 | 0.048 | 0.032 | kg CO2 emitted/kg CO2 used | Calculated |
| Precast Concrete Products | CO2 Emissions from Cement Production [kg of CO2/Year] 1 | Produced Concrete [m3/Year] 2 | CO2 Emissions [kg of CO2/m3 of Concrete] | Carbonation Curing Technology (Mode Value) | Net Reduction [%] | ||
|---|---|---|---|---|---|---|---|
| CO2 Emissions [kg/Year] 3 | CO2 Storage [kg/Year] 3 | CO2 Emissions [kg of CO2/m3 of Concrete] | |||||
| Both structural and non-structural elements | 806,400,000 | 3,418,505 | 236 | 7,320,000 | 80,980,000 | 215 | 9.1% |
| Only non-structural elements | 395,884,741 | 1,882,160 | 210 | 3,700,000 | 38,800,000 | 192 | 8.9% |
| Only non-structural concrete with a cement dosage of 150 kg/m3 (virtual scenario) | 237,152,107 | 1,882,160 | 126 | 2,216,460 | 23,242,881 | 115 | 8.9% |
Disclaimer/Publisher’s Note: The statements, opinions and data contained in all publications are solely those of the individual author(s) and contributor(s) and not of MDPI and/or the editor(s). MDPI and/or the editor(s) disclaim responsibility for any injury to people or property resulting from any ideas, methods, instructions or products referred to in the content. |
© 2024 by the authors. Licensee MDPI, Basel, Switzerland. This article is an open access article distributed under the terms and conditions of the Creative Commons Attribution (CC BY) license (https://creativecommons.org/licenses/by/4.0/).
Share and Cite
Sousa, V.; Silva, A.; Nogueira, R. Assessment of the Carbon Storage Potential of Portuguese Precast Concrete Industry. Buildings 2024, 14, 384. https://doi.org/10.3390/buildings14020384
Sousa V, Silva A, Nogueira R. Assessment of the Carbon Storage Potential of Portuguese Precast Concrete Industry. Buildings. 2024; 14(2):384. https://doi.org/10.3390/buildings14020384
Chicago/Turabian StyleSousa, Vitor, André Silva, and Rita Nogueira. 2024. "Assessment of the Carbon Storage Potential of Portuguese Precast Concrete Industry" Buildings 14, no. 2: 384. https://doi.org/10.3390/buildings14020384