

Microstructural Evolution of Calcium Sulfoaluminate Cement during the Wet-Carbonation Process

Abstract
:1. Introduction
2. Experimental Programs
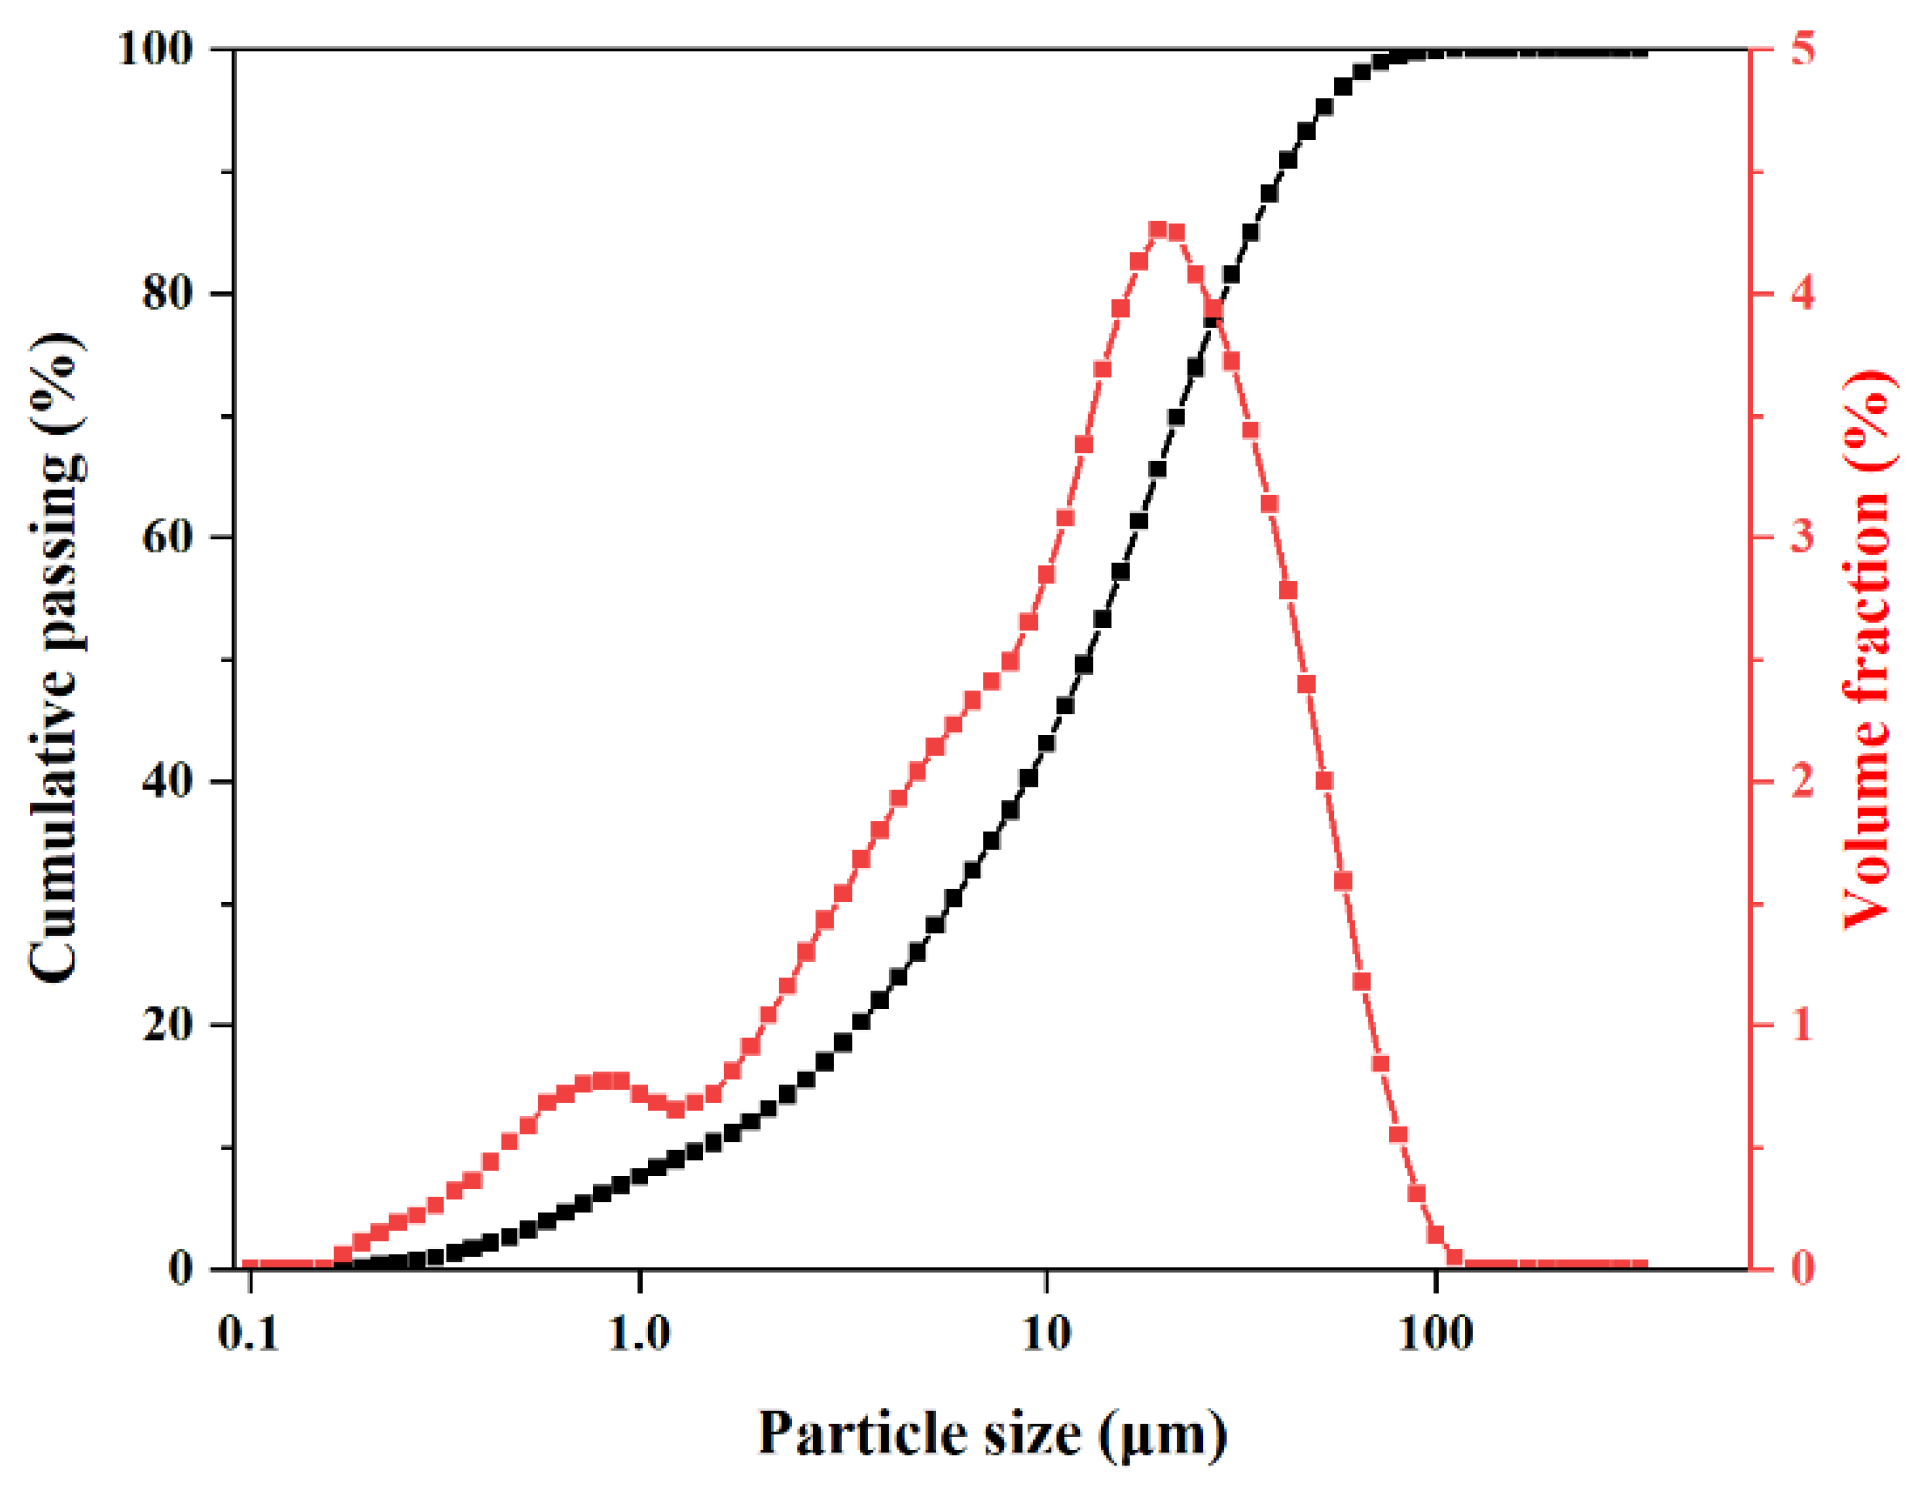
2.1. Raw Materials and Characterization
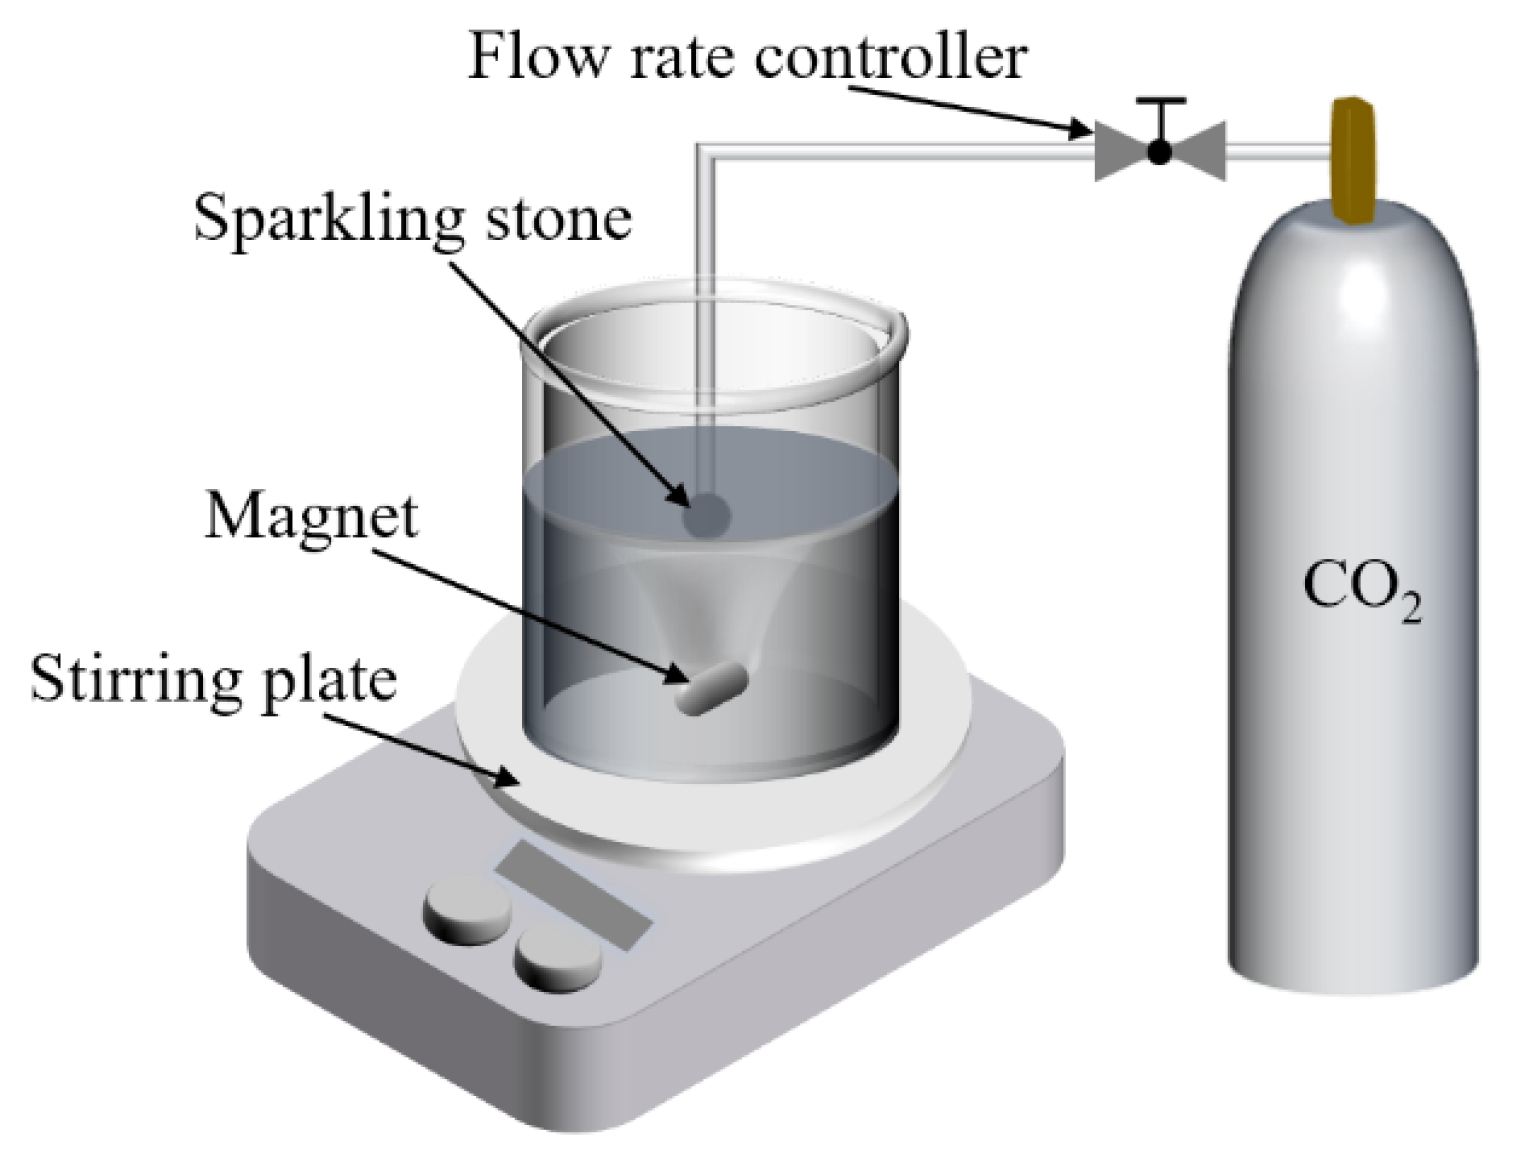
2.2. Wet-Carbonation Process
2.3. Test Methods
2.3.1. pH Measurement
2.3.2. X-ray Diffraction (XRD) Measurement
2.3.3. Thermogravimetric (TG) Measurement
2.3.4. Fourier-Transformed Infrared Spectroscopy (FT-IR) Measurement
2.3.5. Scanning Electron Microscope (SEM) Measurement
2.3.6. GEMS Modeling
3. Results and Discussion
3.1. pH Analysis
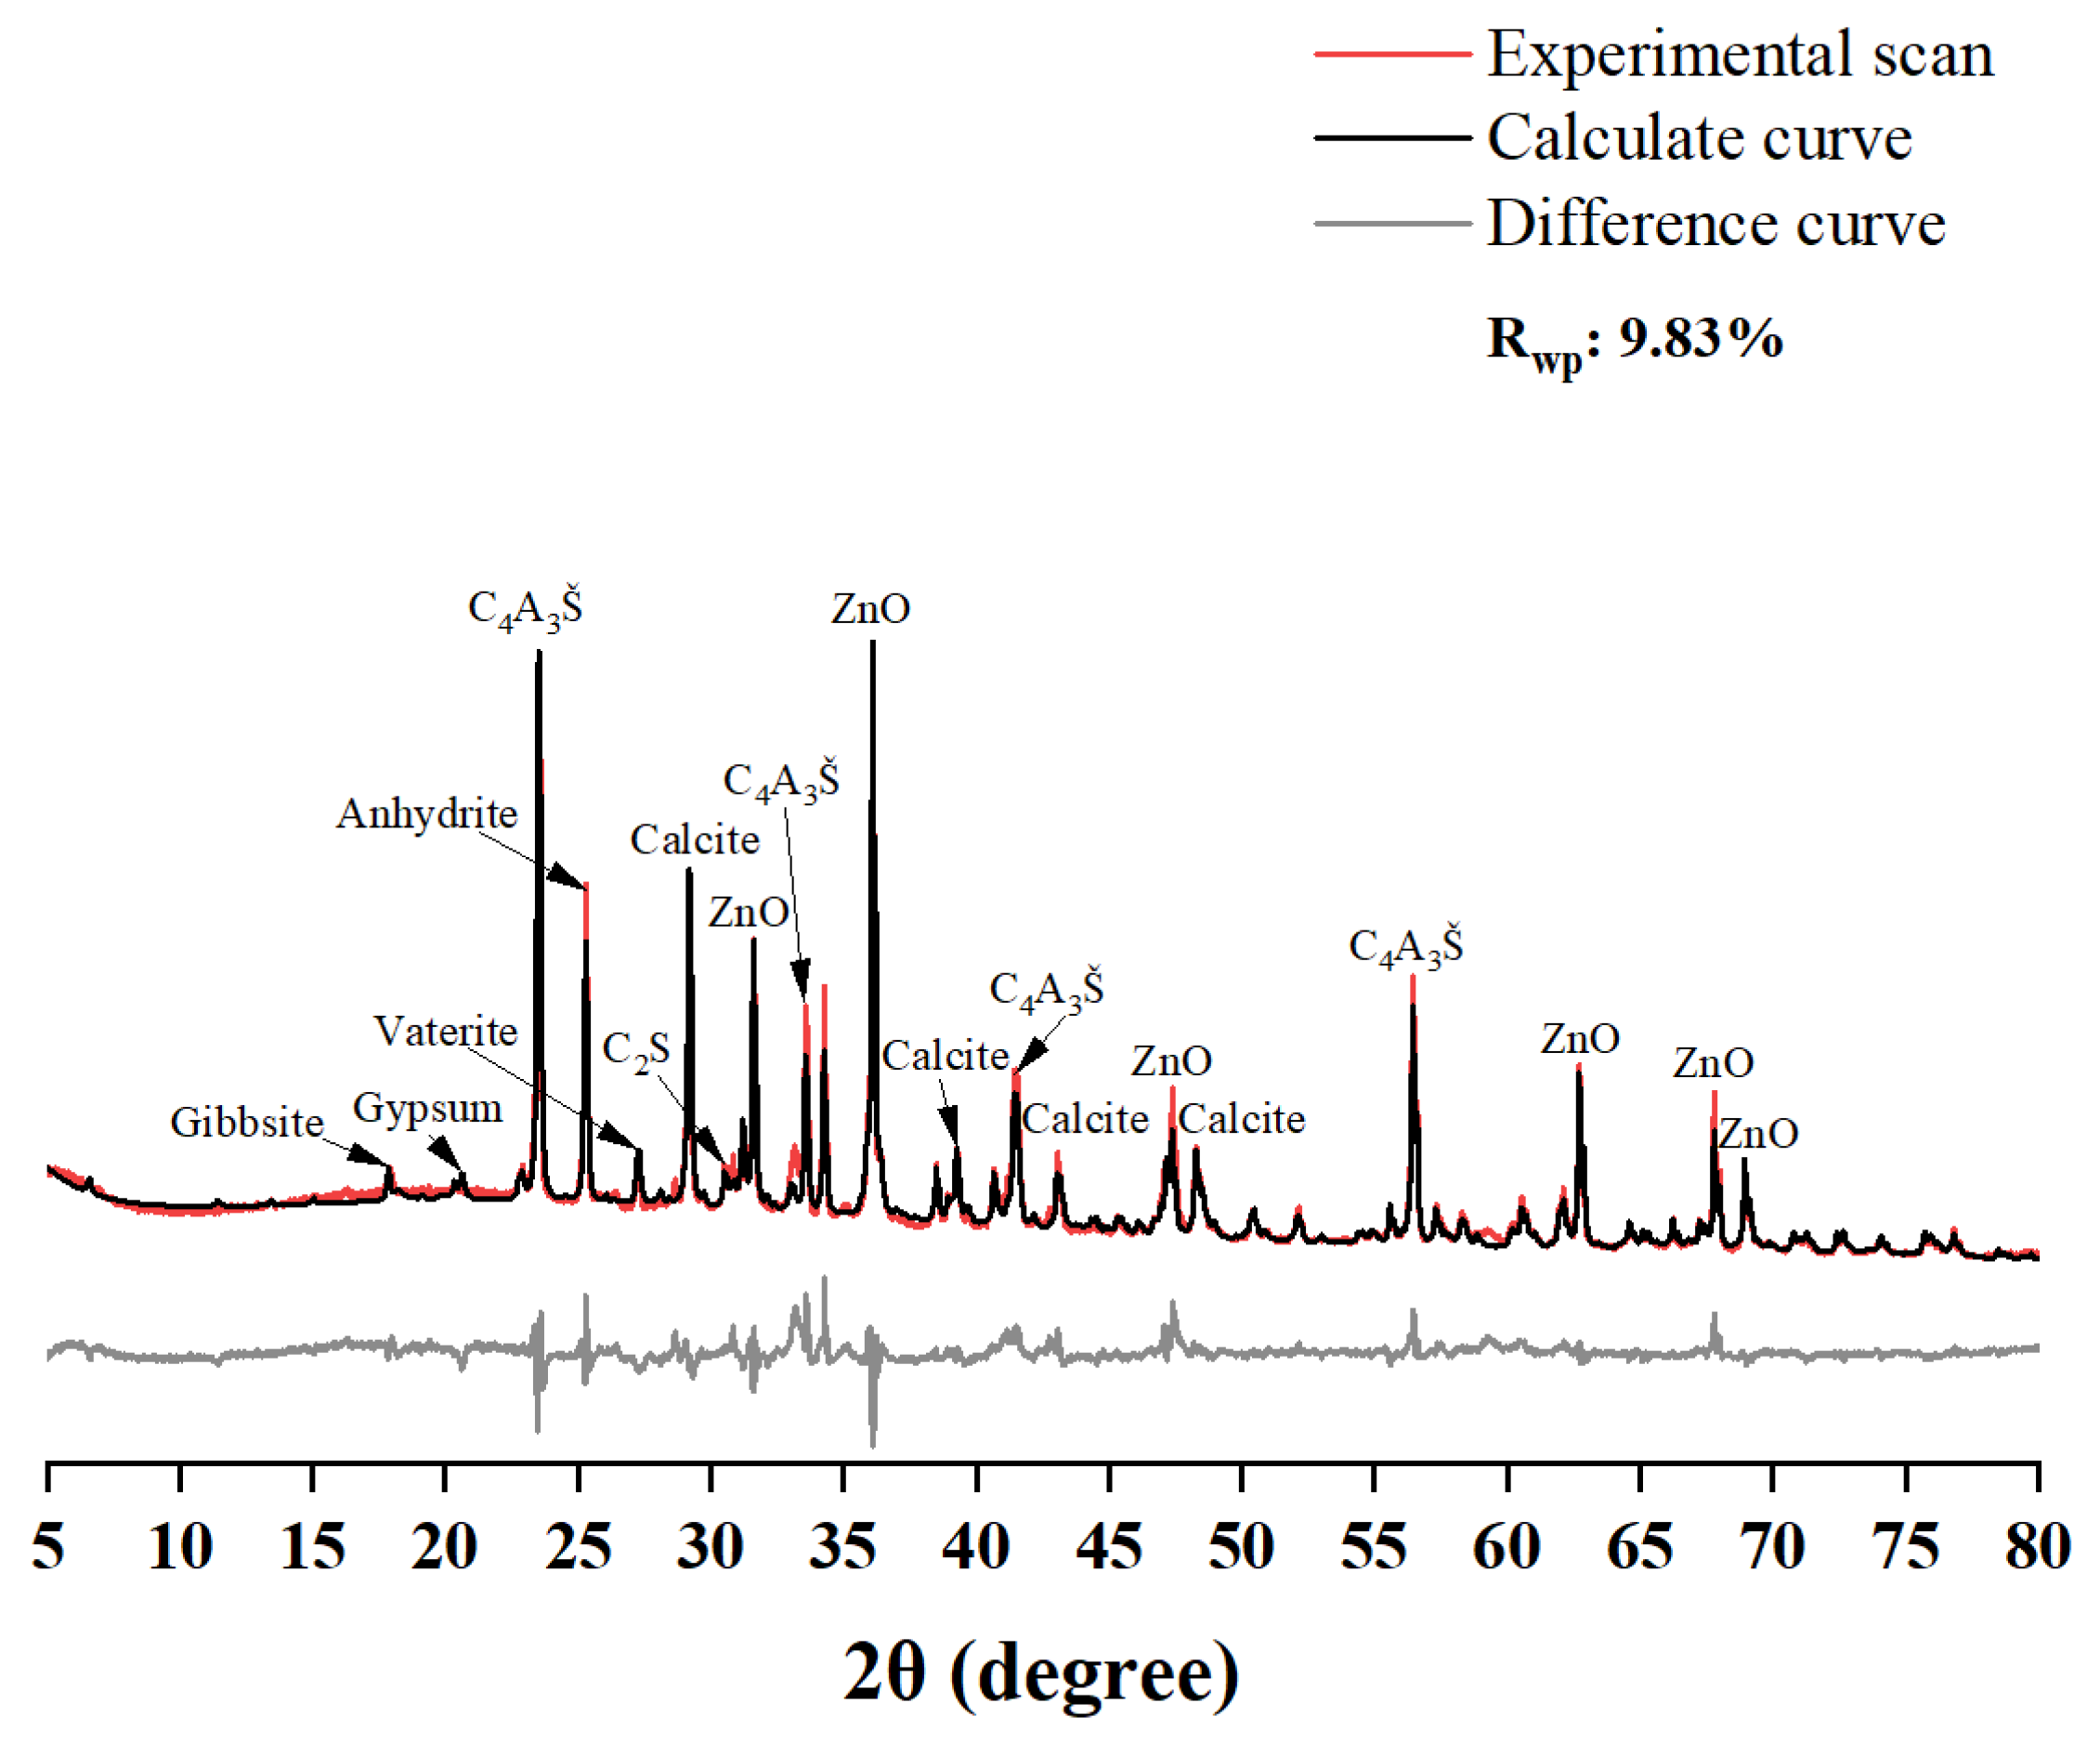
3.2. XRD Analysis
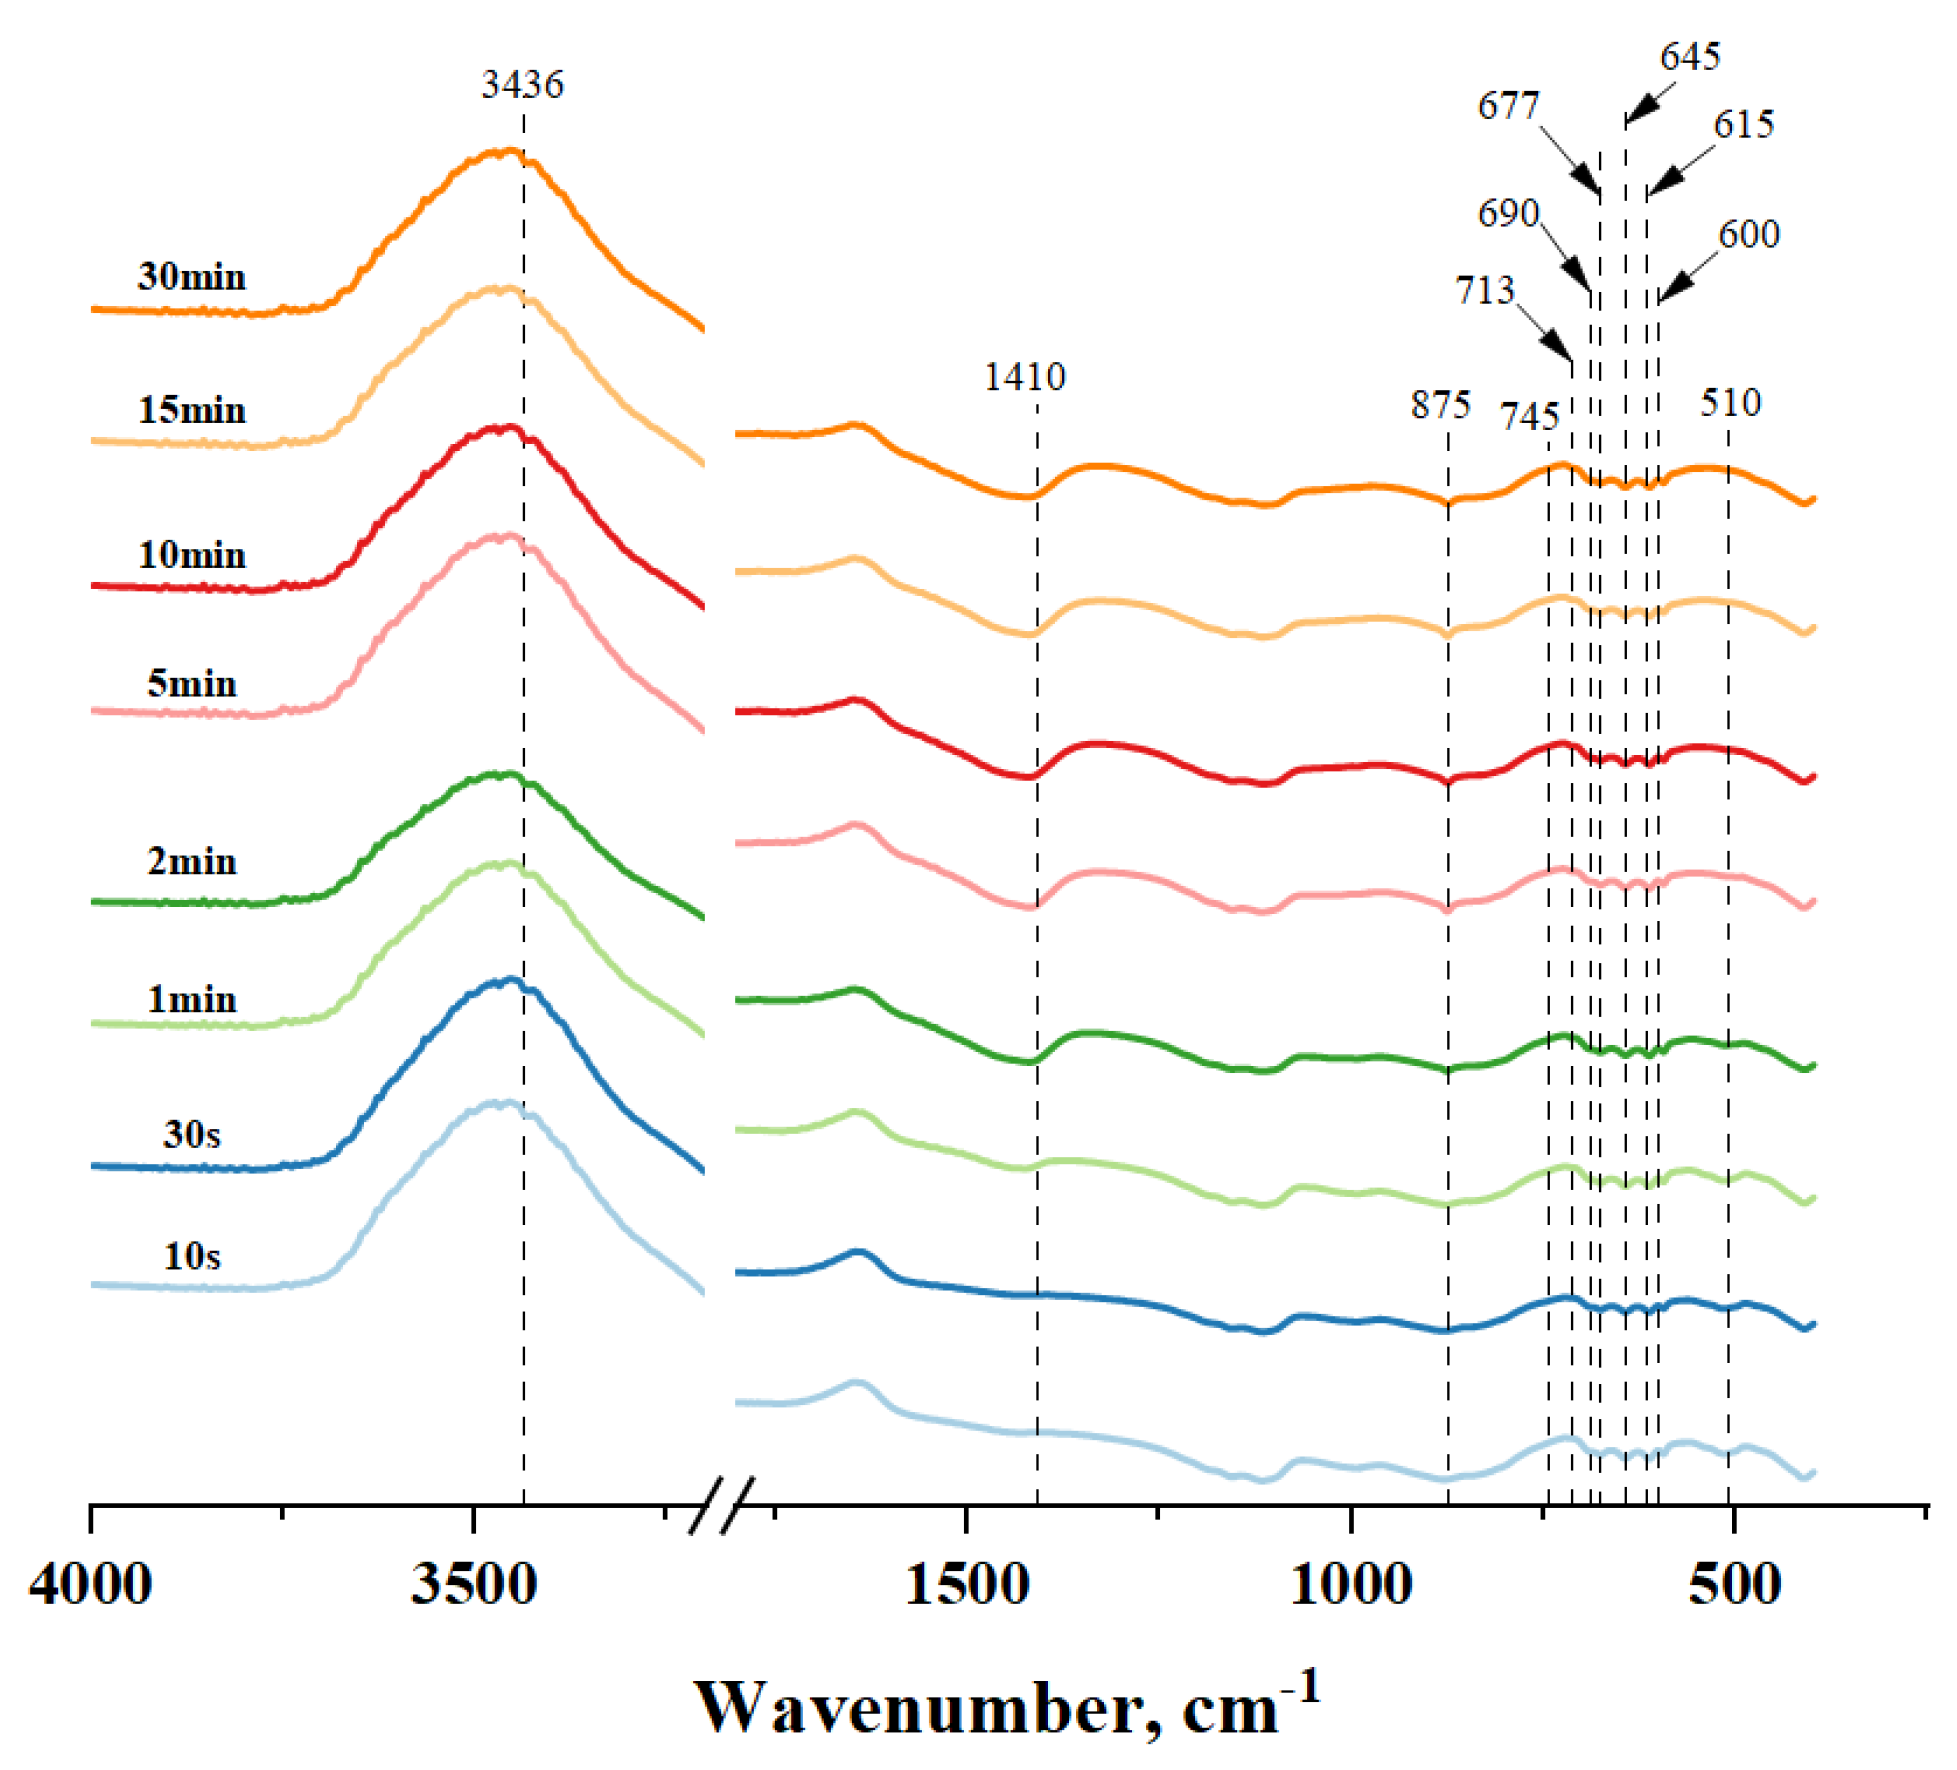
3.3. FT-IR Analysis
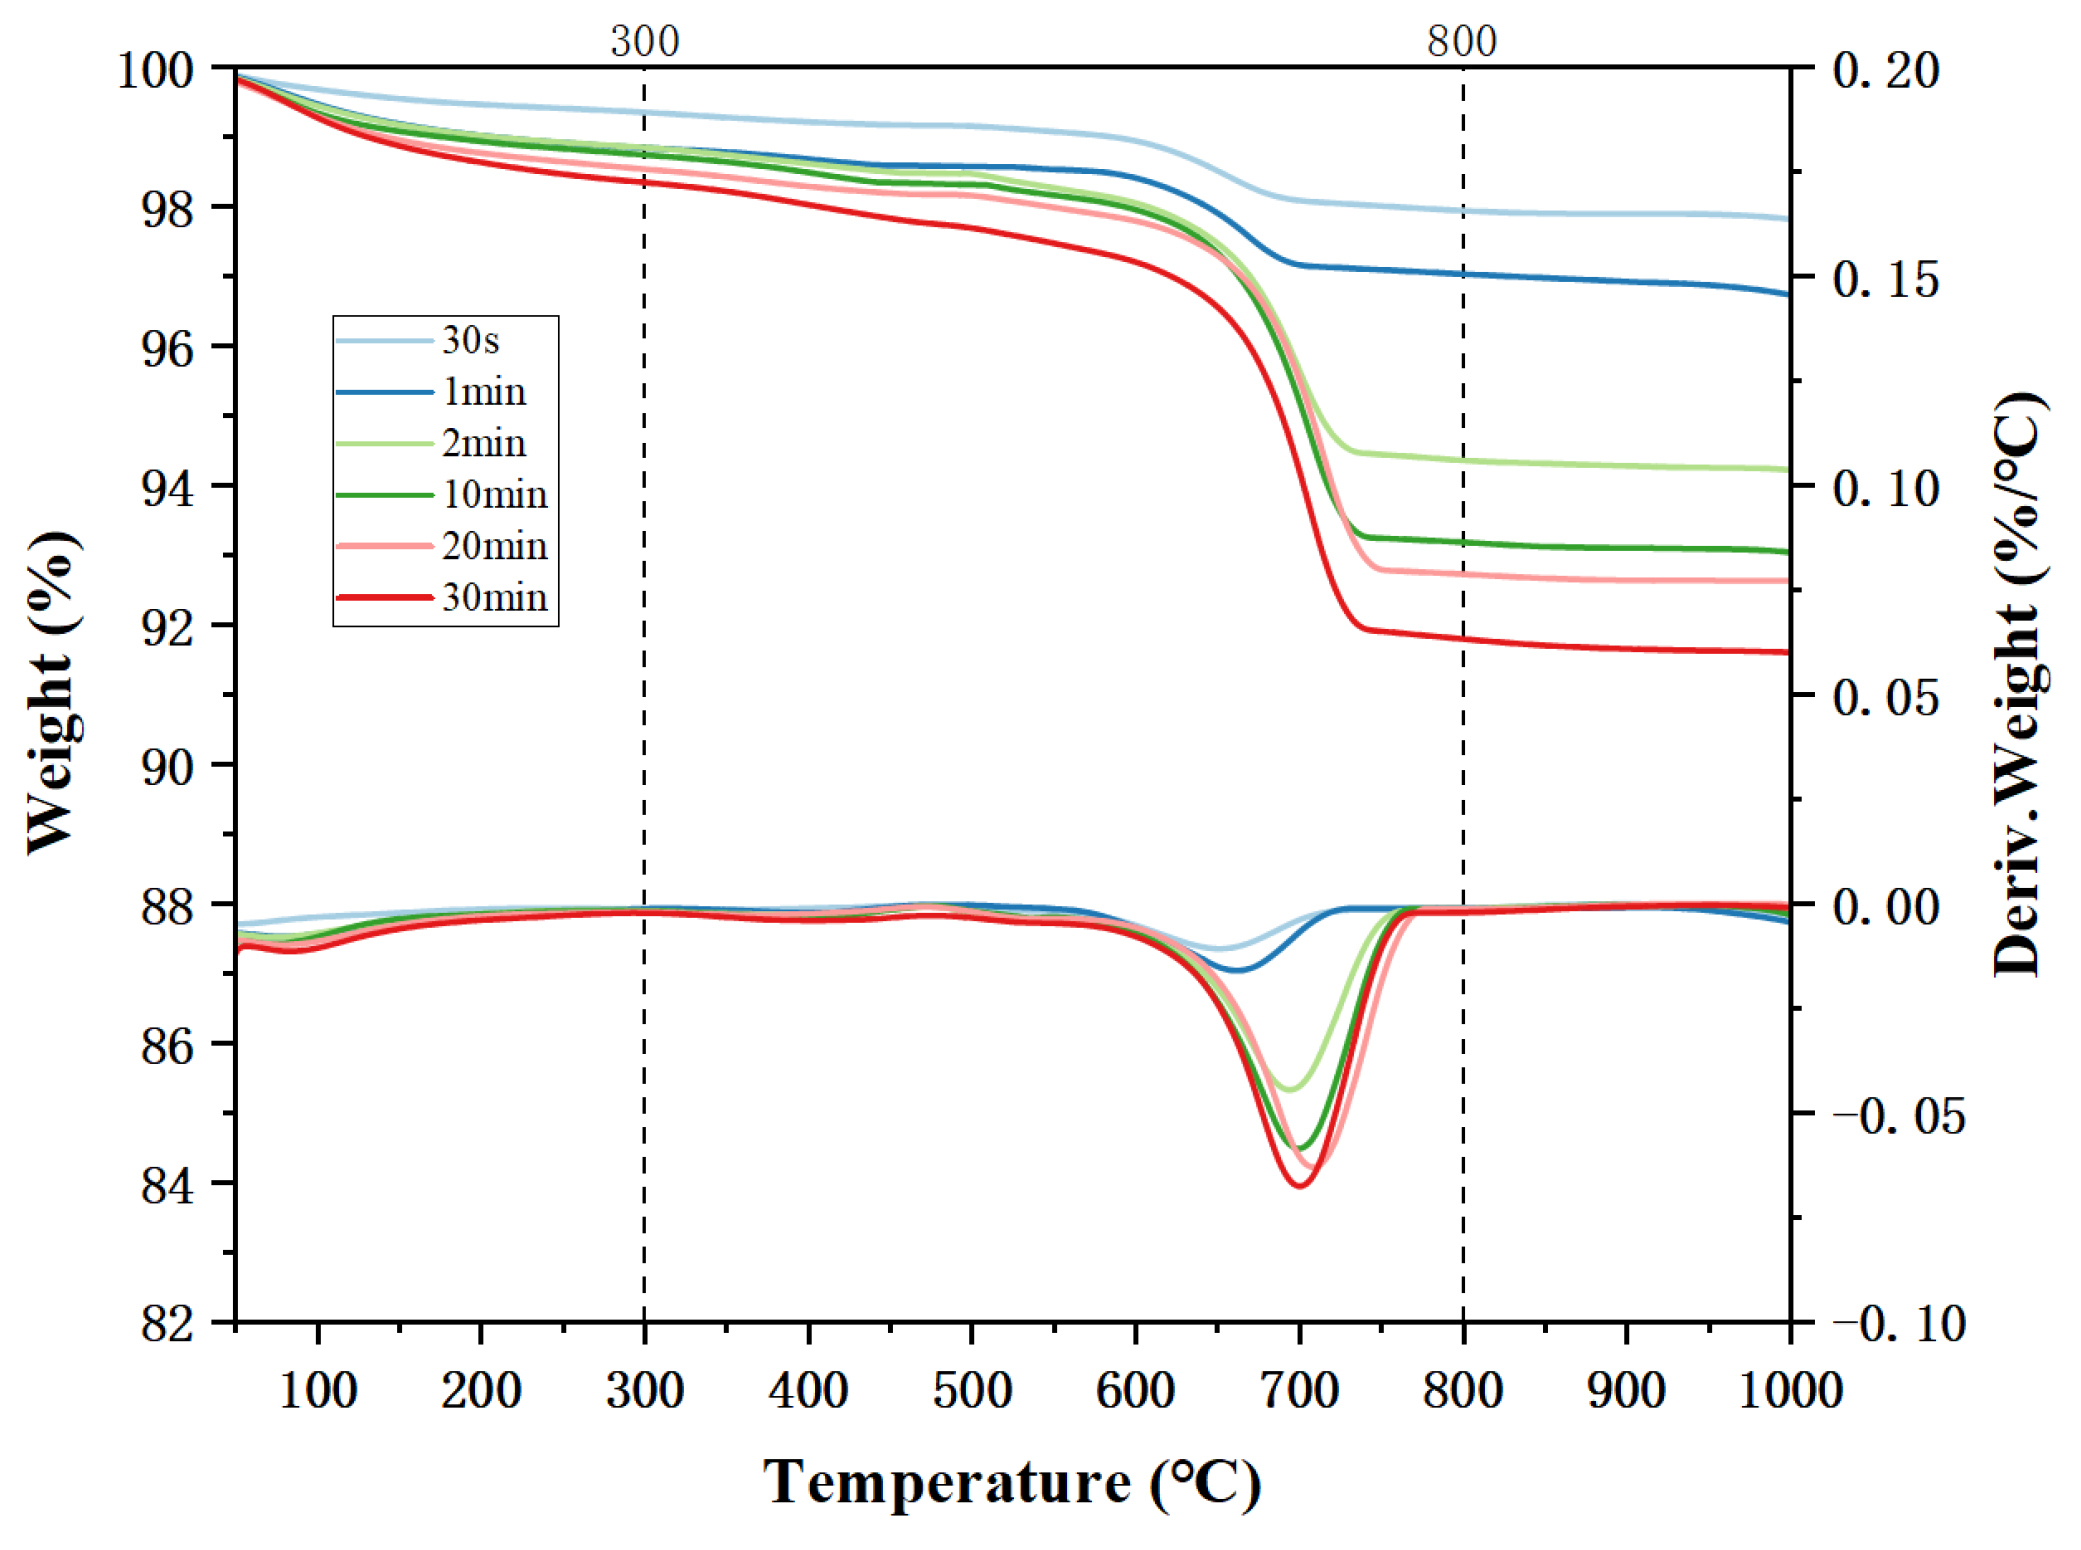
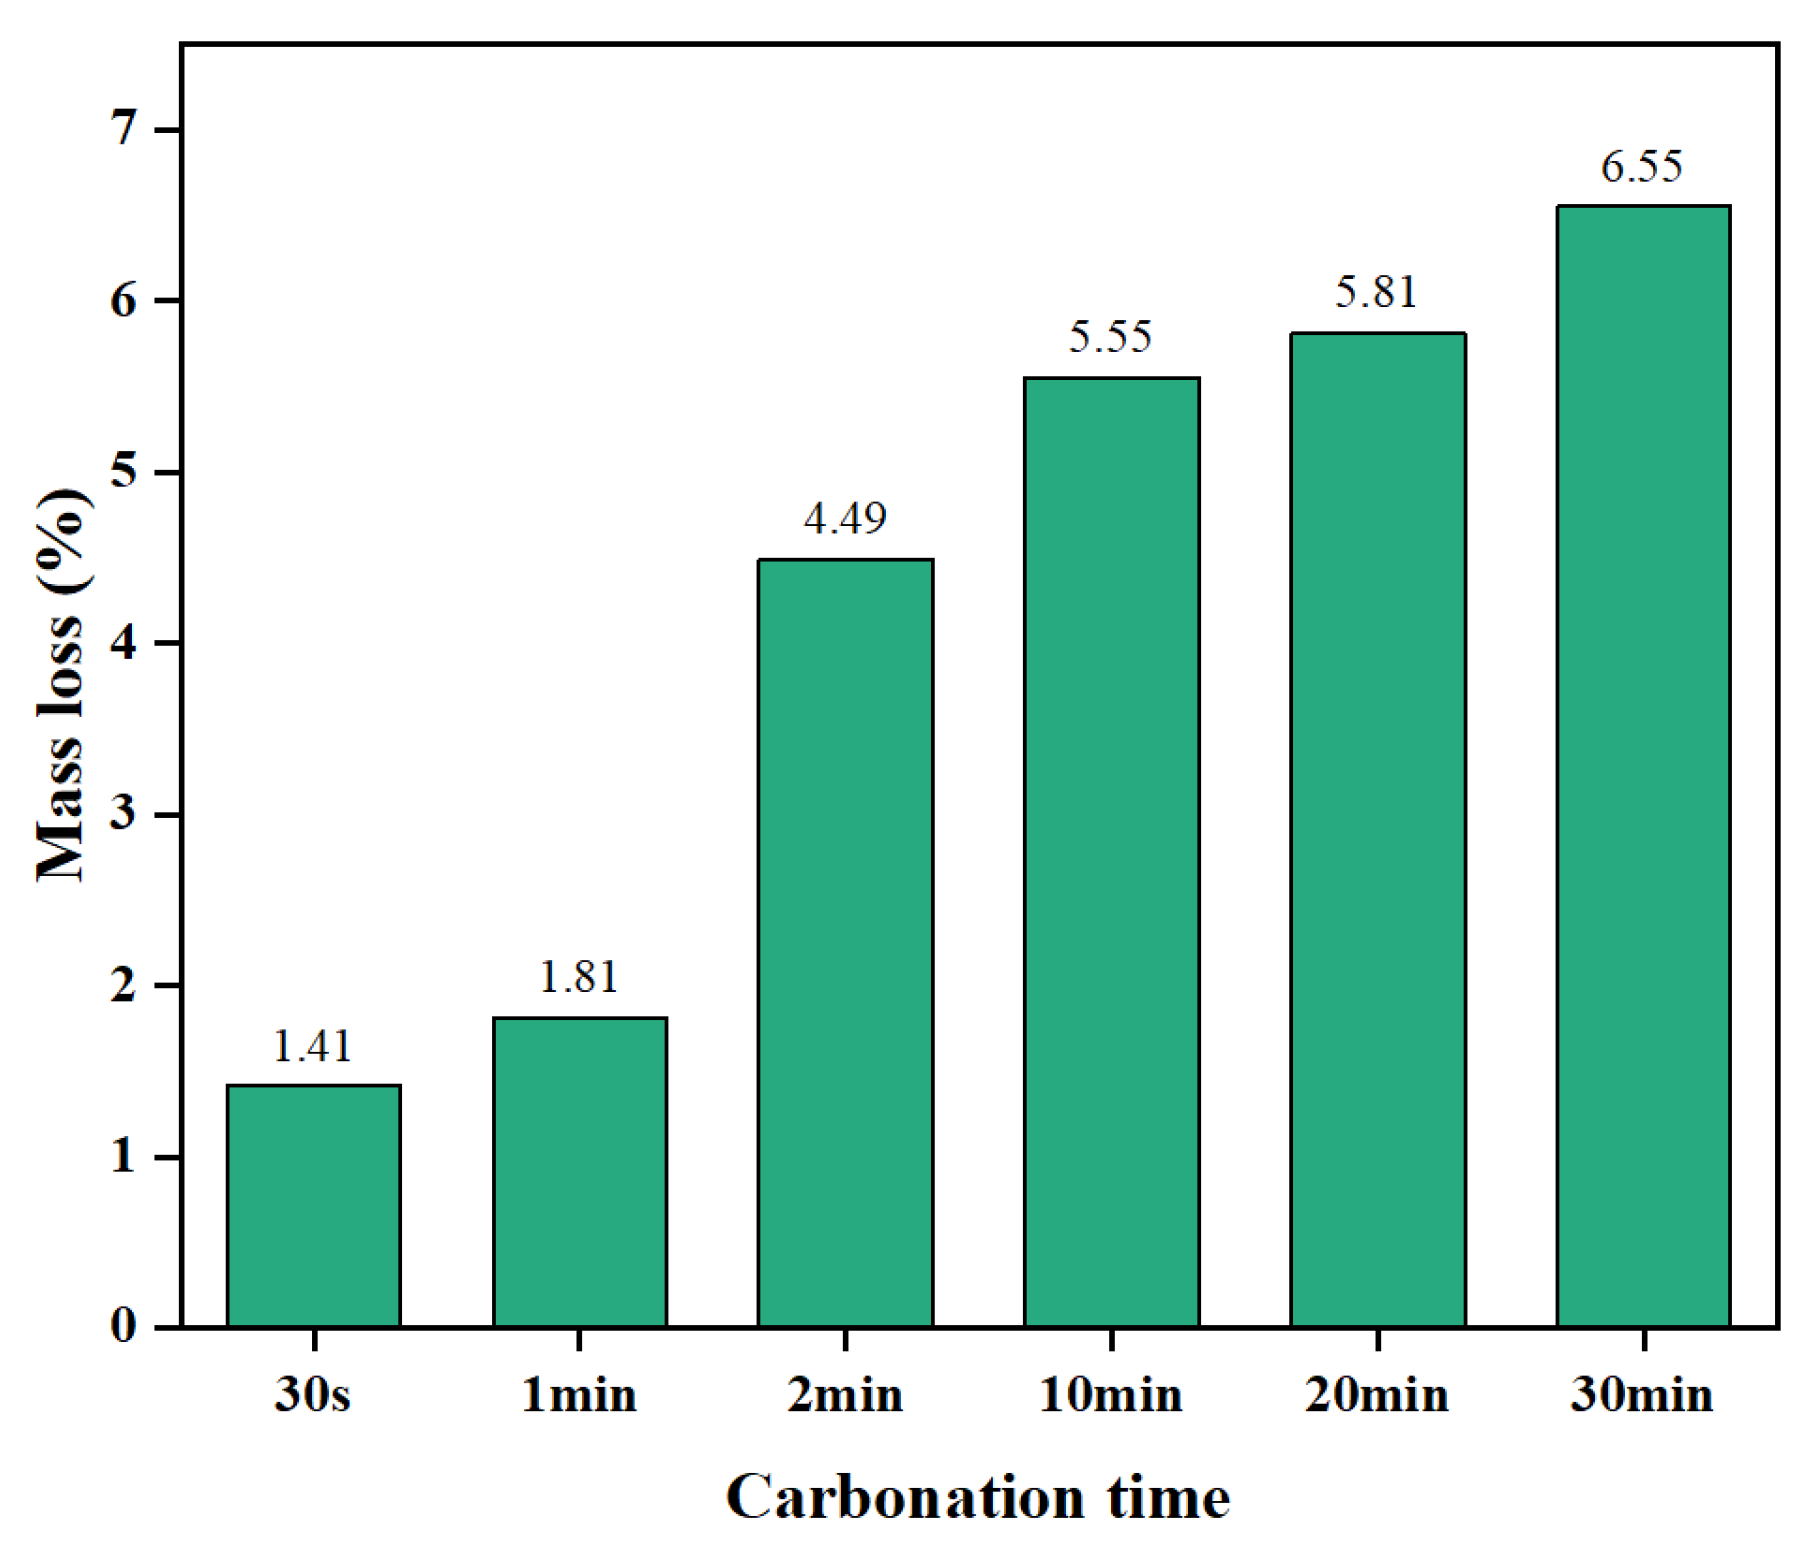
3.4. TGA Analysis
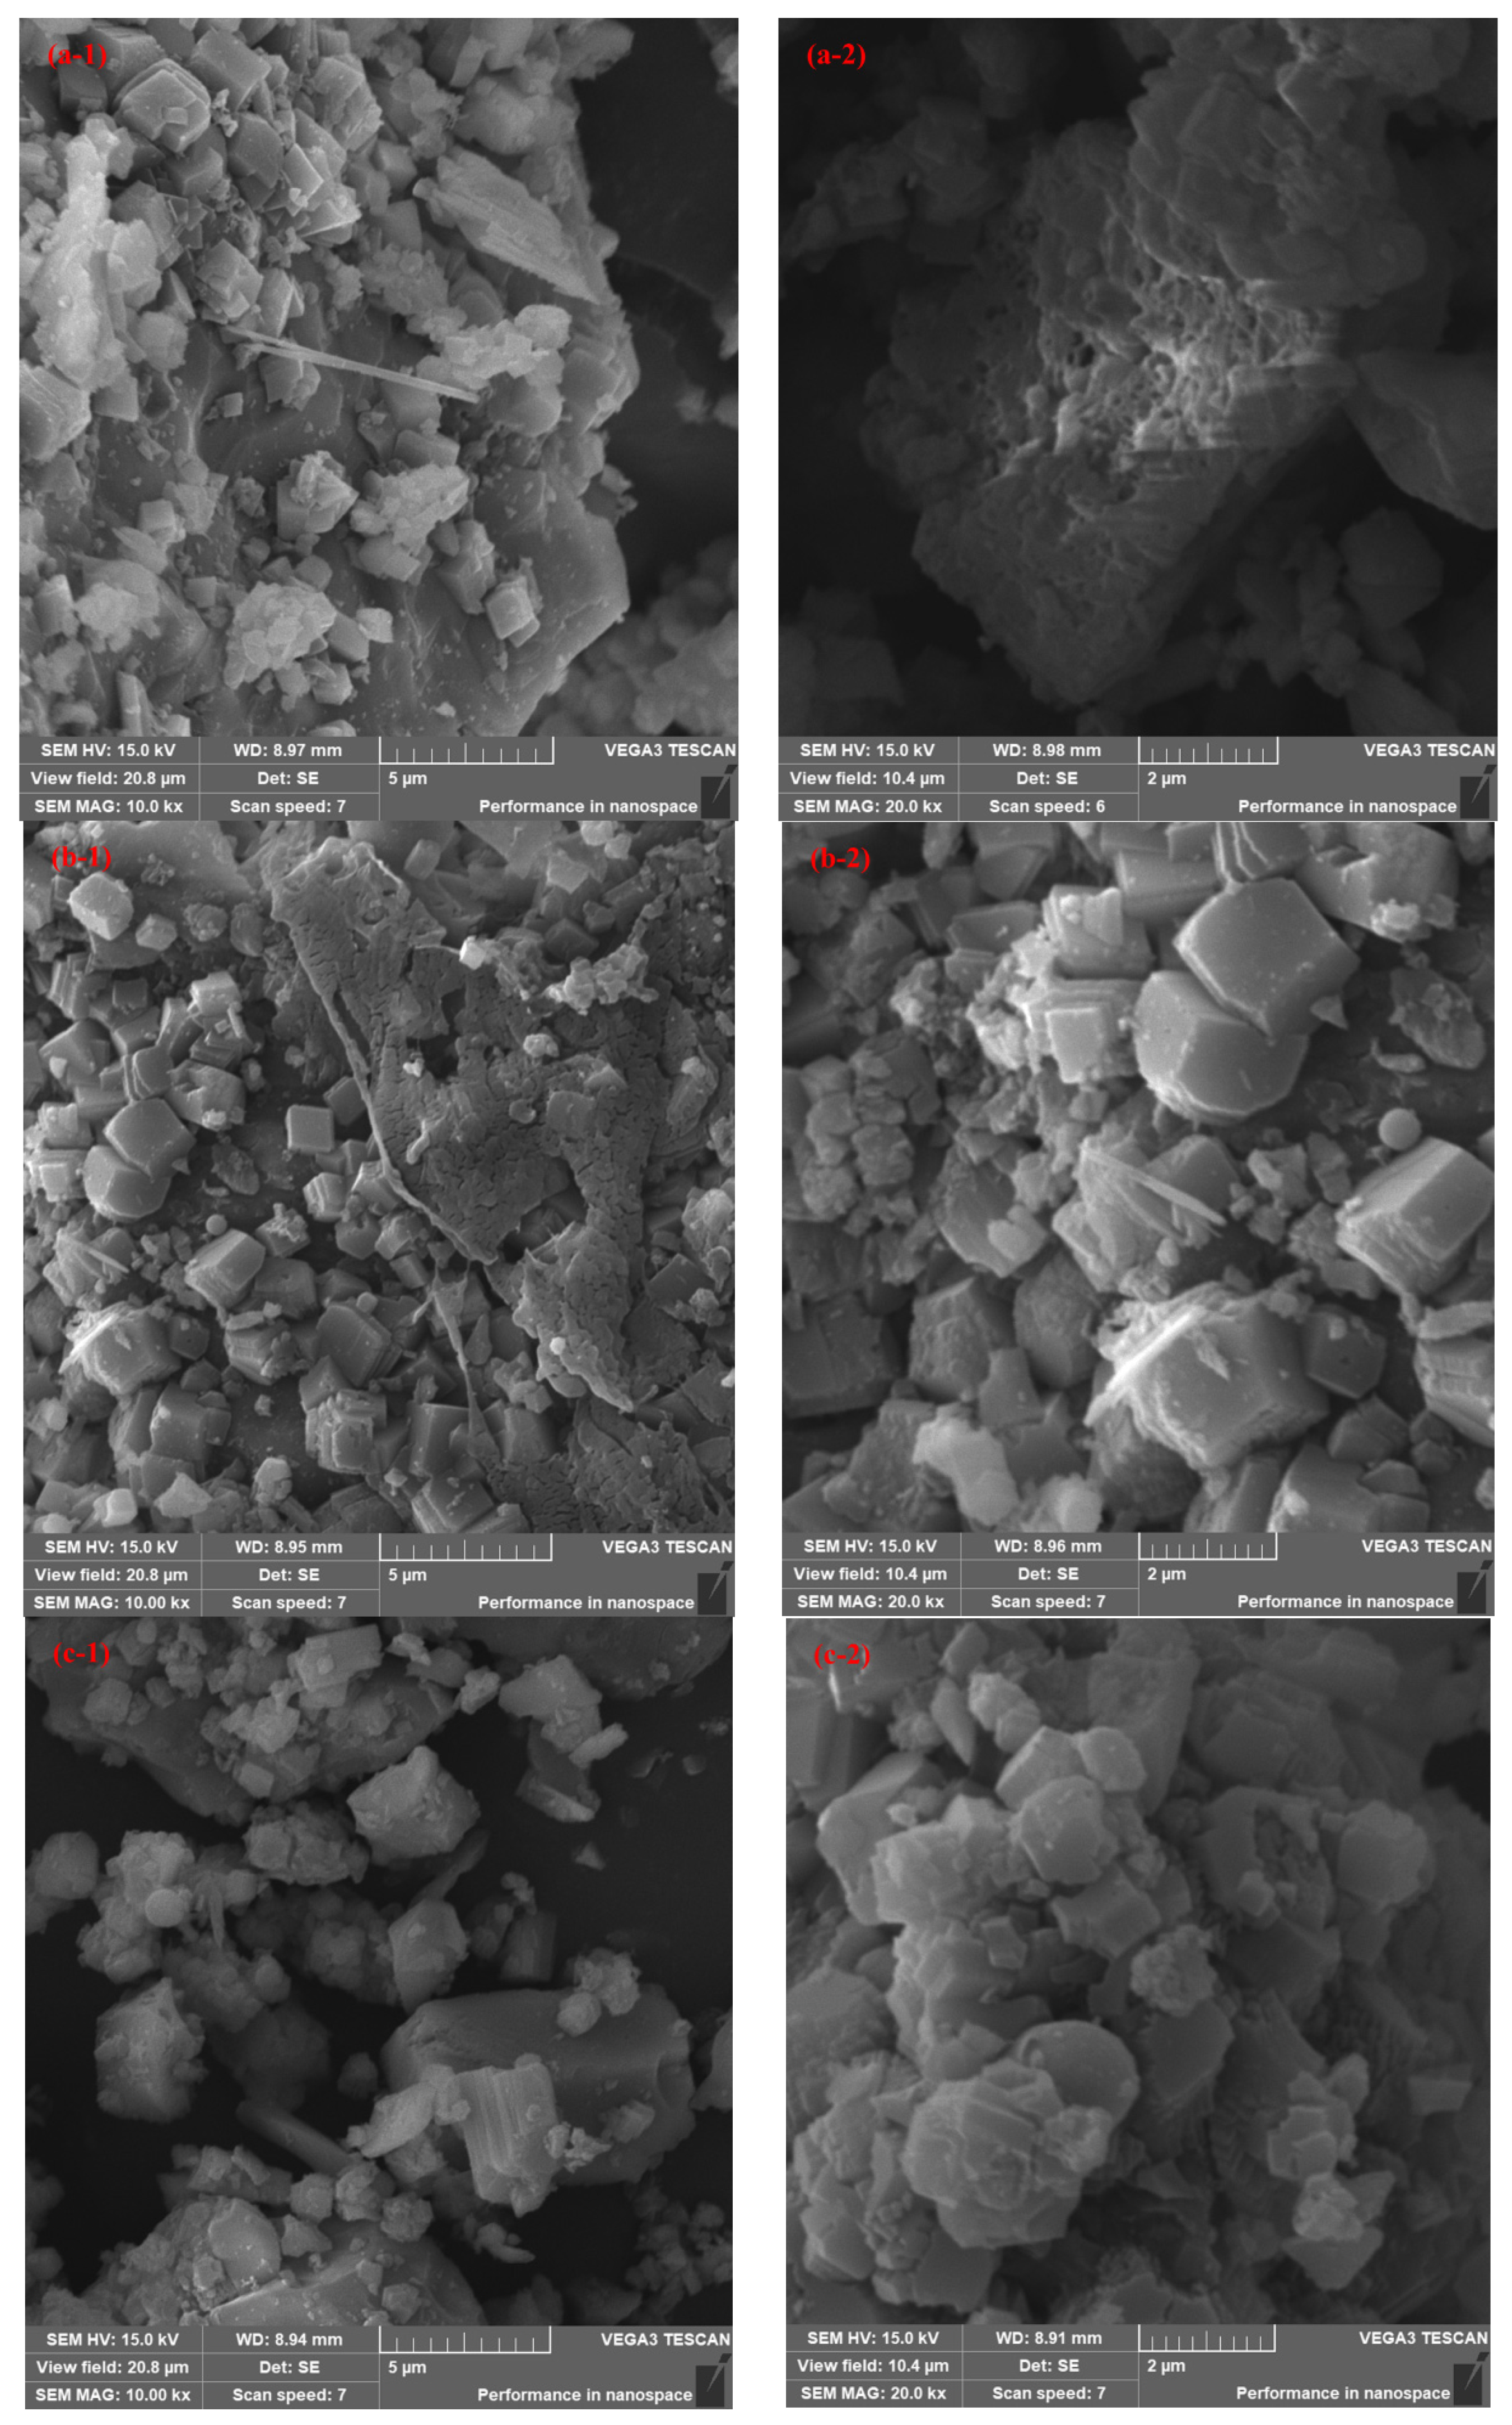
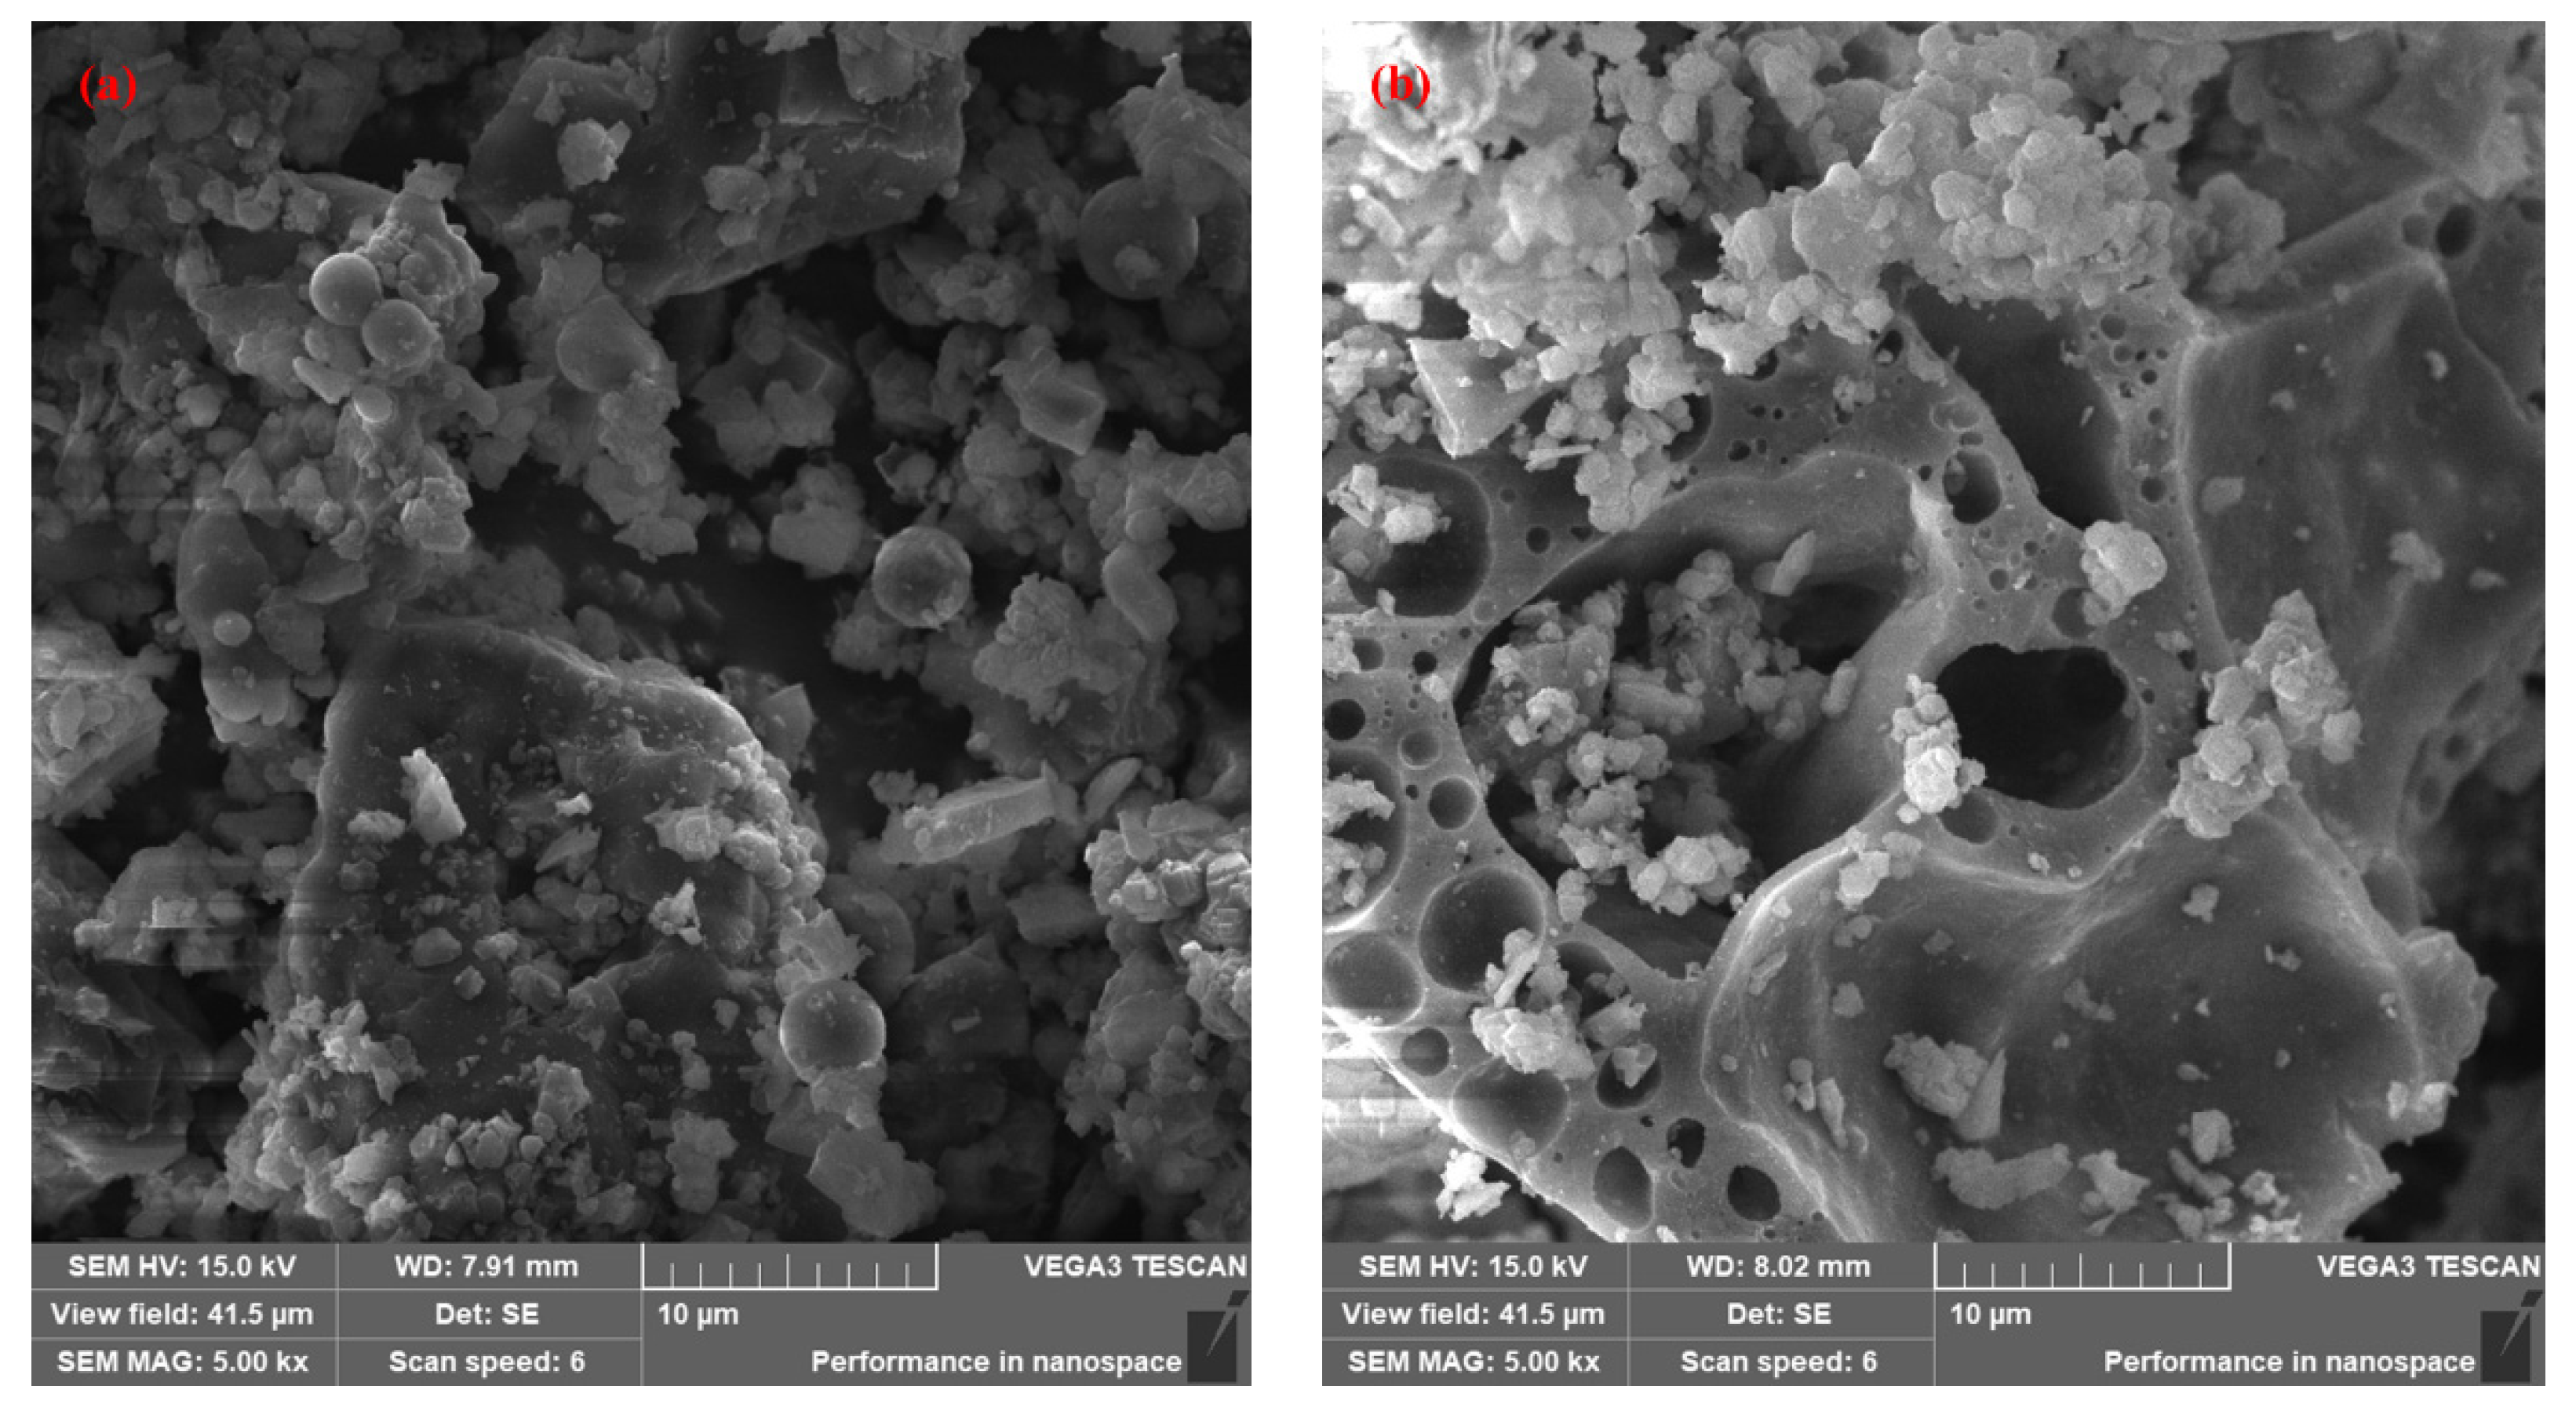
3.5. SEM Analysis
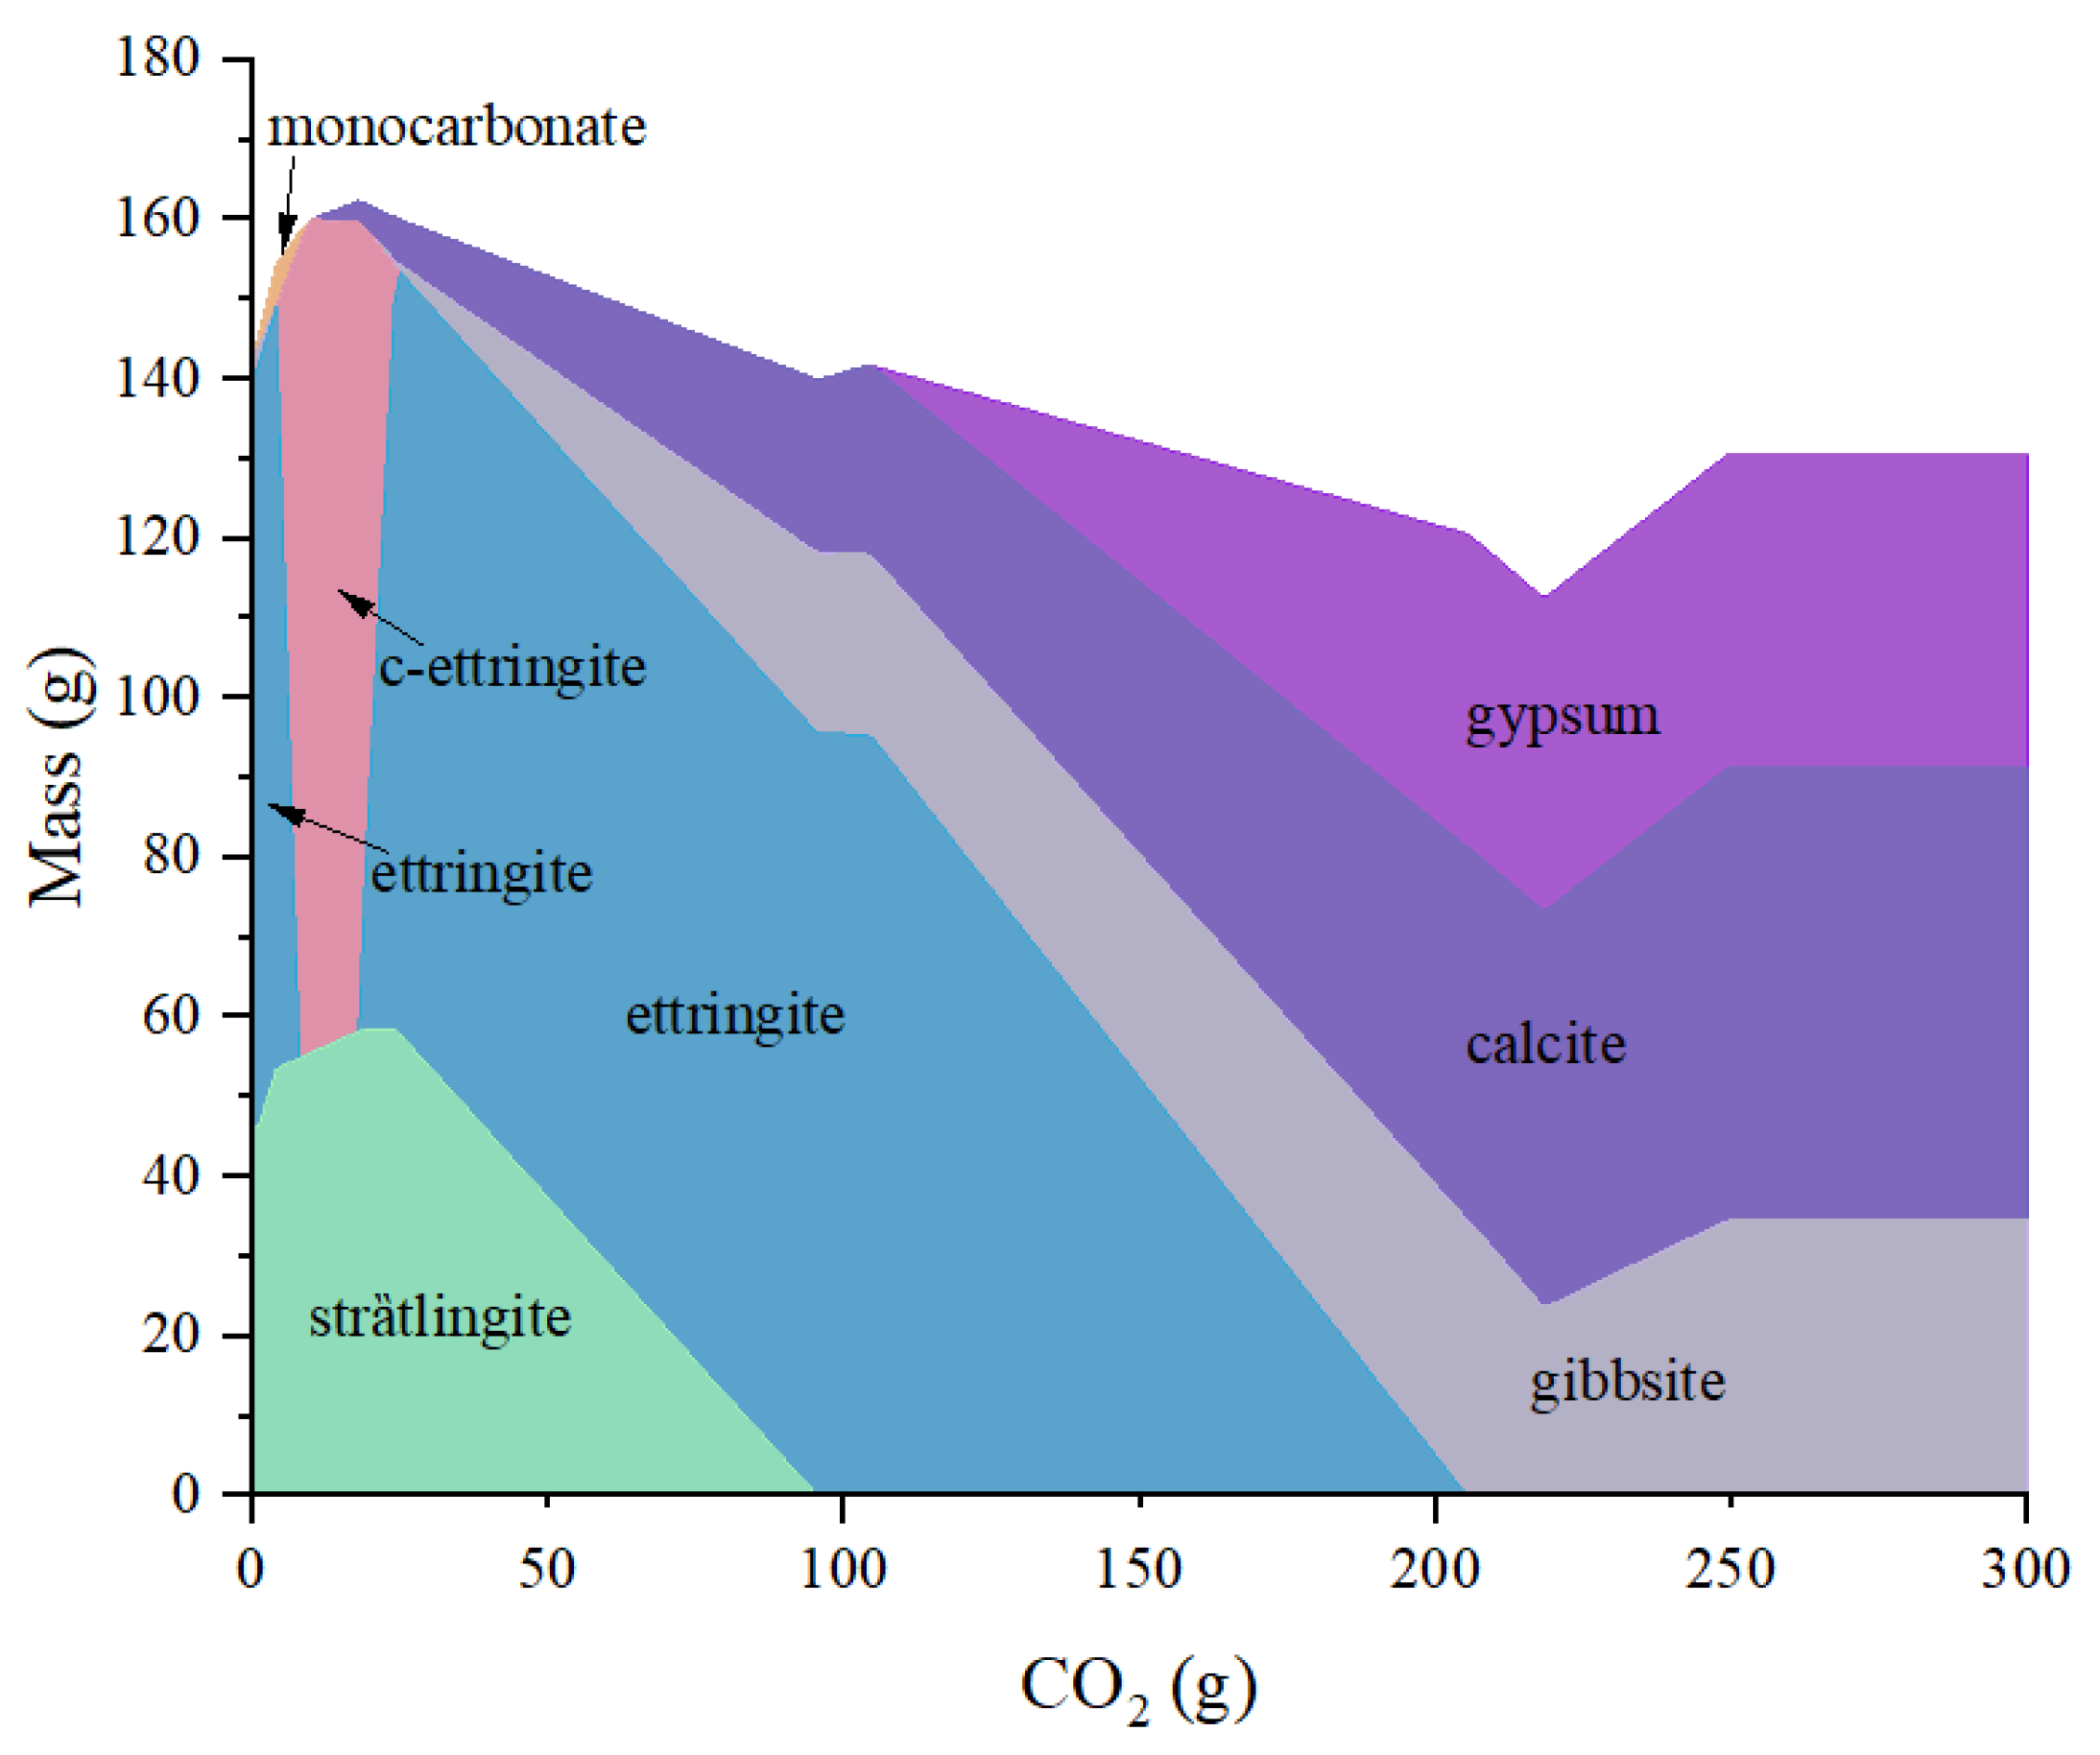
3.6. GEMS Analysis
4. Conclusions
- (1)
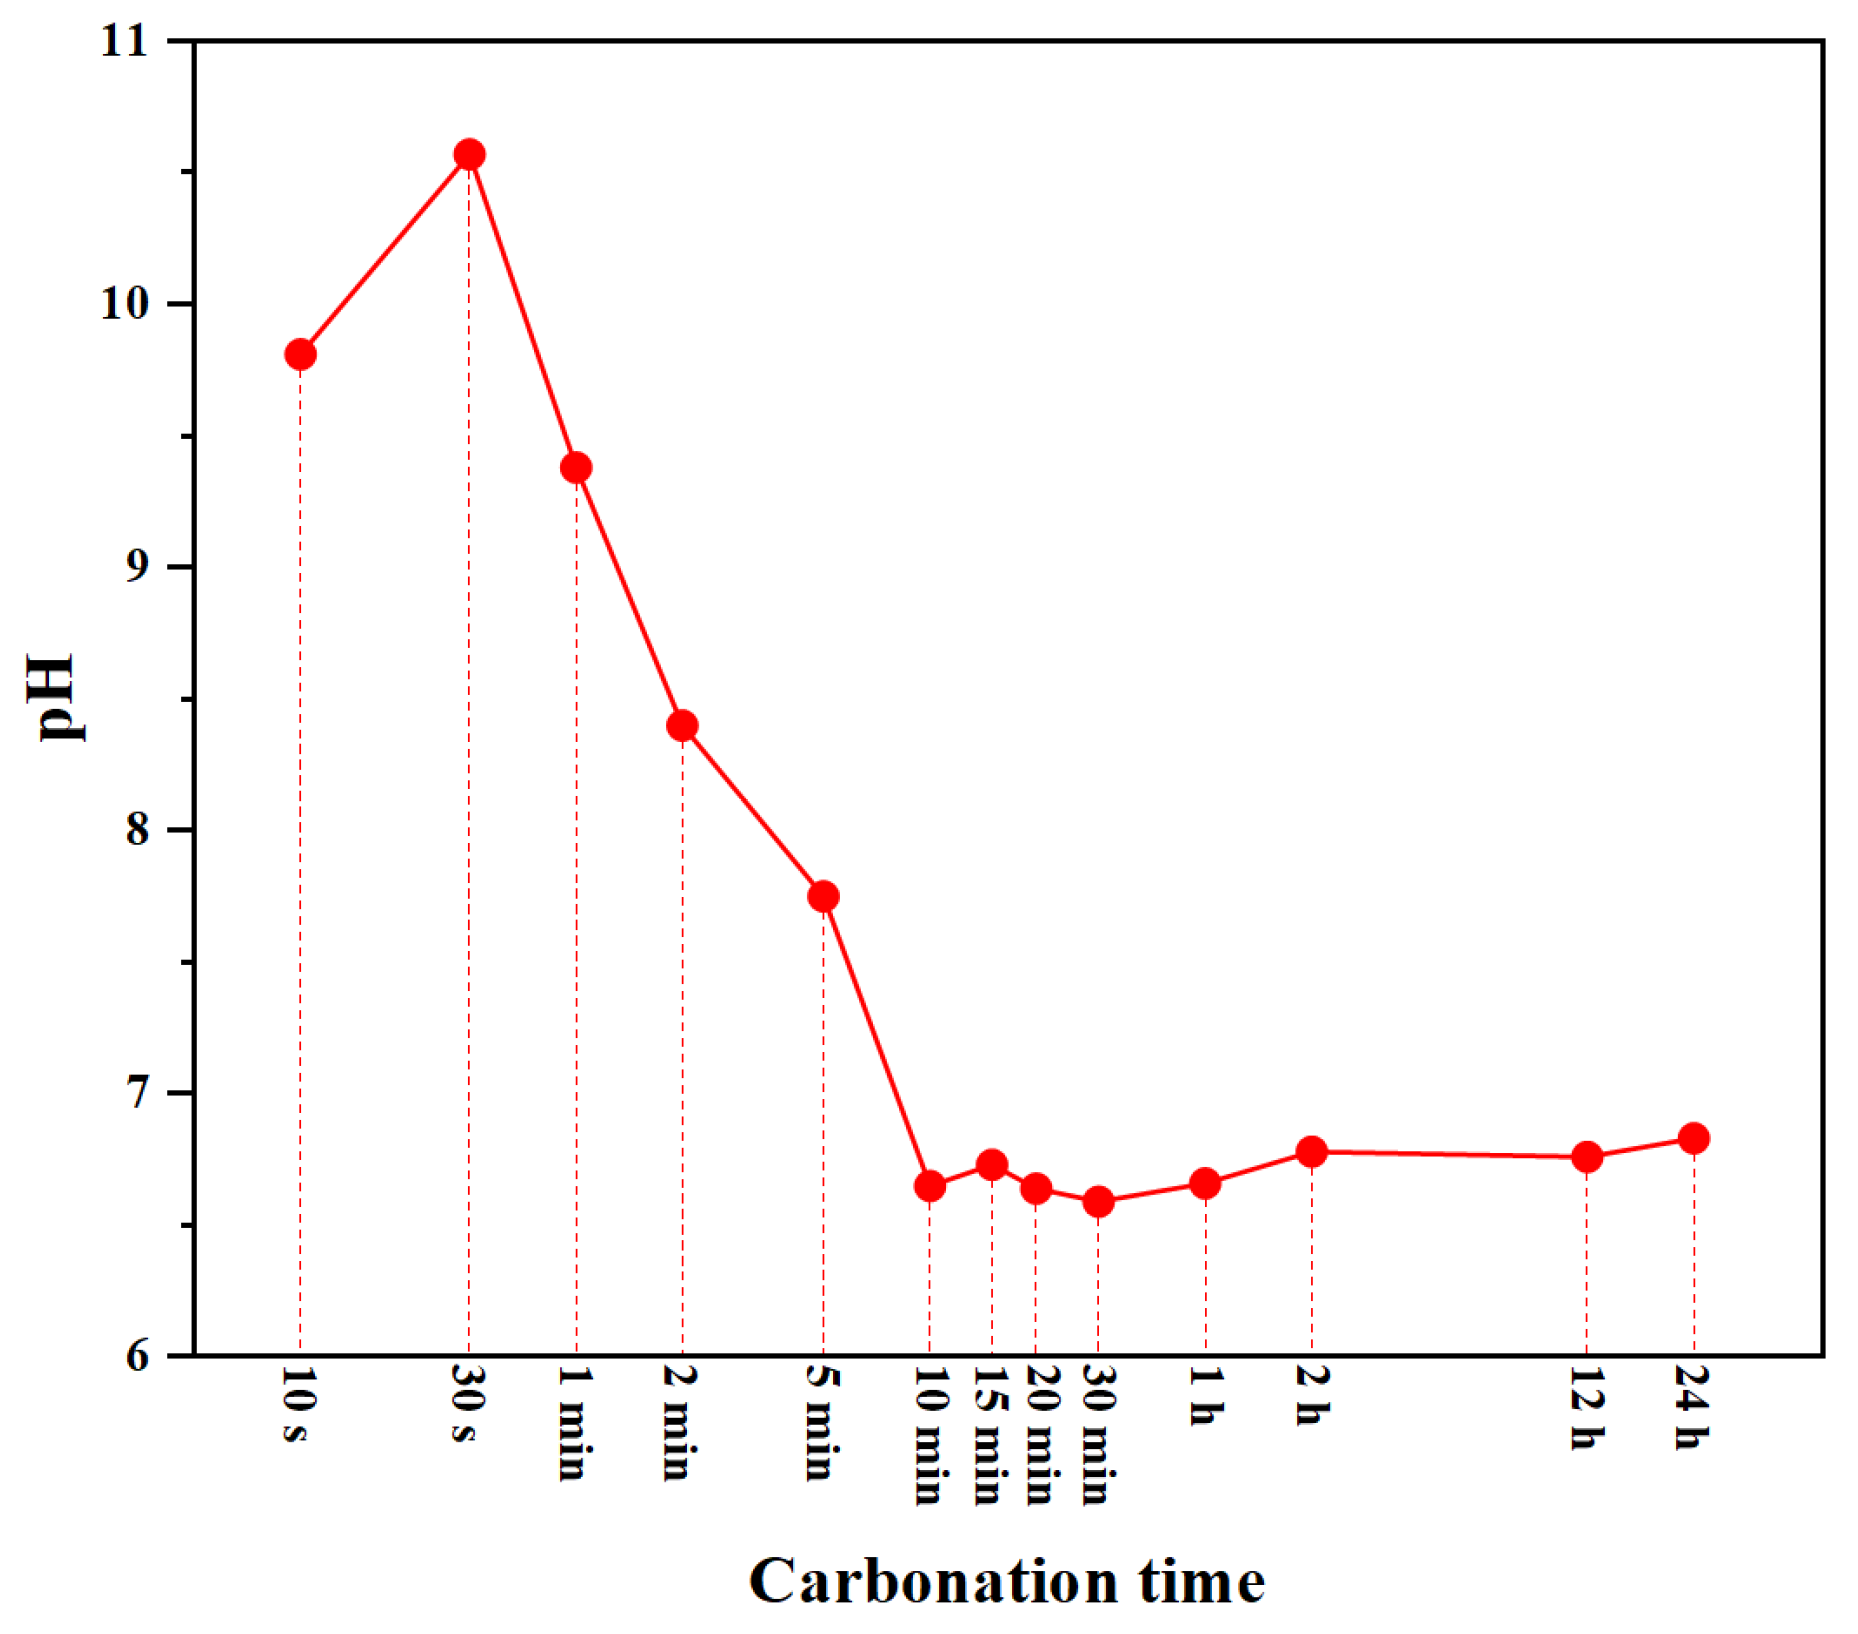
- The pH value changed, showing an increased trend first and a rapid decrease later owing to the carbonation reaction. The slight increase in pH revealed the coupling interaction of the hydration and carbonation reactions in the solution. Ultimately, the pH of the solution was constantly below 7.
- (2)
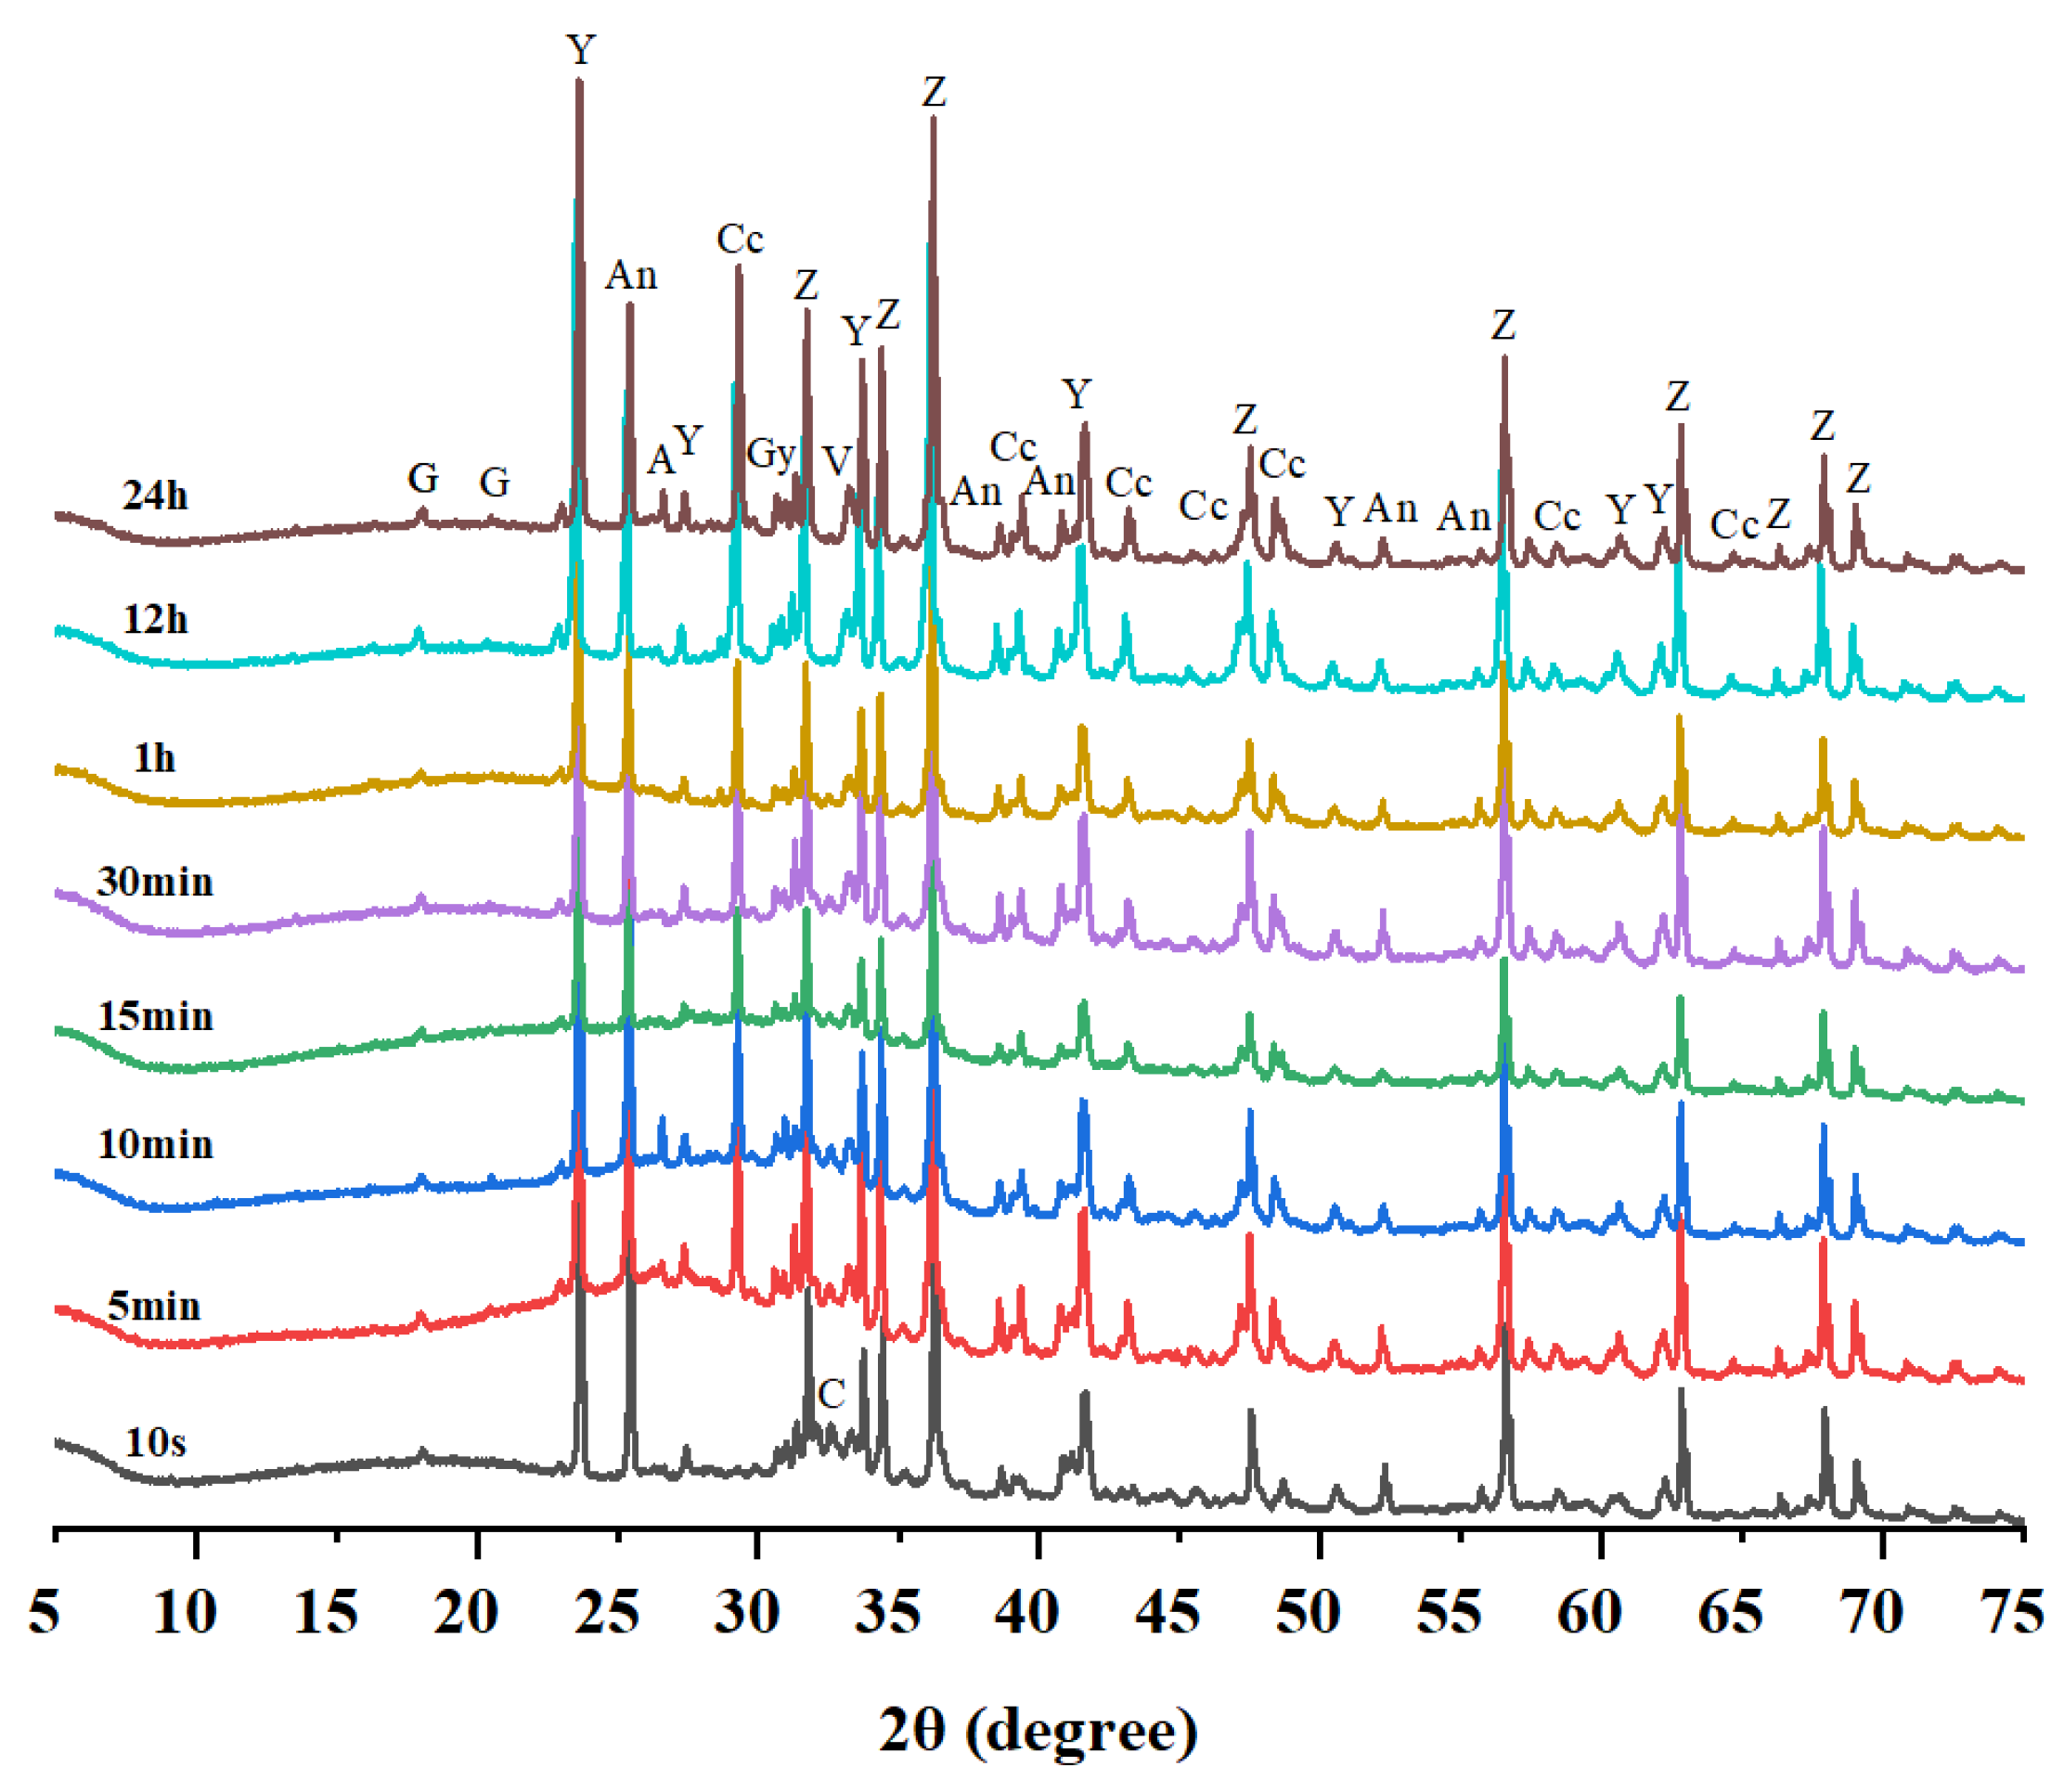
- Ettringite, as a main hydration product of C4A3Š, was not detected throughout the entire carbonation process. This was probably attributed to its immediate carbonation in the solution once formed. The carbonation of ettringite led to the generation of gypsum that would react with C4A3Š. Consequently, the presence of gypsum was sourced from two parts: One was a composition of CSA cement, and the other was a carbonation product of ettringite.
- (3)
- The main carbonation product was calcium carbonate, either from the carbonation of ettringite or the hydration product of C2S. At an early carbonation time, calcite would not generate, and aragonite and vaterite existed predominantly. After 5 min, calcite was generated and showed an obvious increase in number. Furthermore, with the increasing carbonation time, the content of calcium carbonate increased dramatically until C2S was completely carbonated.
- (4)
- After carbonation for 24 h, C4A3Š still existed in the solution, and C2S was entirely consumed, which further confirmed that C2S was easier to be carbonated.
- (5)
- Thermodynamic modeling of CSA cement further suggested the carbonation of ettringite, and the generation of carbon–ettringite was likely to occur. Also, a small amount of monosulfate probably existed after hydration, and the carbonation of monosulfate would lead to the generation of monocarbonate. The final carbonation products mainly included gypsum, aluminum hydroxide and calcium carbonate.
Author Contributions
Funding
Data Availability Statement
Conflicts of Interest
References
- Shen, L.; Gao, T.; Zhao, J.; Wang, L.; Liu, L.; Chen, F.; Xue, J. Factory-level measurements on CO2 emission factors of cement production in China. Renew. Sustain. Energy Rev. 2014, 34, 337–349. [Google Scholar] [CrossRef]
- Habert, G.; Miller, S.A.; John, V.M.; Provis, J.L.; Favier, A.; Horvath, A.; Scrivener, K.L. Environmental impacts and decarbonization strategies in the cement and concrete industries. Nat. Rev. Earth Environ. 2020, 1, 559–573. [Google Scholar] [CrossRef]
- Habert, G. Environmental impact of Portland cement production. In Eco-Efficient Concrete; Woodhead Publishing: Sawston, UK, 2013; pp. 3–25. [Google Scholar]
- Monteiro, N.B.R.; Moita Neto, J.M.; da Silva, E.A. Environmental assessment in concrete industries. J. Clean. Prod. 2021, 327, 129516. [Google Scholar] [CrossRef]
- Li, Q.; Chen, Z.A.; Zhang, J.T.; Liu, L.C.; Li, X.C.; Jia, L. Positioning and revision of CCUS technology development in China. Int. J. Greenh. Gas Control 2016, 46, 282–293. [Google Scholar] [CrossRef]
- Plaza, M.G.; Martínez, S.; Rubiera, F. CO2 Capture, Use, and Storage in the Cement Industry: State of the Art and Expectations. Energies 2020, 13, 5692. [Google Scholar] [CrossRef]
- Hargis, C.W.; Chen, I.A.; Devenney, M.; Fernandez, M.J.; Gilliam, R.J.; Thatcher, R.P. Calcium Carbonate Cement: A Carbon Capture, Utilization, and Storage (CCUS) Technique. Materials 2021, 14, 2709. [Google Scholar] [CrossRef]
- Monteiro, J.; Roussanaly, S. CCUS scenarios for the cement industry: Is CO2 utilization feasible? J. CO2 Util. 2022, 61, 102015. [Google Scholar] [CrossRef]
- Shi, C.; Jiménez, A.F.; Palomo, A. New cements for the 21st century: The pursuit of an alternative to Portland cement. Cem. Concr. Res. 2011, 41, 750–763. [Google Scholar] [CrossRef]
- Hanein, T.; Galvez-Martos, J.-L.; Bannerman, M.N. Carbon footprint of calcium sulfoaluminate clinker production. J. Clean. Prod. 2018, 172, 2278–2287. [Google Scholar] [CrossRef]
- Tao, Y.; Rahul, A.V.; Mohan, M.K.; De Schutter, G.; Van Tittelboom, K. Recent progress and technical challenges in using calcium sulfoaluminate (CSA) cement. Cem. Concr. Compos. 2023, 137, 104908. [Google Scholar] [CrossRef]
- Glasser, F.P.; Zhang, L. High-performance cement matrices based on calcium sulfoaluminate–belite compositions. Cem. Concr. Res. 2001, 31, 1881–1886. [Google Scholar] [CrossRef]
- Naik, T.P. Sustainability of concrete construction. Pract. Period. Struct. Des. Constr. 2008, 13, 98–103. [Google Scholar] [CrossRef]
- Mo, F.; Li, B.; Li, M.; Fang, Z.; Fang, S.; Jiang, H. Rapid-Hardening and High-Strength Steel-Fiber-Reinforced Concrete: Effects of Curing Ages and Strain Rates on Compressive Performance. Materials 2023, 16, 4947. [Google Scholar] [CrossRef] [PubMed]
- Zhang, L.; Glasser, F.P. Investigation of the microstructure and carbonation of CŠA-based concretes removed from service. Cem. Concr. Res. 2005, 35, 2252–2260. [Google Scholar] [CrossRef]
- Hargis, C.W.; Lothenbach, B.; Müller, C.J.; Winnefeld, F. Carbonation of calcium sulfoaluminate mortars. Cem. Concr. Compos. 2017, 80, 123–134. [Google Scholar] [CrossRef]
- Ansari, W.S.; Chang, J.; ur Rehman, Z.U.; Nawaz, U.; Junaid, M.F. A novel approach to improve carbonation resistance of Calcium Sulfoaluminate cement by assimilating fine cement-sand mix. Constr. Build. Mater. 2022, 317, 125598. [Google Scholar] [CrossRef]
- Sharma, R.; Kim, H.; Lee, N.K.; Park, J.-J.; Jang, J.G. Microstructural characteristics and CO2 uptake of calcium sulfoaluminate cement by carbonation curing at different water-to-cement ratios. Cem. Concr. Res. 2023, 163, 107012. [Google Scholar] [CrossRef]
- Gastaldi, D.; Bertola, F.; Canonico, F.; Buzzi, L.; Mutke, S.; Irico, S.; Paul, G.; Marchese, L.; Boccaleri, E. A chemical/mineralogical investigation of the behavior of sulfoaluminate binders submitted to accelerated carbonation. Cem. Concr. Res. 2018, 109, 30–41. [Google Scholar] [CrossRef]
- Seo, J.; Yoon, H.N.; Kim, S.; Wang, Z.; Kil, T.; Lee, H.K. Characterization of reactive MgO-modified calcium sulfoaluminate cements upon carbonation. Cem. Concr. Res. 2021, 146, 106484. [Google Scholar] [CrossRef]
- Bertola, F.; Gastaldi, D.; Irico, S.; Paul, G.; Canonico, F. Influence of the amount of calcium sulfate on physical/mineralogical properties and carbonation resistance of CSA-based cements. Cem. Concr. Res. 2022, 151, 106634. [Google Scholar] [CrossRef]
- Mechling, J.-M.; Lecomte, A.; Roux, A.; Le Rolland, B. Sulfoaluminate cement behaviours in carbon dioxide, warm and moist environments. Adv. Cem. Res. 2014, 26, 52–61. [Google Scholar] [CrossRef]
- Seo, J.; Kim, S.; Park, S.; Yoon, H.N.; Lee, H.-K. Carbonation of calcium sulfoaluminate cement blended with blast furnace slag. Cem. Concr. Compos. 2021, 118, 103918. [Google Scholar] [CrossRef]
- Ho, H.-J.; Iizuka, A.; Shibata, E.; Tomita, H.; Takano, K.; Endo, T. CO2 Utilization via Direct Aqueous Carbonation of Synthesized Concrete Fines under Atmospheric Pressure. ACS Omega 2020, 5, 15877–15890. [Google Scholar] [CrossRef]
- Ben Ghacham, A.; Pasquier, L.-C.; Cecchi, E.; Blais, J.-F.; Mercier, G. Valorization of waste concrete through CO2 mineral carbonation: Optimizing parameters and improving reactivity using concrete separation. J. Clean. Prod. 2017, 166, 869–878. [Google Scholar] [CrossRef]
- Fang, X.; Xuan, D.; Shen, P.; Poon, C.S. Fast enhancement of recycled fine aggregates properties by wet carbonation. J. Clean. Prod. 2021, 313, 127867. [Google Scholar] [CrossRef]
- Shen, P.; Zhang, Y.; Jiang, Y.; Zhan, B.; Lu, J.; Zhang, S.; Xuan, D.; Poon, C.S. Phase assemblance evolution during wet carbonation of recycled concrete fines. Cem. Concr. Res. 2022, 154, 106733. [Google Scholar] [CrossRef]
- Scrivener, K.; Snellings, R.; Lothenbach, B. (Eds.) A Practical Guide to Microstructural Analysis of Cementitious Materials; CRC Press: Boca Raton, FL, USA, 2018. [Google Scholar]
- Zhang, Y.; Zhao, Q.; Gao, Z.; Chang, J. Nanostructural evolution of Al(OH)3 gel formed by the cubic and orthorhombic ye’elimite clinkers of calcium sulfoaluminate cements in an ultra-wide hydration temperature range. Cem. Concr. Res. 2021, 150, 106607. [Google Scholar] [CrossRef]
- Wang, D.; Fang, Y.; Zhang, Y.; Chang, J. Changes in mineral composition, growth of calcite crystal, and promotion of physico-chemical properties induced by carbonation of β-C2S. J. CO2 Util. 2019, 34, 149–162. [Google Scholar] [CrossRef]
- Li, H.; Liu, Y.; Lu, J.; Zhao, W.; Moeen, M.; Guan, X.; Zhu, J. Role of the structure of synthetic Al(OH)3 on the properties of sulfoaluminate cement-based materials. Cem. Concr. Res. 2023, 174, 107330. [Google Scholar] [CrossRef]
- Jiang, T.; Cui, K.; Chang, J. Development of low-carbon cement: Carbonation of compounded C2S by β-C2S and γ-C2S. Cem. Concr. Compos. 2023, 139, 105071. [Google Scholar] [CrossRef]
- Zajac, M.; Skocek, J.; Bullerjahn, F.; Haha, M.B. Effect of retarders on the early hydration of calcium-sulpho-aluminate (CSA) type cements. Cem. Concr. Res. 2016, 84, 62–75. [Google Scholar] [CrossRef]
- Seo, J.; Kim, S.; Yoon, H.N.; Lee, H.K. Effect of the molar ratio of calcium sulfate over ye’elimite on the reaction of CSA cement/slag blends under an accelerated carbonation condition. J. Build. Eng. 2022, 46, 103785. [Google Scholar] [CrossRef]
- Song, F.; Yu, Z.; Yang, F.; Liu, Y.; Lu, Y. Strätlingite and calcium hemicarboaluminate hydrate in belite-calcium sulphoaluminate cement. Ceram. Silik. 2014, 58, 269–274. [Google Scholar]
- Singh, N. Hydrothermal synthesis of β-dicalcium silicate (β-Ca2SiO4). Prog. Cryst. Growth Charact. Mater. 2006, 52, 77–83. [Google Scholar] [CrossRef]
- Zhang, Y.; Chang, J.; Ji, J. AH3 phase in the hydration product system of AFt-AFm-AH3 in calcium sulfoaluminate cements: A microstructural study. Constr. Build. Mater. 2018, 167, 587–596. [Google Scholar] [CrossRef]
- Wang, X.; Pan, Z.; Shen, X.; Liu, W. Stability and decomposition mechanism of ettringite in presence of ammonium sulfate solution. Constr. Build. Mater. 2016, 124, 786–793. [Google Scholar] [CrossRef]
- Kim, H.; Pei, J.; Siddique, S.; Jang, J. Effects of the curing conditions on the carbonation curing efficiency of ordinary Portland cement and a belite-rich cement mortar. Sustainability 2021, 13, 5175. [Google Scholar] [CrossRef]
- Dos Santos, V.H.J.M.; Pontin, D.; Ponzi, G.G.D.; e Stepanha, A.S.D.G.; Martel, R.B.; Schütz, M.K.; Einloft, S.M.O.; Dalla, F. Application of Fourier Transform infrared spectroscopy (FTIR) coupled with multivariate regression for calcium carbonate (CaCO3) quantification in cement. Constr. Build. Mater. 2021, 313, 125413. [Google Scholar] [CrossRef]
- Timón, V.; Torrens-Martin, D.; Fernández-Carrasco, L.J.; Martínez-Ramírez, S. Infrared and Raman vibrational modelling of β-C2S and C3S compounds. Cem. Concr. Res. 2023, 169, 107162. [Google Scholar] [CrossRef]
- Hughes, T.L.; Methven, C.M.; Jones, T.G.; Pelham, S.E.; Fletcher, P.; Hall, C. Determining cement composition by Fourier transform infrared spectroscopy. Adv. Cem. Based Mater. 1995, 2, 91–104. [Google Scholar] [CrossRef]
- Chang, J.; Jiang, T.; Cui, K. Influence on compressive strength and CO2 capture after accelerated carbonation of combination β-C2S with γ-C2S. Constr. Build. Mater. 2021, 312, 125359. [Google Scholar] [CrossRef]
- Torréns-Martín, D.; Fernández-Carrasco, L.; Martínez-Ramírez, S. Hydration of calcium aluminates and calcium sulfoaluminate studied by Raman spectroscopy. Cem. Concr. Res. 2013, 47, 43–50. [Google Scholar] [CrossRef]
- Chang, X.; Liu, S.; Zhang, C.; Shen, P.; Xuan, D.; Guan, X.; Shi, C. Carbonation-hardening properties and ITZ microstructure of low-calcium CO2 sequestration binder mortar. Constr. Build. Mater. 2022, 336, 127589. [Google Scholar] [CrossRef]
- Chang, J.; Fang, Y. Quantitative analysis of accelerated carbonation products of the synthetic calcium silicate hydrate (C–S–H) by QXRD and TG/MS. J. Therm. Anal. Calorim. 2015, 119, 57–62. [Google Scholar] [CrossRef]
- Pelletier, L.; Winnefeld, F.; Lothenbach, B. The ternary system Portland cement–calcium sulphoaluminate clinker–anhydrite: Hydration mechanism and mortar properties. Cem. Concr. Compos. 2010, 32, 497–507. [Google Scholar] [CrossRef]


| Mineral Phase | wt.% |
|---|---|
| Ye’elimite (C4A3Š) | 38.52 |
| Belite (C2S) | 24.23 |
| Anhydrite (CŠ) | 20.78 |
| Brownmillerite (C4AF) | 8.56 |
| Mayenite (C12A7) | 2.91 |
| Gypsum (CŠH2) | 2.40 |
| Quartz (SiO2) | 2.59 |
| 10 s | 5 min | 10 min | 15 min | 30 min | 1 h | 12 h | 24 h | |
|---|---|---|---|---|---|---|---|---|
| C4A3Š | 33.80 | 27.36 | 24.29 | 25.54 | 26.42 | 28.64 | 28.60 | 26.99 |
| C2S | 23.78 | 21.04 | 23.79 | 23.56 | 16.59 | 1.58 | 0.82 | 0.18 |
| Anhydrite | 13.72 | 14.95 | 14.38 | 14.38 | 11.76 | 11.31 | 10.87 | 9.69 |
| Gypsum | 5.90 | 5.97 | 5.98 | 7.04 | 5.11 | 4.42 | 5.36 | 5.92 |
| Calcite | - | 13.08 | 15.31 | 13.58 | 9.69 | 10.92 | 15.64 | 14.49 |
| Vaterite | - | 7.03 | 6.13 | 4.90 | 0.92 | 1.51 | 1.09 | 3.04 |
| Aragonite | - | 0.90 | 2.66 | - | - | - | - | 0.42 |
| Gibbsite | 3.83 | 1.90 | 0.51 | 0.21 | 5.21 | 11.00 | 3.79 | 0.77 |
| Amor. | 18.96 | 7.77 | 6.94 | 10.78 | 24.30 | 30.61 | 33.85 | 38.53 |
| Rwp (%) | 8.74 | 10.98 | 9.68 | 6.32 | 7.99 | 9.83 | 8.17 | 9.61 |
Disclaimer/Publisher’s Note: The statements, opinions and data contained in all publications are solely those of the individual author(s) and contributor(s) and not of MDPI and/or the editor(s). MDPI and/or the editor(s) disclaim responsibility for any injury to people or property resulting from any ideas, methods, instructions or products referred to in the content. |
© 2024 by the authors. Licensee MDPI, Basel, Switzerland. This article is an open access article distributed under the terms and conditions of the Creative Commons Attribution (CC BY) license (https://creativecommons.org/licenses/by/4.0/).
Share and Cite
Zhang, Y.; Yang, H.; Zhang, Q.; Qian, Q.; Zhang, C.; Wu, K.; Shen, P. Microstructural Evolution of Calcium Sulfoaluminate Cement during the Wet-Carbonation Process. Buildings 2024, 14, 343. https://doi.org/10.3390/buildings14020343
Zhang Y, Yang H, Zhang Q, Qian Q, Zhang C, Wu K, Shen P. Microstructural Evolution of Calcium Sulfoaluminate Cement during the Wet-Carbonation Process. Buildings. 2024; 14(2):343. https://doi.org/10.3390/buildings14020343
Chicago/Turabian StyleZhang, Yangyang, Hang Yang, Qunli Zhang, Quan Qian, Chengwei Zhang, Kai Wu, and Peiliang Shen. 2024. "Microstructural Evolution of Calcium Sulfoaluminate Cement during the Wet-Carbonation Process" Buildings 14, no. 2: 343. https://doi.org/10.3390/buildings14020343