
Criticality-Based Management of Facility Assets


College of Engineering, Imam Abdulrahman Bin Faisal University, Dammam 34211, Saudi Arabia
Buildings 2024, 14(2), 339; https://doi.org/10.3390/buildings14020339
Submission received: 5 December 2023
/
Revised: 4 January 2024
/
Accepted: 23 January 2024
/
Published: 25 January 2024
(This article belongs to the Topic Development of Monitoring, Analysis and Maintenance Technics of Infrastructures)
Abstract
:Effective facility asset management requires specific skills and tools to optimize the use of limited resources, making a decision support system essential. This research introduces a comprehensive decision support system, which is a framework organized into three models: the criticality model, the rehabilitation model, and the optimum criticality model to manage the rehabilitation of facility assets. The criticality model utilizes the Analytical Hierarchy Process (AHP) to assess the group of assets. Emphasizing criticality as a central management factor, this model lays the foundation for subsequent decision-making. The rehabilitation model employs an Artificial Neural Network (ANN), integrating Customer Level of Service (CLoS), Technical Level of Service (TLoS), and asset criticality to determine appropriate rehabilitation actions. NeuralTools 7.5 is leveraged for precise predictions of rehabilitation strategies tailored to specific assets. The third model, optimum criticality, focuses on prioritizing rehabilitation activities within the constraints of limited budgets. Lingo 20.0 is utilized to optimize rehabilitation activities, considering budget limitations and other constraints, offering a strategic approach to maximize the impact of available resources. This integrated framework provides decision-makers with a systematic and data-driven approach to facility management, enhancing the efficiency and effectiveness of rehabilitation actions. An academic building was chosen as a hypothetical example to implement the three models and suggest the essential considerations for managing both the academic building itself and other infrastructure assets. The results obtained demonstrate that the principles and methodologies encapsulated in this project can be extrapolated and scaled up for application to large-scale infrastructure assets, ensuring the sustenance of the requisite level of service and the management of acceptable risk on a broader scale.
1. Introduction
Working in a facility for eight hours a day requires a healthy environment. A typical facility consists of numerous assets that provide specific services. Examples of such assets include elevators, HVAC, doors, water and wastewater systems, electrical systems, security systems, and others. A study conducted by [1] identified that 38% of variations in productivity are attributed to the workplace environment. Therefore, maintaining facility assets leads to a satisfactory experience for facility users and increases their productivity. Currently, there is no standardized system that provides an optimum maintenance program. Instead, each organization has specific practices, some of which are discussed in Section 3.1. In addition to limited resources, a major consideration is that a facility includes various asset types—mechanical, electrical, and structural—and each type encompasses several individual assets. These assets vary in sizes, shapes, capacities, and locations, necessitating different programs throughout their life cycles. The output of any developed system should provide a straightforward solution: maintain current and future assets to deliver the required services within the constraints of limited resources. On the other hand, decision-makers overseeing infrastructure assets request billions of dollars annually to maintain their infrastructure, aiming to achieve the required level of service while minimizing risks [2]. The primary challenge in this context is the limitation of available budgets. However, it is crucial to first identify the necessary rehabilitation actions and then prioritize these actions to effectively manage the available budget. The required rehabilitation actions, categorized into five types, no action, operational, minor maintenance, major maintenance, and replacement [3], are determined and prioritized based on the consequences of failure, specifically the criticality of an asset. This research emphasizes that criticality serves as the central management basis for infrastructure assets. This study is structured into three models: the criticality model, the rehabilitation model, and the optimum criticality model. The first model aims to determine the criticality level of individual assets, considering their groupings and impacts on economic, operational, social, and environmental aspects. The Analytical Hierarchy Process (AHP) is employed to develop the criticality of assets in this model. In the second model, an Artificial Neural Network (ANN) is utilized to identify the rehabilitation action for assets. The second model incorporates Customer Level of Service (CLoS), Technical Level of Service (TLoS), and the criticality of assets to determine the appropriate rehabilitation action for each asset. NeuralTools 7.5 [4] is applied to predict the rehabilitation action of specific assets. The third model, utilizing Lingo 20.0 [5], focuses on achieving optimum criticality to prioritize rehabilitation activities based on budget constraints and other limitations while minimizing the total criticality of assets in the optimization process.
2. Objectives
The primary aim of this study is to prioritize rehabilitation activities for academic facility, considering the available budget and various constraints, which encompass no action, operational, minor maintenance, major maintenance, and replacement. Additional objectives include:
- (1)
- Identify the criticality of the facility’s assets;
- (2)
- Prioritize rehabilitation actions to minimize the overall criticality of the facility’s assets;
- (3)
- Incorporate facility users’ complaints into the decision-making process.
Moreover, the ongoing research concentrates on facility assets with established maintenance programs and an available budget. Ensuring the satisfaction of facility users is crucial to maintaining the required level of services provided by these facility assets.
3. Background
3.1. Facility Maintenance Practices
Many organizations (such as academic, medical, and municipal sectors) adhere to specific asset maintenance policies. These assets are categorized into groups and subgroups, with maintenance types delineated as planned versus unplanned. Moreover, there exists a prioritization of maintenance activities. A gap analysis based on a set of questionnaires is conducted to compare current practices with established standards [6]. It is determined that the differences between both are not big with respect to maintenance types, encompassing predictive, preventive, proactive, reactive, planned, program, improvement, corrective, breakdown, and breakdown emergency. Priorities of building maintenance from stakeholders’ perspectives were analyzed [7], and the maintenance programs are divided into structural, architectural, electrical, and mechanical. Maintenance programs are categorized by [8] into routine maintenance (HVAC, plumbing, electrical, painting, carpentry, lock/key, and general maintenance), preventive maintenance (structural elements), and deferred maintenance (it will be scheduled as needed). The prioritization of these maintenances is on emergency, urgent, priority, and routine schedules. A priority of rehabilitation matrix, which is 5 × 5, was developed by [9] based on criticality and likelihood. Additionally, inspection requirements of facilities have been identified according to a checklist form, which encompasses nine criteria: safe and orderly operating conditions, fire safety, earthquake safety, electrical safety, chemical storage, hazardous waste, compressed gases, building structures, and miscellaneous [10].
3.2. Criticality
Criticality, or consequences of failure [3], pertains to the outcomes or impacts arising from the malfunction, breakdown, or failure of a system, component, process, or entity. Comprehending the consequences of failure is vital in various fields, such as engineering, risk management, and decision-making, as it aids in evaluating the potential risks and implications linked to a failure event. Criticality may be categorized into four types: economic, operational, social, and environmental [11]. Criticality is studied by several researchers as a decision tool for infrastructure maintenance programs. A criticality model was developed for the predictive maintenance of the bridge group [12]. The model includes deterioration, optimal maintenance, penalty cost function, group maintenance, and scheduling models, ultimately resulting in the ranking of bridges based on their criticalities. Criticality was employed to assess the impact of a rail component system [13]. In a separate study, a criticality model for a distribution water network was formulated [14]. The model relies on four integrated indices: water age degradation, pressure decrease, economic value loss, and supply shortage. Applying a risk framework conducted by [15], the criticality model for sewer pipes considers their conditions and prioritizes maintenance activities by taking into account economic, social, and environmental factors.
3.3. Rehabilitation Selection Methods
The selection of rehabilitation methods has been studied extensively by several researchers. MAUT is selected for the best rehabilitation methods of infrastructure assets [16], rehabilitation of the historic bridges [17], the optimal alternative of rehabilitation of a drainage channel [18]. A dynamic programming model was used by [19] in order to select the alternative rehabilitation of water networks. MINLP is utilized [10] to select the best rehabilitation methods for the water distribution network. Mechanistic Analysis and Field Diagnosis, applied by [20], were utilized to select the best rehabilitation methods for road pavement, while a holistic approach, as suggested by [21], was employed for sewer rehabilitation segments based on the cost-effectiveness of the method. The authors in [22] stated that the optimal combination of scheduled and unscheduled maintenance to ensure occupant contentment is an appropriate solution. The majority of the studies, such as the one estimating the early cost of a concrete bridge using an ANN model [23], and a study by [24] identifying the ANN as an effective method, focus on cost estimation, including predicting the Construction Cost Index (CCI). An integration model of an ANN and AHP, developed by [25], was employed to estimate the cost of road networks, and [26] utilized an ANN to predict the final cost of the construction project. The authors in [27] used an ANN to predict the cost budgeting in the auction process, while [28] carried out an investigation on the effect of communication on rework in construction projects. The estimation of annual maintenance for the infrastructure assets with the aid of an ANN was considered by [29]. The required cost for roof maintenance systems was predicted by [30]. Other researchers utilized an ANN for the scheduling process. The application of an ANN and neuro-fuzzy for construction scheduling was studied by [31]. The authors in [32] predicted the construction contract duration for construction projects. An optimum scheduling model using an ANN was developed by the authors in [33]. According to a study by [34], the prediction of project duration using an ANN was improved, and an optimal scheduling model for the rehabilitation of water pipes can be obtained with respect to different constraints, as mentioned by [35]. Other studies, such as [36], used artificial neural networks (ANNs) to address various construction topics, including the development of a mathematical model to estimate the condition of water distribution networks. The estimation of project effort was carried out by [37] using an ANN. A risk assessment model for infrastructure projects was developed by [38] using a BP-ANN algorithm. The sustainability index for water management was assessed with the utilization of an ANN [39]. A hybrid ANN was developed by [40] to evaluate the sustainability of construction projects. Based on the previous literature review, the criticality of facility assets is not employed as a central management factor for (1) selecting the necessary rehabilitation methods and (2) executing these rehabilitations by the available budget and other constraints.
4. Research Contributions
The research significantly contributes to the field of facility management by introducing an innovative decision support system meticulously designed to address the criticality of facility assets. This includes precise criticality assessment, data-driven rehabilitation strategies, and strategic optimization of rehabilitation activities, all within the constraints of budget limitations. The developed system effectively balances key infrastructure parameters, namely the level of service, risk, condition, performance, and available budget. Achieving this balance presents a considerable challenge for researchers, managers, and decision-makers, as it requires the delivery of an acceptable level of services to users while minimizing associated risks and adhering to budget constraints. Criticality emerges as the pivotal factor in this study for achieving balance among these parameters. This involves initially determining the criticality of assets, followed by selecting suitable rehabilitation measures in alignment with the criticality and level of service. Finally, rehabilitation activities by considering the minimum total criticality of the facility, the available budget, and other pertinent constraints were executed. Importantly, the developed system is adaptable for application to large-scale infrastructure, such as bridges, dams, and linear networks, with some necessary modifications expected as part of future work stemming from this research. Implementation of this methodology requires access to data, analytical tools, and software, as outlined in Section 5.
5. Research Methodology
To develop the decision support system, criticality is chosen as the central element, enabling the comprehension of the repercussions of asset failure and the employment of a method for selecting rehabilitation to uphold the necessary level of service. Nevertheless, the primary challenge lies in the constraints of limited resources to execute the necessary rehabilitation. Consequently, the current methodology is divided into three models: (1) criticality model, (2) rehabilitation model, and (3) optimum criticality model. Figure 1 depicts the methodology of the current research.
The flow between the three models is clearly illustrated in Figure 2. Upon the addition of a new asset to the system, its criticality level is determined based on the criticality model and is subsequently used in the rehabilitation model to identify the necessary rehabilitation method and cost. These outputs serve as inputs for the optimum criticality model, which assesses the feasibility of carrying out the rehabilitation in the current cycle, considering the existing constraints. When maintenance is performed on an asset, the outcome serves as input to train the Artificial Neural Network (ANN) rehabilitation model. If maintenance is not feasible in the current cycle, it is deferred to the next cycle, restarting the process from the beginning.
5.1. Criticality Model
In the current research, criticality is categorized into five levels: very low, low, medium, high, and extreme criticality. The assessment of asset criticality relies on the generic asset group types and the specific impacts of individual assets, as depicted in Figure 3. Asset groups exhibit varying criticalities, making it unnecessary for the selection of rehabilitation types (no action, operational, minor maintenance, major maintenance, and replacement) to be uniform. The second parameter is the specific effects of individual assets, considering the four categories mentioned in the previous section: (1) economic losses, representing the value of the asset in providing services and the losses incurred in the surroundings; (2) operational losses, involving inefficient processes leading to resource wastage; (3) social impact, such as lower levels of user engagement and satisfaction; and (4) environmental impact, resulting from the inability to operate in certain areas. It is important to note that the asset’s location is a crucial factor in determining its criticality. However, this aspect is encompassed within the four criteria of the current model, and as such, there is no necessity to introduce it as a new criterion. In practice, during inspections, the asset’s location is taken into consideration within the existing four criteria to determine its criticality level. The first parameter, generic, and the second parameter, specific, can be integrated to determine the final value of the individual asset’s criticality. By multiplying the generic weight (assigned to asset groups) by the specific score (related to individual assets), the criticality value can be represented using Equation (1).
Consequently, the criticality level can be determined as follows:
where is the criticality value of asset ith; ; is the criticality level of asset ith (rounding to the nearest integer, “1” min. and “5” max.); is the weight of the asset group; is the score of the specific asset; i is number of an individual asset (an integer value, “1” to “n”); k is the number of an asset group (an integer value of “1” to “6”) for structural, mechanical, electrical, safety, equipment, and others (for educational building); and j is the number of criticality criteria (an integer value of “1” to “4”) for economic, pperational, social, and environment.
To implement the criticality model, three sources are utilized: a literature review (as discussed in the previous section), the author’s expertise and judgment, and maintenance reports from various facilities. To ensure the maintenance of the building is at an acceptable level of service and risk, six asset groups are established, involving the identification process of reviewing tens of maintenance reports related to academic buildings. However, distinct groupings need to be considered for other infrastructure assets, such as bridges, roads, dams, and water and sewer networks. The six asset groups identified are structural, mechanical, electrical, safety, equipment, and others. Examples of these groups are illustrated in Figure 2. Logically, the criticality of each group differs from the others, resulting in distinct criticality values for specific assets compared to others. To ascertain the weights of the asset groups (Wk), the utilization of a decision-making theory (such as AHP, MAUT, SMART, etc.) is valuable. Additionally, expert judgment, particularly from maintenance experts, is essential to derive the ultimate weights for these groups. The examination of maintenance reports for several buildings serves as a crucial source for identifying the specific criticality scores of assets (Sij) concerning the four criteria (economic, operational, social, environment). For instance, the criticality of a light bulb is less than that of a roof. The resultant criticality level, which is obtained from Equation (2), ranging from “1” to “5”, is used in the rehabilitation model.
5.2. Rehabilitation Model
The ultimate rehabilitation method is determined using the Artificial Neural Network (ANN), and Figure 4 illustrates the structure of the ANN model. Utilizing the ANN for predicting the necessary rehabilitation action is particularly suitable due to the vast amount of data that can be used for training and testing, enabling accurate predictions throughout the useful life of the assets.
The network is divided into five layers. An input layer, three hidden layers, and an output layer. Table 1 includes the parameters of each layer. Layer (1) encompasses all assets within the academic building.
The group type is not displayed since criticality is determined at the activity asset level rather than the group level. When a new asset is added to the database, the model will determine the predicted action (no action, operational, minor maintenance, major maintenance, and replacement). Examples within this layer include an electrical distribution panel, #1 (from the electrical group), a window, #7 (from the structural group), and an elevator, #5 (from the mechanical group). It is important to note that each asset has a unique critical value determined using Equation (2), and Layer (2) comprises the Customer Level of Service (CLoS), directly derived from user complaints, periodic questionnaires, or acquired directly by the inspector during regular inspections. The adopted scale ranges from 1.0 to 5.0, where “1” represents very poor, “2” poor, “3” medium, “4” good, and “5” excellent service. The third layer is the Technical Level of Service (TLoS), determined by the technical inspector on a similar scale of 1.0 to 5.0. Again, “1” represents very poor, “2” poor, “3” medium, “4” good, and “5” excellent service. Layers 2 and 3 may be assessed by the same inspector in the absence of complaints or a questionnaire during regular inspections. Additionally, the method of asset inspection varies, ranging from simple visual inspections to the use of sophisticated and expensive tools (though beyond the scope of this research). Layer 4 represents the criticality level on a scale from “1” to “5”, determined using Equation (2). Layer 5 indicates the required rehabilitation action based on five options: (1) no action, (2) operational, for issues solvable through operational activities, (3) minor maintenance, (4) major maintenance, or (5) replacement, essential to avoid the criticality. Some assets necessitate only operational measures, like cleaning, while others may require a combination of operational actions and replacement, as in the case of fixing a faulty light bulb. For the majority of assets, their required actions are unknown until the results are obtained, necessitating the use of software to simulate thousands of scenarios for determining the most suitable rehabilitation action when dealing with extensive data. A manual solution may be employed if the organization’s policy dictates the rehabilitation action based on a What-If Scenario. In this scenario case, three parameters—CLoS, TLoS, and criticality—are considered, each with five values ranging from 1 to 5. The rehabilitation action is then determined based on the combination of values from these three parameters, resulting in (53 = 125) possible combinations that necessitate specific rehabilitation actions. However, it is important to note that the rehabilitation action is uniform for all asset groups and individual assets. When considering the six groups of assets, there are () combinations, and an infinite number of combinations result when an individual asset is considered instead of a group of assets. For the current research, NeuralTools 7.5 [4] is employed to determine the required rehabilitation.
5.3. Optimum Criticality
With budget constraints impacting asset maintenance, identifying rehabilitation priorities through optimum criticality becomes crucial, especially for large-scale infrastructure assets, like bridges, dams, linear networks, etc., where cost and time constraints are significant. However, for facilities, a cost constraint is necessary, and a time constraint is considered optional. In this research, the objective is to minimize the total criticality value, which is the sum of criticality values for all assets, under the constraints of the available budget, with no consideration for time constraints. With budget constraints impacting asset maintenance, identifying rehabilitation priorities through optimum criticality becomes crucial. In the case of large-scale infrastructure assets, like bridges, dams, linear networks, etc., cost and time constraints are significant. However, for facilities, a cost constraint is necessary, and a time constraint is considered optional. In this research, a time constraint is not considered. The objective is to minimize the total criticality value, which is the sum of criticality values for all assets under the constraints of the available budget. The required data include the criticality value and rehabilitation cost, while the rehabilitation action is a binary value (Yes/No). Additionally, the emergency budget can be financed through two sources: a reserved percentage from the available budget, an external fund, or a combination of both. If a specific percentage is earmarked from the available budget, a corresponding constraint should be incorporated. Lingo 20 [2] is employed to execute the optimization model. The objective is defined in Equation (3), and the complete model is presented below:
Under the following constraints:
- “Total cost of rehabilitation with respect to the constraints”.
- ; “Available budget is less than or equal to the required total cost and the emergency budget retention”.
- “Rehabilitation action: [X = 1, yes] or [X = 0, no]”.
- “Total cost of rehabilitation without constraints”.
- “Deficit cost due to the available budget constraint”.
- “Emergency budget expressed as a percentage of the available budget”.
- ! Criticality Data; Cri = [………….];
- ! Cost Data; Ci = [………….];
- ! Available budget Data, AB = [………];
- ! Emergency Budget percentage Data; Y = [………];
- End;
It is noteworthy that the available budget for the academic building may be allocated on a weekly, monthly, or longer basis, limiting the current rehabilitation actions to the scope of the present budget. Other rehabilitation activities can be deferred to the subsequent budget cycle.
6. Model Implementation
6.1. Data Assumptions
To apply the developed models, a hypothetical example is introduced (Appendix A) based on an academic building, taking into account the following considerations:
- i.
- Reviewing several facility maintenance reports from actual and previous studies to gain a comprehensive understanding of individual assets, maintenance types, maintenance costs, required levels of services, and maintenance priorities.
- ii.
- Selecting one asset from each of the six asset types to ensure a variety of assets, with criticalities are easily identifiable. As illustrated in Figure 2, there are six asset groups (structural, mechanical, electrical, safety, equipment, and others), each further divided into individual assets. For example, “structure” is a group of assets, while “door1, door2, …, window1, window2, …” are individual assets under the structure group.
- iii.
- Choosing thirty assets, with five individual assets from each asset type. It is worth noting that a facility typically includes tens of assets, depending on the facility type and size. The selection of thirty assets is for the purpose of illustrating the implementation of the three models (Table 2).
- iv.
- Operating the current system at the asset level, not the component level. For example, the HVAC system is considered one asset, without delving into the specifics of HVAC components.
- v.
- Completion of CLoS and TLoS is depicted in Figure 4, and the objective is to focus on criticality, while the process, estimating, and calculating CLoS and TLoS are out of the scope of this research.

Table 2.
Asset groups and selected assets.
| i | Structure | i | Mechanical | i | Electrical | i | Safety | i | Equipment | i | Others |
|---|---|---|---|---|---|---|---|---|---|---|---|
| 1 | Roof 1 | 6 | HVAC 1 | 11 | Board 1 | 16 | Extinguisher 1 | 21 | Medical Equipment 1 | 26 | Parking 1 |
| 2 | window 1 | 7 | Elevator 1 | 12 | Wiring type 1 | 17 | Sprinkler 1 | 22 | Class Furniture 1 | 27 | Plant 1 |
| 3 | door 1 | 8 | Washroom 1 | 13 | Light 1 | 18 | Smoke Detector 1 | 23 | Lab 1 | 28 | Amenity 1 |
| 4 | wall 1 | 9 | Boiler 1 | 14 | Switch 1 | 19 | Alarm 1 | 24 | Visual system type 1 | 29 | Waste removal type 1 |
| 5 | stair 1 | 10 | Pump 1 | 15 | Breaker 1 | 20 | Fall Protection 1 | 25 | Material type 1 | 30 | Statue 1 |
6.2. Criticality Model
According to Equation (1), two parameters are necessary to calculate the criticalities of the thirty assets, which are specified below.
6.2.1. Asset Group Weight (Wk)
By employing AHP, the weights of the six asset groups are presented in Table 3. Based on the author’s expertise, the pairwise comparison under the diagonal is filled. A survey questionnaire administered to experts in this field could enhance the accuracy of the asset group weights. The remaining calculations were performed using the AHP process [41].
The results indicate that safety has the maximum weight, accounting for 29%, while the other asset group has the minimum weight of 10%. The process is verified concerning the consistency ratio (CR = 4% < 10%). Thus, the first parameter is obtained.
6.2.2. Asset Score (Sij)
The scores for the 30 assets are directly provided by the experts, which is the author in this example, utilizing a scale from “1” to “5”. The criticality score of each individual asset is determined based on the four criticality criteria (economic, operational, social, and environment) according to Equation (1). Table 4 displays the results of the criticality values for the 30 assets. These values are then transformed to a scale of 1 to 5, indicating the criticality level of each asset, according to Equation (2). For instance, the criticality level of Roof 1 (i = 1) is determined according to the following:
The result shows that the criticality of door 1 is medium criticality.
6.3. Rehabilitation Model
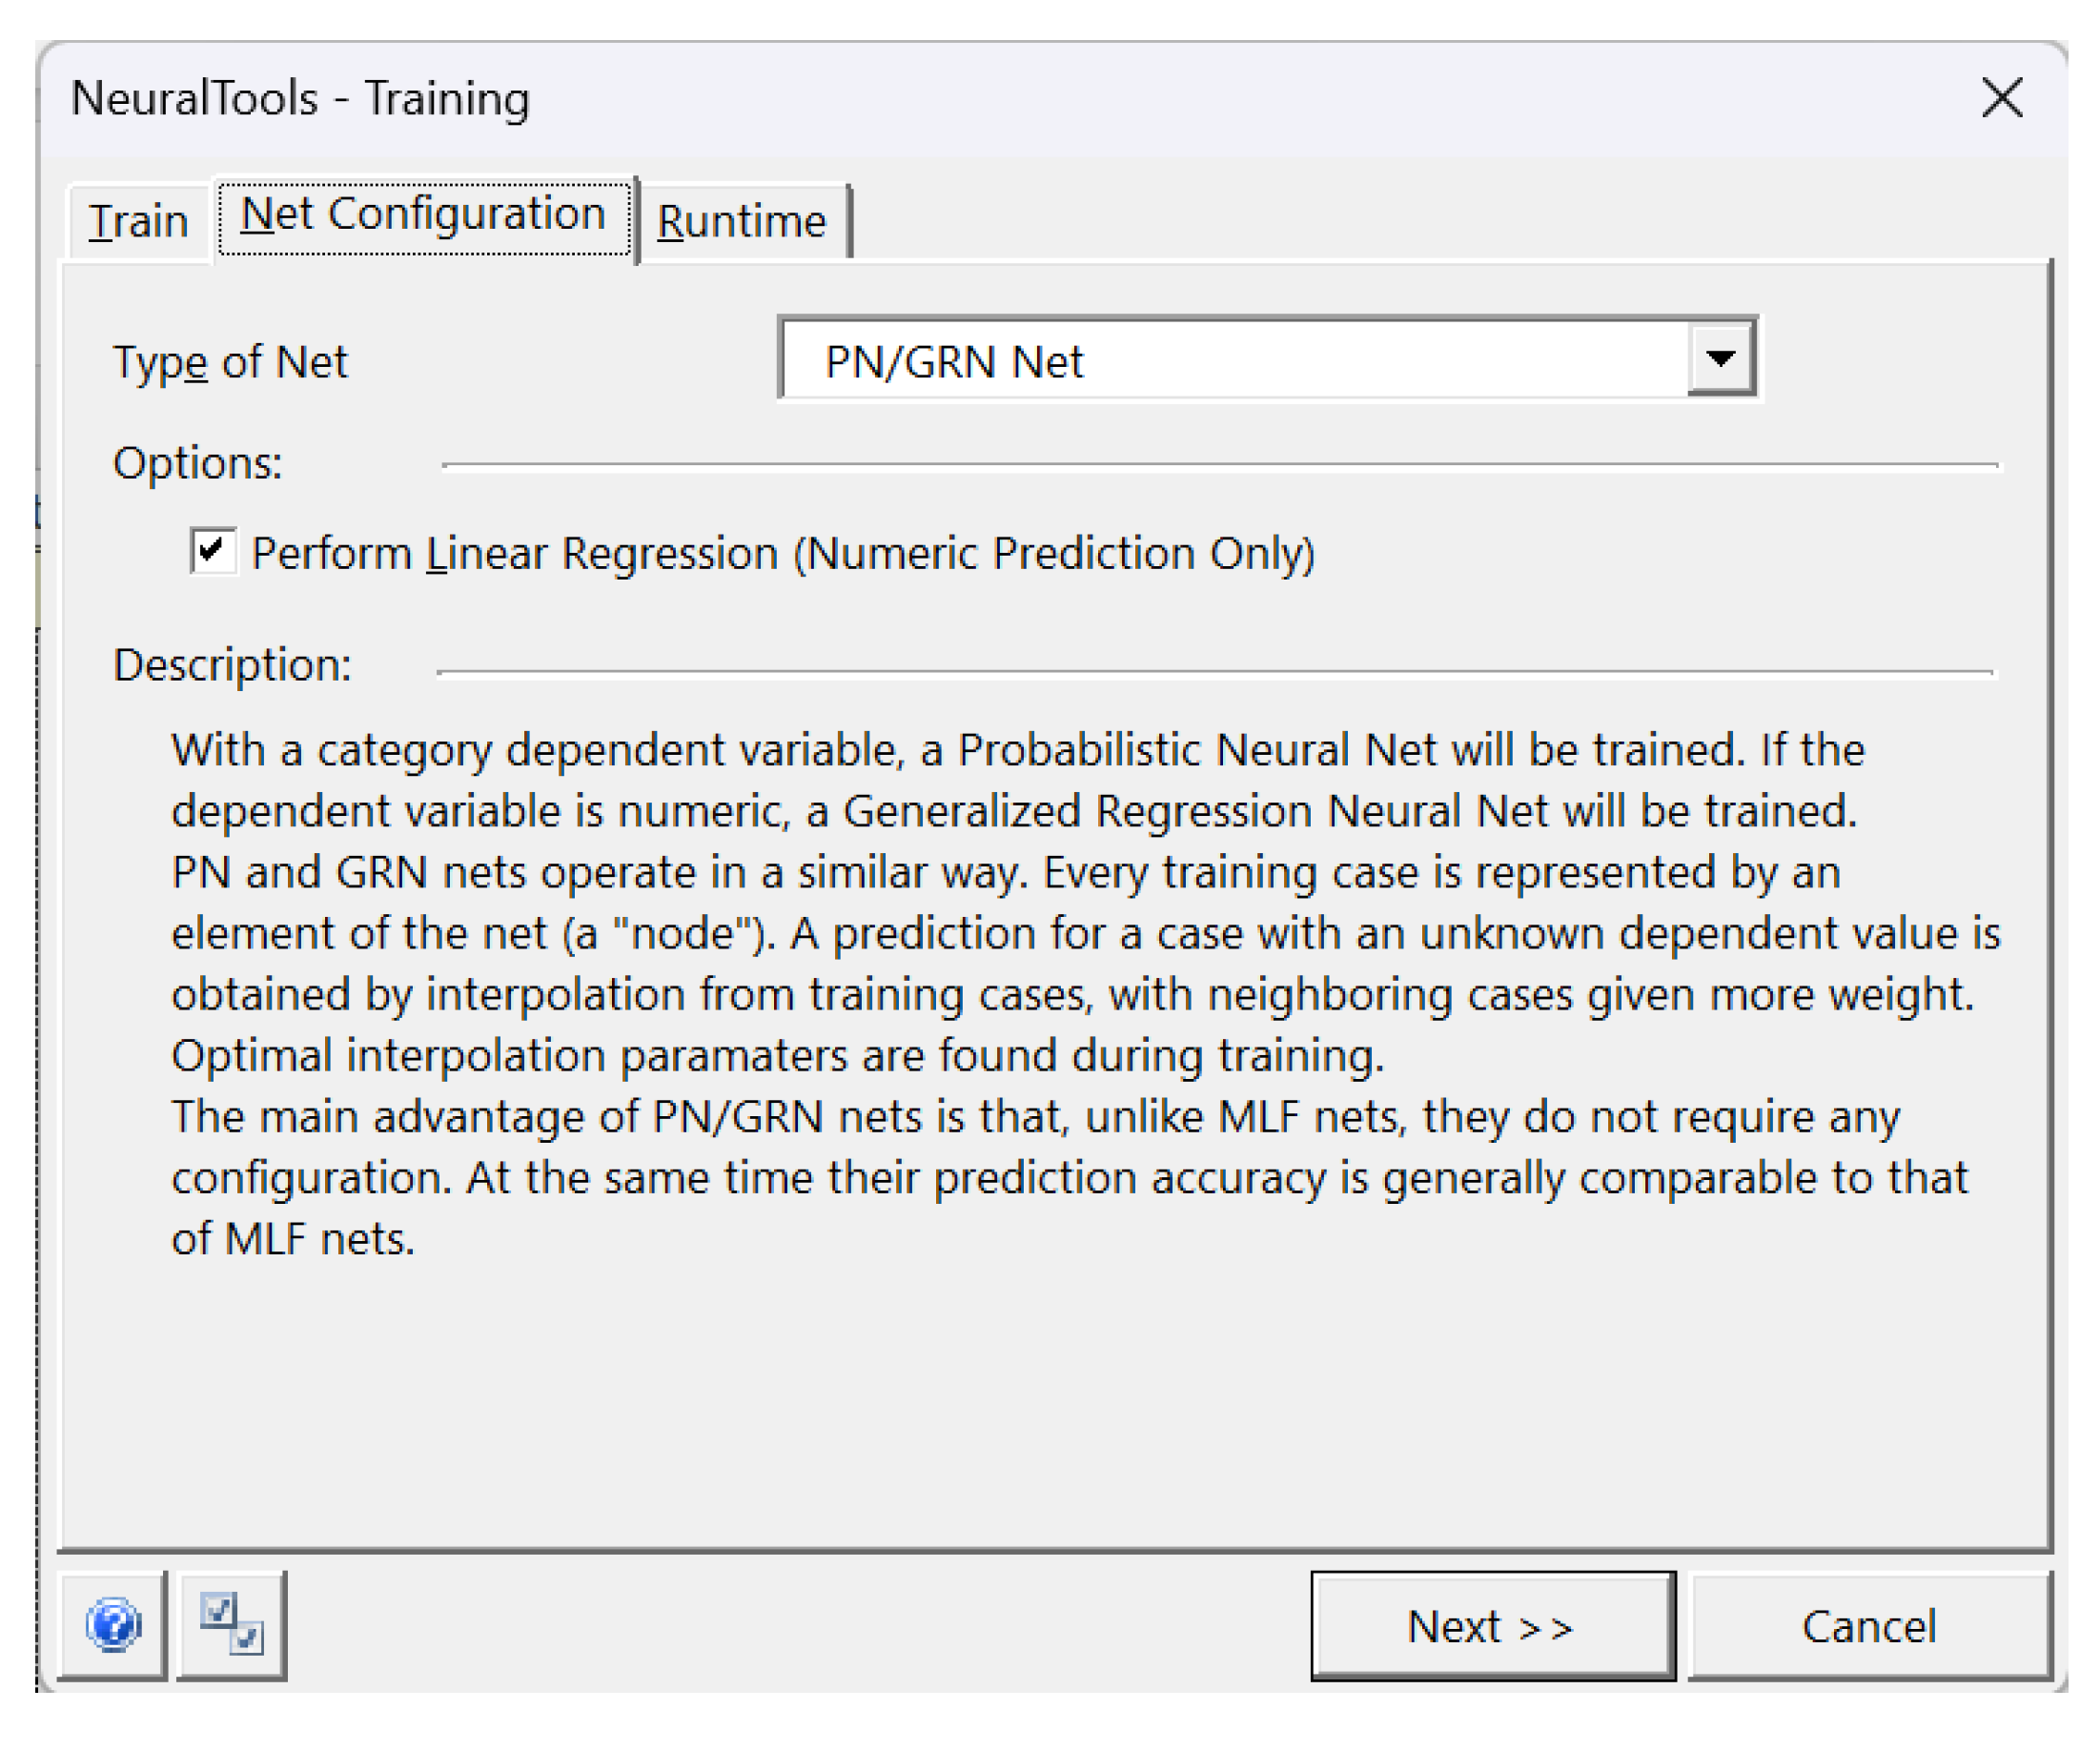
NeuralTools 7.5 [1] is employed, as shown in Figure 5, to forecast the rehabilitation action based on CLoS, TLoS, and criticality. The current network type is a Probabilistic Neural Network since the current variables are numeric. Door 1 (i = 1), HVAC 1 ((i = 6)), and Electrical Board 1 (i = 11) are selected to predict the rehabilitation actions, while the rehabilitation actions for the other 27 assets have already been identified by the manager and their teams. Additionally, the Customer Level of Service (CLoS), Technical Level of Service (TLoS), and the outcomes of the criticality model for the 30 assets are assumed to be available. A total of 80% of the provided data are utilized for model training, while the remaining 20% are used for testing. The predicted rehabilitation actions are as follows: Door 1 requires operational action (result is 2), HVAC 1 requires major maintenance (result is 4), and Electrical Board 1 requires operational action (result is 2). The final report indicates that the percentage of failed testing is zero, suggesting that there is no need to enhance the current model. However, it should be noted that this result is not guaranteed when hundreds of assets are employed in Layer 1; this outcome may change, necessitating improvement; for example, changing the type of Net.
6.4. Optimum Criticality Model
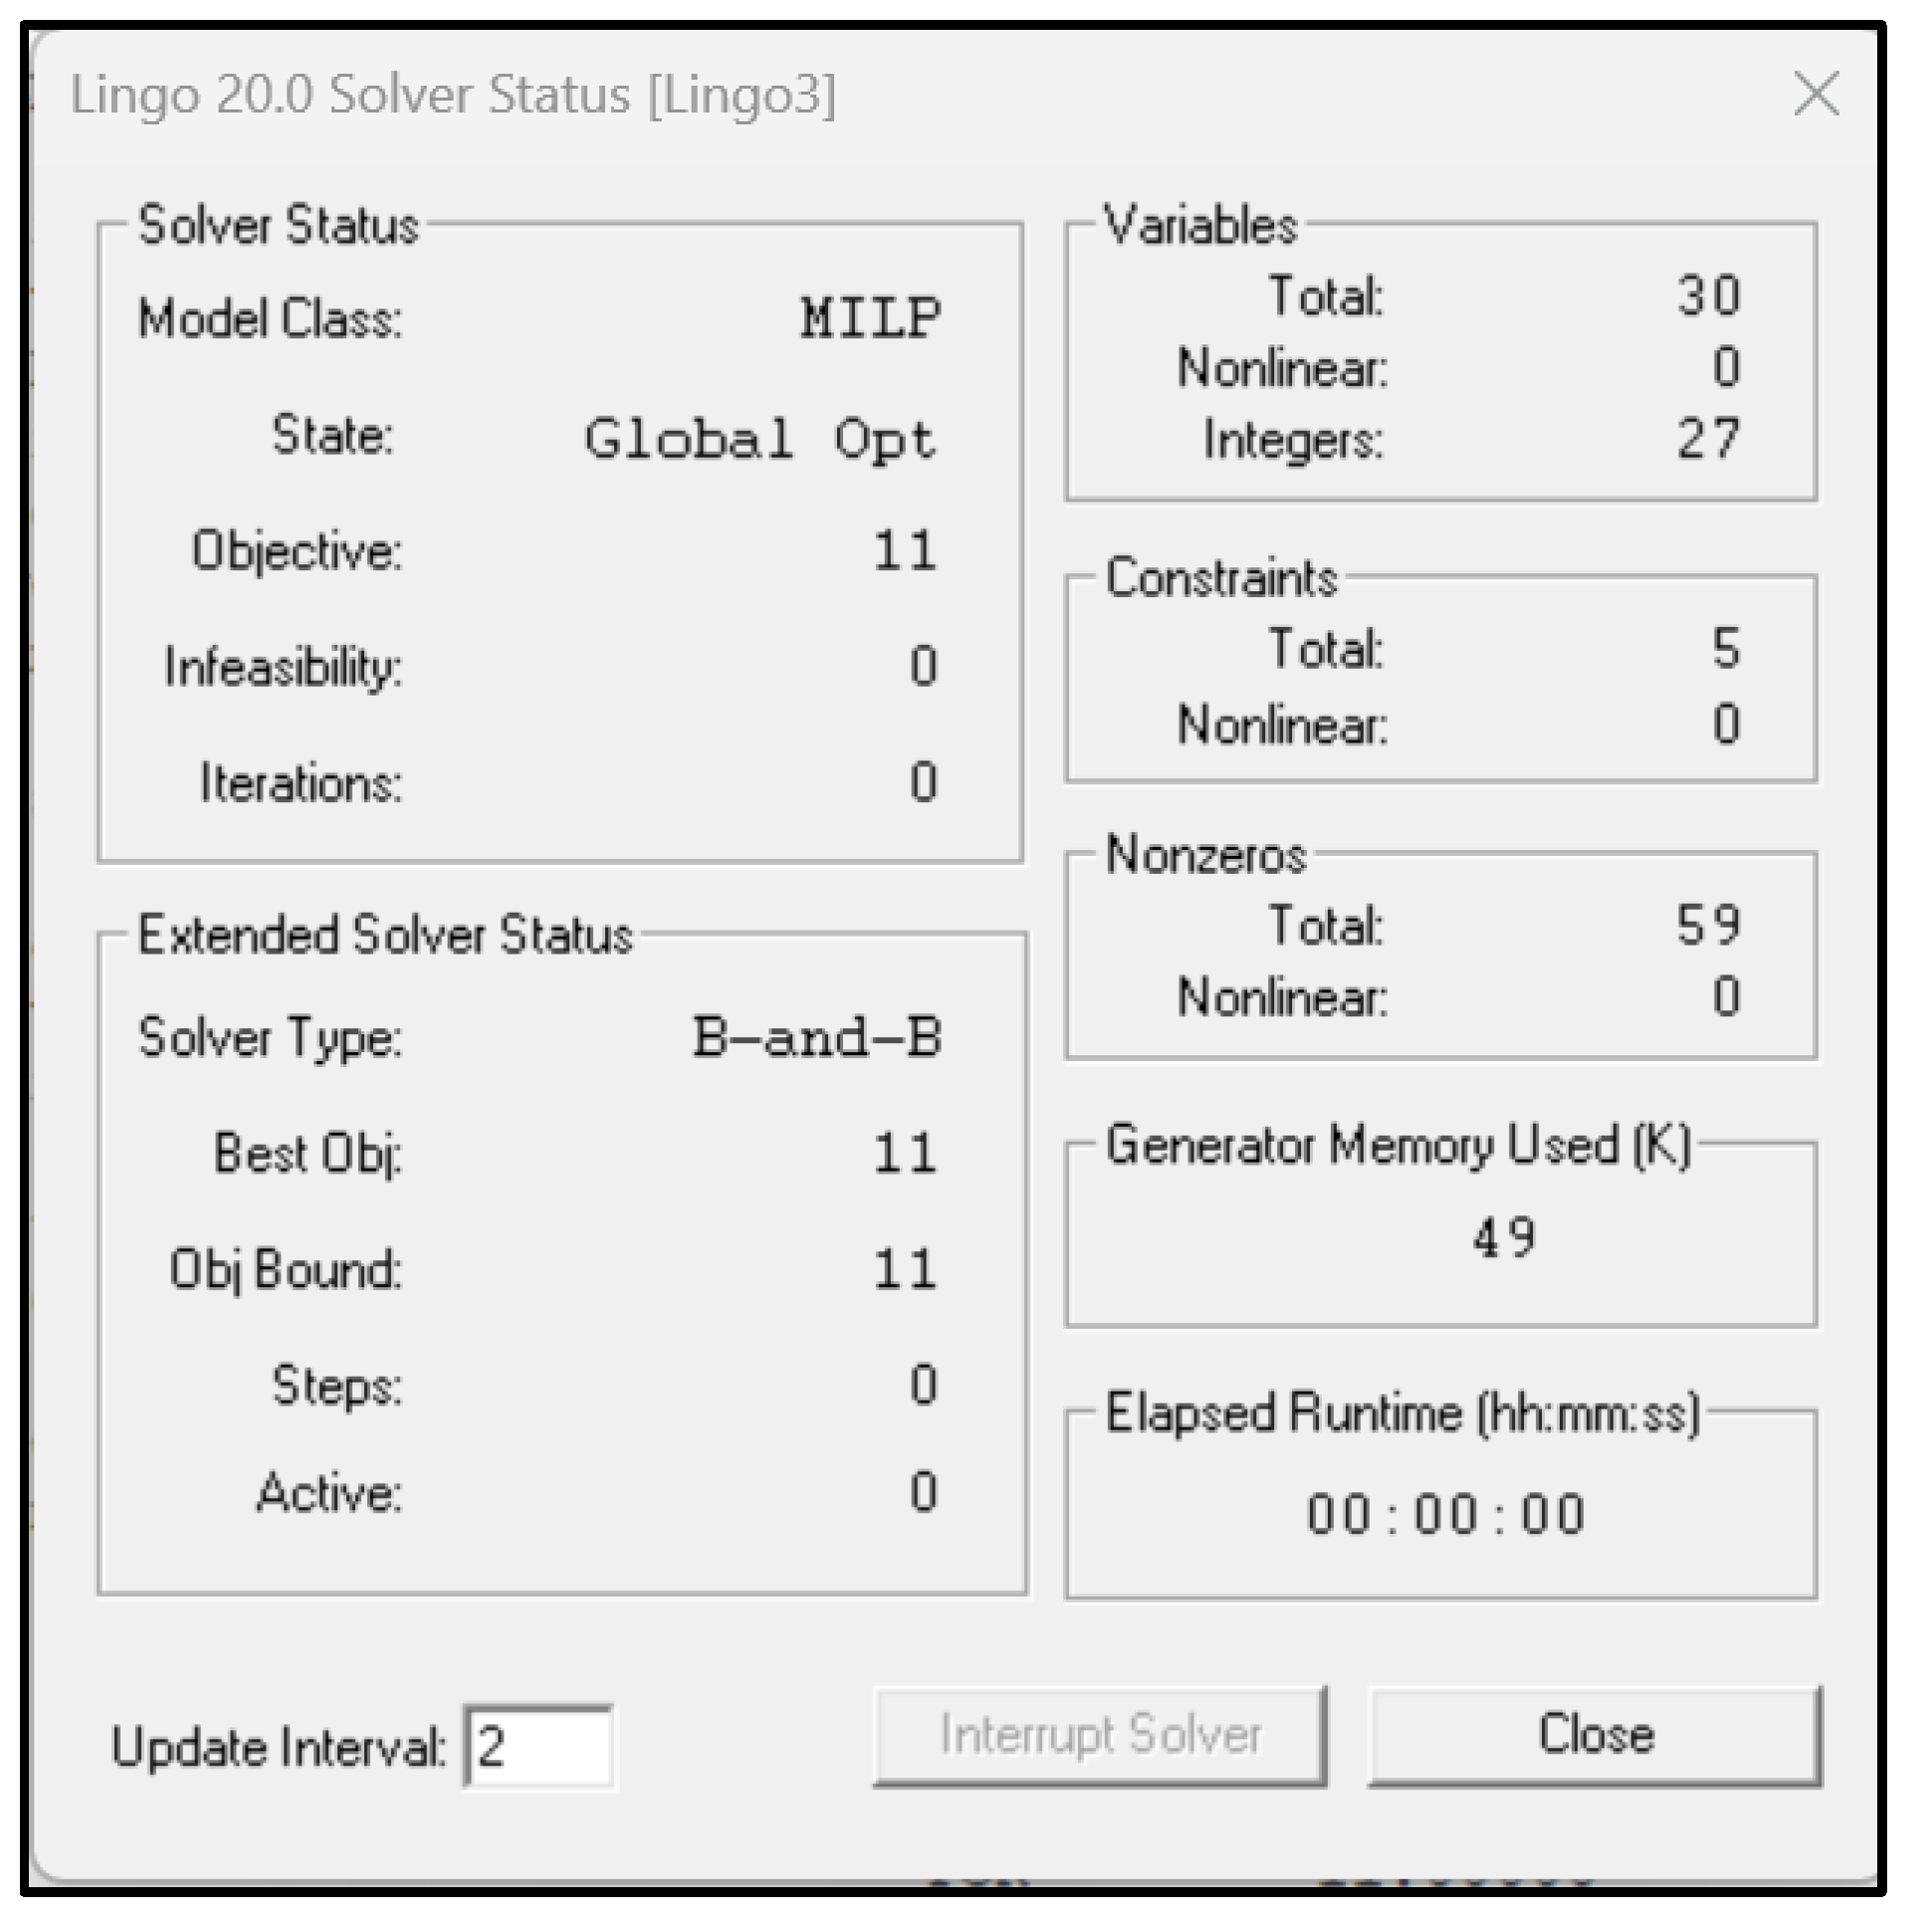
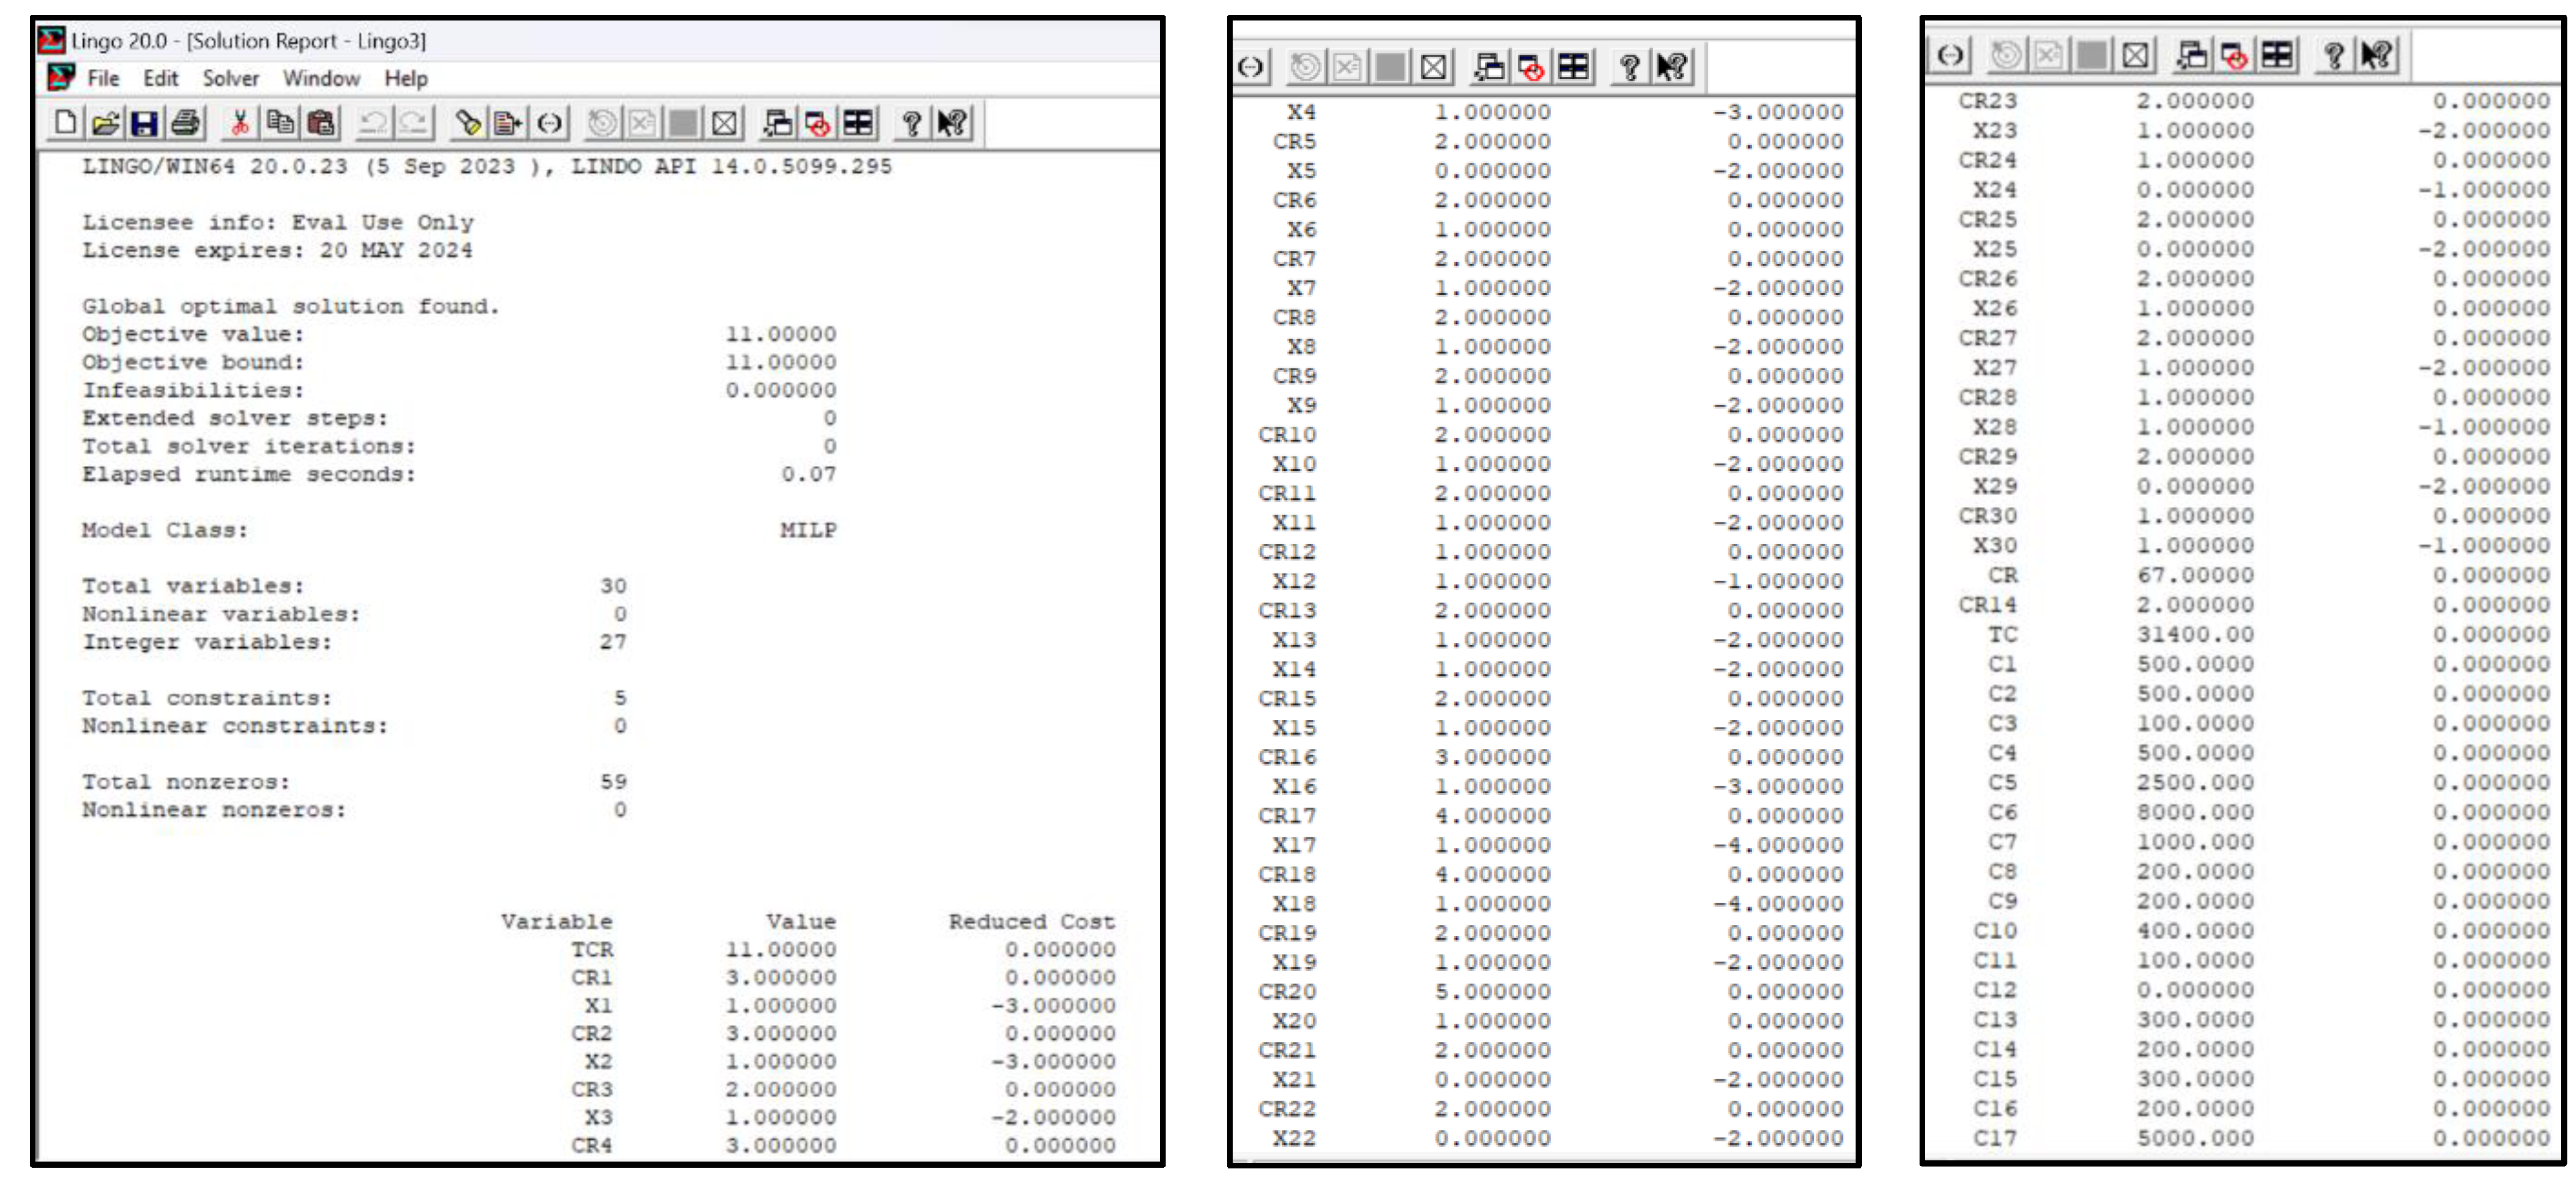
With a constrained monthly budget and a requirement for 30 rehabilitation actions to maintain the building’s assets for the specific month, optimization becomes essential to select rehabilitation activities with the highest priorities. In the current scenario, the available monthly budget is 35,000 USD, the required total cost for all rehabilitation activities is 55,400 USD, which is estimated according to the rehabilitation activities, and 10% needs to be reserved for the emergency budget. Additionally, three crucial rehabilitation activities must be undertaken as per the request of high management: HVAC 1 (i = 6), Fall Protection 1 (i = 20), and Parking 1 (i = 26). Consequently, X6, X20, and X26 are assigned a value of “1” when entering the model constraints, as depicted in Figure 6. The model class employed is Mixed Integer Linear Programming (MILP), as shown in Figure 7. The objective is to minimize the total criticality of the rehabilitation activities. Considering a shortfall of (55,400 − 35,000 + 0.1 × 35,000 = 23,900 USD) and factoring in the cost of the three rehabilitation activities (17,000 USD), there is 14,500 USD available. Following the execution of Lingo 20.0 (LINDO Systems Inc., Chicago, IL, USA, 2023), the results indicate that twenty-one rehabilitation activities can be completed, with six actions deferred to the next month when the new budget becomes available. These deferred assets include (Stairs 1; i = 5), (Medical Equipment 1; i = 21), (Class Furniture; i = 22), (Visual system type 1; i = 24), (Material type 1; i = 25), and (Waste Removal 1; i = 29). The detailed results are presented in the solution report (Figure 8). The total criticality value of the 30 assets is 67. After the rehabilitation of 21 assets, the criticality is expected to decrease to 11. Thus, the objective is accomplished within the constraints of limited resources.
7. Practical and Managerial Implications of This Study
While this research introduces a comprehensive decision support system framework organized into criticality, rehabilitation, and optimum criticality models to manage the rehabilitation of facility assets, it is pertinent to emphasize the significant practical and managerial implications of such novel work. Prominent among these implications is improved decision-making, as the decision support system provides a structured framework for decision-making related to the rehabilitation of facility assets. It incorporates multiple models, such as the criticality model, rehabilitation model, and optimum criticality model, which help in assessing the criticality of assets, planning rehabilitation strategies, and optimizing resource allocation. This enables managers to make more informed and data-driven decisions, leading to improved asset management outcomes. Essentially, utilizing the decision support system can assist managers in effectively evaluating the criticality of facility assets. This allows them to prioritize rehabilitation efforts based on the assets’ importance and potential impact on overall operations. By focusing resources on critical assets, the decision support system helps improve asset performance, reliability, and longevity. The novel decision system not only helps in optimizing the allocation of resources for asset rehabilitation but also considers factors like asset criticality, condition assessment, and available budget to determine the optimal allocation of finances, labor, and materials. This helps in maximizing the utilization of available resources and ensuring that they are allocated to the most important and impactful rehabilitation activities. Another notable implication of this research is its tendency to ensure cost effectiveness, as the systematic approach provided by the decision support system can lead to cost savings in the long run. By accurately assessing asset criticality, planning rehabilitation strategies, and enabling proactive maintenance, the system helps prevent unexpected failures and costly repairs, ultimately reducing unplanned downtime, emergency repairs, and associated costs. More so, the decision support system can help in evaluating the risks associated with facility assets and their potential failure modes, as managers can accurately identify high-risk assets that require immediate consideration. Accordingly, this approach can help to promote and safeguard the safety and consistency of facility operations. Overall, the development of a comprehensive decision support system for managing the rehabilitation of facility assets brings many practical and managerial benefits, including improved decision-making, greater asset performance, resource optimization, cost savings, risk management, safety and reliability, and long-term planning.
8. Conclusions
In the context of limited resources, the criticality of an asset plays a crucial role in managing infrastructure assets, establishing a direct connection to both the required rehabilitation and its priority, thereby becoming a cornerstone for infrastructure asset management. This paper delves into the significance of criticality in general infrastructure and specifically for academic buildings. Notably, the developed models exhibit flexibility, enabling their adaptation to other infrastructure assets, like bridges and roads, with specific modifications, such as introducing time constraints to the optimization model for optimal scheduling. The results derived from these models are essential for assisting building managers in selecting and prioritizing rehabilitation activities based on various factors, including user complaints, available budget, emergency budget, and urgent requests from high management. It is important to note that the current research is constrained to a standard facility with regular assets, such as an academic building, and does not encompass sophisticated assets designed for specific purposes. The example presented, limited to only thirty assets out of potentially tens, serves as a practical illustration for implementing the developed models and obtaining clear results; however, the models exhibit flexibility and can be applied to a larger scale with hundreds of assets. Furthermore, it is worth considering future work at the component level, especially for extensive infrastructure projects like bridges, dams, and linear networks.
Funding
This research received no external funding.
Data Availability Statement
Data is considered within the article.
Acknowledgments
I would like to express my sincere gratitude to all those who contributed to the successful completion of this research work.
Conflicts of Interest
The author declares that there are no conflicts of interest regarding the publication of this paper.
Appendix A
The data presented in this study are purely hypothetical and used for illustrative purposes only, not derived from actual observations, measurements, or experiments. The purpose of including hypothetical data is to demonstrate potential outcomes and facilitate discussions regarding the theoretical aspects of the research. It is important to note that while the hypothetical data have been constructed to align with the objectives of this study, they do not represent real-world measurements or empirical findings; the results obtained from analyzing these hypothetical data should be interpreted within the context of the theoretical framework and the specific assumptions created for this research.
References
- Groen, B.; van der Voordt, T.; Hoekstra, B.; van Sprang, H. Impact of employee satisfaction with facilities on self-assessed productivity support. J. Facil. Manag. 2019, 17, 442–462. [Google Scholar] [CrossRef]
- Acharyya, A. Public Investment in Household Water Infrastructure and Economic Development: An Achilles Heel for India? 2021. Available online: https://www.researchgate.net/publication/355427630 (accessed on 1 December 2023).
- National Asset Management Support Group (NAMS). International Infrastructure Management Manual (IIMM); National Asset Management Support Group (NAMS): Thames, New Zealand, 2011.
- Palisade/Lumivero Corporation. Lumivero; Palisade/Lumivero Corporation: Denver, CO, USA, 2017. [Google Scholar]
- LINDO Systems Inc. LINDO; LINDO Systems Inc.: Chicago, IL, USA, 2023. [Google Scholar]
- Zawawi, Z.A.; Khalid, M.K.A.; Ahmad, N.A.; Zahari, N.F.; Salim, N.A.A. Operation and Maintenance in Facilities Management Practices: A Gap Analysis in Malaysia. In Proceedings of the 4th International Building Control Conference 2016 (IBCC 2016), Kuala Lumpur, Malaysia, 7–8 March 2016. [Google Scholar] [CrossRef]
- Štrok, K.T.; Car-Pušić, D.; Marenjak, S. Priorities in Croatian School Building Maintenance: A Comparison of the Main Stakeholders’ Views. Sustainability 2023, 15, 11767. [Google Scholar] [CrossRef]
- Williams & Associates. Facilities Maintenance Plan; Williams & Associates: Amador County, CA, USA, 2022. [Google Scholar]
- University of Alberta. Facilities Maintenance Plan; University of Alberta: Edmonton, AB, Canada, 2023. [Google Scholar]
- University of Alaska System. Building Blitz Manual; University of Alaska System: Juneau, AK, USA, 2018. [Google Scholar]
- Salman, A.; Moselhi, O.; Zayed, T. Scheduling Model for Rehabilitation of Distribution Networks Using MINLP. J. Constr. Eng. Manag. 2013, 139, 498–509. [Google Scholar] [CrossRef]
- Hadjidemetriou, G.M.; Herrera, M.; Parlikad, A.K. Condition and criticality-based predictive maintenance prioritisation for networks of bridges. Struct. Infrastruct. Eng. 2022, 18, 1207–1221. [Google Scholar] [CrossRef]
- Weik, N.; Volk, M.; Katoen, J.-P.; Nießen, N. DFT modeling approach for operational risk assessment of railway infrastructure. Int. J. Softw. Tools Technol. Transf. 2022, 24, 331–350. [Google Scholar] [CrossRef]
- Marlim, M.S.; Jeong, G.; Kang, D. Identification of critical pipes using a criticality index in water distribution networks. Appl. Sci. 2019, 9, 4052. [Google Scholar] [CrossRef]
- Lee, J.; Park, C.Y.; Baek, S.; Han, S.H.; Yun, S. Risk-based prioritization of sewer pipe inspection from infrastructure asset management perspective. Sustainability 2021, 13, 7213. [Google Scholar] [CrossRef]
- Salman, A. Performance Index for Rehabilitating Water Distribution Networks. Appl. Mech. Mater. 2017, 873, 176–192. [Google Scholar] [CrossRef]
- Jajac, N.; Rogulj, K.; Radnić, J. Selection of the Method for Rehabilitation of Historic Bridges—A Decision Support Concept for the Planning of Rehabilitation Projects. Int. J. Arch. Heritage 2017, 11, 261–277. [Google Scholar] [CrossRef]
- Chowdhury, R.K.; Zaman, A.U. Selection of the optimal alternative: Rehabilitation of a regional drainage channel in Bangladesh. Urban Water J. 2009, 6, 395–405. [Google Scholar] [CrossRef]
- Kleiner, Y.; Adams, B.J.; Rogers, J.S. Selection and scheduling of rehabilitation alternatives for water distribution systems. Water Resour. Res. 1998, 34, 2053–2061. [Google Scholar] [CrossRef]
- Zaghloul, S.; Elfino, M. Pavement Rehabilitation Selection Based on Mechanistic Analysis and Field Diagnosis of Falling Weight Deflectometer Data: Virginia Experience. Transp. Res. Rec. 2000, 1730, 177–186. [Google Scholar] [CrossRef]
- Hutchinson, R.E.; El-Sayegh, H.K.; Chambers, L. Advances and Experiences with Trenchless Pipeline Projects; ASCE Library: Reston, VA, USA, 2007. [Google Scholar]
- Weidner, T.J. Planned maintenance vs Unplanned maintenance and facility costs. IOP Conf. Ser. Earth Environ. Sci. 2023, 1176, 012037. [Google Scholar] [CrossRef]
- Fernando, N.; Dilshan, T.A.K.; Zhang, H. An artificial neural network (ANN) approach for early cost estimation of concrete bridge systems in developing countries: The case of Sri Lanka. J. Financial Manag. Prop. Constr. 2004, 22, 595–602. [Google Scholar] [CrossRef]
- Aslam, B.; Maqsoom, A.; Inam, H.; Basharat, M.U.; Ullah, F. Forecasting Construction Cost Index through Artificial Intelligence. Societies 2023, 13, 219. [Google Scholar] [CrossRef]
- Chala, G.; Tadesse, F.; Teferi, H.; Chala, G.D. Integrated Approach of Cost Estimation for Road Projects by Using Artificial Neural Network (ANN) and Analytic Hierarchy Process (AHP). J. Xidian Univ. 2021, 15, 212–225. [Google Scholar] [CrossRef]
- Abd, A.M.; Naseef, F.S. Predicting the Final Cost of Iraqi Construction Project Using Artificial Neural Network (ANN). Indian J. Sci. Technol. 2019, 12, 1–7. [Google Scholar] [CrossRef]
- Kusonkhum, W.; Srinavin, K.; Chaitongrat, T. The Adoption of a Machine Learning Approach in a Big Data Concept to Predict Project Cost Budgeting in the Thai Auction Process of Procurement Management for a Construction Project. Sustainability 2023, 15, 12836. [Google Scholar] [CrossRef]
- Trach, R.; Trach, Y.; Lendo-Siwicka, M. Using ann to predict the impact of communication factors on the rework cost in construction projects. Energies 2021, 14, 4376. [Google Scholar] [CrossRef]
- Woldemariam, W.; Murillo-Hoyos, J.; Labi, S. Estimating Annual Maintenance Expenditures for Infrastructure: Artificial Neural Network Approach. J. Infrastruct. Syst. 2016, 22, 04015025. [Google Scholar] [CrossRef]
- Alashari, M.; El-Rayes, K.; Helaly, H. Machine-Learning Model for Predicting Maintenance Costs of EPDM Roofing Systems. J. Perform. Constr. Facil. 2023, 37, 04023048. [Google Scholar] [CrossRef]
- Obianyo, J.I.; Udeala, R.C.; Alaneme, G.U. Application of neural networks and neuro-fuzzy models in construction scheduling. Sci. Rep. 2023, 13, 8199. [Google Scholar] [CrossRef] [PubMed]
- Alsugair, A.M.; Al-Gahtani, K.S.; Alsanabani, N.M.; Alabduljabbar, A.A.; Almohsen, A.S. Artificial Neural Network Model to Predict Final Construction Contract Duration. Appl. Sci. 2023, 13, 8078. [Google Scholar] [CrossRef]
- Al-Hafid, M.S.; Sulaiman, A.B.R.; Al-Fahadi, A.S. Short-Term Optimal Hydrothermal Scheduling Using ANN. 2011. Available online: https://www.researchgate.net/publication/322447959 (accessed on 1 December 2023).
- Lishner, I.; Shtub, A. Using an Artificial Neural Network for Improving the Prediction of Project Duration. Mathematics 2022, 10, 4189. [Google Scholar] [CrossRef]
- Fan, X.; Yu, X. Machine learning-assisted optimal schedule of underground water pipe inspection. J. Infrastruct. Preserv. Resil. 2023, 4, 20. [Google Scholar] [CrossRef]
- Elshaboury, N.; Marzouk, M. Prioritizing water distribution pipelines rehabilitation using machine learning algorithms. Soft Comput. 2022, 26, 5179–5193. [Google Scholar] [CrossRef]
- Şengüneş, B.; Öztürk, N. An Artificial Neural Network Model for Project Effort Estimation. Systems 2023, 11, 91. [Google Scholar] [CrossRef]
- Li, C.; Zhou, J. Analysis of Risk Assessment of Overseas Infrastructure Projects Integrating BP-ANN Algorithm. Secur. Commun. Networks 2022, 2022, 7864665. [Google Scholar] [CrossRef]
- Kumar, R.R.; Kumar, G.; Gupta, R. Assessment of sustainability index for rural water management using ANN. Water Supply 2022, 22, 1421–1433. [Google Scholar] [CrossRef]
- Albasri, H.; Naimi, S. Development of a hybrid artificial neural network method for evaluation of the sustainable construction projects. Acta Logist. 2023, 10, 345–352. [Google Scholar] [CrossRef]
- Sodangi, M.; Salman, A. AHP-DEMATEL modelling of consultant related delay factors affecting sustainable housing construction in Saudi Arabia. Int. J. Constr. Manag. 2022, 23, 2859–2868. [Google Scholar] [CrossRef]
Figure 1.
Methodology.

Figure 2.
Flow of the models.

Figure 3.
Criticality hierarchy.

Figure 4.
Predicted rehabilitation method using an ANN.

Figure 5.
Predicted rehabilitation methods using NeuralTools 7.5 [4].
Figure 5.
Predicted rehabilitation methods using NeuralTools 7.5 [4].


Figure 6.
Optimum criticality code.

Figure 7.
Sover status using Lingo 20.0 [5].
Figure 7.
Sover status using Lingo 20.0 [5].

Figure 8.
Solution report.

Table 1.
ANN layers.
| Node No. | Layer No. | ||||
|---|---|---|---|---|---|
| L1: Asseti | L2: CLoS | L3: TLoS | L4: Criticality | L5: Rehabilitation Method | |
| Database | Inspector Assessment/ Questionnaire: Building User | Inspector Assessment | Equation (2) | ANN (Train, Test, and Predict) | |
| Node 1 | Asset 1 | 1: Very Poor | 1: Very Poor | 1: Very Low | 1: No Action |
| Node 2 | Asset 2 | 2: Poor | 2: Poor | 2: Low | 2: Operational |
| Node 3 | Asset 3 | 3: Medium | 3: Medium | 3: Medium | 3: Minor maintenance |
| Node 4 | Asset 4 | 4: Good | 4: Good | 4: High | 4: Major Maintenance |
| Node 5 | Asset 5 | 5: Excellent | 5: Excellent | 5: Extreme | 5: Replacement |
| Node….. | Asset…. | ||||
| Node n−1 | Asset n−1 | ||||
| Node n | Asset n | ||||
Table 3.
Asset Group Weight (Wk) using AHP.
| Str. | Mec. | Elec. | Saf. | Eq. | Oth. | Wk | λ | CR | Consistency | Check | |
|---|---|---|---|---|---|---|---|---|---|---|---|
| Str. | 1.00 | 2.00 | 2.00 | 0.50 | 4.00 | 4.00 | 0.26 | 6.29 | |||
| Mec. | 0.50 | 1.00 | 1.00 | 0.50 | 2.00 | 1.00 | 0.13 | 6.24 | |||
| Elec. | 0.50 | 1.00 | 1.00 | 0.33 | 2.00 | 2.00 | 0.14 | 6.28 | |||
| Saf. | 2.00 | 2.00 | 3.00 | 1.00 | 2.00 | 2.00 | 0.29 | 6.39 | |||
| Eqp. | 0.25 | 0.50 | 0.50 | 0.50 | 1.00 | 1.00 | 0.08 | 6.18 | |||
| Oth. | 0.25 | 1.00 | 0.50 | 0.50 | 1.00 | 1.00 | 0.10 | 6.14 | |||
| Sum. = 1.00 | Avg. = 6.25 | 4% | CR < 10% | OK | |||||||
Table 4.
Criticality level.
| Assets | Xi | Weight (Wk) | Score (Sij) | Criticality Value (Cri) | Criticality Level (1–5) | |||
|---|---|---|---|---|---|---|---|---|
| Economic | Operational | Social | Enviromental | |||||
| AHP | Expert Judgment | Equation (1) | Equation (2) | |||||
| A1: Structure | 0.26 | |||||||
| Roof 1 | X1 | 4 | 3 | 2 | 3 | 3.17 | 3 | |
| window 1 | X2 | 2 | 3 | 3 | 4 | 3.17 | 3 | |
| door 1 | X3 | 1 | 2 | 1 | 2 | 1.59 | 2 | |
| wall 1 | X4 | 3 | 3 | 4 | 2 | 3.17 | 3 | |
| stair 1 | X5 | 1 | 2 | 2 | 2 | 1.85 | 2 | |
| A2: Mechanical | 0.13 | |||||||
| HVAC 1 | X6 | 3 | 5 | 3 | 5 | 2.07 | 2 | |
| Elevator 1 | X7 | 5 | 4 | 2 | 2 | 1.68 | 2 | |
| Washroom 1 | X8 | 2 | 5 | 5 | 3 | 1.94 | 2 | |
| Boiler 1 | X9 | 3 | 4 | 4 | 3 | 1.81 | 2 | |
| Pump 1 | X10 | 1 | 5 | 2 | 2 | 1.30 | 2 | |
| A3: Electrical | 0.14 | |||||||
| Board 1 | X11 | 4 | 4 | 2 | 1 | 1.50 | 2 | |
| Wiring type 1 | X12 | 2 | 2 | 1 | 1 | 0.82 | 1 | |
| Light 1 | X13 | 1 | 3 | 3 | 1 | 1.09 | 2 | |
| Switch 1 | X14 | 2 | 4 | 2 | 1 | 1.23 | 2 | |
| Breaker 1 | X15 | 1 | 5 | 2 | 2 | 1.36 | 2 | |
| A4: Safety | 0.29 | |||||||
| Extinguisher 1 | X16 | 2 | 3 | 2 | 1 | 2.31 | 3 | |
| Sprinkler 1 | X17 | 5 | 4 | 3 | 3 | 4.34 | 4 | |
| Smoke Detector 1 | X18 | 4 | 5 | 4 | 2 | 4.34 | 4 | |
| Alarm 1 | X19 | 3 | 2 | 1 | 1 | 2.02 | 2 | |
| Fall Protection 1 | X20 | 5 | 5 | 5 | 2 | 4.91 | 5 | |
| A5: Furniture & Equipment | 0.08 | |||||||
| Medical Equipment 1 | X21 | 3 | 3 | 5 | 2 | 1.10 | 2 | |
| Class Furniture 1 | X22 | 2 | 5 | 3 | 2 | 1.02 | 2 | |
| Lab 1 | X23 | 5 | 5 | 5 | 5 | 1.70 | 2 | |
| Visual system type 1 | X24 | 2 | 4 | 3 | 1 | 0.85 | 1 | |
| Material type 1 | X25 | 4 | 3 | 4 | 5 | 1.36 | 2 | |
| A6: Others | 0.10 | |||||||
| Parking 1 | X26 | 4 | 5 | 5 | 3 | 1.63 | 2 | |
| Plant 1 | X27 | 2 | 2 | 5 | 5 | 1.34 | 2 | |
| Amenity 1 | X28 | 3 | 2 | 1 | 1 | 0.67 | 1 | |
| Waste removal type 1 | X29 | 4 | 5 | 5 | 5 | 1.82 | 2 | |
| Statue 1 | X30 | 1 | 1 | 1 | 1 | 0.38 | 1 | |
| Cri(min) | 0.38 | 1 | ||||||
| Cri(max) | 4.91 | 5 | ||||||
| Cri(max − min) | 4.53 | 4 | ||||||
Disclaimer/Publisher’s Note: The statements, opinions and data contained in all publications are solely those of the individual author(s) and contributor(s) and not of MDPI and/or the editor(s). MDPI and/or the editor(s) disclaim responsibility for any injury to people or property resulting from any ideas, methods, instructions or products referred to in the content. |
© 2024 by the author. Licensee MDPI, Basel, Switzerland. This article is an open access article distributed under the terms and conditions of the Creative Commons Attribution (CC BY) license (https://creativecommons.org/licenses/by/4.0/).
Share and Cite
MDPI and ACS Style
Salman, A. Criticality-Based Management of Facility Assets. Buildings 2024, 14, 339. https://doi.org/10.3390/buildings14020339
AMA Style
Salman A. Criticality-Based Management of Facility Assets. Buildings. 2024; 14(2):339. https://doi.org/10.3390/buildings14020339
Chicago/Turabian StyleSalman, Alaa. 2024. "Criticality-Based Management of Facility Assets" Buildings 14, no. 2: 339. https://doi.org/10.3390/buildings14020339
Note that from the first issue of 2016, this journal uses article numbers instead of page numbers. See further details here.