1. Introduction
High-quality asset design provides value to organizations, owners, and end users in the construction sector. Design creation involves managed interactions between project stakeholders and takes participants from an initial vague-unknown position to a subsequent known-and-desired solution [
1,
2]. This process results in a set of collated information, involving drawings, specifications, schedules, and digital models, from which tangible assets can be constructed. Design management (DM) therefore involves the management of project-related design activities, processes, people, and other resources to enable the effective flow and production of design information [
3,
4,
5]. However, current project delivery approaches regarding the management of design remain problematic. One persistent concern regards the separate perspectives held by project actors around what successful construction project delivery is because of various project time, cost, and quality targets [
6,
7,
8]. Hence, without effective decision support systems, design management approaches may not always be focused on realizing desired project outcomes [
9]. An additional issue revolves around how achieving such collaborative and integrated working across a temporary project organization (TPO) has usually been a messy and ‘analogue’ coordination process involving process waste. Bolpagni et al. [
10] discuss how in Industry 4.0, because of an increasing adoption of digital design through the likes of Building Information Modelling (BIM), such information-rich content could be much better managed through more digital means. In brief, BIM involves creating a digital version of what is to be built and then using it as the basis for construction. Using specialist computer software, designers create a three-dimensional (3D) model that is an exact rather than approximate representation of the asset. Succar [
11] initially suggested that BIM would provide a “…technological and procedural shift” within construction, and Gledson [
12] later identified its impact as “the most prominent radical, transformative and disruptive innovation to hit the construction industry”.
Again, because of the increasing adoption of digital design through the likes of BIM, information-rich content can now be much better managed using more digital means. The presence of information-rich digital content provides the opportunity for a digital solution to address the challenges design managers face regarding coordination and performance monitoring.
The aim of this study, therefore, is to report on a research project that employed design science research methodology (DSRM), resulting in the development of a bespoke digital web-based dashboard prototype intended to enhance the efficiency, productivity, and ultimately the effectiveness of the construction design management (CDM) function. The project was devised and delivered as a Knowledge Transfer Partnership (KTP) project with a Case Study Organization (CSO). Design Science Research (DSRM) focuses on developing innovative solutions to address practical problems. In this KTP project, the output of the DSRM intends for better realization of construction projects through digitally supported design management (DsDM) functions by way of a standalone dashboard that uses data processing to better manage information, facilitate good evidence-based decision-making, and drive project performance.
The research questions that the KTP project ultimately addressed were: Can design management processes be digitalized? If so, how can the digitalization of design management processes improve design management efficiency and productivity? Specifically, could a web-based Design Management dashboard address challenges faced by construction design management practitioners, particularly around the real-time monitoring of design coordination, task prioritization, and designer performance?
Value is provided by the research reported in this article for both the construction industry and academia. Web-based Design Management dashboards, as per the prototype described herein, can offer practical solutions for longstanding design coordination challenges in the construction sector, thereby enhancing productivity and efficiency. This study serves as a bridge between theoretical insights and actionable strategies, encouraging the adoption of digital solutions in the industry. The study also contributes to methodological innovation by exemplifying the application of Design Science Research Methodology (DSRM) to create a practical solution. It underscores the significance of academia–industry collaborations, as demonstrated through this Knowledge Transfer Partnership (KTP) project with a Case Study Organization (CSO). The research showcases the transformative potential of theoretical advancements with real-world applications.
Before further discussing design science research methodology (DSRM) and the discrete design management functions targeted by the prototype dashboard, some inherent problems in the conventional design process, the value of the design management role, and how it could be enhanced through the use of project data analytics are now discussed.
2. Literature Review
Gledson [
13] summarizes various inefficiencies in the design process that ultimately lead to inherent problems in the existing design management process. An example of a fundamental inefficiency is the high degree of uncertainty during the early design phase when critical design decisions that shape the entire project are required [
14,
15]. At project inception, lead designers first establish the nature of the design problem, whether it is ‘well-defined’, ‘ill-defined’, or ‘wicked’ [
16,
17]. To establish the nature of the design problem, they extract early, non-formalized requirements through guided client interactions to ensure the client’s needs will be met. Establishing the client’s needs during the early design phase is critical for client satisfaction; therefore, communicating and interpreting the client’s requirements between the client and the designers is fundamental to the project [
18]. Tizani [
19] describes various design process issues that may negatively impact design information capture, quality, and implementation. These include poor capture of formalized building requirements, rigidity of design process flow, compartmentalized decision-making, lack of fidelity, minimal opportunities for design experimentation, lack of accommodation for late design changes, and lack of design automation. Overall, the current design process is inherent in inefficiencies that have the potential to negatively impact the project design. To improve design and designer performance, further consideration is required as to how to address these inefficiencies and issues.
The specific project procurement route plays a key role relating to the design processes and activities [
20]. Dictated by a selected project procurement strategy (for example, traditional design-bid-build, or design, build, etc.), a set order of the design activities to be carried out is undertaken before the information can be transferred down to other project participants. This fragmented approach to managing design flow is often criticized [
21] albeit perhaps most notably by Anumba et al. [
22], who framed this as a siloed—‘over the wall’—approach. Once each area of design has been produced, the recipient of the design information has to interpret the information to be able to make judgements. Because of the design quality and maturity available to them, they may also have to make several assumptions, which may lead to misinterpretations. The recipients of information will also need all of the multiple project views (for example, the general arrangements as well as the separate sections and detail drawings) available and correct to the latest versions to fully understand the design. Checking is carried out to ensure the design is ‘clear’, ‘correct’, ‘consistent’, and ‘coordinated’ with the associated design information (which another producer may have created) and is ‘complete’. Crotty provides a valuable summary of the issues the fragmented and siloed design processes may create related to the designers involved: “To carry out these checks effectively and consistently takes time and requires extraordinarily high, but generally unacknowledged, levels of skill, discipline and judgement. Such talents are rare and often unavailable on fast moving projects, which means that fundamental mistakes are often made” [
23]. Given that the various project procurement routes can create a fragmented and siloed design process, which has undesirable repercussions for the project design, new solutions and ways of working that foster greater collaboration and communication between designers are required to aid individuals and performance [
24]. For example, a new way of working could use a digital project decision-support system to benefit the process of checking and coordinating design information for construction design managers.
Cidik and Boyd [
4] recently warned against the narrow but commonly held view of design coordination involving only the integration of separate design outputs by fragmented design actors and instead emphasized the “shared sense of purposefulness” that the design team members should have. Regardless, because several design disciplines provide input into even the most basic of design activities, their coordination requires much time and skilled resources. Design coordination can be inefficient and ineffective without a dedicated design manager to ensure fit-for-purpose design quality. Current means of generating and managing construction project design—even when using the likes of BIM—can, therefore, be inefficient and ineffective without such a dedicated role providing the necessary oversight. While the focused use of BIM can facilitate improvements in conventional design processes, concerns persist around how such tools enhance design quality. Therefore, a greater focus on the design manager role and how it can support design quality through better use of digital project information is welcomed.
Savolainen et al. [
21] acknowledged design management’s role in value creation. Depending on the procurement route used and with reference to the RIBA Plan of Work 2020, Design Managers can be substantively involved across Stage 1 ‘Preparation and Briefing’ through to Stage 6 ‘Handover’ of projects. The authors go on to say that depending upon procurement mechanisms, they can be involved in activities as diverse as preparing and monitoring design programmes, undertaking design reviews, coordinating the development of technical designs, and resolving technical and site-based queries. Various researchers, including Jacob and Varghese [
22] and Sutrisna and Goulding [
23], have recently reviewed design process interactions and identified concerns around the quality of information flow and information exchanges in the design management processes. Similarly, Uusitalo et al. [
25,
26] investigated the roles of design and design management actors in construction project contexts, specifically regarding information flow and solving design quality problems. These researchers ultimately found that project teams should look to enhance ways of communicating and collaborating when managing design. Ultimately, however, much of the knowledge base has only hinted at how better use of project information could be enacted digitally to enhance construction practice. Explicit ways of advancing design management practice through digital means are lacking in the existing knowledge base. To address that gap, this project uses Project Data Analytics to create a prototype dashboard that has the potential to better support design managers in performing their roles.
Project Data Analytics
Project Data Analytics (PDA) involves leveraging advanced data analytics techniques to extract valuable insights from structured data. In construction, Project Data Analytics (PDA) can enhance decision-making across the project lifecycle in areas such as risk management, cost estimation, schedule optimization, resource allocation, and performance monitoring [
27]. Various forms of project data analytics exist. These include the use of low autonomous/intelligence Robotic Process Automation (RPA) tools such as transactional ‘bots’, through to much-vaunted, high autonomous/intelligence narrow/general Artificial Intelligence (AI) solutions [
28]. Application Programming Interface(s) (API) also enable data analytics to occur via connections between computers and software applications. Given the range of design management processes and the growing use of project data analytics, it was identified that a range of DM functions could be digitally supported through project data analytics by creating a DM solution. Specifically, this project made use of API analytics via a web-based project dashboard interface to digitally support a range of design management (DsDM) functions. The development and use of bespoke digital dashboards in the construction sector is beginning to increase [
29,
30,
31]. In this study, we describe a selection of the Design Management functions that the web-based project dashboard digitally supports. These include opportunities to:
Allow better coordination and management of design process interactions, as captured through Technical Queries (TQs) and Requests for Information (RFI) mechanisms.
Ensure that the design teams are aware of and maintaining their design delivery programme and focusing on their critical design priorities through better monitoring of planned design releases against actual design production.
Overview of design management issues at the project level or portfolio level.
Provide additional design management process assurance at the project level.
3. Design Science Research Methodology (DSRM)
Descriptive research is to accurately portray the likes of events or situations [
32]. This descriptive research reports on the results of a collaborative industry–academia Knowledge Transfer Partnership (KTP) project with a Case Study Organization (CSO) that employed a design science research methodology (DSRM) to produce a web-based Design Management prototype dashboard. This KTP was located in Newcastle upon Tyne in the North East of England, and the project ran between March 2020 and May 2022. The partnership consists of construction project management and computer science researchers from one of the largest academically excellent universities in the United Kingdom (i.e., the knowledge base partner) and professionals from within the internal Digital Advisory Team inside a global Project Management consultancy firm (i.e., the company partner). The initial objective of the KTP project was to create a digital decision-support platform for its design management service on construction projects, which would facilitate collaboration and increase productivity. To do this, the KTP project team considered a range of appropriate methodologies to address the practical problem at hand, including Action Research, but because of the need to create a digital prototype dashboard (i.e., an artefact), they ultimately adopted the Design Science Research (DSR) approach [
33,
34]. DSR is a research paradigm that concentrates on developing and validating prescriptive knowledge. It enables the development of innovative artefacts (systems, models, processes, etc.) as solutions to address practical, real-world problems [
35]. DSR typically employs design, development, evaluation, and implementation stages, although solutions are iteratively refined and improved upon based on the feedback and empirical testing of the artefacts throughout [
36]. The DSR paradigm is applied within various scientific disciplines that emphasize the need to solve complex problems through the creation and validation of innovative artefacts. Examples of the diverse disciplinary contexts that apply DSR include Health Informatics: Education Technology; Library and Information Science; Environmental Science; and Architecture and Urban Planning. However, fields closer to this present study include:
Information Systems (IS): In which information systems and technologies are designed and evaluated to address organizational and societal challenges.
Computer Science: Where DSR is applied to create novel software systems, algorithms, and computational models to address specific problems.
Engineering: Various engineering disciplines, for example, systems engineering, software engineering, industrial engineering, etc., use DSR to address engineering challenges through the design and evaluation of engineering solutions.
Management Science: Organizational processes, decision support systems, and new management practices are designed and tested by way of DSR.
Operations Research: Where DSR can be applied to design and optimize decision-making processes, algorithms, and systems for efficient resource allocation and management.
Within DSR, Design Science Research Methodology (DSRM) occurs using the principles or guidelines associated with this paradigm [
37]. There have been various attempts to formalize methodology [
38,
39], though it differs across disciplines [
40,
41,
42]. For example, within Information Systems Research, Peffers et al. (2007) [
39] defined the Design Science Research Methodology (DSRM) as a six-activity process, as shown in
Figure 1 and summarized as follows [
43]:
Problem Identification and Motivation: Define the real-world problem or opportunity that requires a design-oriented solution for the context and stakeholders involved.
Define the objectives for the solution: Clear articulation of research goals or objective(s). Define project boundaries.
Design and development: Create the initial design of the artefact. Follow an iterative process to refine and improve the design based on feedback and insights. Create the artefact.
Demonstration: Apply the solution to address all or part of the research problem.
Evaluation: Assess how well the artefact addresses the identified problem.
Communication: Document the research and share findings.
Table 1 shows how the alignment between the DSRM activities and the 4 Project Stages in this collaborative industry–academia Knowledge Transfer Partnership (KTP) project resulted in the production of a web-based Design Management prototype dashboard.
In line with the project stages 1–3 and the associated DSRM activities listed in
Table 1, the remainder of this study reports on the identification of problems and then the development of the prototype dashboard. Following 2 pilot interviews, for purposes of problem identification qualitative survey research, specifically semi-structured interviews were held with 9 purposefully identified professionals with design management experience to uncover first-hand, real-world DM concerns and validate these against challenges identified from the knowledge base. The profiles of those interviewed professionals are presented in
Table 2. The data from these interviews were analysed, assisted by the use of Nvivo Software V12 as a form of Computer-Assisted Qualitative Data Analysis Software (CAQDAS), with the themes arising presented in
Table 3. Then, by way of DSRM, the web-based design management prototype dashboard was designed, iteratively developed, and evaluated. This tackled some of the identified challenges of the design management role by digitalizing selected design management processes to better manage data and information, facilitate good decision-making, and improve the efficiency and productivity of this role. Results from across these project stages are reported below.
4. Results
At the outset of the collaboration and to obtain funding, various supporting statements were obtained from design management or DM adjacent practitioners to justify the project. One important statement was advised: “Design management plays an increasingly important role in projects as it uniquely crosses the boundaries between the quantitative/process related issues dealt with by project management colleagues, and qualitative design related issued being delivered by the design team. The benefits to the user that a central dashboard where project decisions can be made and presented to the client provide [include those of] challenging the delivery programme by utilizing data, and [of] digitizing analogue processes”. This reveals that better project data analytics can assist the design management function. After project award and following the initial ‘Situational Awareness’ phase (Project Stage #1), ‘Problem Definition and User Requirement gathering’ (Project Stage #2) activities occurred. This involved a further review of the knowledge base, followed by online interviews with design managers. A mass of qualitative data were obtained from these interviews, which were then thematically analysed. As evidenced in
Table 3, several interrelated DM challenges were revealed.
The present study focuses only on some of these DM challenges, as ultimately addressed by specific functions within the web-based design management prototype dashboard. These include the creation of digital TQ/RFI systems (to support challenges of communication, coordination, information flow, and decision-making), the digital tracking of designer performance in the production of their project deliverables (similarly, to support challenges of coordination, information flow, efficiency, and value), the ability to provide more accurate views of design management issues at the project level or portfolio level, and, by way of an associated stand-alone application to further digitally support the Design Management function, the provision of additional process assurance at the project level.
4.1. The Challenges of Design Coordination and Information Management
Participants revealed how better coordination and improvements in the management of design process interactions as captured via conventional ‘Requests for Information’ are needed: Participant 9 discussed how one specific element of works on one of their projects was affected by this: “I’ve had 250 RFIs on site that I’ve had to deal with. Had, 20 days of site delay, and we’ve had to make 25 changes on site, to er, cable and drainage, and such”. The impact of such, seemingly difficult to manage: “…you are sitting there, dealing daily with a million RFIs that are coming in from your site managers … I don’t know how many days on site have been wasted, and I don’t know how many RFIs have been generated from it…” (Participant 9). Participant 4 also revealed the need for better digital management of project RFIs: “As an example, if I asked for a schedule of RFIs from a project, ‘tell me how many there are’, it will probably take them two weeks to extract those RFIs into an Excel sheet, [that] won’t give you very much, whereas if I could get and use that data to influence and understand it, I can then link it to things like programme or whatever we need to do with it.” Participant (#4) also understood how project data analytics could further aid the production process: “[Regarding] outstanding RFIs, TQs, from subcontractors, clients or whatever it is, if we can see those outstanding issues on a dashboard and their dates … if we can get everybody to think about the priorities in relation to time, and they can see those clearly through a dashboard … we can build it properly”.
Across the interviews, challenges of communication, coordination, information flow, and decision-making concerned DM practitioners. These were ultimately addressed through the creation of a digital RFI system, as discussed in the next section.
4.2. The Challenges of Ensuring the Design Team Maintains Their Design Delivery Programme
Regarding the production of design programmes, existing situations were outlined: “I would ask the consultants to produce a list of deliverables, whether drawings, specs, whatever they are for each construction package and when they need to be released”. (Participant 2). These are incorporated into an agreed-upon design programme, or an Information Release Schedule (IRS), which is set out with activities and timings, “…then that would be monitored by the architects and myself. I would speak with the architect every 2 weeks [for a] progress update” (Participant 1). This is then monitored: “If it’s as the plan, everything’s fine. If they’re slightly behind we need to monitor the impact of that on the design coordination, making it all fit, which then goes on to procurement … we then must monitor that and make sure procurement is linked into build.” (Participant 1). Once design information is released: “…it would be a simple case of just going through the [common] data repository that they would upload it to, and it would be a simple matter of just going through and checking that those drawings and those schedules or specs have been received” (Participant 2). As to any problems with the existing process, designer performance in terms of design release against agreed-upon design programmes was a frustration: “… and the day comes and the deadline comes and next Friday turns into Monday, turns into sort of Wednesday and by the next Friday … erm, if they’re late, that’s recorded.” (Participant 1). Using the current existing process, the design manager is often in a reactive state, whereas participants would prefer they were able to be more proactive: “The biggest challenge we’ve had consistently for the past two years has been design managers not being process managers, not really [being able to] actively influence procurement or design programme progress.” (Participant 4). Ultimately, what participants wanted was to be able to better track and manage designer performance: “I want to see [visibility of] the design manager, the key challenges they’re having on the project. I would like to see how the design and procurement programme and the project programme is working, against the [designers] own actions, what they’re doing, and I’d like to see [from designers], erm an element of compliance” (Participant 4). Again, across the interviews, challenges of coordination, information flow, efficiency, and value creation concerned DM practitioners. These were ultimately addressed, as discussed in the next section, through the creation of a digital system for better tracking of designer performance in the production of their project deliverables.
5. Prototype Dashboard Development
Following the prior ‘Problem Definition and User Requirements’ stage (#2), the ‘Problem Solving, System Design, and Development stage (#3) occurred. The main activities in this stage involve the design of the DsDM process itself; iterative and agile design and development; evaluation of the bespoke DsDM prototype dashboard; its functionalities; and the user interface. Summary details are here provided. Regarding the process review and design of the DsDM, over the duration of the project, these aspects were continually storyboarded and refined using online collaborative tools such as the Miro service.
Figure 2 shows this, which ultimately identified ‘what’ needed to be done in the design and development tasks.
Thereafter, ‘how’ the DsDM dashboard would be iteratively designed and developed was determined. The indicative system architecture for this is evidenced in
Figure 3.
The developed DsDM prototype dashboard draws upon relevant project data to aid design coordination activity and facilitate DM task prioritization and reporting functionality. Data and information from a newly built office development project were used to construct and test the dashboard. It enables useful visual reporting capability that, in turn, allows focus to be retained on priority Technical Queries (TQs)/Requests for Information (RFI), enables design production to be monitored, and enables trends in designer performance to be assessed.
5.1. Addressing Challenges of Design Coordination and Information Management through Managed RFIs
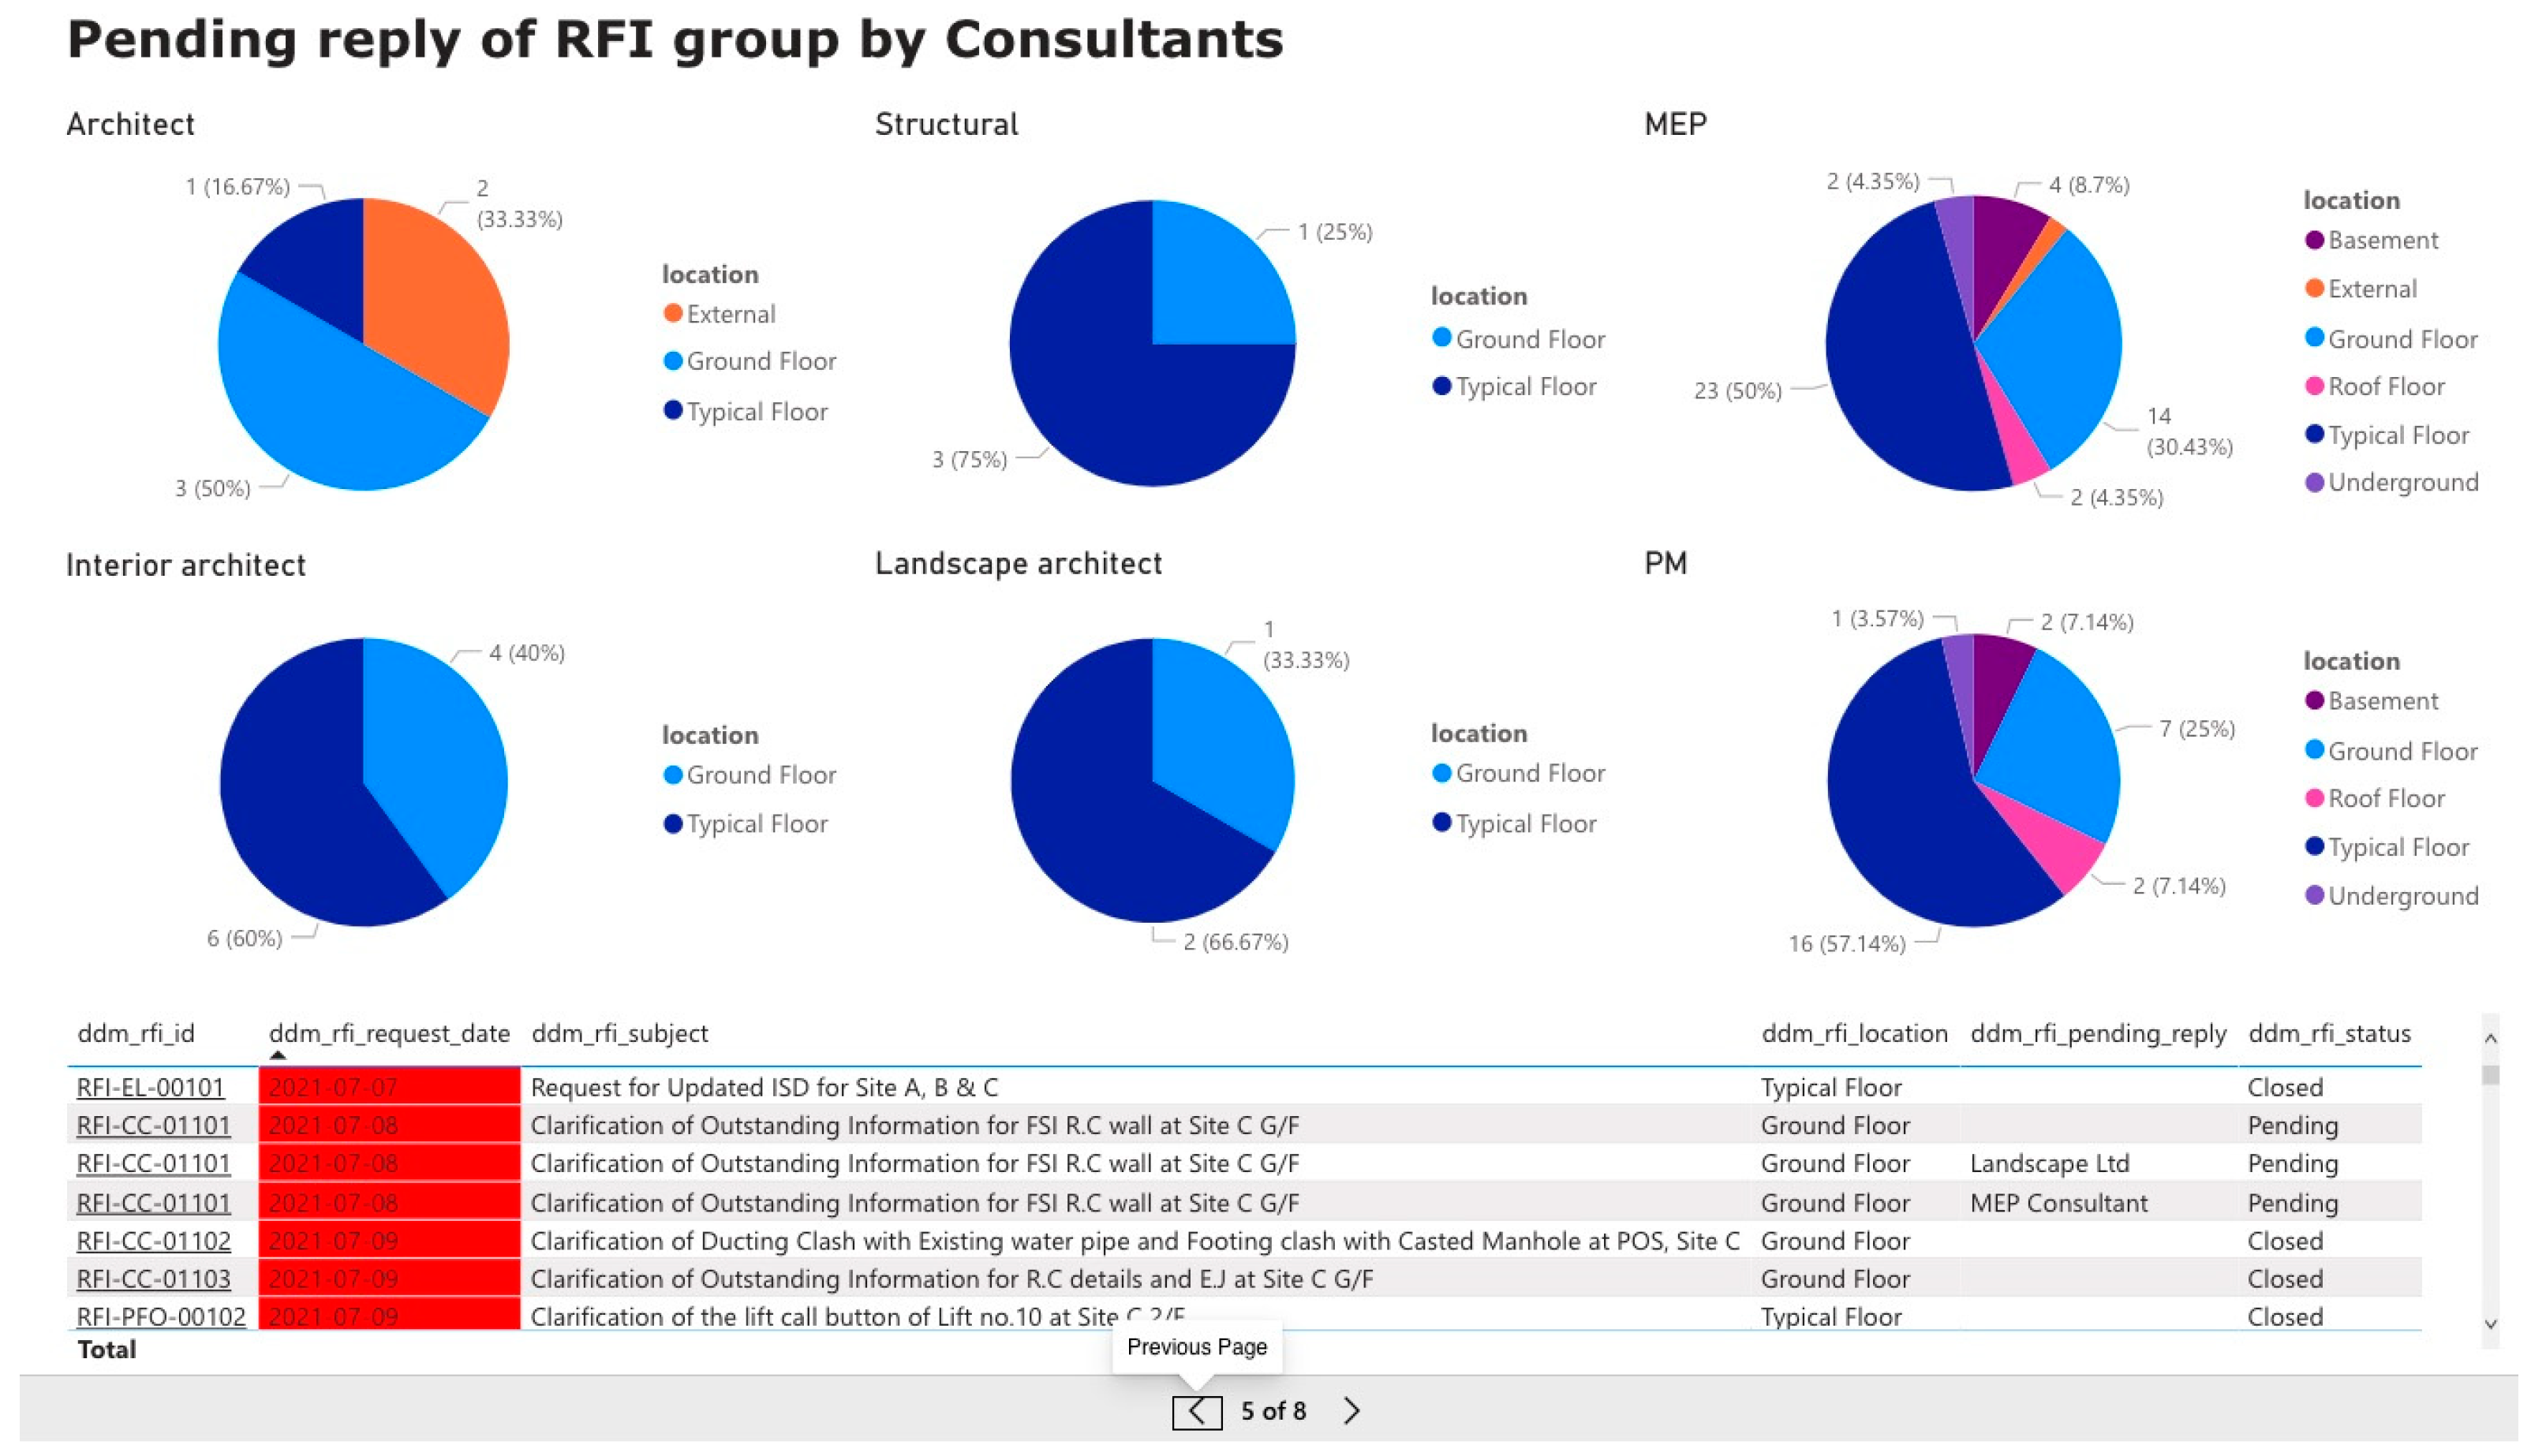
Typically, Technical Queries (TQs) at pre-construction stages (e.g., RIBA Stages 0–4) or site queries, in the format of Requests for Information (RFIs) during associated construction stages (e.g., RIBA Stages 4–5+), are generated by design consultants/others and can be issued in many different formats (e.g., by emails, typed word documents, handwritten memos, etc.). The key contents of these are then typically captured and aggregated via Excel-based registers by DM personnel. The DsDM web-based dashboard allows for the capture and collation of these TQs/RFIs. Summary reports appear in a project’s Common Data Environment (CDE), which hosts and visually presents key information from these queries for review, prioritizing, possibly onward routing, but ultimately addressing. However, the web-based dashboard does not just host conventionally created TQs/RFIs. On this project, the team also developed a new web-based form and associated cross-platform mobile app that allowed for electronic queries to be created ‘on the go’ (e.g., while on the jobsite) and uploaded to respective TQ/RFI schedules via ubiquitous computing tools such as a laptop computer or mobile cell phone device. Post-issue, an autogenerated email is sent to advise the Design Manager of new queries, who in turn can route these on to the best-placed project actor(s) to address the particulars. Using a programmed workflow to automate the task, total TQ/RFI data are ultimately synthesized within the respective schedules so that better management and control of all project TQs and RFIs occur.
Figure 4 gives an indication of this, showing how, via analytics, RFI data are presented visually and therefore more meaningfully in the web-based dashboard, adding value to the design management process.
5.2. Addressing Challenges of the Design Delivery Programme
Presently, although design programmes are routinely prepared on projects, the accurate monitoring of designer performance in terms of weather/not targeted design release dates are met by designers is unsatisfactory. Similarly, because of a long subsequent chain of activities following the design release, project-decision makers are too often unaware of the impact of poor performance by designers on the project in terms of the planned vs. actual design release dates. This is because, after design release is achieved, there are various steps: design approval(s), subcontract package procurement, subcontract award, and subcontractor lead times, and before trade contractors start their work packages on site. Therefore, without being explicitly aware of these logical relationships, it can be difficult to see how dates that are missed by designers can impact planned start-on-site dates several months later. Current approaches to tracking performance against Design Programme do not clearly reveal this impact, or indeed longer-term highlight trends of continually missing dates. These often involve tracking via Excel-based ‘Information Release Schedule’ (IRS) forms. The DsDM web-based dashboard corrects this by using such Excel-based data to better visually present such information for trend analysis and using a programmed workflow to semi-automate this activity.
Figure 5 gives an indication of how, via analytics, such data are presented visually and therefore more meaningfully in the web-based dashboard, adding further value to the design management process.
Plans to enhance these functions via the web-based prototype dashboard were shared back with various participants (amongst other targeted users), who acknowledged the value these would add to the DM role: “A monitoring system like that is really good […] that’s really powerful, because that’s the sort of thing that as a design manager I would have loved to have had.” (Participant 9), and: “I think, having something like that is a huge benefit. You just get a better view, and the design team manage it a lot better, and they’re being overseen. From a [project] control perspective, that’s quite important.” (Participant 8).
5.3. Additional Challenges Addressed
In addition to better coordinating and managing project-level design process interactions and better tracking of the work in progress of project-level design teams, other challenges addressed by the web-based prototype dashboard included:
The DsDM prototype dashboard allows project-level design management analysis to be undertaken by Design Managers. Above project-level and at the higher portfolio-level, CSO directors can also monitor and review a range of concerns across a range of projects that use the DDM dashboard, as indicated in
Figure 6.
Similarly, via a stand-alone associated application also developed for this project, design managers can compare and contrast published design information in PDF formats to identify any differences between revisions that have not been explicitly flagged by their publishers. Therefore, this helps spot any hidden changes that have not been identified by conventional clouding/bubbling on PDF drawings, as indicated in
Figure 7 and
Figure 8.
6. Discussion and Conclusions
Digital dashboards can provide businesses with near-real-time updates using data visualization, which allows for easier and more efficient display of complex data [
44]. This makes it easier for managers to understand key metrics and make informed decisions [
45]. Web-based dashboards can be accessed from any location with an internet connection, allowing the relevant stakeholders to stay informed and make decisions on-the-go. They can be shared among team members, allowing for improved collaboration and transparency. Various researchers have discussed how digital dashboards, using project data analytics, can help manage construction projects [
46,
47,
48]. Areas in which digital dashboards are deemed useful here include:
Real-time monitoring of design and/or construction activities to show which activities are on track and which are behind schedule, thus enabling informed decisions and corrective actions to be undertaken.
Collaboration, by allowing stakeholders to view the same information, so that everyone works from the same data set, can improve team communication and coordination.
Performance tracking, by providing visual representations of project performance, can make it easier to track progress and identify areas where improvements are needed.
In the context of the increasing adoption of digitally enabled design, Construction Design Managers face specific challenges that the use of a digital web-based dashboard could now better help alleviate. These include challenges around the management of project-related design activities, processes, people, and other resources to enable the effective flow and production of design information to occur. To date, no other digital dashboard is known that addresses these specific concerns. This research addresses this gap and the research questions set. In doing so, it achieves its aim of developing a bespoke digital web-based Design Management prototype dashboard to enhance the efficiency, productivity, and ultimately the effectiveness of the construction design managers (CDM) of a Case Study Organization (CSO).
This descriptive research reports on the development of the web-based prototype dashboard, produced as part of the current progress of a collaborative industry–academia Knowledge Transfer Partnership (KTP) project designed to tackle some of the challenges of the Construction Design Management role. A design science research methodology (DSRM) was employed to deliver the necessary KTP project stages. Addressing Project Stages #1 and #2, purposefully selected design managers were first interviewed to further uncover real-world DM concerns against those found in the knowledge base. These interviews revealed how problems of design coordination and designer performance monitoring remain key challenges worth addressing. Then, to address these concerns, a web-based DsDM prototype dashboard was developed during Project Stage #3, which uses project data to aid design coordination activity and facilitate DM task prioritization and reporting functionality. The prototype dashboard developed in this research project for the Case Study Organization offers several potential benefits for the Construction Design Managers in the Case Study Organization:
Enhanced Design Coordination: The dashboard can facilitate improved coordination among design team members by providing a centralized platform for real-time collaboration. This ensures all stakeholders can have access to up-to-date project information, reducing the risk of miscommunications and coordination issues.
Task Prioritization and Management: Design managers can prioritize tasks effectively using the dashboard, optimizing workflow and resource allocation. The tool allows for a systematic approach to managing design-related activities, ensuring that critical tasks receive the necessary attention.
Real-Time Monitoring: The dashboard can enable near-real-time monitoring of design production at both project and portfolio levels. This provides design managers with more rapid insights into progress, allowing them to identify potential bottlenecks and address issues quicker to ensure projects stay on track.
Trend Analysis in Designer Performance: Design managers can assess trends in designer performance over time using the dashboard. This analytical capability allows for a data-driven approach to identifying areas for improvement, recognizing high-performing individuals or teams, and making better-informed decisions to enhance overall performance.
Visual Reporting Capabilities: The dashboard’s visual reporting capabilities offer a more intuitive way for design managers to interpret and communicate complex project data. Graphs, charts, and visualizations enable quick comprehension of project metrics, fostering effective communication with team members and stakeholders.
Efficiency and Productivity Gains: By digitalizing selected design management processes, the dashboard contributes to increased efficiency and productivity.
Focus on Technical Queries (TQs) and Requests for Information (RFIs): The dashboard directs attention to Technical Queries (TQs) and Requests for Information (RFIs), allowing design managers to prioritize and address critical issues promptly. This focus ensures that the team remains responsive to technical challenges, reducing delays in the project timeline.
Customization for Project Contexts: Further development of the dashboard will enable adaptability, thereby allowing for customization based on the specific needs and contexts of different construction projects. Design managers can tailor the tool to align with project requirements, ensuring its relevance across a diverse range of scenarios.
Summarizing, by digitalizing selected design management processes to improve efficiency, and productivity, the visual reporting capability of the dashboard enables design production to be monitored at project and portfolio levels; trends in designer performance to be assessed and focus to be retained on technical queries (TQs) and requests for information (RFIs). In addressing Project Stage #4 by reporting on the development of this web-based Design Management prototype dashboard and illustrating how it can enhance design management productivity in construction firms.
Compared to previous studies in construction design management, this research uniquely focuses on addressing specific challenges related to design coordination and designer performance monitoring. While many studies still broadly discuss only the benefits of the likes of Building Information Modelling (BIM), this research instead dives deeper into the intricacies of design processes, identifying gaps in existing practices and targeting specific pain points. This study, therefore, complements existing literature but offers a more nuanced exploration of challenges associated with design processes and provides insights into the role of Construction Design Management that extend beyond espousing how the conventional benefits of BIM can support these actors. This study contributes significantly by reporting on the development of a tangible solution for Construction Design Managers in the form of a web-based Design Management prototype dashboard. This practical tool enhances digitalization in the realm of design coordination and management. The utilization of Design Science Research Methodology (DSRM) further sets this study apart. Here, DSRM adds a layer of innovation, showcasing a proactive approach to problem-solving. It emphasizes not only understanding challenges but also actively creating and implementing a solution to address those challenges. Collaborative efforts with a Case Study Organization (CSO) help bridge the academia–industry gap, ensuring industry relevance and practical applicability of the findings achieved through DSRM. In essence, the research contributes by addressing nuanced challenges within construction design management, resulting in a tangible tool, and further demonstrating the importance of collaboration between academia and industry.
Practitioners and researchers can propel the design management role into the future by adopting evidence-based tools like bespoke web-based dashboards. For practitioners, dashboards can be integrated for real-time insights and efficient decision-making. For researchers, the impact of these innovations can be explored to inform the continual improvement and development of such tools. Wider stakeholders should also recognize the pivotal role dashboards can play in improving design management outcomes in construction. These tools can enhance coordination, efficiency, and decision-making. By embracing the transformative potential of evidence-based dashboards, a more efficient and effective construction landscape can be shaped.
6.1. Implications for DM Theory and Practice
This research project holds implications for design management practice and broader theory. First, it contributes to the theoretical understanding of design management by identifying and addressing specific challenges related to design coordination and designer performance monitoring, enriching our understanding of the intricacies involved in managing design processes within the construction industry.
Second, the developed web-based Design Management prototype dashboard showcases that technology can be effectively integrated into design management practices. This has broader implications for the integration of technology in design management theory, emphasizing the role of digital solutions in optimizing coordination, prioritization, and monitoring within the design phase of construction projects.
The research also implies the importance of user-centred design principles in developing the web-based dashboard. This emphasis on creating tools that align closely with the needs and preferences of end-users contributes to the evolving theories of user experience and usability in the context of design management.
Moreover, collaborative efforts, such as this Knowledge Transfer Partnership (KTP) project with a Case Study Organization (CSO), help bridge the gap between academia and industry, highlighting the practical relevance of research outcomes. This fosters a more direct link between theoretical advancements and their practical applications, contributing to the overall alignment of design management theories with industry needs.
In summary, the research project contributes to design management theory and practice by highlighting and addressing specific challenges, emphasizing the role of technology, and fostering collaboration between academia and industry. These implications collectively inform practitioners in the field.
6.2. Limitations
This research has some limitations that also warrant acknowledgment. First, its scope is confined to developing a web-based prototype dashboard to address a specific set of design coordination and performance monitoring challenges within the context of a KTP project, which limits the generalizability of findings to broader industry scenarios. The collaboration with the single Case Study Organization (CSO) introduces potential bias as it may not fully represent the diverse challenges faced by different construction organizations. The semi-structured interviews held with purposefully identified design managers during Project Stage #2 (‘Problem Definition and User Requirement gathering’) also result in a limited sample size that may not capture the full spectrum of opinions and experiences within the construction design management community.
Moreover, the research was situated within a specific timeframe, so it may not fully account for technological advancements or changes in industry practices that occurred after the development of the prototype dashboard during this collaborative KTP project. Additionally, this research does not delve deeply into potential challenges related to user adoption, training, or resistance to change, all of which are critical factors in the successful implementation of digital tools.
6.3. Avenues for Future Research
Based on this project, a potential roadmap for future innovations in construction design management could unfold. First, an assessment of the developed web-based Design Management dashboard’s long-term effectiveness and user satisfaction within the Case Study Organization could be undertaken. Understanding user experiences and refining the tool based on principles of user-centred design and feedback could be applied to enhance usability and ensure that the dashboard aligns with the preferences and workflows of design managers. Exploring its performance across diverse projects and contexts would provide valuable insights into its scalability and adaptability.
Second, the study invites research into the integration of related advanced technologies into such dashboards to further optimize design management coordination and decision-making processes. The integration of artificial intelligence (AI) and machine learning (ML) technologies could be explored to enable any predictive capabilities of such dashboards. Algorithms could be created and implemented to anticipate any potential design coordination challenges, optimize task prioritization based on historical project data, and provide intelligent recommendations for improving designer performance. The incorporation of Augmented Reality (AR) with such dashboards for real-time design collaboration could be investigated, potentially allowing stakeholders to interact with design models to a greater degree. Similarly, potentially incorporating blockchain for enhanced data security on the dashboard may increase the trustworthiness of project data, especially in collaborative design management settings involving multiple stakeholders.
Third, there remain opportunities to delve deeper into the factors influencing the industry-wide adoption of digital tools, investigating potential barriers and facilitators to implementation. Comparative studies with alternative solutions would contribute to understanding the nuanced benefits of different approaches. Lastly, longitudinal studies tracking the evolution of design management practices over time and pre- and post-implementation of digital tools can provide a nuanced understanding of sustained impacts, including changes in efficiency, productivity, and overall project outcomes. These avenues could further enhance the field by advancing knowledge on the practical implications and continuous improvement of digital solutions in construction design management. This roadmap and the above-listed avenues for future research provide a trajectory of advancements, blending technology integration, user-centric design, and industry collaboration to continually innovate and optimize construction design management practices.


