Article

Augmented Data-Driven Machine Learning for Digital Twin of Stud Shear Connections

Department of Civil and Environmental Engineering, Chung-Ang University, Seoul 06974, Republic of Korea
*
Author to whom correspondence should be addressed.
Buildings 2024, 14(2), 328; https://doi.org/10.3390/buildings14020328
Submission received: 17 December 2023 / Revised: 19 January 2024 / Accepted: 21 January 2024 / Published: 24 January 2024
(This article belongs to the Special Issue Research on Construction Innovation and Digitization)

Abstract

:
Existing design codes for predicting the strength of stud shear connections in composite structures are limited when adapting to constant changes in materials and configurations. Machine learning (ML) models for predicting shear connection are often constrained by the number of input variables, resembling conventional design equations. Moreover, these models tend to overlook considerations beyond those directly comprising the connection. In addition, the data used in ML are often biased and limited in quantity. This study proposes a model using AutoML to automate and optimize the process for predicting the ultimate strength and deformation capacity of shear connections. The proposed model leverages a comprehensive dataset derived from experimental studies and finite element analyses, offering an advanced data-driven solution to overcome the limitations of traditional empirical equations. A digital twin model for the static design of pushout specimens was defined to replace existing empirical design codes. The digital twin model incorporates predictions of the geometry model, ultimate strength, and slip as input parameters and provides criteria for evaluating the limit state through a bilinear load–slip curve. This study advances predictive methodologies in structural engineering by emphasizing the importance of ML in addressing the dynamic and multifaceted nature of shear connection behaviors.

1. Introduction

Steel–concrete composite shear connections in bridge structures comprise three components: the concrete deck, the shear connectors, and the steel girder. The shear connector is welded onto the steel girder and is either embedded or encased in the concrete girder in order to resist horizontal shear forces in the composite structure as shown in Figure 1. Various aspects related to each component have been investigated, with research primarily focusing on two key areas. The first involves altering the type or shape of the components in order to evaluate and predict increased shear capacity. Another area of focus has been on enhancing shear strength by increasing the material strength of the components, leading to improved results. Bridge composite structures use various types of connectors, such as angles, channels, headed studs, and prefabricated ribs. Various studies have been conducted on different connector types, with headed studs being classified as the most commonly used connectors in bridge structures. Headed shear studs in composite structures have been explored since 1956, as documented by Viest [1]. A pivotal parameter in these early experiments was the depth-to-stud shank diameter ratio, which led to the identification of three distinct failure modes. Subsequently, empirical equations incorporating key design parameters, such as concrete strength, the area of the stud shank, and the tensile strength of the stud material, were incorporated in prominent design specifications, including the American Institute for Steel Construction (AISC) [2], Ollgaard et al. [3], and Eurocode4 [4] specifications. Despite these advancements, Pallares et al. [5] reviewed 391 experiments from the literature and revealed significant variability in predictions among current design codes. This variability poses challenges for designers seeking to ensure the reliable performance of shear connections, particularly considering recent innovations featuring high-strength materials and novel details for prefabricated members.
Empirical formulations for shear connections incorporating changes in geometry and increases in material strength are continuously proposed. The evolving landscape of shear connections necessitates a re-evaluation of existing design equations in order to incorporate these advancements and provide a more accurate and comprehensive predictive framework for designers. Table 1 and Table 2 list the equations used to calculate shear connection strength. Existing strength equations have a limited range because they are derived from experimental results from within a specific dataset, forming empirical equations. In addition, these equations often incorporate only a few variables that have been experimentally analyzed, restricting the consideration of variables within the conventional standard specimen system. In essence, the strength equations in existing formulations do not consider all elements comprising the shear connection and are limited by the variables considered in the respective experiments. This results in an ongoing demand for the continuous development of strength calculation equations that incorporate new variables and have a broader range, addressing the inherent limitations of conventional strength equations. However, integrating these formulations into design codes for use in the design phase is a time-consuming process. Simultaneously, the applicable ranges of the geometry and material strengths must be established, posing additional challenges. Empirical equations within the framework of structural design codes represent mathematical relationships or equations derived, not from theoretical principles, but from comprehensive observations and experimental data. These equations evolve from empirical data, often acquired through the rigorous testing of prototypes or by studying existing structures over extended periods. Widely employed in structural engineering, these equations serve as invaluable tools within design codes. They offer a simplified and practical means to predict crucial aspects of structural behavior, including load-carrying capacity, deflections, and other performance criteria. However, although empirical equations contribute significantly to practical design applications, they have inherent limitations and may not fully capture the intricacies of specific structural behaviors. Consequently, engineers commonly integrate empirical equations with more rigorous analytical methods and incorporate safety margins to ensure a practical and reliably safe design.
Machine learning (ML) models offer a promising solution to overcome the inherent limitations of traditional empirical equations by providing a more adaptive and data-driven methodology. Unlike empirical equations, which are often constrained by simplicity for ease of use, ML models exhibit greater flexibility in handling more parameters. This expanded parameter capacity enables the inclusion of additional factors that considerably influence structural behavior. In contrast to relying solely on predetermined equations, ML models learn from datasets. This capability enables them to capture intricate and nuanced relationships that may prove challenging to express using conventional empirical equations. Furthermore, the dynamic nature of ML allows for continual improvement, as these models can be systematically updated and retrained when fresh data become available. This adaptability ensures their relevance under evolving conditions and facilitates the assimilation of information related to novel construction details, contributing to a more robust and responsive approach to structural engineering applications.
ML models can provide insights into the importance of different features, aiding engineers in understanding the parameters with the most significant impact on structural response. This information can guide the development of more accurate and targeted empirical equations. ML models, particularly advanced models such as neural networks, can achieve a higher prediction accuracy than traditional empirical equations. This is particularly valuable when dealing with complex structural behaviors.
However, applying ML to engineering presents challenges. Some ML models, particularly complex ones, such as deep neural networks, can be challenging to interpret. Engineers may need to understand the model’s decisions and ensure that they align with engineering principles. The success of ML models depends on the quality, quantity, and representativeness of the training data. Data bias can also lead to biased predictions. ML models often require large amounts of data for training. Obtaining sufficient high-quality data on specific construction details is challenging.
The traditional paradigm for acquiring data in ML involves a dual approach: data-driven methods, and the use of physics-informed neural network (PINN) models. Data-driven methods face challenges due to the high costs associated with the collection of experimental data, whereas the latter approach, relying on PINN models grounded in physical knowledge, faces challenges in adapting to structurally complex models [12]. Consequently, structural assessment follows a historical methodological continuum. This encompasses empirical formulations derived from experiments and the exploration of strategies involving the creation of finite element method (FEM) models. This dualistic strategy aims to overcome the challenges posed by limited data availability and the intricate nature of structural behaviors, providing a comprehensive framework for structural evaluation from past to the present.
Various advanced and continually evolving ML models have been proposed. They include standalone models, such as linear and nonlinear regression models, and models adept at handling many features, such as decision tree models. Subsequently, the emergence of ensemble models, in which diverse independent models are amalgamated, have marked a significant development. An ensemble model integrates multiple individual models in order to collectively enhance predictive performance. Notably, using various well-performing models culminates in an ensemble approach. Finally, the refinement journey reaches its peak through the implementation of a voting mechanism, wherein a diverse ensemble of models actively participates in the decision-making process. This strategic amalgamation harnesses the strengths of multiple models in order to yield a final prediction, considering their diversity.
This study introduces the development of an augmented data-driven digital twin for stud shear connections. First, various elements comprising the shear connection are considered as input data and treated as parameters for strength prediction. Subsequently, a method is proposed to address the challenges of limited and biased datasets by utilizing the components of pushout tests as inputs to finite element models and their resulting ultimate strength values. This approach supplements the conventional data collection process by filling in information within relatively scarce and biased data ranges using finite element data. This mitigates the issues of underfitting or overfitting in ML models, caused by insufficient data, and compensates for the limitations of hard-to-obtain experimental data. Furthermore, this study introduces an ML prediction model based on experimental data related to deformation capacity. The model employs the AutoML approach using the PyCaret library (Python Library for Classification and Regression Train) [13], selects the five best models from various ensemble models, based on the decision tree model, and derives results through voting. This method reduces overfitting and model dependency, ensuring that future model improvements do not disrupt the overall framework. Through continuous data collection and ML model updates, this approach presents a stable procedure and suggests a process for replacing design codes. Therefore, a framework capable of continuous data collection and improved machine model acceptance is defined as a one-way digital twin at the design stage. A digital twin model predicts the ultimate states of the model based on input variables, using bilinear load–slip curves during the design phase. The overall process and flow of this study are as shown in Figure 2.

2. Literature Review
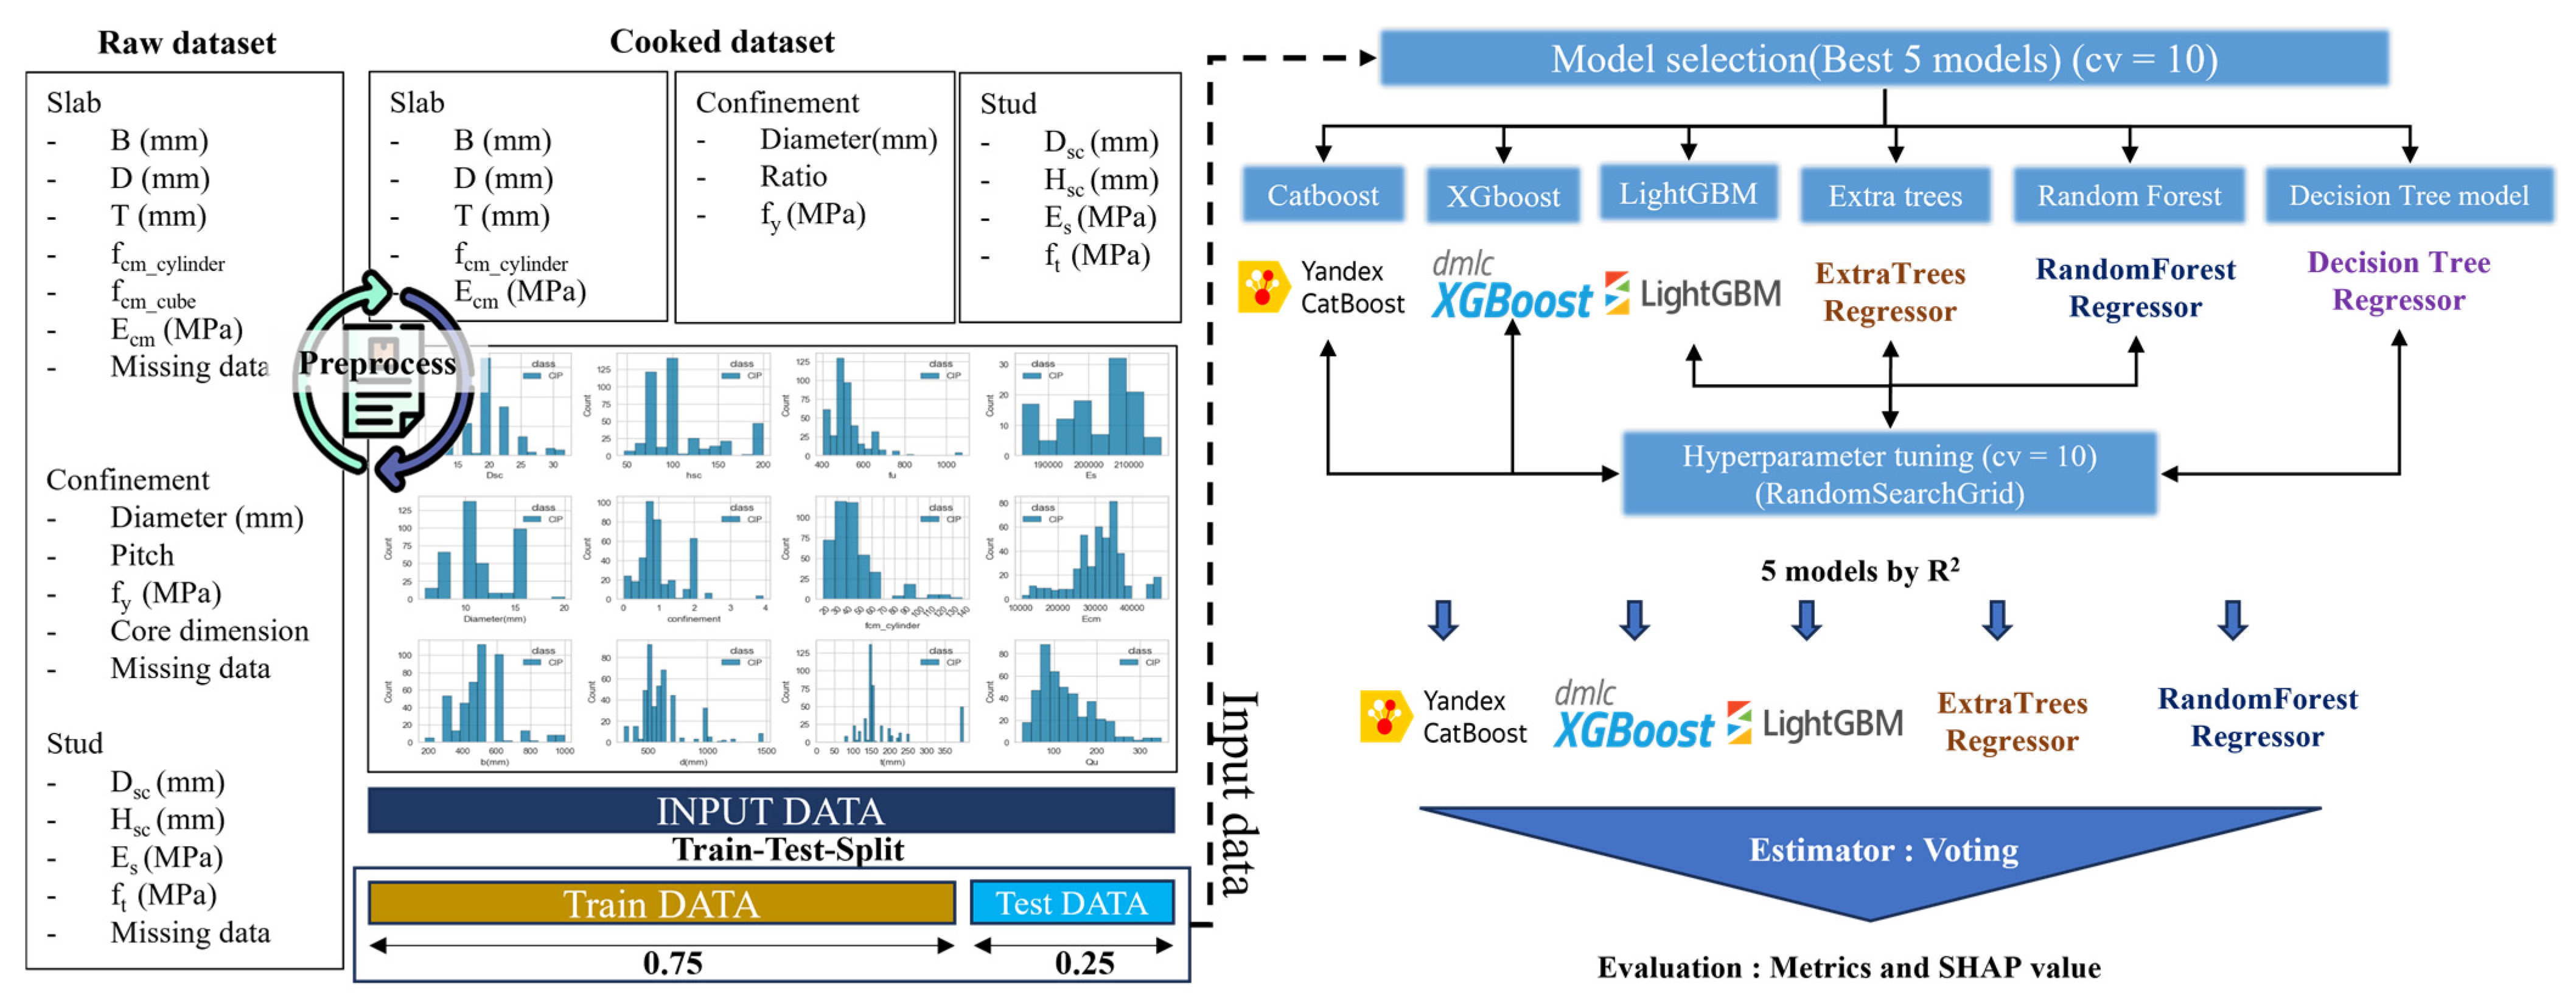
Ultimate shear strength prediction in current design codes relies on experimental investigation results. Most design codes propose predictive equations based on pushout tests. Viest [1] developed the first pushout test involving headed-stud connector capacity. Ollgaard et al. [3] performed 48 pushout tests for normal-weight and lightweight concrete and developed predictive equations for ultimate shear strength and the load–slip relationship. Li [14] investigated normal-strength concrete (NSC) and high-strength concrete (HSC), revealing a significant influence on the shear capacity of headed-stud connectors. Kim et al. [15] tested 15 thin ultra-high-performance concrete (UHPC) slab specimens. Wang et al. [16] investigated the use of large-diameter studs (30 mm) in UHPC slabs.
Considering the effect of reinforcement in concrete slabs is crucial, as it is related to the concrete failure mode and significantly influences shear capacity. Oehlers et al. [17] confirmed the significance of transverse reinforcement for controlling cracks in NSC, which can reduce the ultimate strength of stud connectors. Prakash et al. [18] considered the confinement ratio calculated using transverse reinforcement as a means to improve shear capacity, particularly for high-strength studs. Kumar et al. [19] examined the impact of reinforcement details.
The geometric properties of stud connectors also affect shear capacity. Okada et al. [20] examined the arrangement of studs grouped together and concluded that the shear resistance was lower than the shear strength required for shear failure in a standard stud arrangement. Similarly, Xu et al. [21] observed a decrease in shear strength when studs were arranged in groups. Xue et al. [22] recommended emphasizing the quality control of the influence of a stud-welding collar. Xue et al. [23] investigated the quantity and spacing of studs and confirmed that shear resistance was higher in single-stud arrangements than in multi-stud arrangements. Huang et al. tested 13 pushout specimens and found that the spacing and position of stud connectors have a significant influence on stiffness and strength [24].
Research on using large-diameter studs with high ultimate strengths has gained attention owing to their potential advantages in practical applications. Badie et al. [25] confirmed the effectiveness and safety of the 1998 version of the AASHTO LRFD for predicting ultimate shear strength, particularly for large-diameter studs (31.8 mm). Shim et al. [26] found that Eurocode4 tended to underestimate the shear strength of studs with 25, 27, and 30 mm diameters. Wang et al. [27] performed 12 pushout tests in order to investigate the effects of large-diameter and high-strength headed studs. Yang et al. [28] investigated large-diameter and high-strength welded stud connectors through 14 tests.
Several studies have been conducted on the applications of precast concrete slabs. Shim et al. [29] performed pushout tests on precast decks using non-shrink mortar. The thickness of the bedding layer was found to have a significant impact, with higher bedding layers resulting in reduced shear capacity. Wang et al. [30] investigated the arrangement of large-diameter studs in precast UHPC slabs filled with UHPC mortar. Semendary et al. [31] investigated UHPC prefabricated deck shear pockets with large-diameter studs.
Numerical methods, such as finite element modeling, offer viable alternatives widely applied in engineering. Structural analysis often employs the finite element method (FEM) to simulate structural and material behaviors. Lam et al. [32] used the FEM to replicate past pushout tests and investigate stud connectors in composite structures. Nguyen et al. [33] utilized FE modeling for large-diameter studs, and investigated 32 parametric cases with stud diameters ranging from 22 mm to 30 mm and concrete compressive strengths ranging from 25 MPa to 65 MPa. Qi et al. [34] examined the static behavior of headed studs through numerical simulations using an FE model.
In the ML domain, supervised learning algorithms, such as regression and classification models, are powerful tools for predicting outcomes based on input data. These models can identify patterns and relationships within the training data, uncovering potential hidden connections that may challenge conventional analytical equations. A notable feature of ML models is their remarkable strength in handling a multitude of features. This capability enhances the accuracy of shear capacity predictions, allowing the model to encompass a broader spectrum of factors and intricate interactions.
ML has applications in various domains, particularly in structural fields. ML models for classification have proven valuable for damage detection in structures, as evidenced by studies on bridges [35,36,37,38], beam/column members [39,40,41], plate/panel members [42,43], and joints [44,45]. Regression models have applications in various predictive tasks, addressing shear resistance in beams [46,47], slabs [48], joints [49,50], axial strength of concrete columns [51], steel columns [52], concrete-filled steel tube (CFT) columns [53], deflection of concrete beams [54], and data-driven optimization for torsion design of CFRP-CFST [55].
The application of ML regression models for estimating the shear resistance of stud connectors in composite structures has also been explored. Table 3 lists the relevant ML study for prediction of shear resistance in shear connection. Abambres et al. [56] proposed an artificial neural network (ANN) model to predict shear resistance. Setvati et al. [57] used six ML regression models to demonstrate the superiority of ML models over current design codes. In addition, Degtyarev et al. [58] expanded research on two typical cases (NSC and light-strength concrete (LSC)), with a reliability evaluation, according to design codes using nine ML regression models. Avci-Karatas et al. [59] highlighted the use of advanced ML techniques, such as minimax probability machine regression and extreme ML, in order to enhance the accuracy and precision of ML models. Zhu et al. [60] developed an ML model that combines an ANN model with several advanced hyperparameter optimizations, such as an ANN-particle swarm optimization (PSO) and an ANN-improved eliminate particle swamp optimizer (IEPSO). Zhang et al. [61] studied shear resistance predictions for specific types of concrete strength (including HPC and UHPC) with ML models. Yosri et al. [62] used an adaptive network-based fuzzy inference system (ANFIS) in order to focus on the sensitivity of input parameters and the optimal combination for model performance.

3. Dataset

The data collection process involved performing separate tests for ultimate strength and ultimate slip. However, data collection for the ultimate slip through FEM was not performed owing to the significant influence of the input values related to the weld joint of the studs, the interface between the concrete slab and steel girder, and the yield range of the material model. In addition, the data collection process did not include collecting data for slip or strength in the elastic range. The elastic range was not considered for the direct elastic values of the connection because it was heavily influenced by the initial and boundary conditions of the model.

3.1. Preprocessing

After data collection, preprocessing was performed in order to structure the dataset for input into the ML model. The mean compressive strength of concrete in a cubic specimen is often converted into that of a cylindrical specimen using a ratio. No universal rule has been established for NSC and HSC, resulting in variations of approximately 0.8. Elwell [63] proposed a range of ratios from 0.65 to 0.9, while CP110 [64] suggested a value of 0.85. For the data representing the compressive strengths of the cylindrical ( f c y l i n d e r ) and cubic ( f c u b e ) specimens applied during the shear connection studies, the values were processed into cylinder strengths using the transformation in Equation (1).
f c y l i n d e r = 0.85   f c u b e .
Furthermore, when the characteristic and mean experimental strengths of concrete were cited concurrently or separately, the data preprocessing involved Equation (2) from Eurocode2 [65] or the direct utilization of the mean experimental strength values.
For studies that explicitly present the modulus of elasticity of concrete through experimental tests, the values were directly cited. However, for studies that did not specify the modulus of elasticity, Equation (3) from Eurocode2 [65] was used to calculate the modulus of elasticity.
f c m =   f c k + 8   ( M P a ) ,
E c m   = 22,000 × ( f c m 10 ) 0.3 ( MPa )
where
f c m =Mean value of concrete compressive strength;
f c k =Characteristic value of concrete compressive strength.
The transverse reinforcement ratio for the lateral confinement effect of the transverse core reinforcement, which provides confinement to the shear connection, was incorporated into the data structure by converting it into a confinement ratio. The confinement ratio was calculated using Equation (4) [66].
ρ = A s s b c ,
where
s =Pitch of lateral confinement steel;
b c =Core dimension, center-to-center perimeter of lateral confinement;
A s =Area of lateral confinement steel.
The tensile strengths of the steel studs were converted from nominal values to real or test mean values. Some studies have provided a nominal value, guaranteed to be the minimum value in the test sample, which may not reflect actual material behavior in experiments. The conversion between two values was formulated based on a collection of the mean and nominal values of the stud ultimate strength in over 100 pushout experiments. Normally, steel studs are fabricated according to ASTM A108 [67]. The nominal ultimate strength of this steel is 400 MPa, with real values ranging from 430 MPa to 600 MPa. This study used a conversion factor of 0.83, the median value of the lognormal probability density function, within the tensile strength range of all the studs in the dataset.
In cases where the components and material strengths constituting the pushout model were not mentioned, the missing data for the respective features were replaced with the mean values of those features. Figure 3 represent the correlation matrices for each feature in the dataset collected for the prediction of strength and slip.

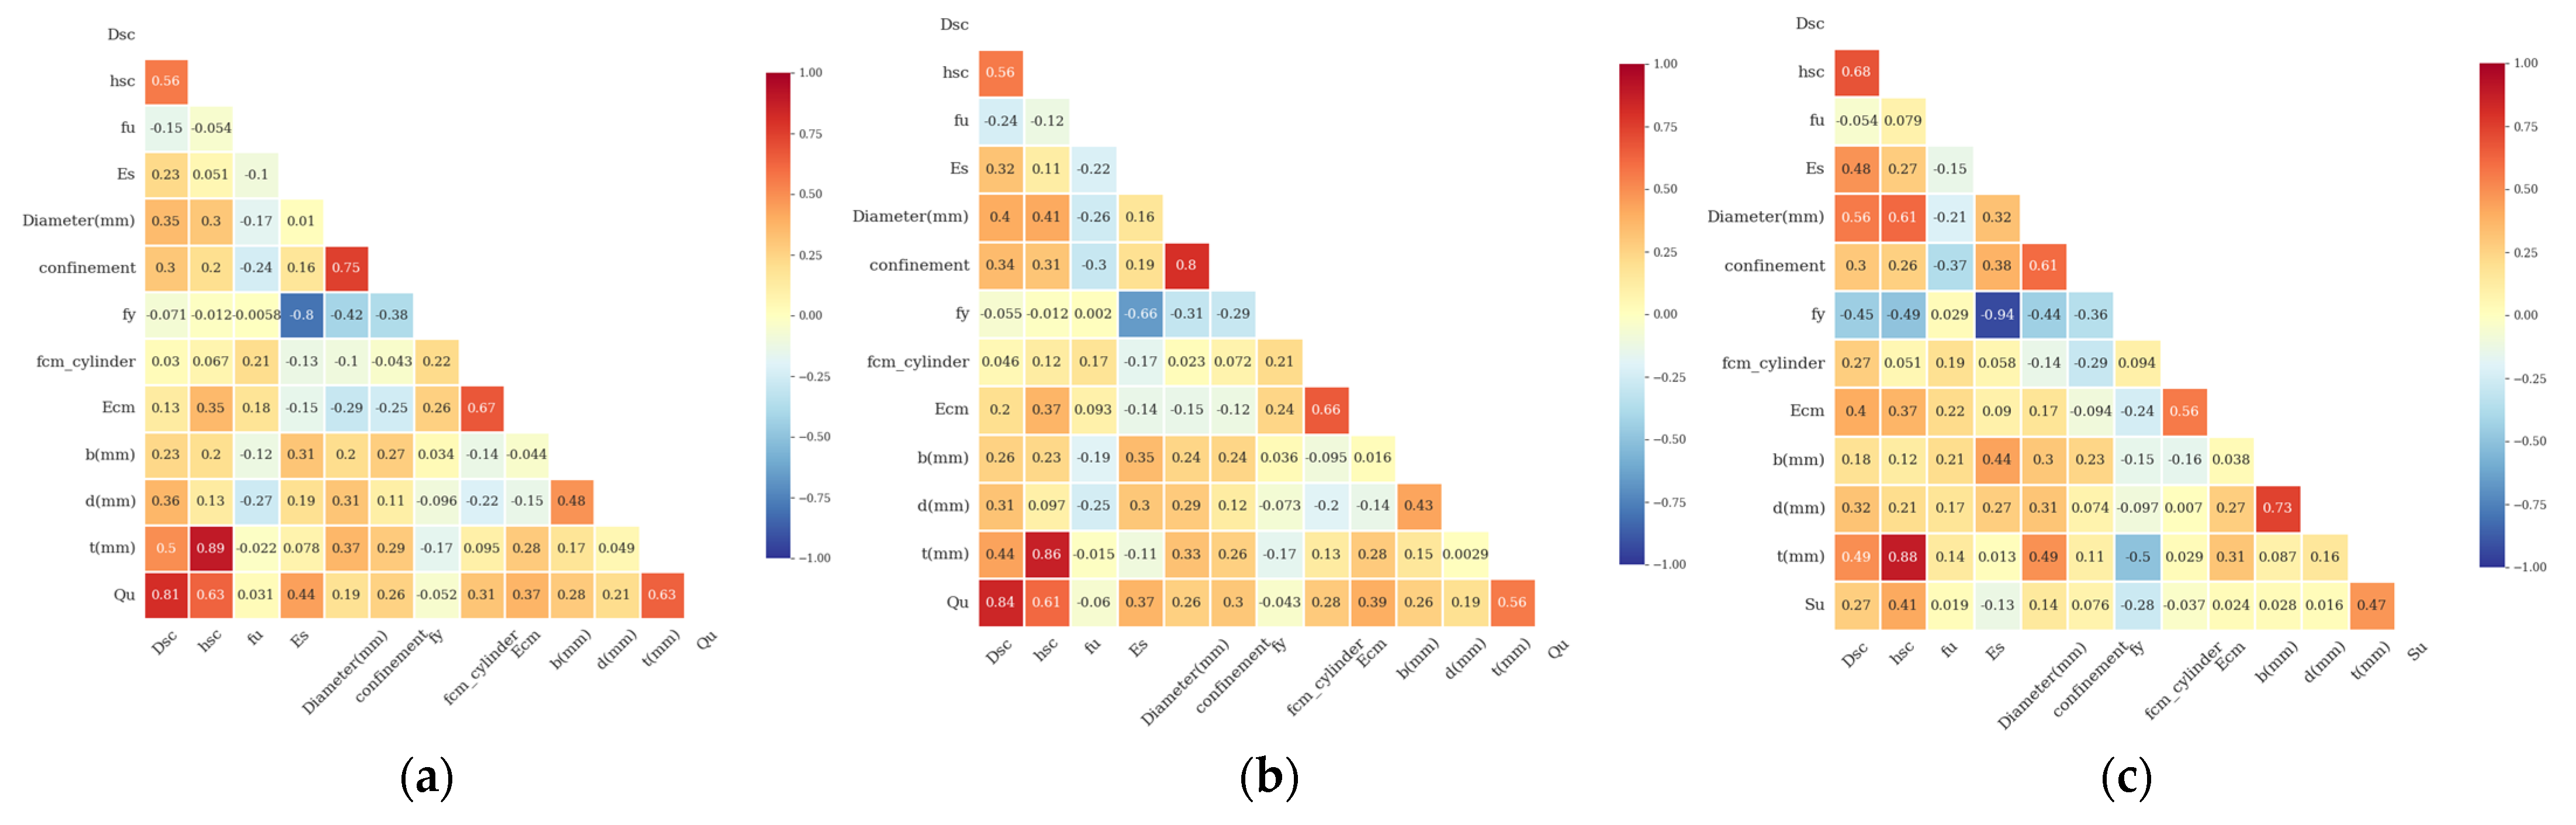
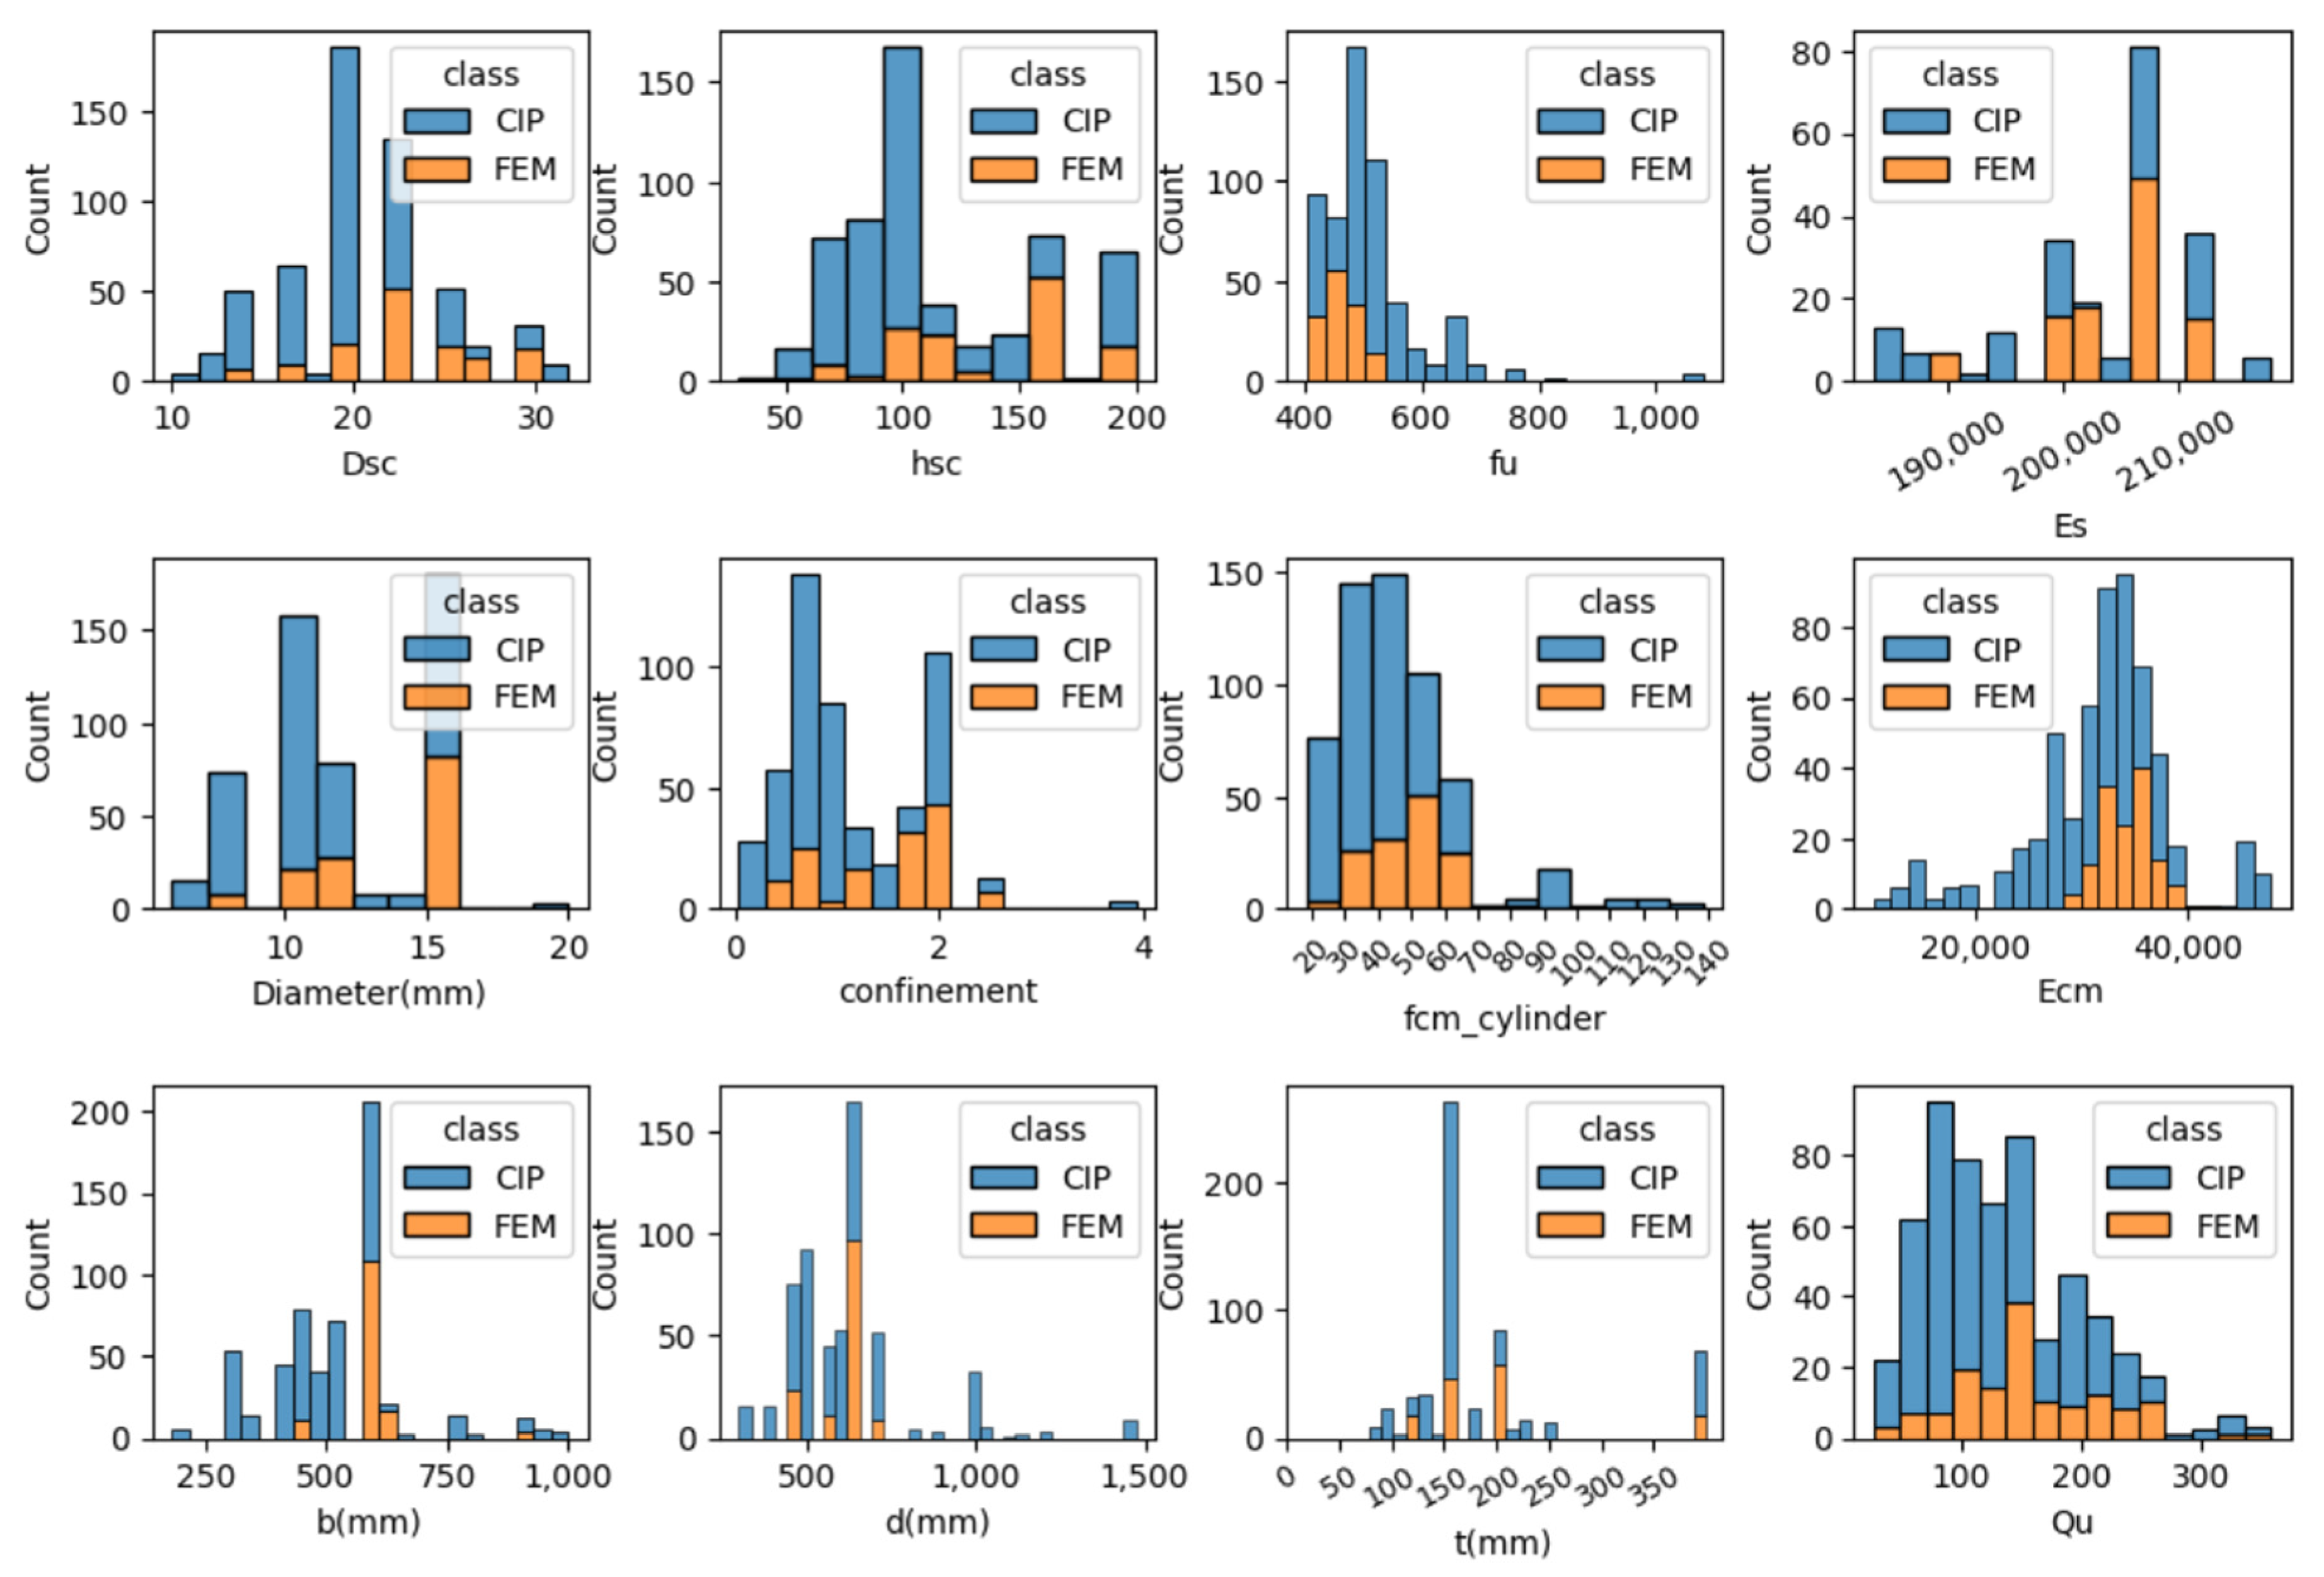
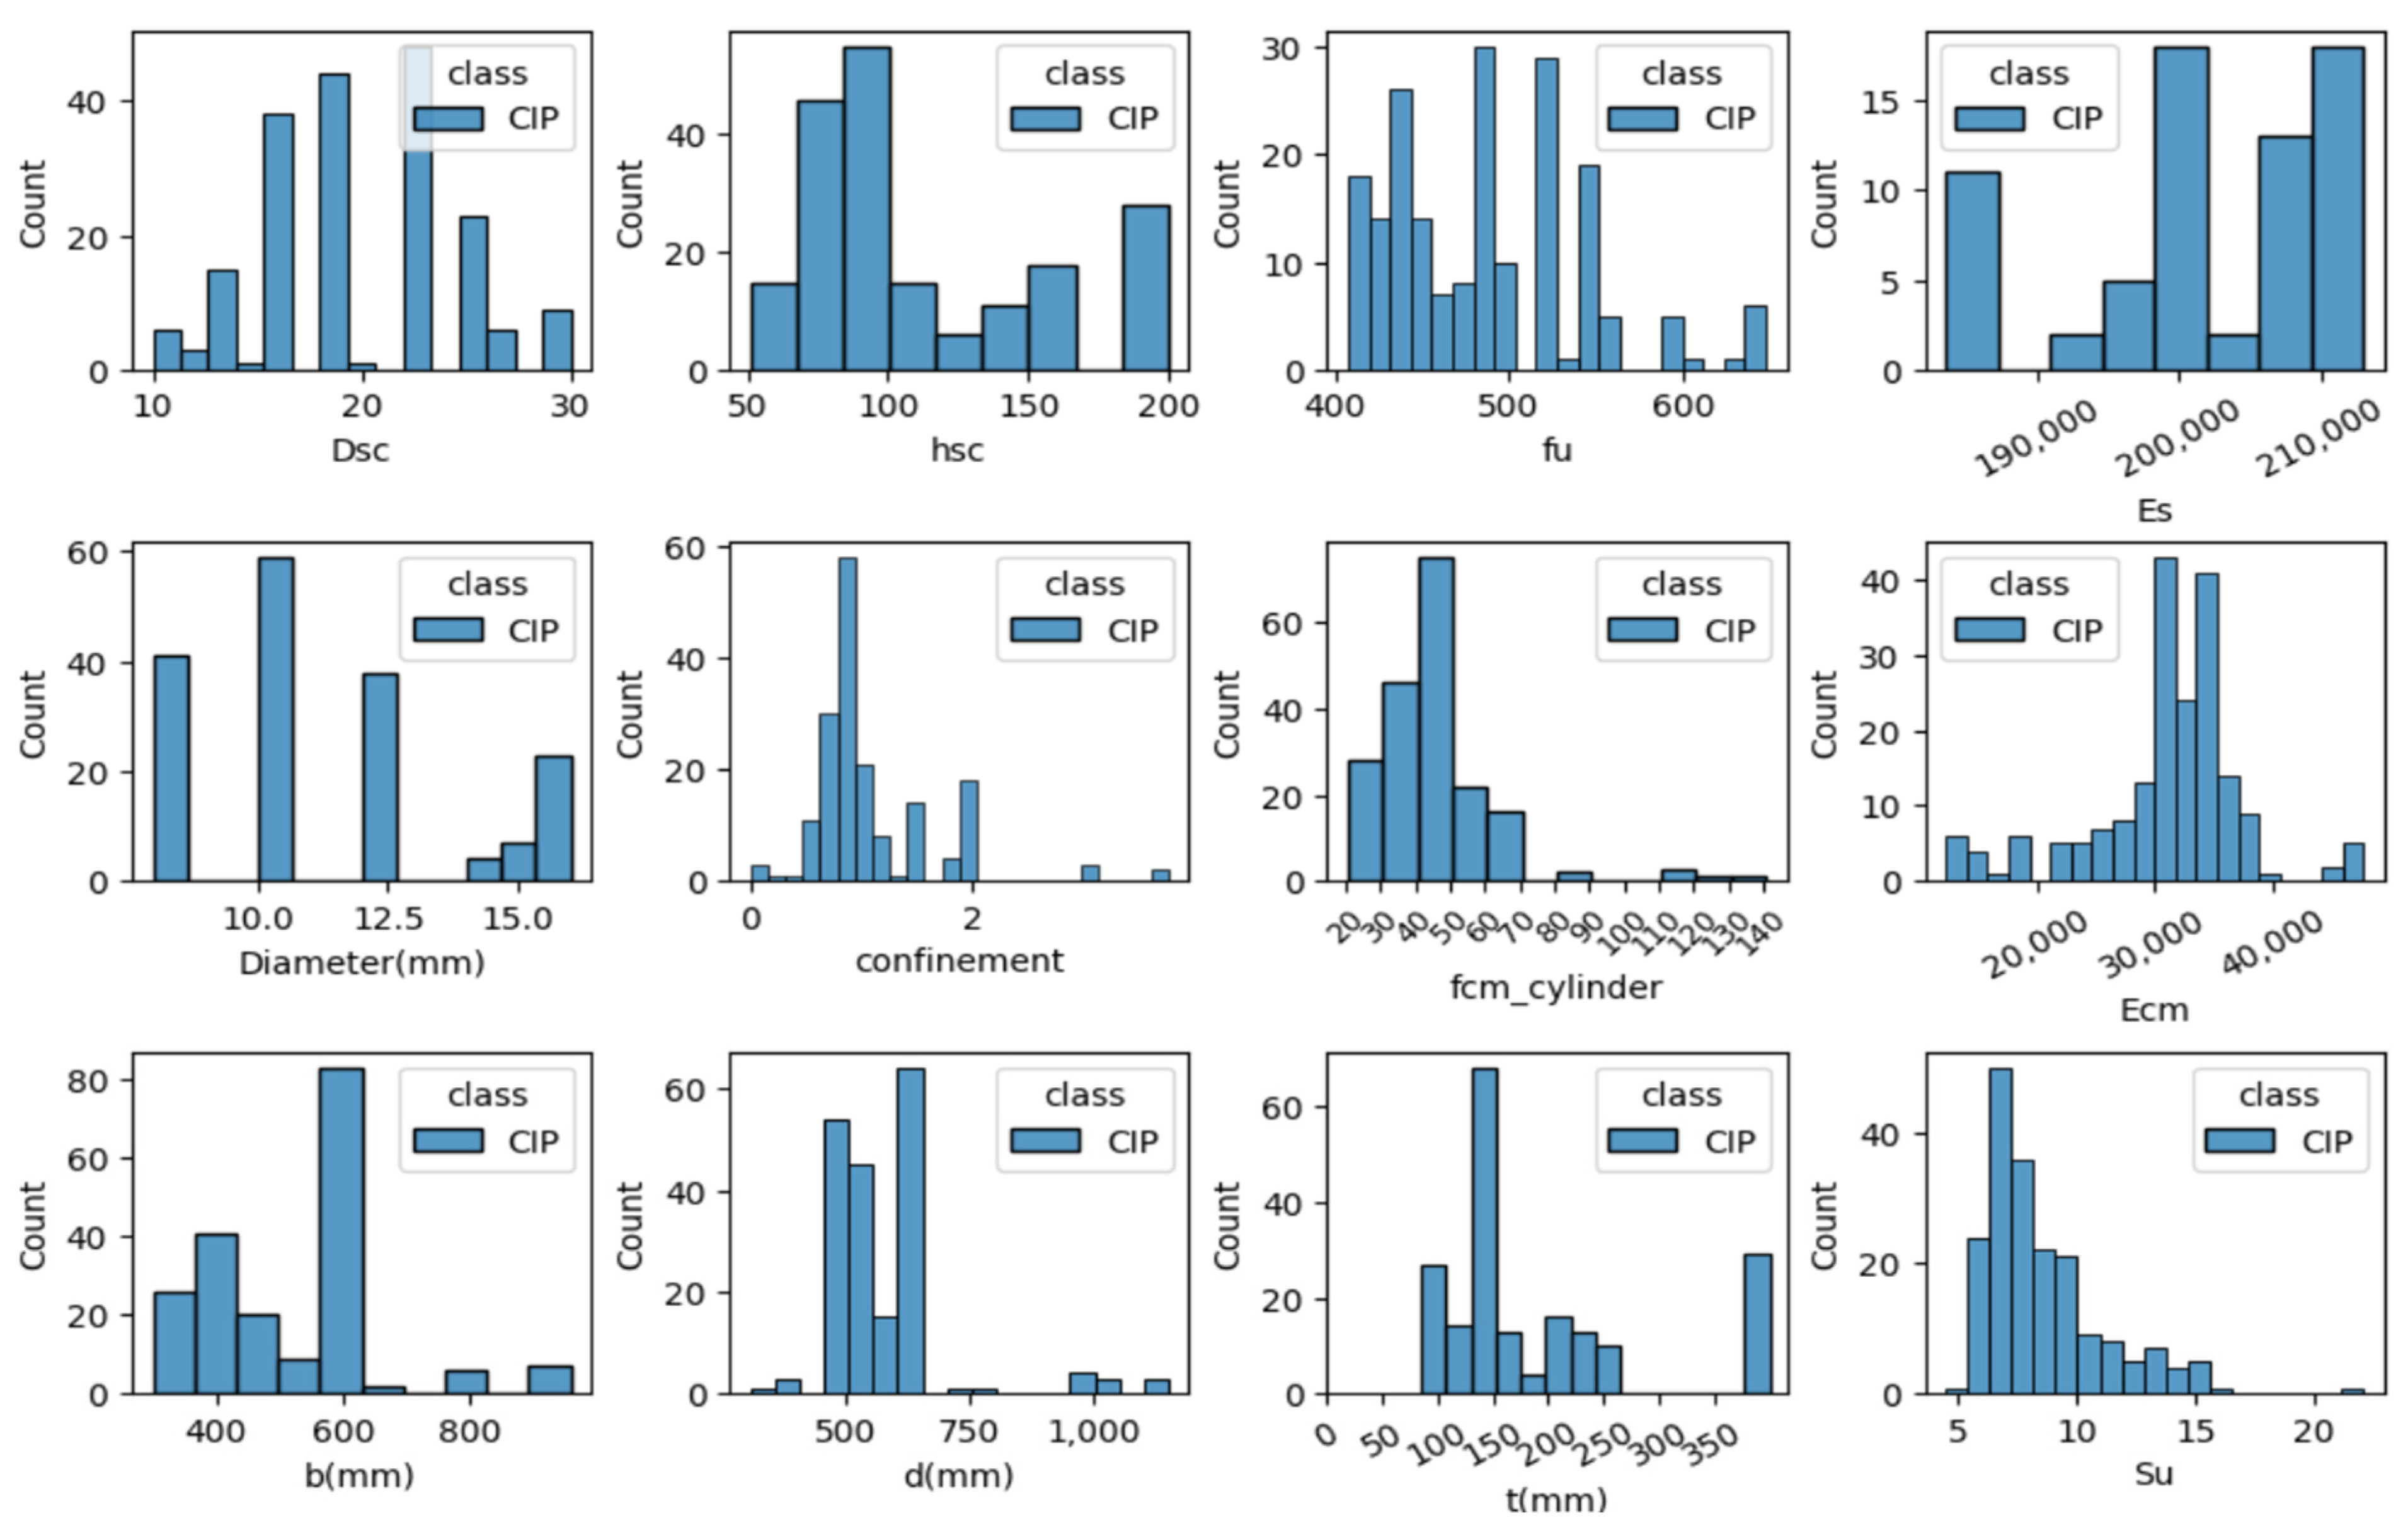
3.2. Dataset for Strength Prediction

Data collection involved obtaining 431 records from experimental pushout tests, denoted as the pushout experimental dataset [1,3,14,15,16,20,23,25,26,27,28,30,68,69,70,71,72,73,74,75,76,77,78,79,80,81,82,83,84,85,86,87,88,89,90,91,92,93,94,95,96,97,98,99], and 139 records from the FEM, referred to as the FEM dataset [32,33,91,98,100,101,102,103,104]. The experimental dataset was specifically named as the “pushout experimental data,” while the combined set of experimental and FEM data was called the “augmented data.” The collected and preprocessed data comprised twelve features, organized into four input variables and one target variable. The input variables included the geometric dimensions of the concrete slab (b(mm), d(mm), t(mm)), the geometry-related values of the studs (Dsc, hsc), the configuration parameters of the internal restraints in the slab (confinement ratio and diameter), and the material properties of various components (tensile strength (fu) and modulus of elasticity (Es) of the stud, concrete modulus of elasticity (Ecm), average compressive strength of concrete cylinders (fcm), and yield strength of confinement reinforcement (fy)). The target variable was the ultimate shear strength (Qu) of the shear connection. Figure 4 shows the data distribution for each feature.
The distribution of the collected experimental data revealed a significant bias, particularly concerning the diameter, height, and strength of the studs, as well as the compressive strength and the modulus of elasticity of the concrete, elements emphasized in existing design codes. Notably, the collected data exhibited a strong bias toward experimental setups that directly or indirectly influenced the design code, with a relatively limited representation of data for larger diameters or high-strength materials. Figure 3 shows the correlation matrices for various data characteristics before and after the augmented integration. The results confirmed that the composition of the collected data and characteristic values within the data significantly influenced the correlation. In the correlation matrix of the augmented data, the relationship between shear strength and larger diameters was further accentuated, whereas the tensile strength of the studs negatively affected the strength. The collected FEM data, designed to study the influence of stud diameter and concrete strength rather than the tensile strength variables within the analysis, demonstrated unexpected effects because they were fixed at the same tensile strength across the analyses. In addition, the relationship between stud diameter and shear strength was found to have a more significant influence than the proportional relationship between the concrete and shear strengths. This resulted in the relatively lower impact of concrete strength in the final augmented data. Such variations in the correlations indicate that the predicted strength can change significantly based on data composition.

3.3. Dataset for Slip Prediction

Data for the ultimate slip were collected from 194 pushout tests [1,15,16,20,22,23,25,28,69,78,80,81,82,83,84,87,90,91,92,93,97,98,99,105,106,107,108,109,110]. The target feature was the ultimate slip value (Su) of the shear connection. The ultimate slip values measured in the pushout experiments exhibited considerable variability. Various factors, including the criteria for assessing ultimate slip and deciding to terminate the experiments at different time points, influenced the determination of slip values. Consequently, the slip values provided may not necessarily represent the true ultimate slip values inherent to the actual specimen. Similar to the dataset for strength prediction, the experimental slip data comprised the dimensional and material values applied to typical specimens, as shown in Figure 5. Data on high-strength and large-diameter specimens are relatively scarce. Owing to the limited amount of data, confirming the overall correlation between the input features and slip was challenging. Nevertheless, the correlation coefficients among the features within the experimental data composition for slip prediction, as illustrated in Figure 3c, revealed that unlike strength, the thickness of the concrete slab and the height of the stud, which are related to stiffness, exhibited a directly proportional relationship with the ultimate slip.

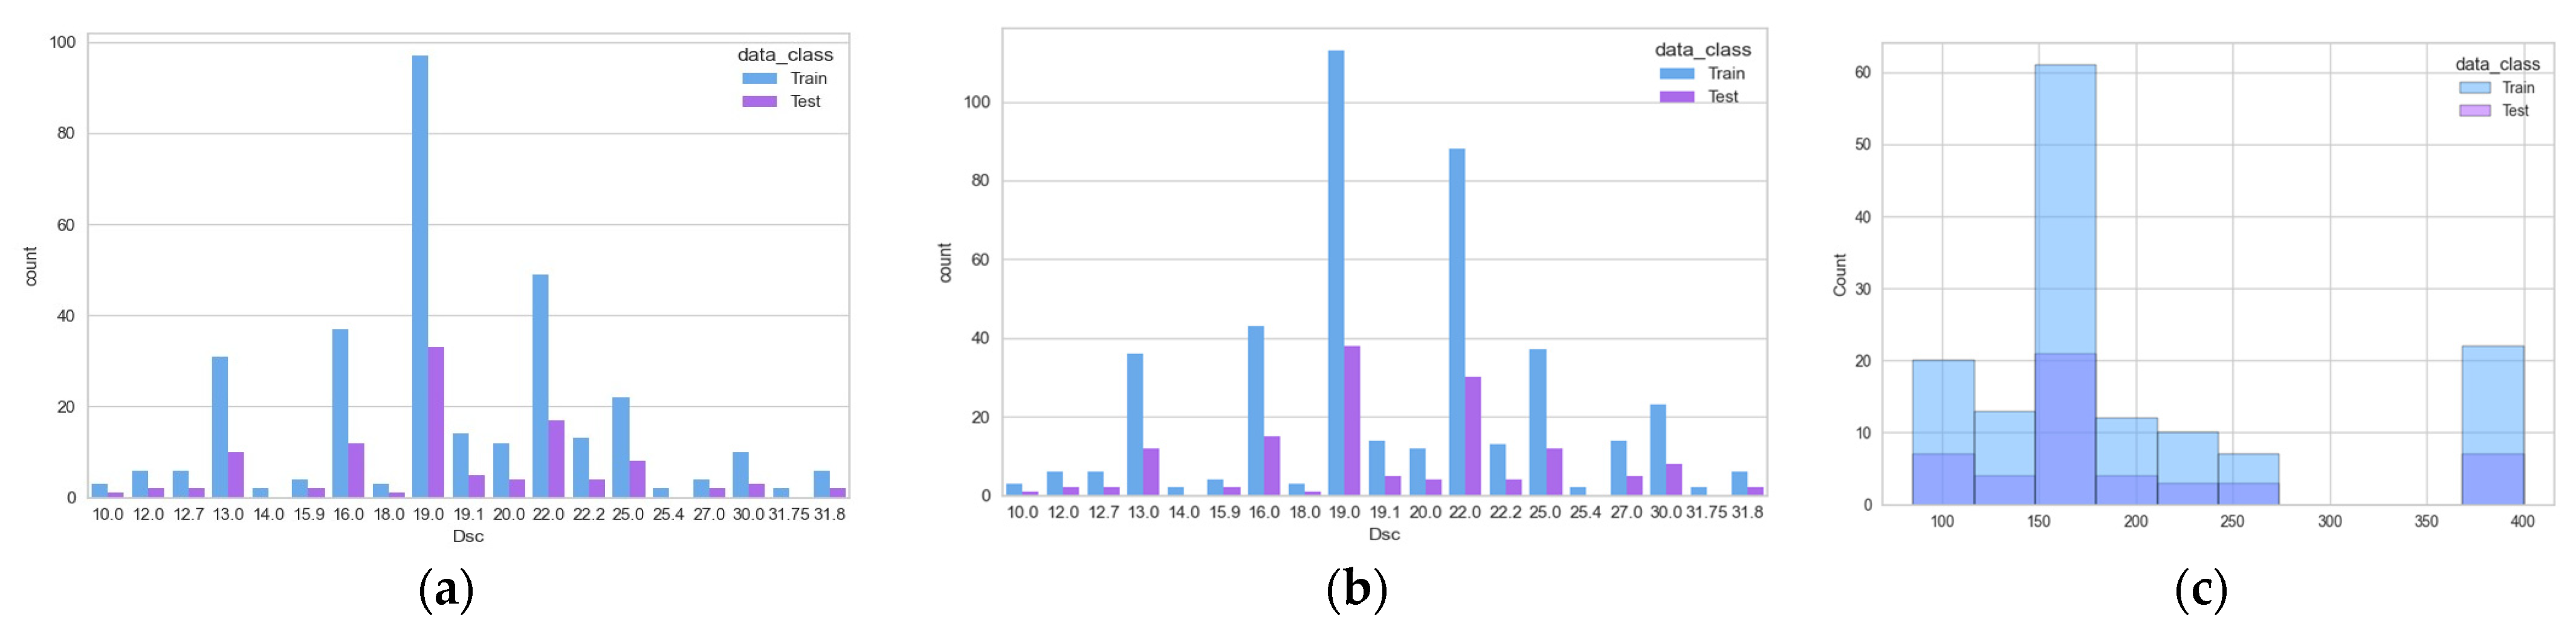
3.4. Data Split for Training and Testing

In the ML model, the overall data composition for learning was divided into training and test datasets. This study used a 0.75:0.25 training-to-test data ratio. In order to divide the data, a stratification method was employed by selecting a single feature as the criterion. In addition, to prevent overfitting and ensure generalization with a limited amount of data, cross-validation was performed using the K-fold method with 10 folds (cv = 10).

3.4.1. Data Split for Training and Testing (Ultimate Strength)

In order to configure the experimental data for strength prediction, the correlations between features were considered, and the stratification method was employed to partition the data, considering the stud diameter feature (Dsc). As shown in Figure 6, the stud diameter ratio in the training and test datasets was maintained at 0.75:0.25.

3.4.2. Data Split for Training and Testing (Ultimate Slip)

In order to predict the ultimate slip in the dataset, the data was split based on the thicknesses of the concrete components exhibiting the highest proportional relationship with the target feature, slip (Su). To achieve this, the thickness range was uniformly divided into intervals, and each section was assigned a class. The training and test datasets were then structured using a class-specific stratification method in order to ensure a consistent distribution across the split sections.

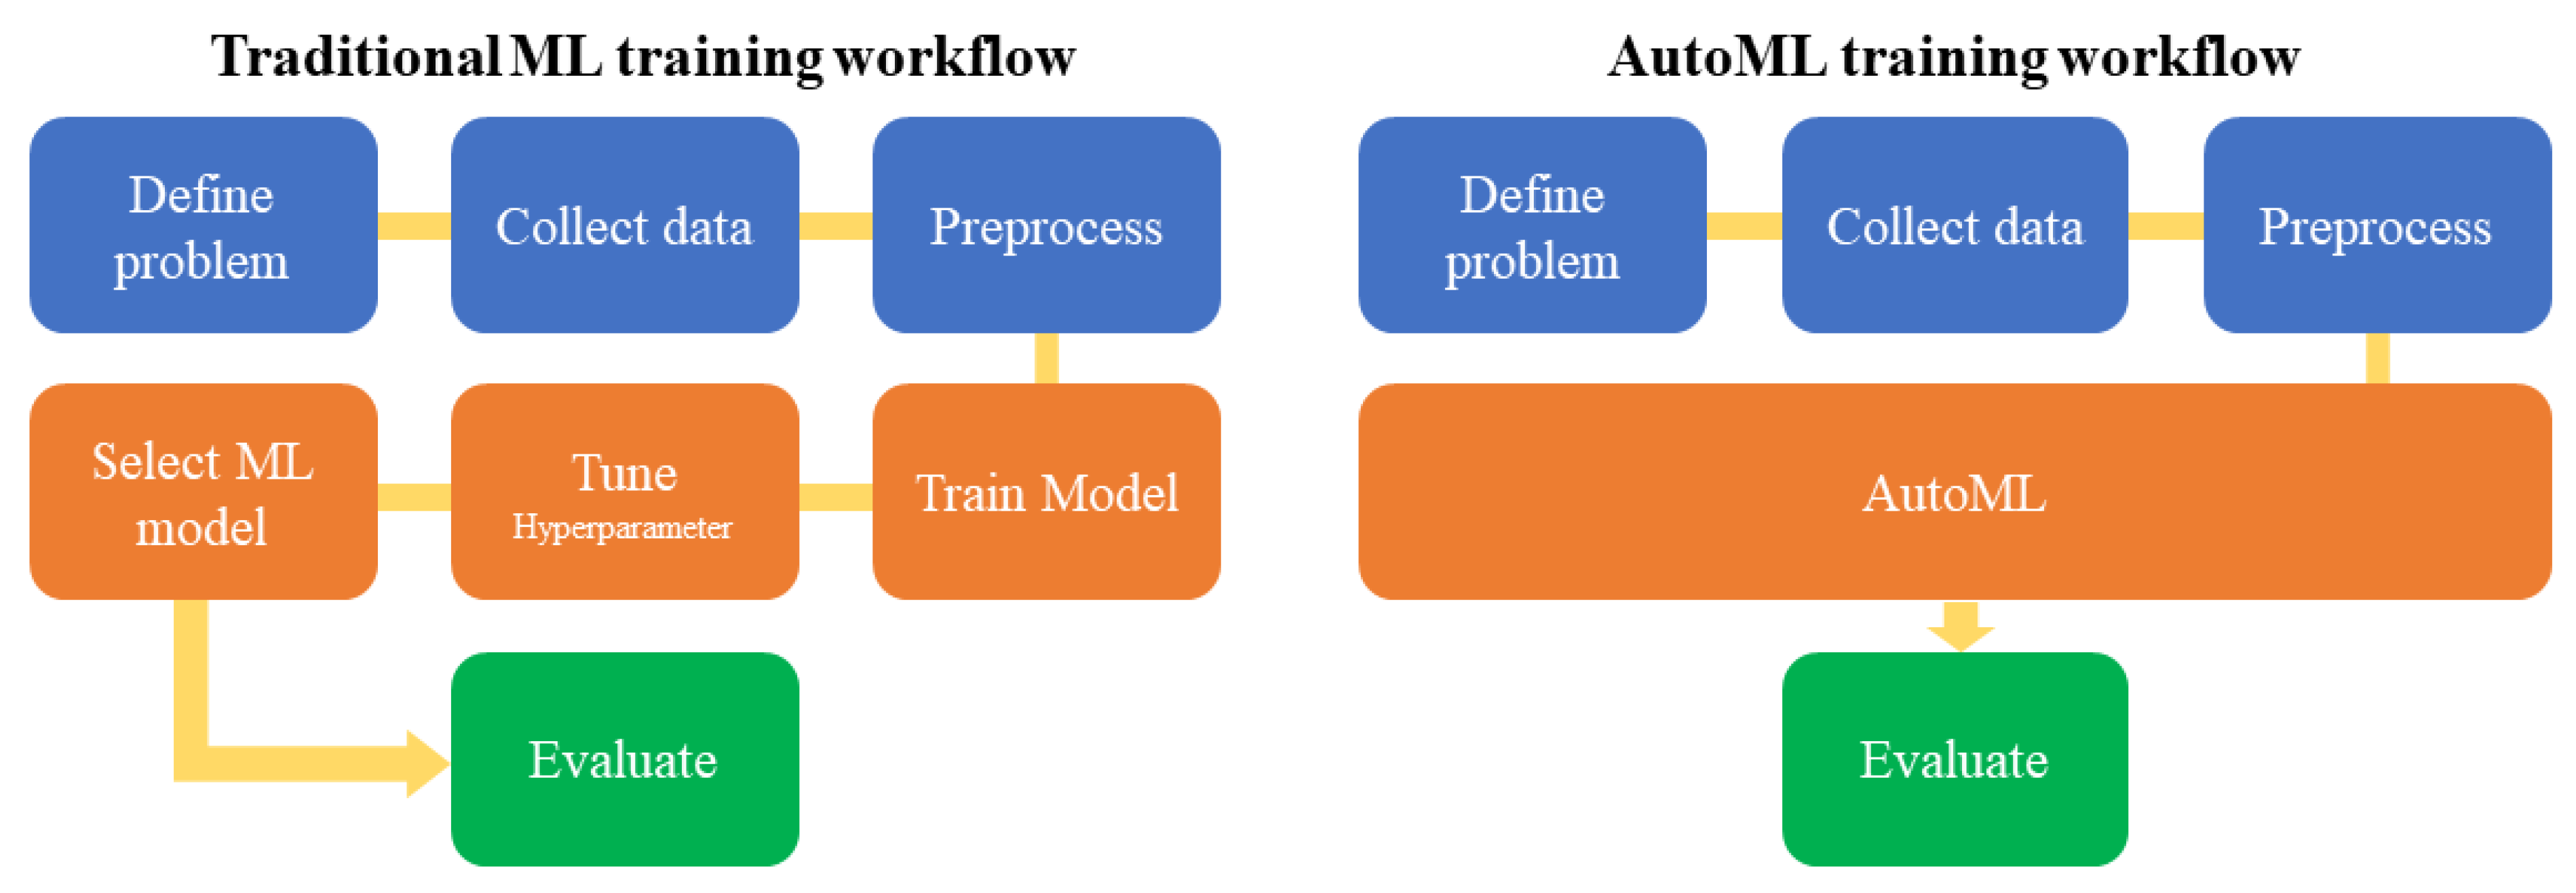
4. Machine Learning Model

4.1. AutoML–PyCaret Library

In contrast to conventional ML models that first select a high-accuracy model and subsequently perform an optimal hyperparameter tuning procedure for evaluation, this study adopted and applied a model that automatically optimizes classical ML procedures, as shown in Figure 7. Automated ML (AutoML) refers to the automated process of selecting, training, and evaluating ML models. It automates tasks, such as hyperparameter tuning, feature engineering, and algorithm selection, minimizing user intervention and aiding in the optimization of the models. AutoML is commonly used to make ML accessible to nonexperts by simplifying the model development process for various ML tasks. This study developed the ML models using the PyCaret library. PyCaret is a Python-based AutoML library designed to rapidly build and optimize ML models.

4.2. Decision Tree Model

Considering the composition of a dataset, selecting a suitable model becomes an additional requirement, particularly when dealing with multiple features. In training a linear regression model on a dataset with many features, various problems can arise, such as the removal of features with a relatively low impact on the target feature or the risk of overfitting owing to an excessive fitting of features. In order to address these challenges, a model capable of handling datasets with many features and capturing nonlinear trends, such as decision-tree-based models, was selected from the models provided by PyCaret. The Decision Tree model offers a comprehensive and adaptable solution for classification and regression tasks. Its hierarchical tree structure, with internal nodes representing features, branches embodying decision rules, and leaf nodes culminating in predictions, facilitates an intuitive representation of decision-making processes. Central to the functionality of the decision tree is the selection of the splitting criteria at each internal node. This strategic decision, often based on optimizing information gain or minimizing variance, governs the partitioning of data and ultimately defines the structure of the tree. The PyCaret library supports six tree-based models: CatBoost, XGBoost, Random Forest, LightGBM, ExtraTrees, and Decision Tree. The top five models were selected, except the Decision Tree model.
CatBoost is a gradient-boosting algorithm that minimizes the loss function using the gradient direction. Each tree is constructed to reduce the residuals of the previous tree, and categorical feature handling involves converting categorical features into binary codes [111].
XGBoost is a gradient-boosting algorithm that minimizes the loss function and constructs trees. Each tree is trained in a direction that reduces the residuals (difference between the predicted and actual values) of the previous tree. Mathematically, it utilizes a gradient and Hessian to train trees [112].
Random Forest constructs multiple decision trees in order to enhance predictive performance. Each tree is trained on a bootstrapped sample (randomly selected data with replacement), and random subsets of features are used to find the optimal split points at each node [113].
LightGBM is an efficient gradient-boosting algorithm that uses a leafwise tree-construction method for faster training. Each tree is split leafwise using the gradient information of the loss function, and boosted tree predictions are combined for the final prediction [114].
ExtraTrees is an ensemble technique that constructs decision trees using randomly selected feature subsets. Each tree is trained on a bootstrapped sample, and random feature subsets are considered at each node in order to determine the optimal split points. This diversity enhances predictive performance [115].

4.3. Ensemble (Voting)

Ensemble learning, exemplified by the voting technique, is a powerful ML approach, particularly in the context of classification tasks. This methodology combines the predictions from diverse base models in order to form a unified and robust final model. Two notable variants, hard and soft voting, offer distinct strategies for decision consolidation. In hard voting, the prediction of each model is treated as a discrete vote, and the ultimate prediction is determined by the majority vote. For instance, if the three models forecast classes A, A, and B, then the hard-voting mechanism would favor class A as the conclusive prediction. By contrast, soft voting assigns weights to individual models and considers the average predicted probabilities across classes. The class with the highest average probability influences the final prediction. The assignment of weights often depends on the historical performance of each model. Encompassing diverse models through voting provides an avenue for performance enhancement and serves as a mechanism for mitigating overfitting by introducing model diversity. However, this technique assumes equal importance for all constituent models, and its efficacy is constrained in scenarios where the models exhibit similar performances or deliver unreliable predictions. In conclusion, voting is a straightforward yet potent ensemble learning method that offers a versatile means of leveraging the strengths of multiple models in order to obtain more robust and stable predictions. The selection between hard and soft voting is contingent on the unique characteristics of the problem at hand and the preferred strategy for aggregating predictions.

4.4. Hyperparameter (Autotuning)

The proper tuning of hyperparameters is an indispensable aspect of ML and is often the most time-consuming phase in traditional ML pipelines. Hyperparameter tuning is currently performed using three primary approaches: GridSearch, RandomGridSearch, and Bayesian Optimization, with each method contingent on the selected learning model. This study used the RandomGridSearch method for tuning in order to prioritize learning time in the automated process. Table 4 lists the hyperparameter values used in each model.

4.5. Model Pipeline

The models in the AutoML were evaluated using one of the evaluation metrics, R2. For models based on experimental data for strength prediction, the order of accuracy was CatBoost, ExtraTrees, XGBoost, LightGBM, and Random Forest. However, for models based on augmented data, the order was CatBoost, ExtraTrees, XGBoost, Random Forest, and LightGBM. The framework for slip prediction comprised LightGBM, Random Forest, CatBoost, ExtraTrees, and XGBoost. The pipelines for the training models were identical, and preprocessing for missing data was performed using a simple imputation function within the pipeline, as shown in Figure 8.

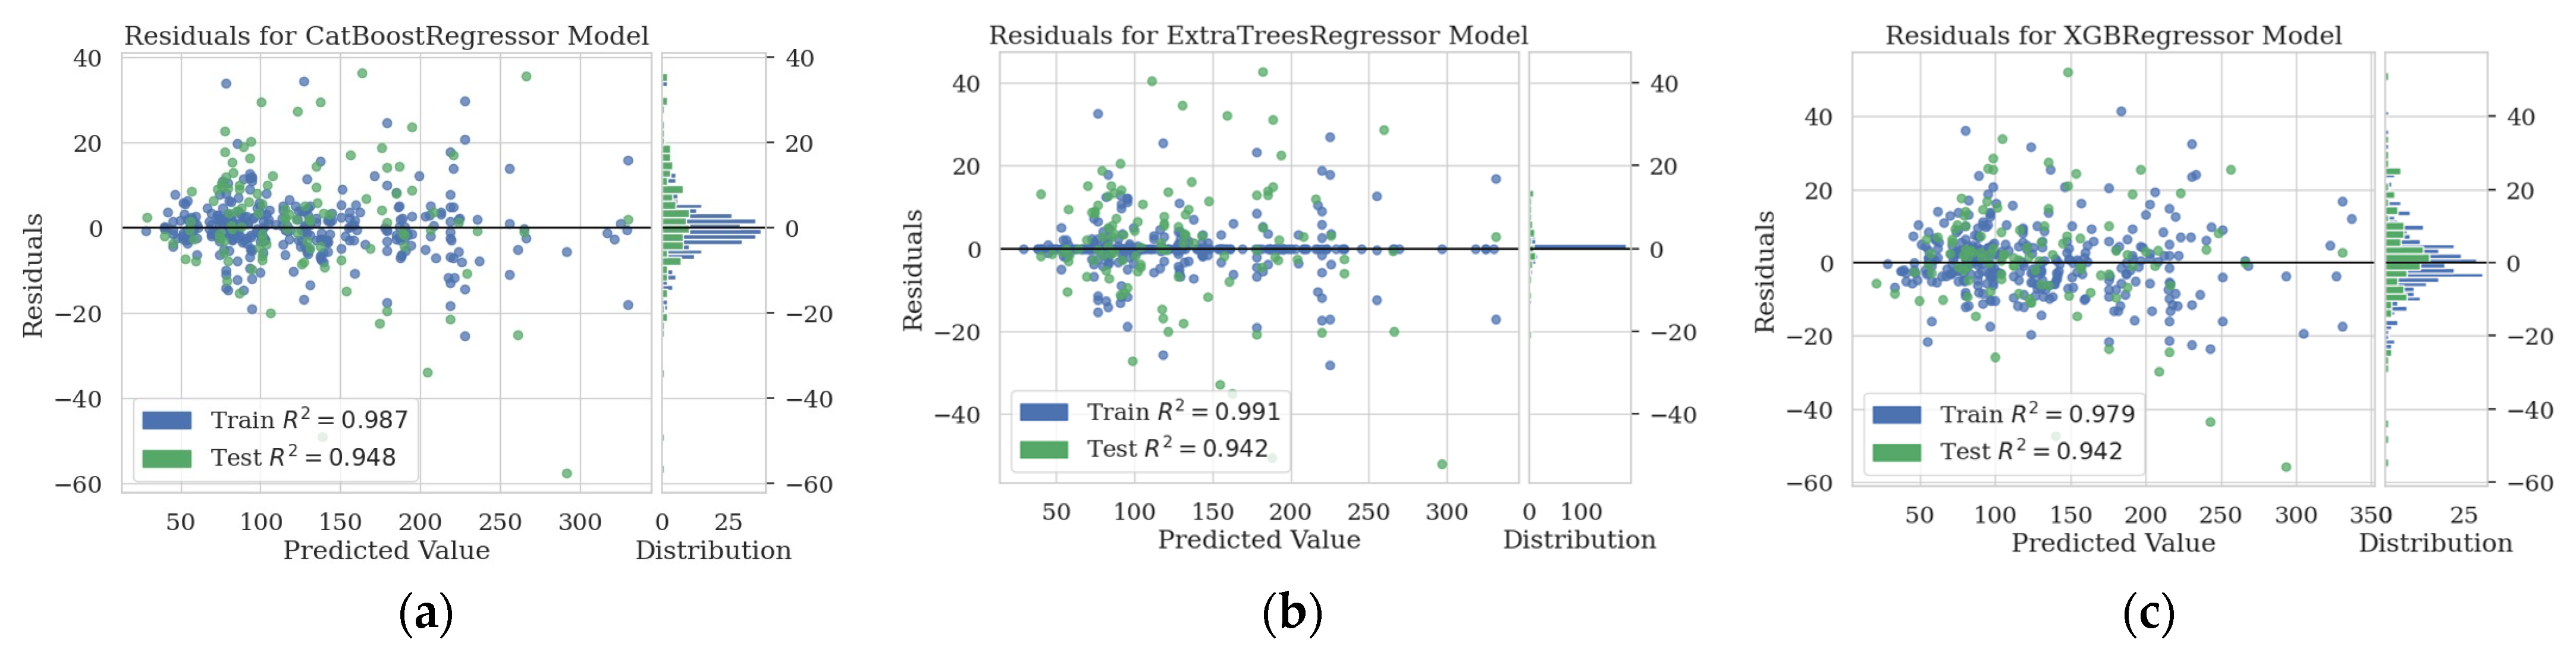
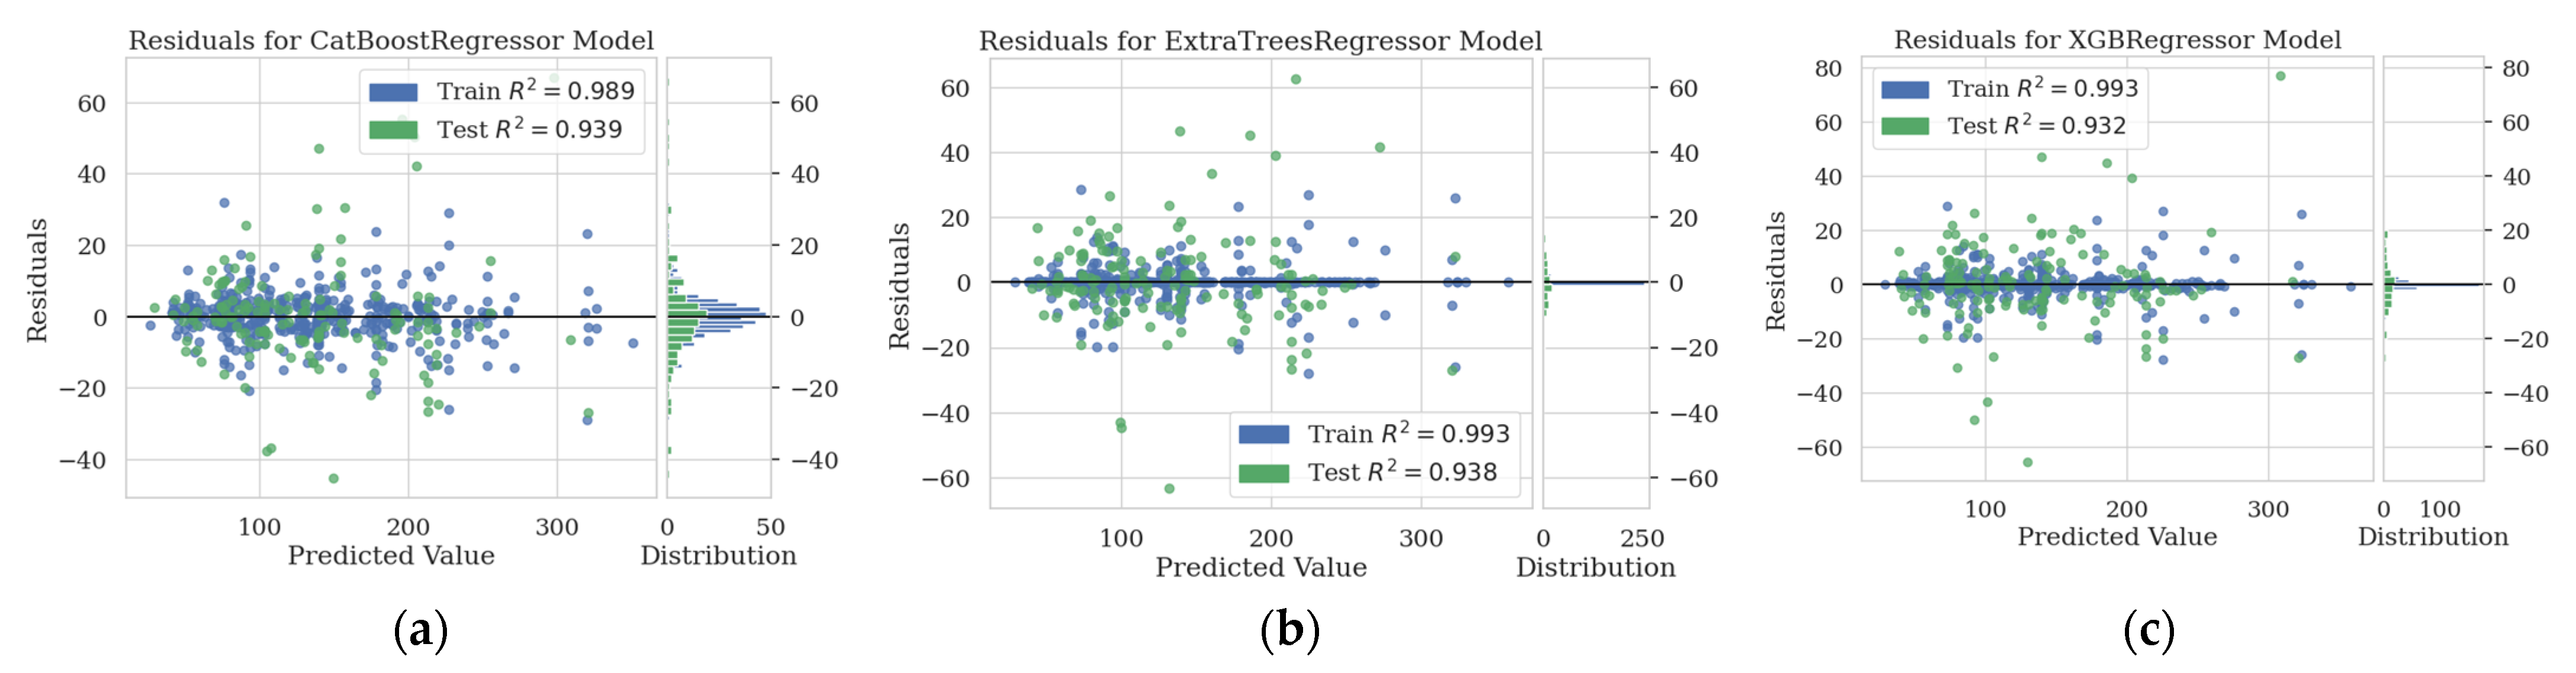
5. Prediction of Strength and Deformation Capacity

5.1. Metrics for Performance Evaluation

Six metrics were used to evaluate the ML results, and SHapley Additive exPlanations (SHAP) values were applied to each ensemble model and voting for visualization in order to assess the relationships between the features and the target values within the data. Table 5 lists the metrics for the training datasets of the three prediction models.
Mean absolute error (MAE) represents the average of the absolute errors between the predicted and actual values. This metric treats the errors between each data point independently and is not heavily influenced by outliers. A lower MAE indicates a more accurate prediction.
M A E = i = 1 n Y i Y ^ i n .
Mean square error (MSE) represents the average of the squared errors between the predicted and actual values. Squaring the errors makes them more sensitive to large errors and can be heavily influenced by outliers. A lower MSE indicates a more accurate prediction.
M S E = i = 1 n Y i Y ^ i 2 n .
Root mean square error (RMSE) is the square root of MSE, representing the square root of the average squared errors between the predicted and actual values. The RMSE scales the error in the same unit as the actual values, making the interpretation relatively straightforward. A lower RMSE indicates a more accurate prediction.
R M S E = i = 1 n Y i Y ^ i 2 n .
R2 indicates the explanatory power of a regression model and measures how well the predicted values explain the variance of the dependent variable. R2 values range between 0 and 1, with higher values indicating a better model fit.
R 2 = 1 i y i y ^ i 2 i y i y ¯ 2 .
Root mean square logarithmic error (RMSLE) represents the square root of the average squared logarithmic errors between the logarithm-transformed predicted and actual values. It is commonly used in regression problems involving positive values in order to mitigate sensitivity to large values through log transformation.
R M S L E = 1 N i = 1 N log p i + 1 log a i + 1 2 .
Mean absolute percentage error (MAPE) represents the average of the absolute percentage errors between the predicted and actual values. It measures the relative error as a percentage, providing insights into the accuracy of the predictions on a percentage scale. A lower MAPE indicates a higher model accuracy.
M A P E = 100 n × i = 1 n y i y ^ i y i ,
where
Y i , y i , a i =Actual value;
Y ^ , p i =Predicted value
y ¯ mean value of actual value;
n =Number of data.

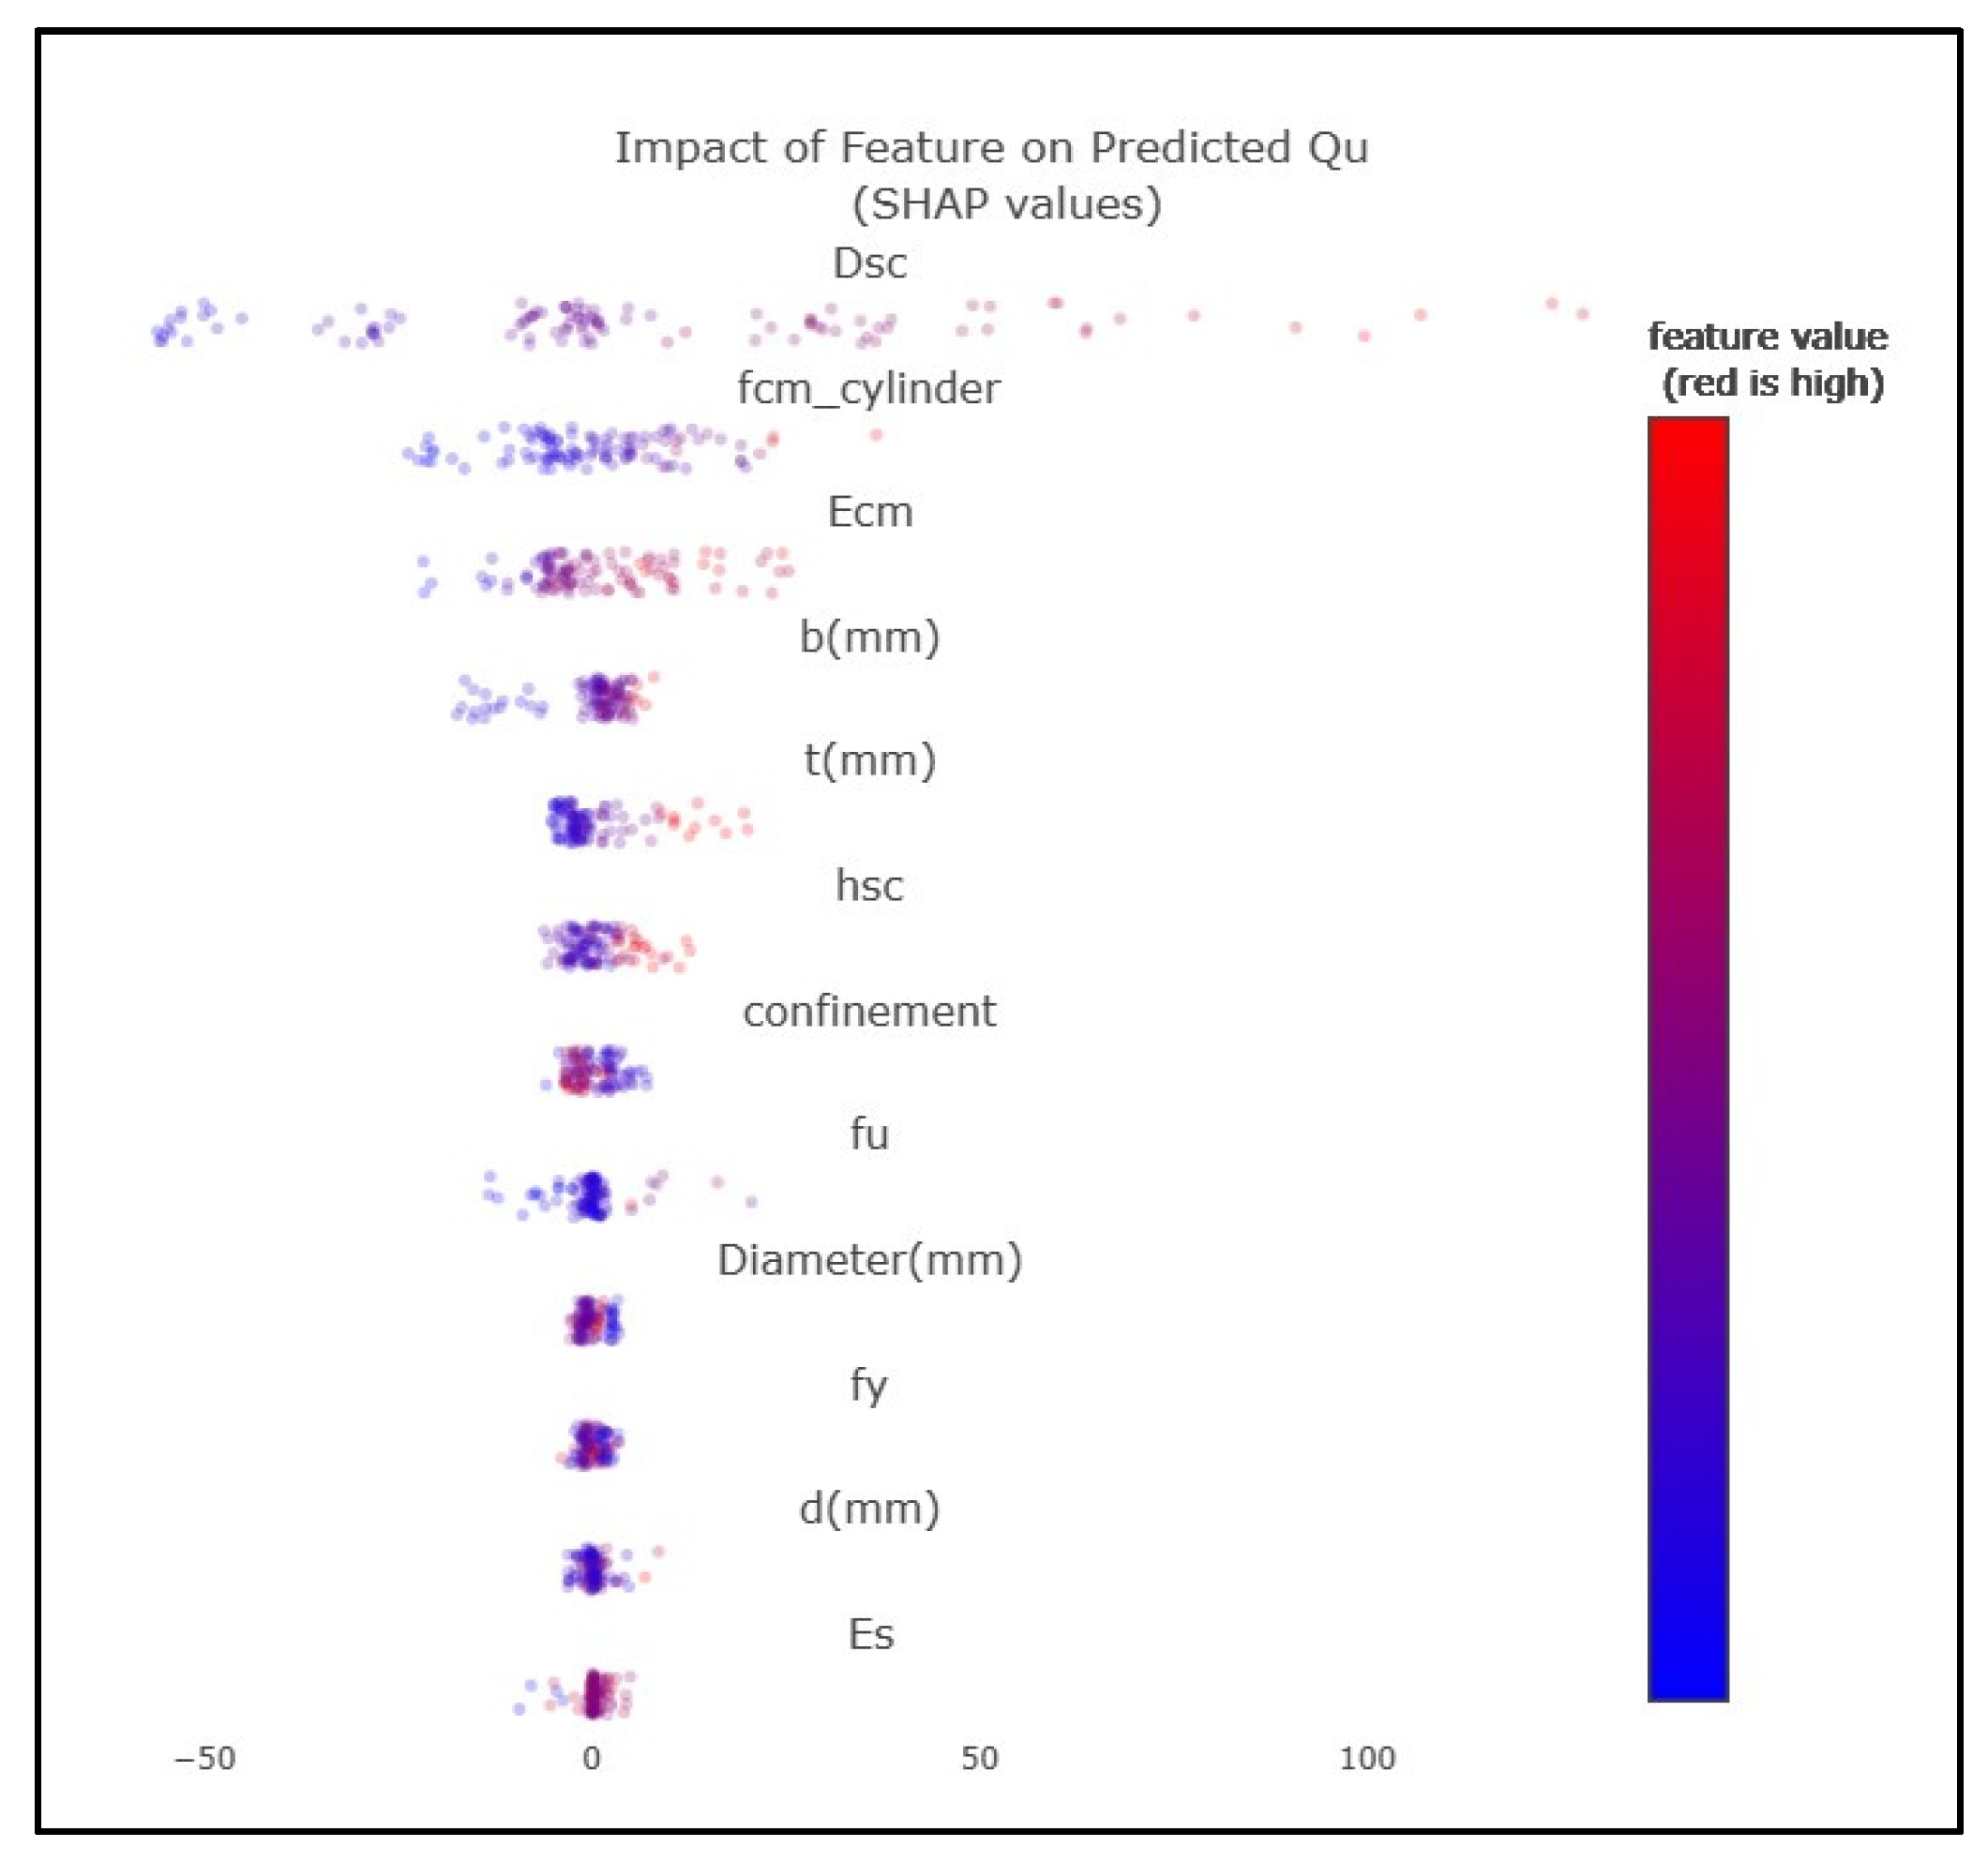
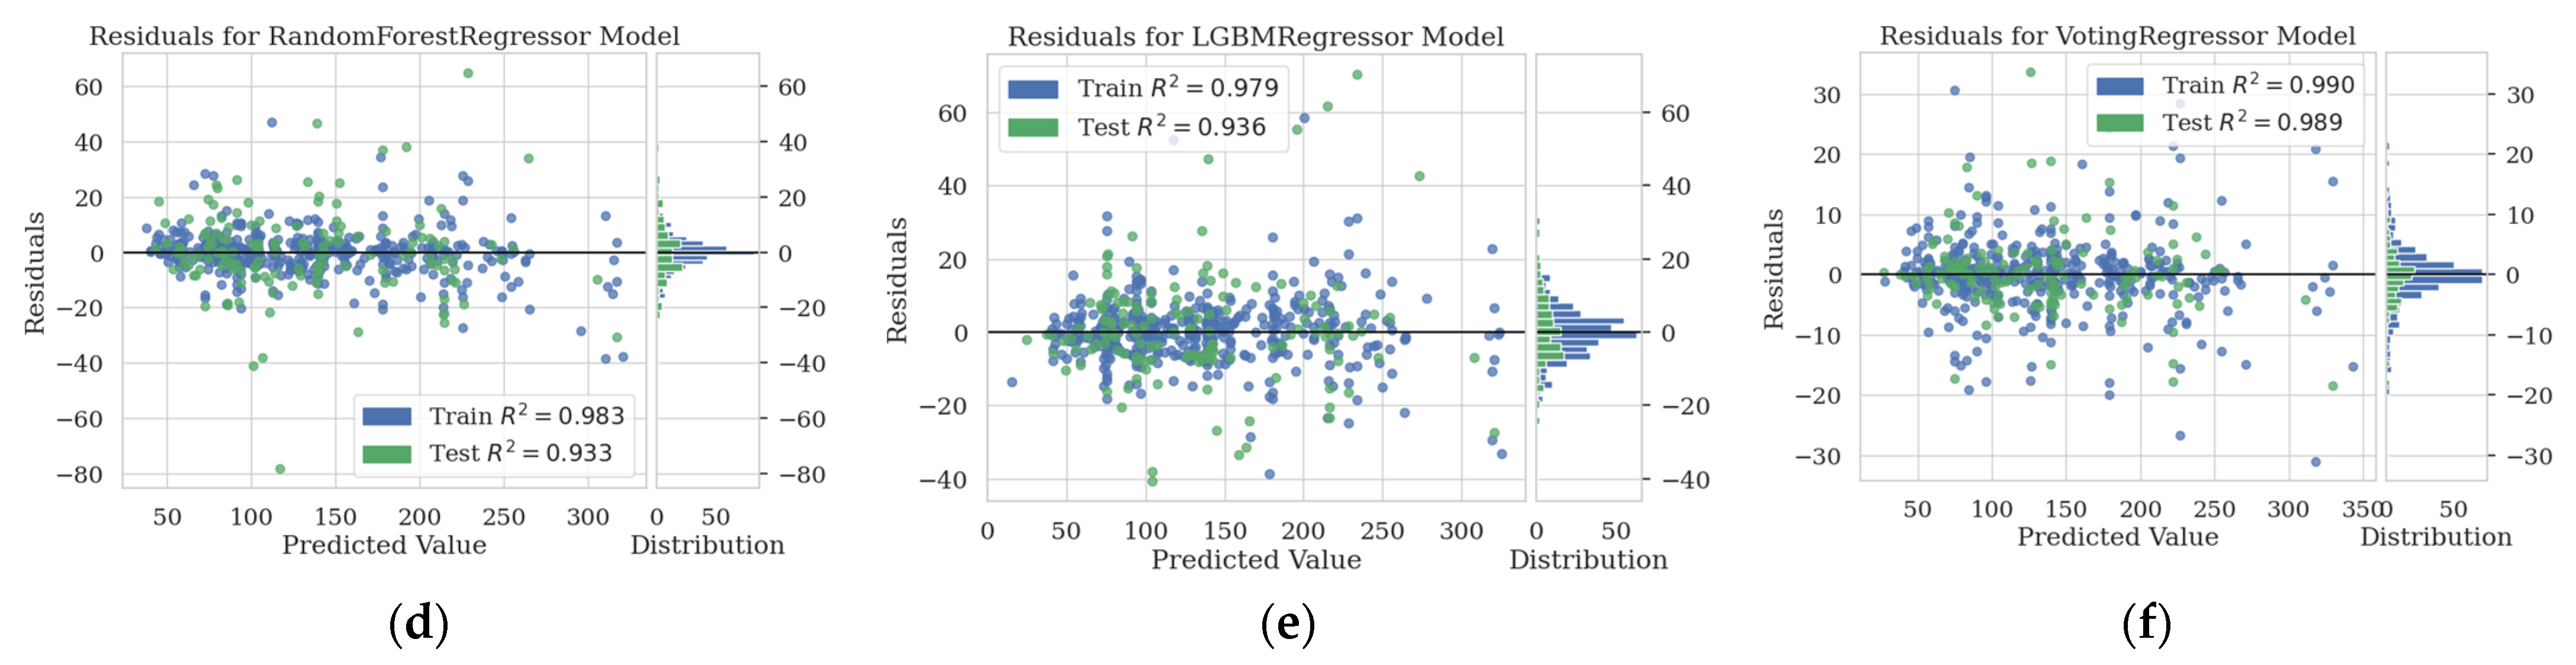
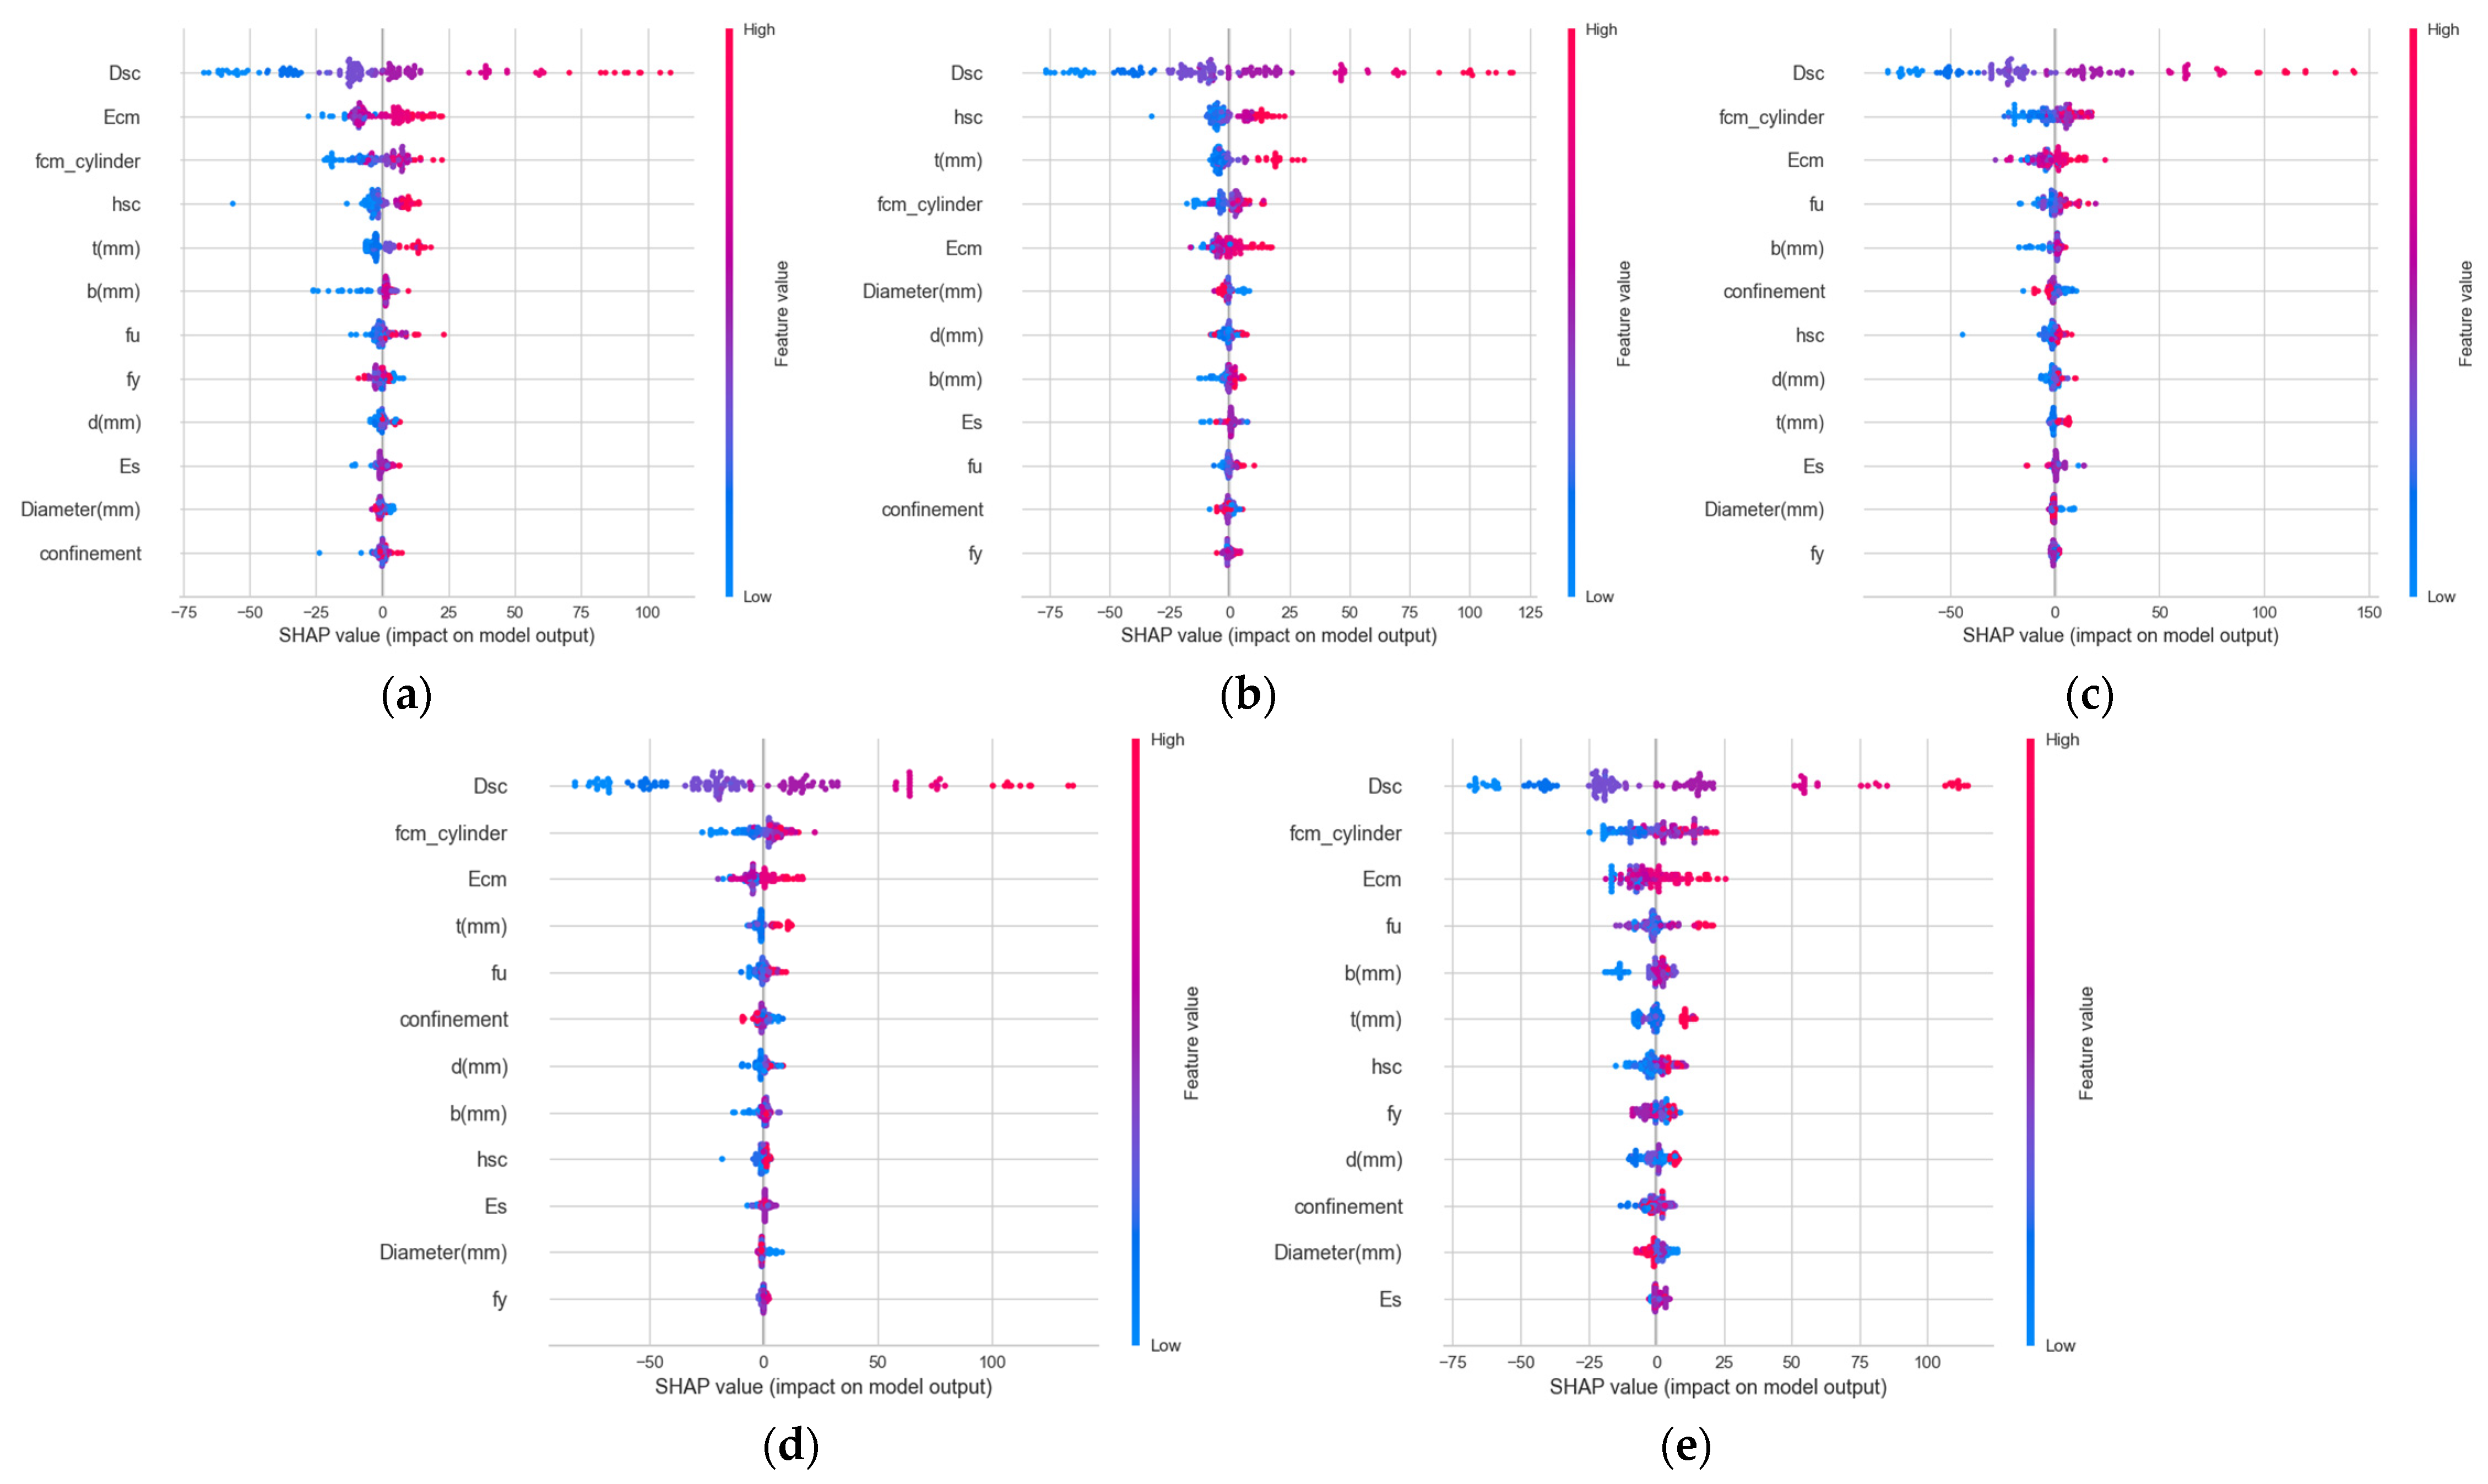
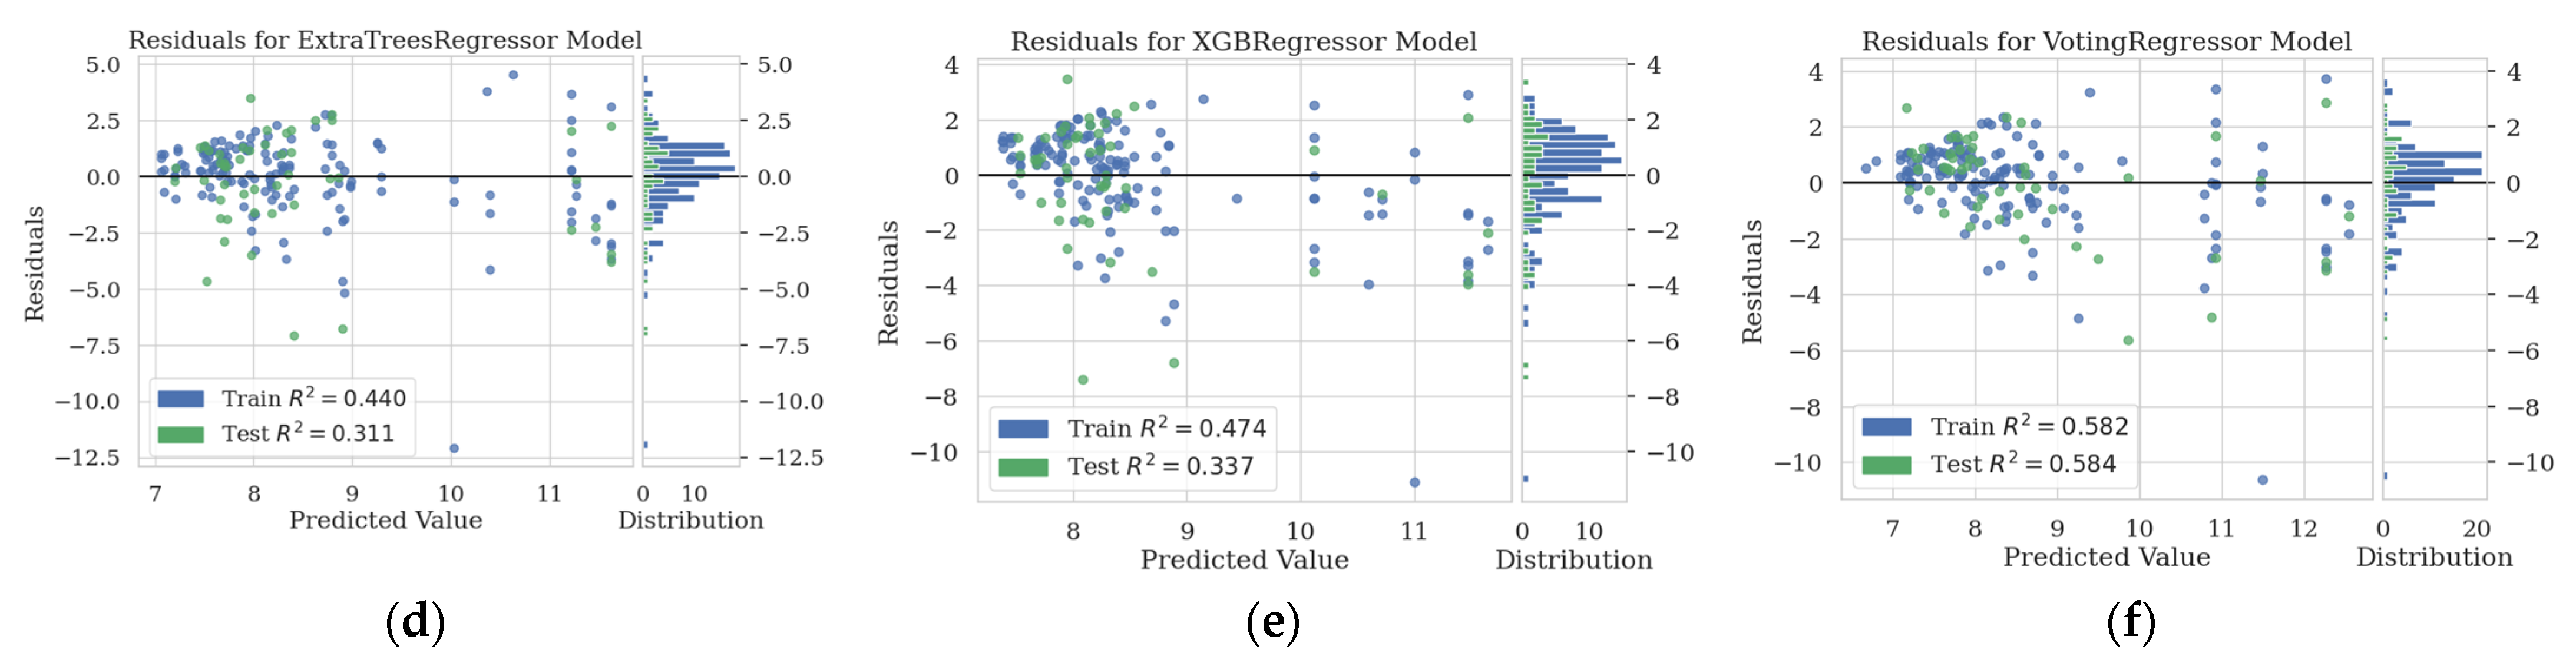
5.2. SHapley Additive exPlanations (SHAP) Value

The SHAP model is a tool for interpreting the predictions of ML models and explaining the contribution of each feature to the predictions of a model. This model assesses the importance of each feature individually and reasonably distributes contributions by considering the interactions between features based on the principles of the Shapley values. The SHAP model enhances the interpretability of black-box ML models and provides a comprehensive overview of feature importance across the entire dataset, aiding in understanding the behavior of the model. It applies to various types of ML models and facilitates clear understanding of the contribution of each feature [116].
i = S F \ { i } S ! ( F S 1 ) ! F ! f S i x S i f s ( x s ) ,
where
i =The Shapley value for the “I” data;
F =The entire set;
S =All subsets of the entire set with the i-th data removed;
f S i x S i =The overall contribution, including the i-th data;
f s ( x s ) =The contribution of the remaining subset without the i-th data.

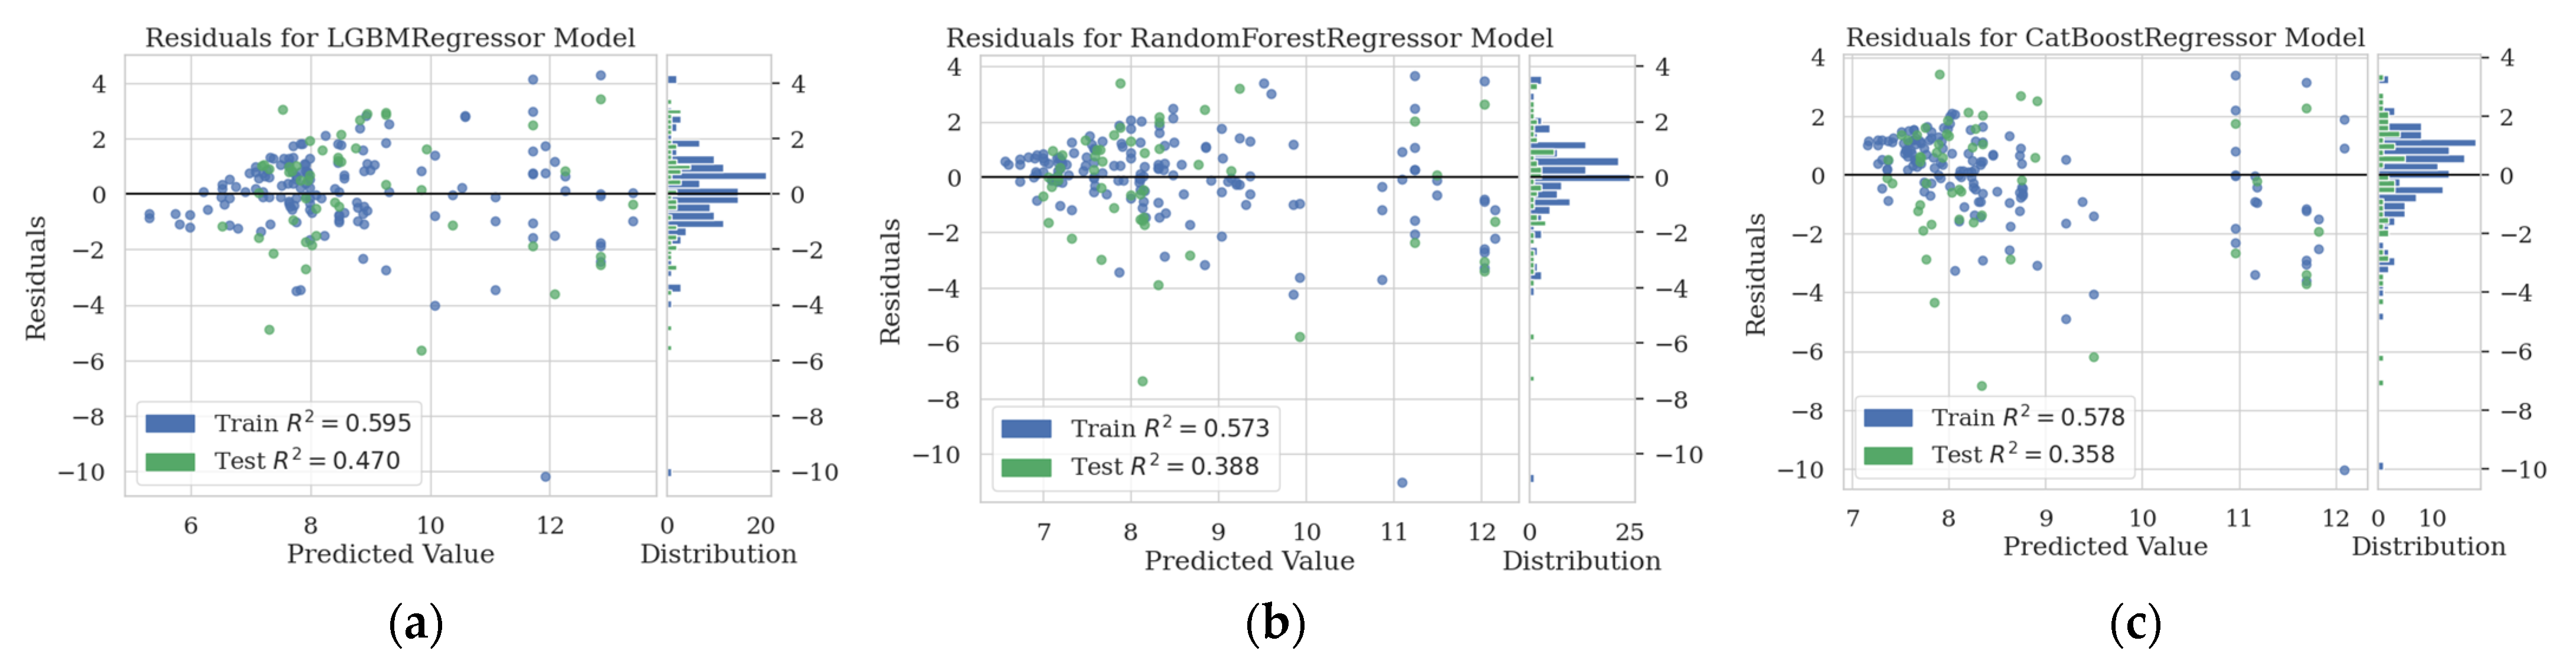
5.3. Strength Prediction with Experimental Data

The experimental data for the strength prediction were used to train the ML models, and the results were visualized in residual graphs (Figure 9). The outcomes of the top five ensemble decision tree models selected through AutoML, and the results obtained from these five models using the uniform-weight voting technique, are presented sequentially. Despite using the same data, diverse results were observed across the models; however, an overall high accuracy was noted. In this framework, the CatBoost model demonstrated the highest accuracy (R2 = 0.987 (training dataset) and 0.948 (test dataset)). The accuracy of the Voting Regressor was also found to be nearly comparable (R2 = 0.984 (training dataset) and 0.986 (test dataset)). Because this model is designed for strength prediction, despite CatBoost exhibiting the highest R2 value for the test dataset, an evaluation of the actual residual values for the training dataset suggests the ExtraTrees model was the most accurate.
Figure 10 shows the SHAP value graphs for each ensemble model. The features reflected in the existing design code included the stud diameter, height, tensile strength, concrete strength, and elastic modulus. By analyzing the impact of features through ML, all models identified the diameter of the stud as the most highly correlated factor. However, in a few models, the thickness of the concrete member was considered as the second most important factor. In addition, the models evaluated features, such as the elastic modulus and compressive strength of concrete, the height and elastic modulus of the connector material, and the dimensional characteristics of the concrete component, as influential factors. Ultimately, an examination of the evaluation graph (Figure 11) for the ensemble model revealed that the diameter of the connecting material and the material properties of concrete were sequentially considered significant. Subsequently, the dimensional characteristics of the concrete component, such as thickness and width, were recognized as significant from the next order onwards.

5.4. Strength Prediction with Augmented Data (Experimental and Finite Element Method)

The ML models were trained using the augmented data for strength prediction, and the results were visualized in residual graphs (Figure 12). Despite using the same dataset, diverse results were observed among the models. In the ML architecture of the augmented dataset composition, CatBoost exhibited the highest predictive performance (R2 = 0.989 (training dataset) and 0.939 (test dataset)). In contrast to the ML setup with the traditional experimental dataset composition, the accuracy of the Voting Regressor stood out with the highest R2 = 0.990 (training dataset) and 0.989 (test dataset). The R2 metric for the test dataset in the Voting Regressor was higher than that of the individual ensemble models. An examination of the metric evaluations of the training dataset revealed that the accuracy of each ensemble model improved across all aspects. Particularly noteworthy was the improvement in the MSE values, indicating the average squared residuals for the strength values in specific models.
An examination of the SHAP values for the framework evaluation with the augmented data composition (Figure 13) revealed that the importance of the features was assessed more similarly to the actual structural behavior compared with the models based on the experimental data composition. The importance of features related to concrete components decreased, whereas the influence of the material properties of concrete and the tensile strength of the connecting elements became more prominent. The top SHAP value features of the LightGBM model generally included the diameter and strength of the connections, as well as the compressive strength and elastic modulus of concrete. These trends indicate the dependence of the model on data quantity and model specifications. Furthermore, except for the top four features, the predictions did not appear to proceed correctly from a mechanical perspective. By contrast, models, such as the ExtraTrees and XGBoost, properly evaluated the mechanical aspects. The SHAP value graph (Figure 14), which evaluated the final model by averaging the impact of each model, revealed that the values assessed by each ensemble model were reflected. The use of FEM data can potentially address issues inherent to ML, such as bias in existing data and the dependence on data quantity.

5.5. Slip Prediction with the Experimental Data

The ML models were trained using the experimental data for slip prediction, and the results were visualized in residual graphs (Figure 15). In this prediction task, LightGBM demonstrated the highest predictive performance (R2 = 0.595 (training dataset) and 0.470 (test dataset)). Notably, the Voting Regressor exhibited the highest accuracy, with R2 = 0.582 (training dataset) and 0.584 (test dataset). Owing to the relatively small amount of data available for training, the performance of the slip prediction model was inferior to that of the strength prediction model. When evaluating the metrics, interpreting the numerical values in terms of absolute magnitude is challenging, because the target feature, Su, has units in millimeters with generally small values. In addition, based on the MAPE value, the slip prediction model required more data for prediction, predicting values that were more than twice as large as those of the strength prediction model.
Despite LightGBM exhibiting the highest R2 value, an analysis of feature importance using the SHAP values in the slip prediction model (Figure 16) revealed that the yield strength of the confinement reinforcement contributed the most. Contrary to expectations based on mechanical judgment, features directly related to stiffness, such as the thickness of the components or elastic modulus, were not highly ranked. This underscores the importance of considering the accuracy of the model and the significance of the features considered when constructing and using the model. An examination of the SHAP values of other models comprising the Voting framework revealed features related to stiffness as the most prominent (Figure 17). Approaches that utilize averages or medians for outstanding models are desirable in order to prevent the dependency of the results on individual models in the two aspects of model improvement.

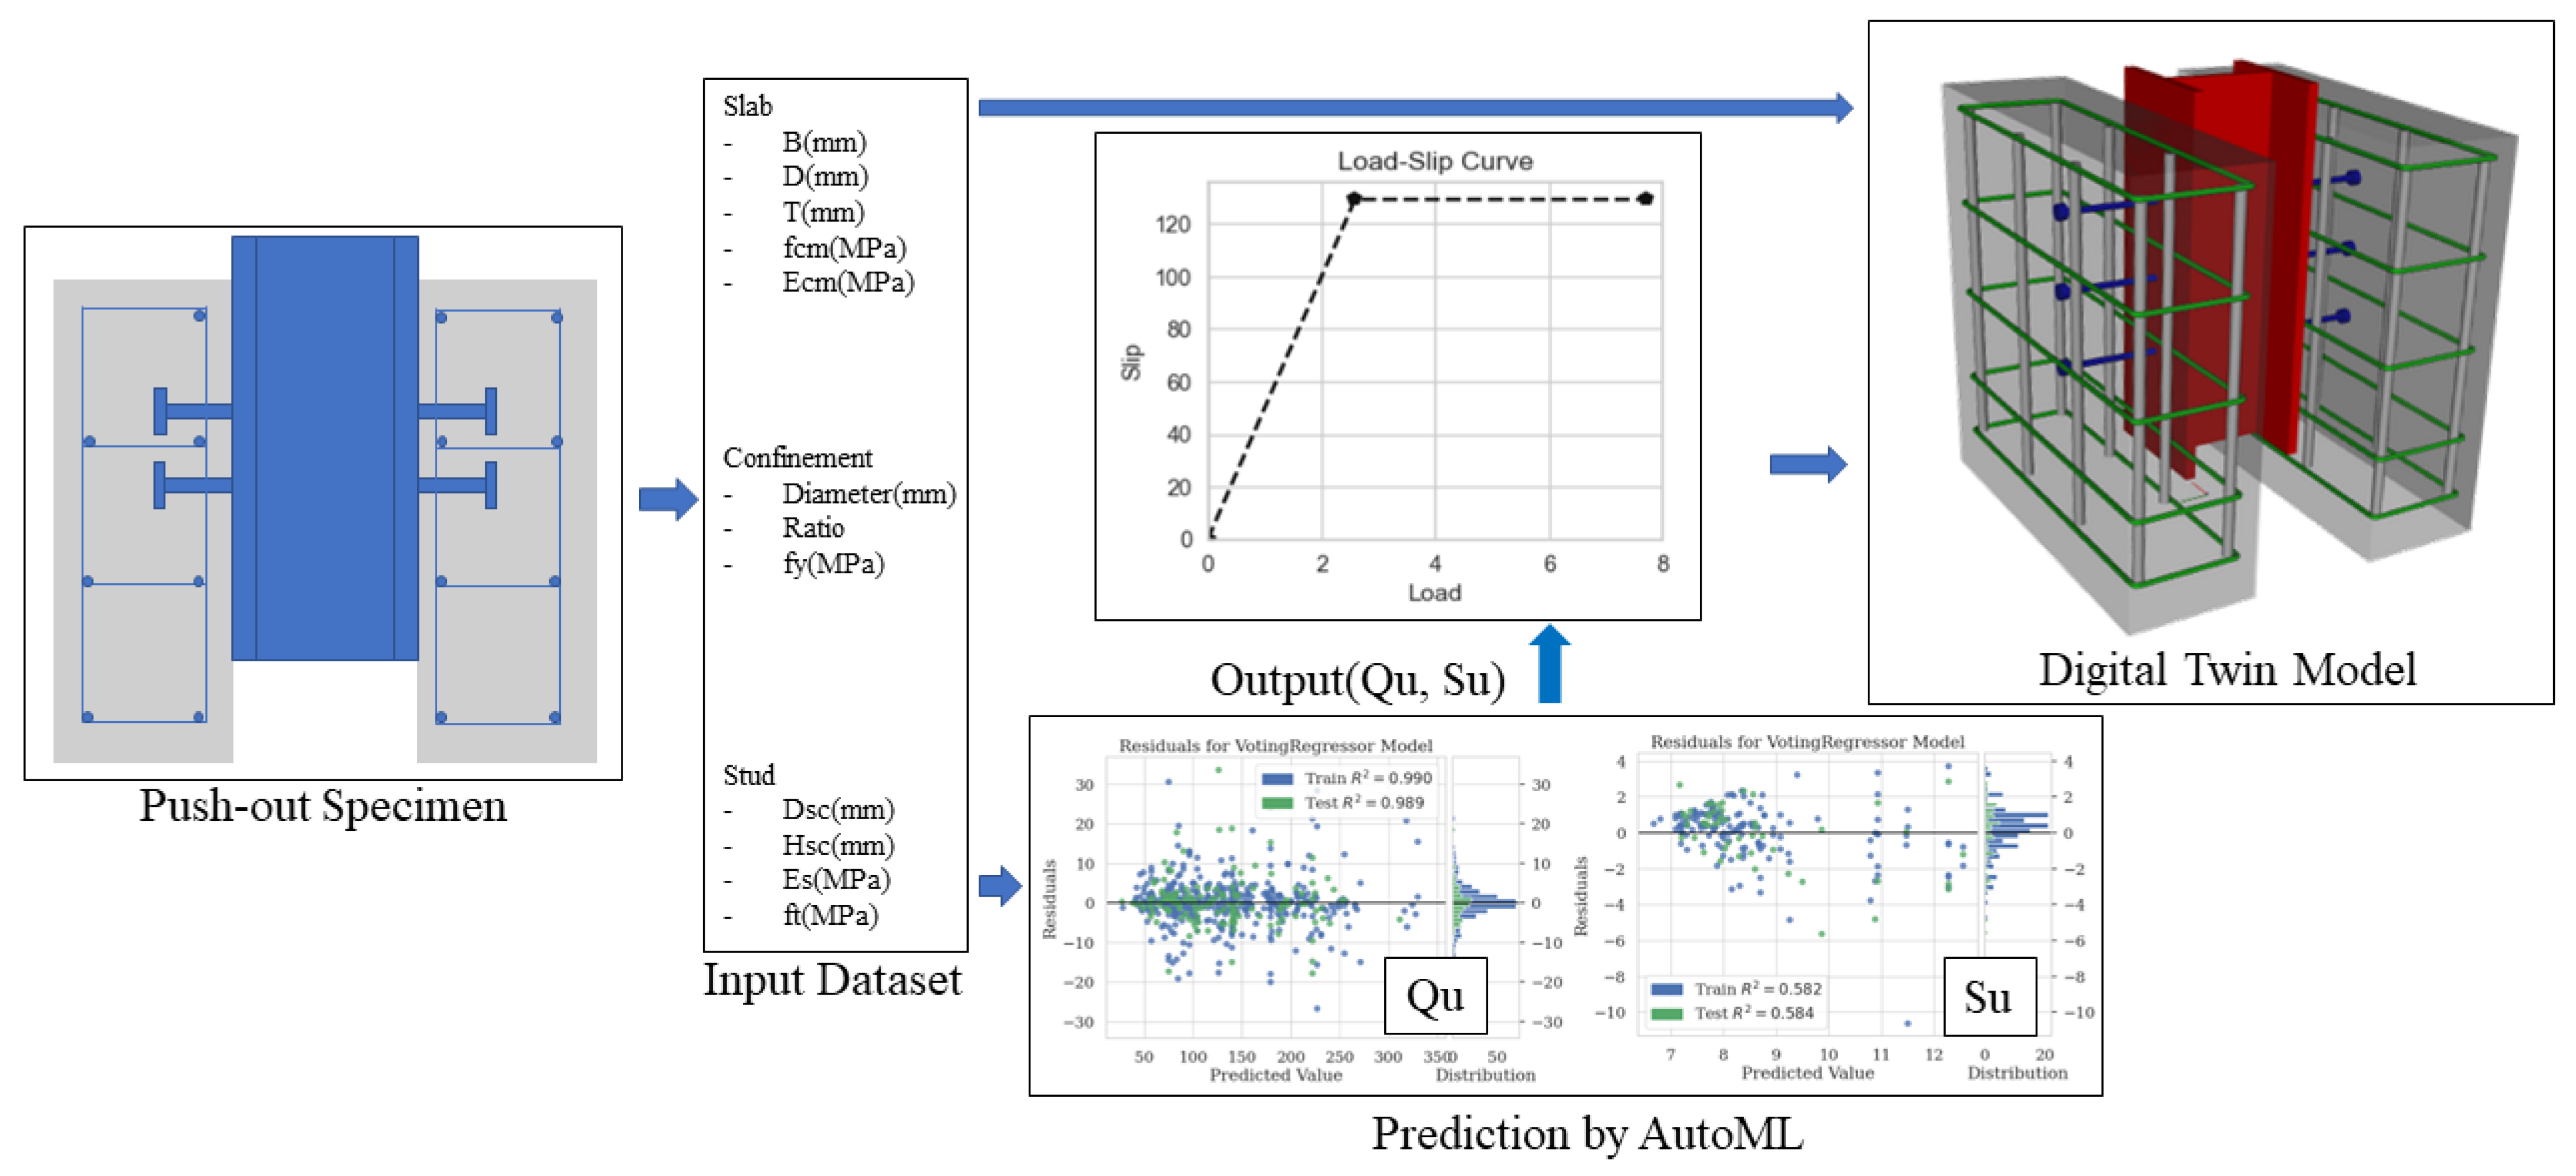
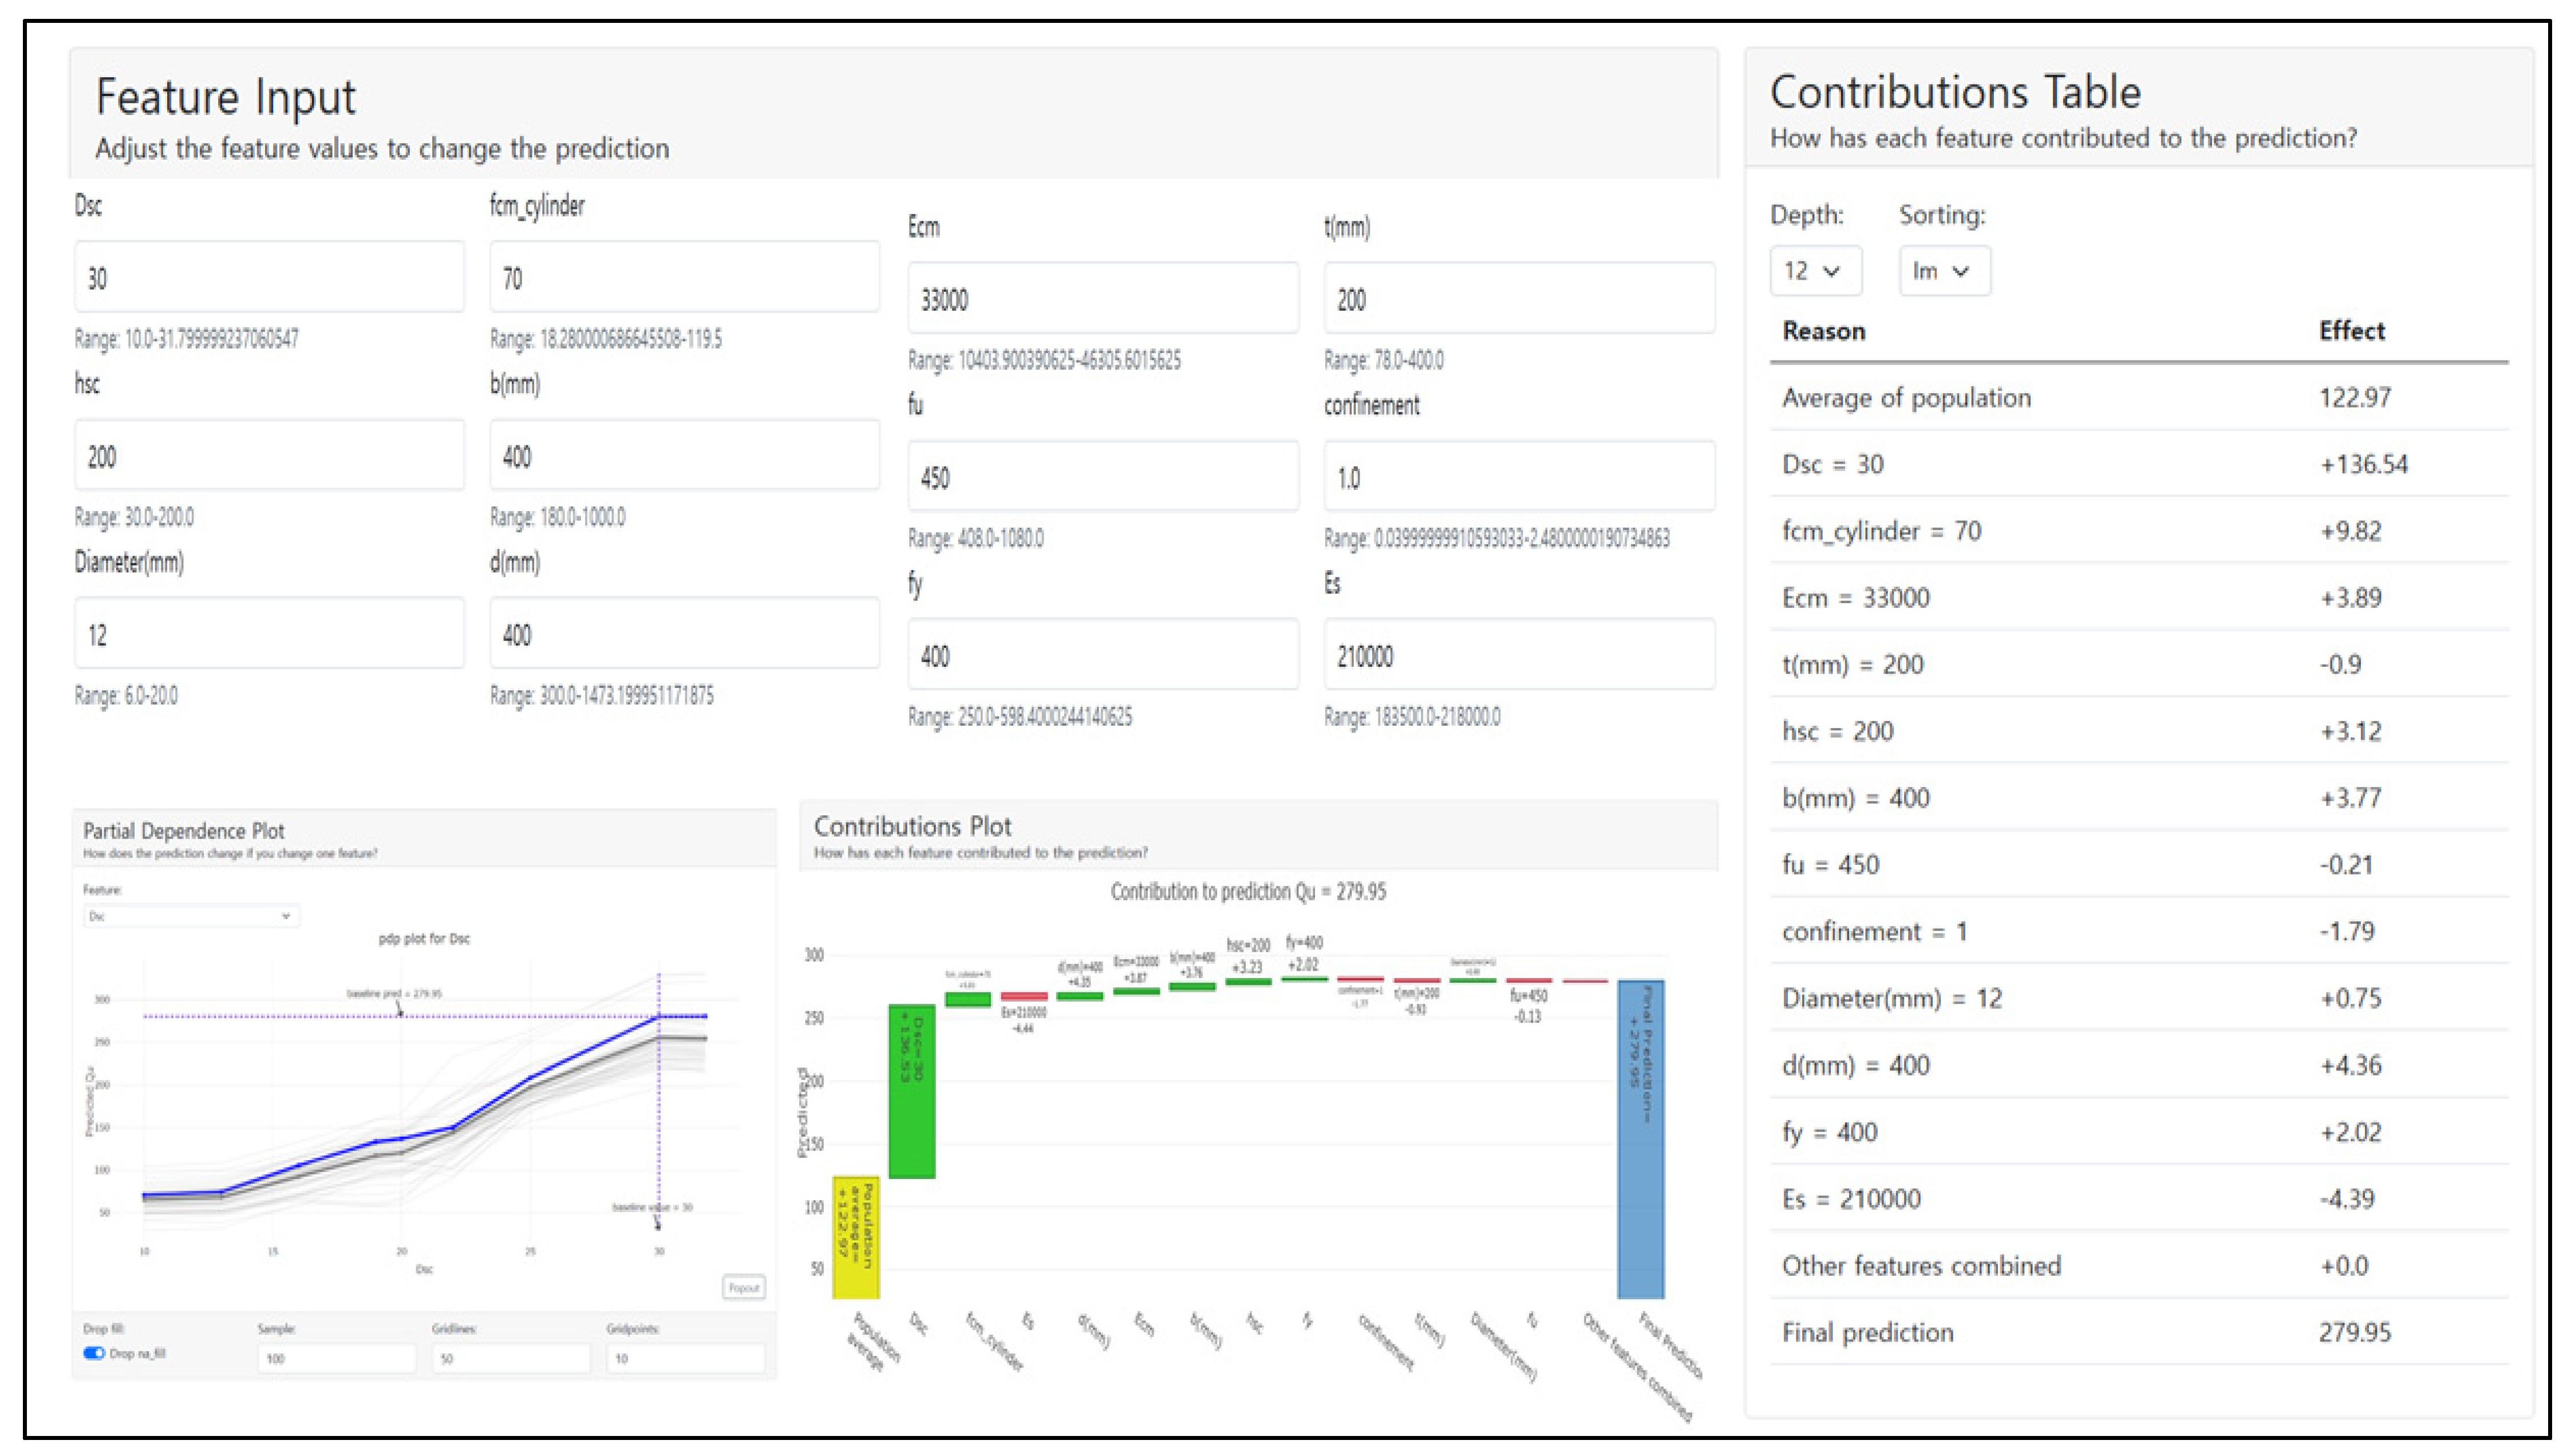
6. Digital Twin for Stud Shear Connection

6.1. Application of Machine Learning to Replace a Design Code

In order to mitigate the significant biases within the existing experimental data range, this study proposed a system that supplements the data for regions with substantial bias using FEM or additional experimental data. Following the optimization of the ML models, a what-if simulation was employed to estimate the strength and slip values of the connections in the pushout experiments (Figure 18). The system operates by inputting variables and deriving the corresponding output values. The contribution of features comprising the input data and range-based variations of features in terms of the results were examined using partial dependence plots (PDP).

6.2. Digital Twin for Design of Static Composite Shear Connection

In addition, slip and strength prediction simulations provided the behavior of static shear connections in composite structures in the form of a load–slip curve. Considering the elastic and inelastic regions is necessary in order to characterize the behavior of the connections. In the elastic region of actual steel composite bridges, the influence of adhesion/friction effects and the design impact of the full shear connection are substantial, making the impact of the connection on the elastic range almost negligible [117]. Shim [26] proposed the limit state of the static behavior of the connection as a trilinear load–slip curve, validating the effectiveness of the proposed model by comparing it with actual experimental data. A simplified load–slip curve and the experimental data from this study are cited in order to propose and compare it as a bilinear curve. The information required to draw the graph included the ultimate strength, ultimate slip, and slope of the elastic region. The first two data points were obtained using the predictive models, and the initial stiffness value of the elastic region was determined using Equation (12) [117].
k s i I n i t i a l   S t i f f e n e s s = P m a x d s h 0.16 0.0017 f c ,
where
P m a x =Ultimate strength;
d s h =Diameter of stud;
f c =Mean value of concrete compressive strength.
In practical terms, when experimental data are incorporated into design codes, a conservative evaluation is performed by applying factors such as strength reduction coefficients. Existing design codes commonly use values, such as 0.85 and 1/1.25, to conservatively assess strength. This study proposes a strength reduction coefficient of 0.9 when the MAPE value from the strength prediction model is below 0.1. This choice is made in order to counteract outliers during the data collection process. When values deviate from the data trend, the results from the trained data would tend to significantly deviate from the actual values. This measure prevents random or exaggerated data inputs. Figure 19 illustrates the load-slip data obtained from the pushout experiment of the shear connection [26] and the bilinear load-slip curves predicted by machine learning models.

7. Conclusions

Existing design equations for static strength estimation rely on empirical expressions based on a limited range of experimental data, introducing constraints on the applicable features. Moreover, these equations typically incorporate only a few features considered crucial in the experiments. This results in a lack of consideration for the many elements comprising the shear connection. This study aimed to develop an augmented data-driven digital twin for stud shear connections. Initially, numerous elements constituting the shear connection were included as input data and considered as parameters for strength prediction. This approach allows for target prediction, even with future feature expansions. Subsequently, the ultimate strength and slip were proposed as indices to evaluate the limit state of shear connections, and a dataset was constructed to predict these indices. In order to enhance the ultimate strength prediction, FEM data were incorporated into the dataset to address the significant deviations in the experimental data. Slip prediction used experimental data. The ML model used the PyCaret library from AutoML, and voting was employed to evaluate the final performance of the ensemble models based on the decision tree models. Decision tree models can effectively capture nonlinearity when dealing with high feature counts.
The following conclusions can be drawn:
(1)
AutoML models streamline and automate the optimization process by integrating the steps required in traditional ML models. They automatically evaluate the results, allowing for the replacement of conventional design codes. Furthermore, they serve as flexible tools for handling continuous data and model updates. In instances where a more accurate model is proposed, it can be added to or replaced existing models within the blended model system, potentially yielding superior results compared to the conventional approach.
(2)
The data-driven approach in ML requires a substantial amount of data, which often poses challenges. However, proposing empirical codes and design equations, particularly those encompassing parameters such as diameter and high strength based on existing experiments, requires numerous experiments, presenting practical challenges. In order to address this problem, an augmented dataset is created using FEM models to mitigate biases in the existing experimental dataset. This approach improves the dataset and fills gaps in the experimental data, addressing issues related to data model overfitting. Consequently, the performance of the model, evaluated through accuracy metrics and SHAP values, which indicate feature importance, demonstrated superior results from a mechanical perspective.
(3)
A comparison of the accuracy of the models for strength and slip predictions revealed that the evaluation metrics, accuracy, and importance of features in the SHAP values significantly differed based on the amount of data. Initially, a notable uncertainty in the collected data for the ultimate slip was observed, resulting in less accurate results. Therefore, substantial amounts of clear experimental data are crucial for precise predictions, particularly owing to the initial uncertainty in the collected data for extreme slips.
(4)
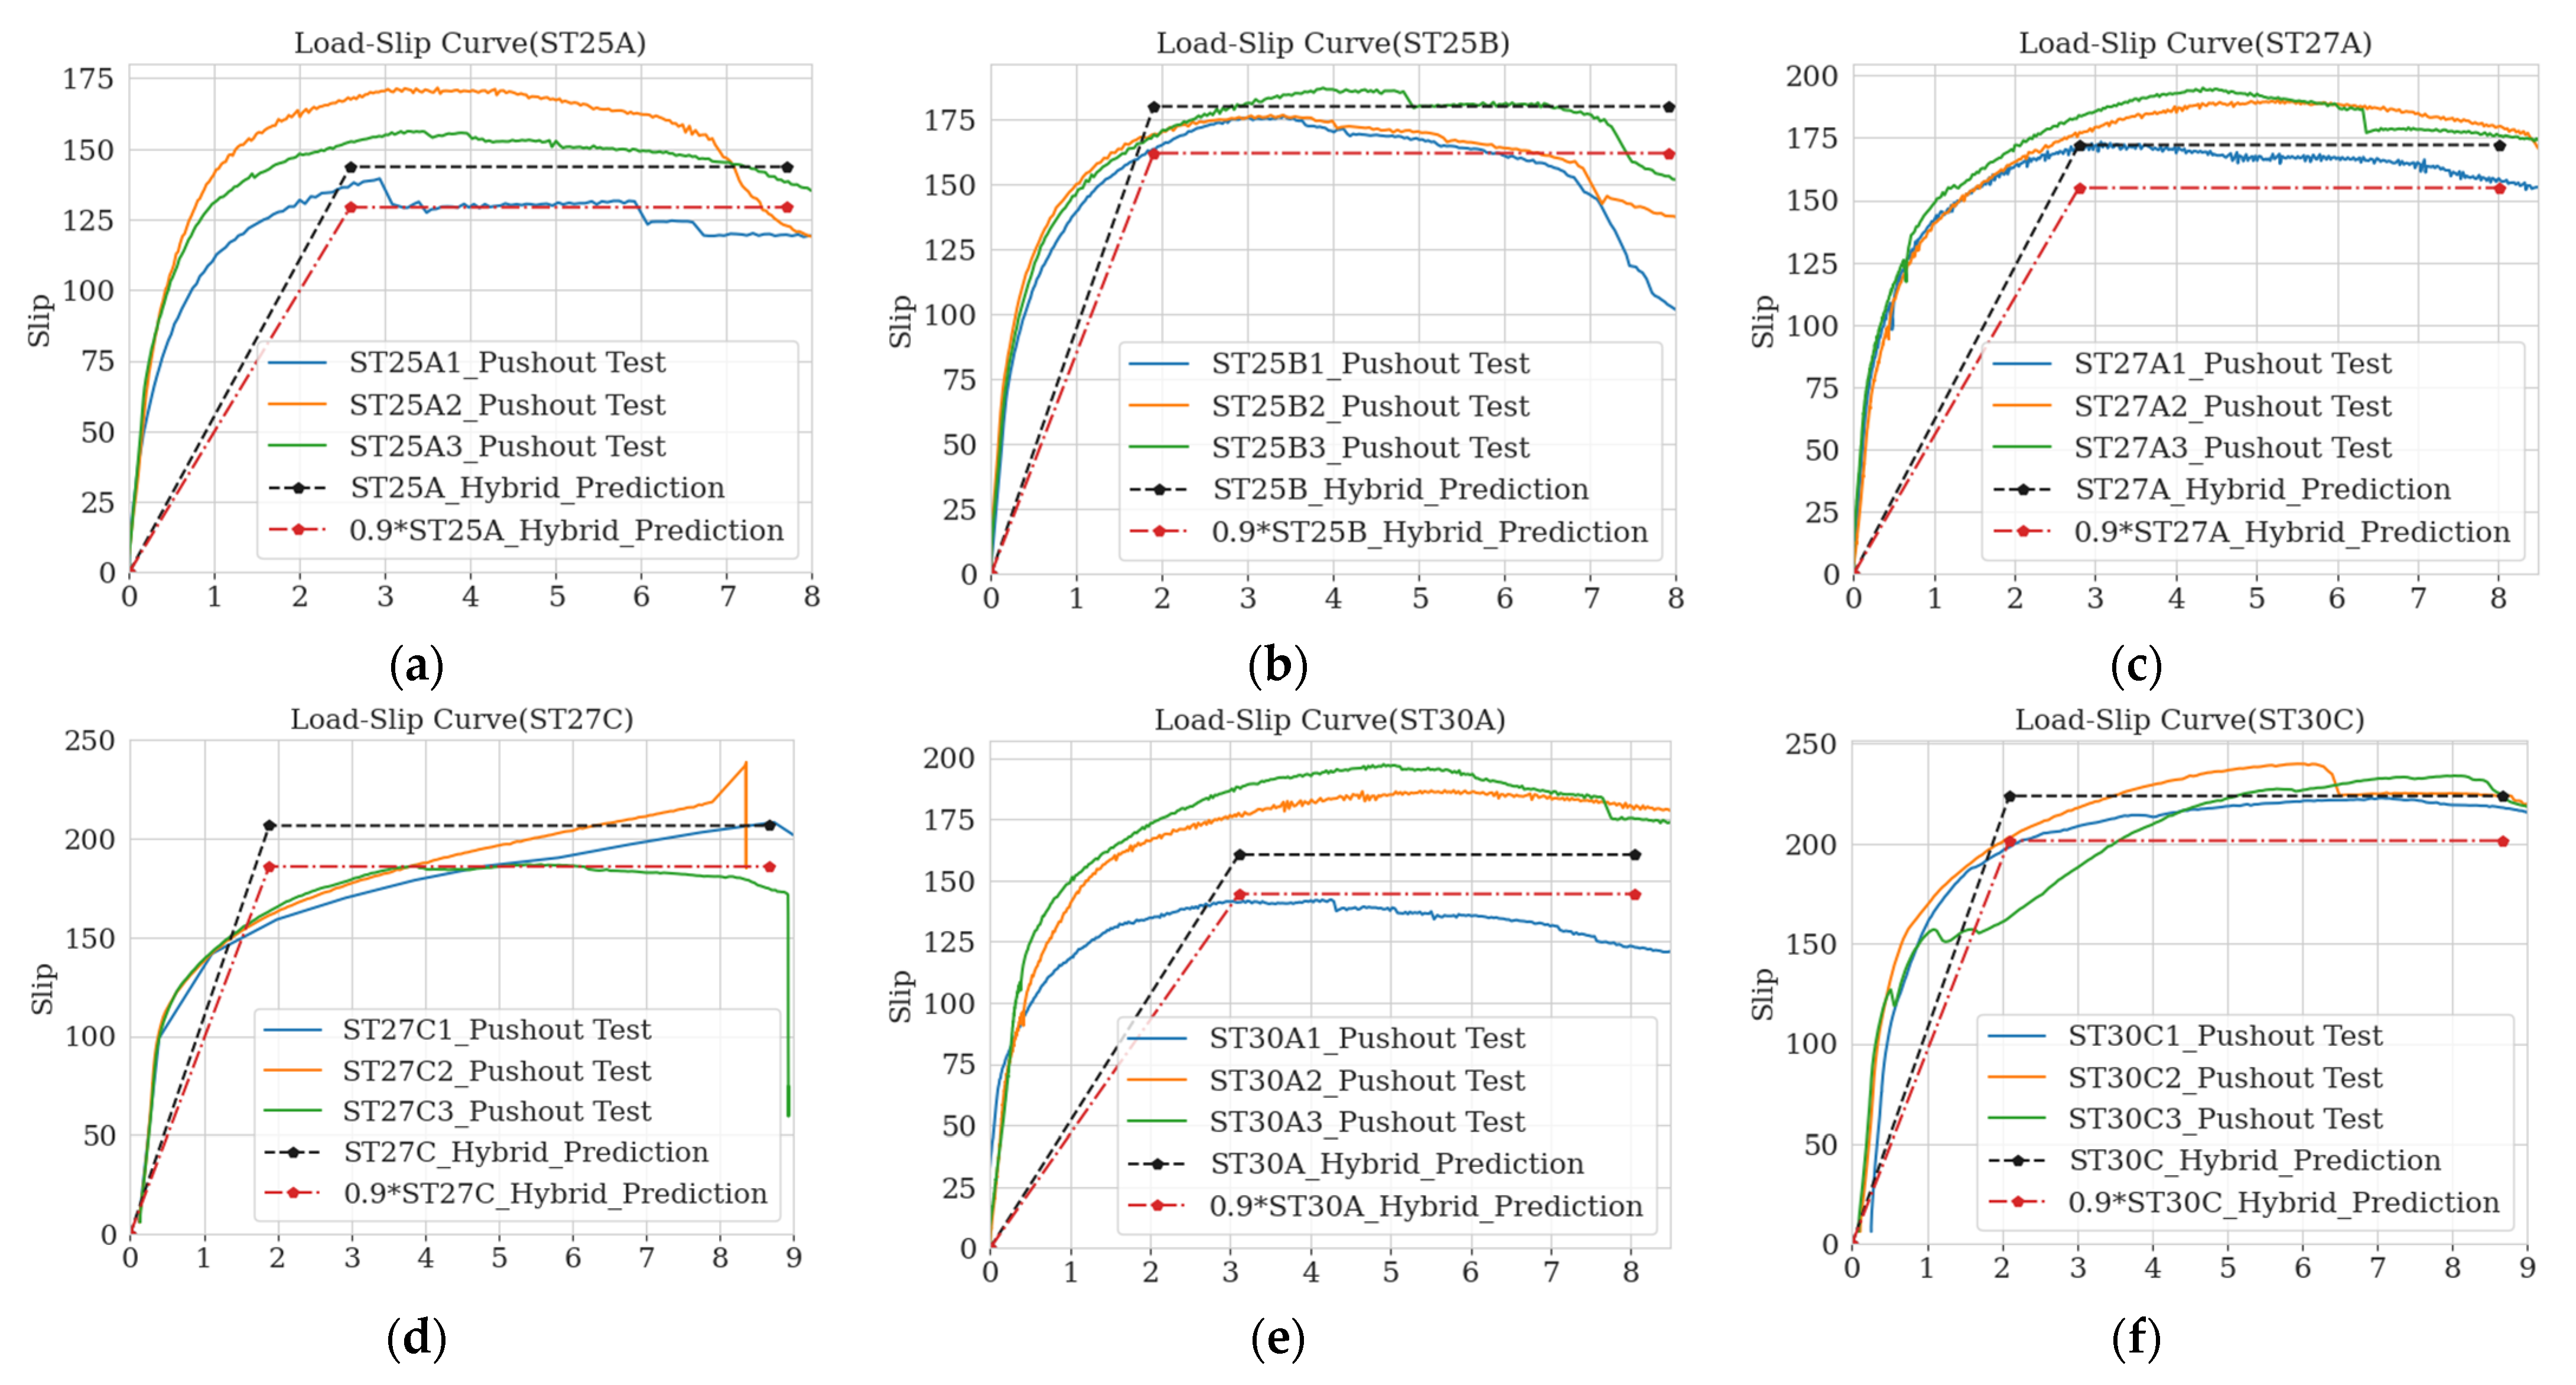
A model trained on an augmented or experiment-based dataset applies only within the range of the applied data. The predictive errors inherently increase for outlier data points outside this range. In order to address this problem, information regarding such data must be incorporated into the existing datasets. An evaluation of the proposed model revealed its feasibility for application to outlier data. In addition, the inclusion of data within this range can improve the evaluation indices and SHAP values, allowing for the application of less conservative strength reduction coefficients.
(5)
This study proposed a method for predicting the ultimate value through a what-if simulation using a set of input features within the dataset range. A strength reduction factor of 0.9 was suggested when the MAPE of the predicted value fell below 10%. In summary, the proposed comprehensive process involves taking the feature input from the dataset, using AutoML for the predictive model, and transforming the predicted values of the ultimate strength and slip by applying the strength reduction factor. This process forms a digital twin model that replaces the design code, expressed through a bilinear load–slip curve.
(6)
The number of features for strength prediction had no constraints, and incorporated the 12 features used in this study, as well as additional shape information related to the spacing and welding of connectors. This approach enables the creation of strength prediction models tailored to specific the stated purpose. Furthermore, the strength prediction model can be extended to include composite connections with precast decks, where the connections are composited using pockets.

Author Contributions

Conceptualization, C.-S.S.; methodology, G.-T.R.; validation, G.-T.R.; investigation, G.-T.R. and N.V.; resources, C.-S.S. and N.V.; data curation, N.V. and C.-H.J.; writing—original draft preparation, G.-T.R.; writing—review and editing, C.-S.S. and C.-H.J.; supervision, C.-S.S.; project administration, C.-S.S.; funding acquisition, C.-S.S. All authors have read and agreed to the published version of the manuscript.

Funding

This research was conducted with the support of the “National R&D Project for Smart Construction Technology (No.23SMIP-A158708-04)”, funded by the Korea Agency for Infrastructure Technology Advancement under the Ministry of Land, Infrastructure and Transport, and managed by the Korea Expressway Corporation. This research was also supported by Chung-Ang University CAYSS in 2022.

Data Availability Statement

The data presented in this study are available upon request from the corresponding author.

Conflicts of Interest

The authors declare no conflicts of interest.

References

  1. Viest, I.M. Investigation of stud shear connectors for composite concrete and steel T-beams. J. Am. Concr. Inst. 1956, 27, 875–891. [Google Scholar] [CrossRef]
  2. ANSI/AISC 360-05; Specification for Structural Steel Buildings. American Institute for Steel Construction: Chicago, IL, USA, 2005.
  3. Ollgaard, J.G.; Slutter, R.G.; Fisher, J.W. Shear strength of stud connectors in lightweight and normal weight concrete. AISC Eng. J. 1971, 8, 55–64. [Google Scholar]
  4. EN 1994-1-1; Eurocode 4: Design of Composite Steel and Concrete Structures—Part 1.1: General Rules and Rules for Buildings. European Committee for Standardization (CEN): Brussels, Belgium, 2004.
  5. Pallarés, L.; Hajjar, J.F. Headed steel stud anchors in composite structures, Part I: Shear. J. Constr. Steel Res. 2010, 66, 198–212. [Google Scholar] [CrossRef]
  6. AASHTO. AASHTO LRFD Bridge Design Codes; American Association of State Highway and Transportation Officials: Washington, DC, USA, 2001. [Google Scholar]
  7. GB50017–2017; Code for Design of Steel Structures. Ministry of Housing and Urban-Rural Development of China: Beijing, China, 2017. (In Chinese)
  8. Driscoll, G.C.; Slutter, R.G. Research on composite design at Lehigh University. In Proceedings of the National Engineering Conference; American Institute of Steel Construction: Chicago, IL, USA, 1961; pp. 18–24. [Google Scholar]
  9. Oehlers, D.J.; Johnson, R.P. The Strength of Stud Shear Connections in Composite Beams. Struct. Eng. 1987, 65B, 44–48. [Google Scholar] [CrossRef]
  10. Döinghaus, P. Zum Zusammenwirken Hochfester Baustoffe in Verbundtragern. Ph.D. Thesis, Aachen, Technische. Hochschule, Lübeck, Germany, 2002. [Google Scholar]
  11. Hicks, S.J. Design shear resistance of headed studs embedded in solid slabs and encasements. J. Constr. Steel Res. 2017, 139, 339–352. [Google Scholar] [CrossRef]
  12. Raissi, M.; Perdikaris, P.; Karniadakis, G.E. Physics-informed neural networks: A deep learning framework for solving forward and inverse problems involving nonlinear partial differential equations. J. Comput. Phys. 2019, 378, 686–707. [Google Scholar] [CrossRef]
  13. Ali, M. Pycaret: An Open Source, Low-Code Machine Learning Library in Python, PyCaret Version 2.3.1. 2020. Available online: https://www.pycaret.org (accessed on 15 June 2021).
  14. Li, A.; Cederwall, K. Push-out Tests on Studs in High Strength and Normal Strength Concrete. J. Constr. Steel Res. 1996, 36, 15–29. [Google Scholar] [CrossRef]
  15. Kim, J.S.; Kwark, J.; Joh, C.; Yoo, S.W.; Lee, K.C. Headed Stud Shear Connector for Thin Ultrahigh-Performance Concrete Bridge Deck. J Constr Steel Res 2015, 108, 23–30. [Google Scholar] [CrossRef]
  16. Wang, J.; Qi, J.; Tong, T.; Xu, Q.; Xiu, H. Static behavior of large stud shear connectors in steel-UHPC composite structures. Eng. Struct. 2019, 178, 534–542. [Google Scholar] [CrossRef]
  17. Oehlers, D.J.; Park, S.M. Shear connectors in composite beams with longitudinally cracked slabs. J. Struct. Eng. 1992, 118, 2004–2022. [Google Scholar] [CrossRef]
  18. Prakash, A.; Anandavalli, N.; Madheswaran, C.K.; Lakshmanan, N. Modified push-out tests for determining shear strength and stiffness of HSS stud connector-experimental study. Int. J. Compos. Mater. 2012, 2, 22–31. [Google Scholar] [CrossRef]
  19. Kumar, P.; Chaudhary, S. Effect of reinforcement detailing on performance of composite connections with headed studs. Eng. Struct. 2019, 179, 476–492. [Google Scholar] [CrossRef]
  20. Okada, J.; Yoda, T.; Lebet, J.P. A study of the grouped arrangements of stud connectors on shear strength behavior. Struct. Eng. /Earthq. Eng. 2006, 23, 75s–89s. [Google Scholar] [CrossRef]
  21. Xu, C.; Sugiura, K.; Masuya, H.; Hashimoto, K.; Fukada, S. Experimental study on the biaxial loading effect on group stud shear connectors of steel-concrete composite bridges. J. Bridge Eng. 2015, 20, 04014110. [Google Scholar] [CrossRef]
  22. Xue, W.; Ding, M.; Wang, H.; Luo, Z. Static behavior and theoretical model of stud shear connectors. J. Bridge Eng. 2008, 13, 623–634. [Google Scholar] [CrossRef]
  23. Xue, D.; Liu, Y.; Yu, Z.; He, J. Static behavior of multi-stud shear connectors for steel-concrete composite bridge. J. Constr. Steel Res. 2012, 74, 1–7. [Google Scholar] [CrossRef]
  24. Huang, H.; Yao, Y.; Zhang, W. A push-out test on partially encased composite column with different positions of shear studs. Eng. Struct. 2023, 289, 116343. [Google Scholar] [CrossRef]
  25. Badie, S.S.; Tadros, M.K.; Kakish, H.F.; Splittgerber, D.L.; Baishya, M.C. Large shear studs for composite action in steel bridge girders. J. Bridge Eng. 2012, 7, 195–203. [Google Scholar] [CrossRef]
  26. Shim, C.S.; Lee, P.G.; Yoon, T.Y. Static behavior of large stud shear connectors. Eng. Struct. 2004, 26, 1853–1860. [Google Scholar] [CrossRef]
  27. Wang, Q.; Liu, Y.; Luo, J.; Lebet, J.P. Experimental study on stud shear connectors with large diameter and high strength. In Proceedings of the 2011 International Conference on Electric Technology and Civil Engineering (ICETCE), Lushan, China, 22–24 April 2011; pp. 340–343. [Google Scholar] [CrossRef]
  28. Yang, F.; Liu, Y.; Li, Y. Push-out tests on large diameter and high strength welded stud connectors. Adv. Civ. Eng. 2018, 2018, 4780759. [Google Scholar] [CrossRef]
  29. Shim, C.S.; Lee, P.G.; Chang, S.P. Design of shear connection in composite steel and concrete bridges with precast decks. J. Constr. Steel Res. 2001, 57, 203–219. [Google Scholar] [CrossRef]
  30. Wang, J.; Xu, Q.; Yao, Y.; Qi, J.; Xiu, H. Static behavior of grouped large headed stud-UHPC shear connectors in composite structures. Compos. Struct. 2018, 206, 202–214. [Google Scholar] [CrossRef]
  31. Semendary, A.A.; Stefaniuk, H.L.; Yamout, D.; Svecova, D. Static performance of stud shear connectors and UHPC in deck-to-girder composite connection. Eng. Struct. 2022, 255, 113917. [Google Scholar] [CrossRef]
  32. Lam, D.; El-Lobody, E. Behavior of headed stud shear connectors in composite beam. J. Struct. Eng. 2005, 131, 96–107. [Google Scholar] [CrossRef]
  33. Nguyen, H.T.; Kim, S.E. Finite element modeling of push-out tests for large stud shear connectors. J. Constr. Steel Res. 2009, 65, 1909–1920. [Google Scholar] [CrossRef]
  34. Qi, J.; Hu, Y.; Wang, J.; Li, W. Behavior and strength of headed stud shear connectors in ultra-high performance concrete of composite bridges. Front. Struct. Civ. Eng. 2019, 13, 1138–1149. [Google Scholar] [CrossRef]
  35. Nick, H.; Aziminejad, A.; Hosseini, M.H.; Laknejadi, K. Damage identification in steel girder bridges using modal strain energy-based damage index method and artificial neural network. Eng. Fail. Anal. 2021, 119, 105010. [Google Scholar] [CrossRef]
  36. Sharma, S.; Sen, S. Bridge damage detection in presence of varying temperature using two-step neural network approach. J. Bridge Eng. 2021, 26, 04021027. [Google Scholar] [CrossRef]
  37. Okazaki, Y.; Okazaki, S.; Asamoto, S.; Chun, P.J. Applicability of machine learning to a crack model in concrete bridges. Comput.-Aided Civ. Infrastruct. Eng. 2020, 35, 775–792. [Google Scholar] [CrossRef]
  38. Lim, S.; Chi, S. Xgboost application on bridge management systems for proactive damage estimation. Adv. Eng. Inform. 2019, 41, 100922. [Google Scholar] [CrossRef]
  39. Ye, X.W.; Jin, T.; Chen, P.Y. Structural crack detection using deep learning–based fully convolutional networks. Adv. Struct. Eng. 2019, 22, 3412–3419. [Google Scholar] [CrossRef]
  40. Feng, D.C.; Liu, Z.T.; Wang, X.D.; Jiang, Z.M.; Liang, S.X. Failure mode classification and bearing capacity prediction for reinforced concrete columns based on ensemble machine learning algorithm. Adv. Eng. Inform. 2020, 45, 101126. [Google Scholar] [CrossRef]
  41. Sadeghi, F.; Yu, Y.; Zhu, X.; Li, J. Damage identification of steel-concrete composite beams based on modal strain energy changes through general regression neural network. Eng. Struct. 2021, 244, 112824. [Google Scholar] [CrossRef]
  42. Dung, C.V.; Sekiya, H.; Hirano, S.; Okatani, T.; Miki, C. A vision-based method for crack detection in gusset plate welded joints of steel bridges using deep convolutional neural networks. Autom. Constr. 2019, 102, 217–229. [Google Scholar] [CrossRef]
  43. Ren, Y.; Huang, J.; Hong, Z.; Lu, W.; Yin, J.; Zou, L.; Shen, X. Image-based concrete crack detection in tunnels using deep fully convolutional networks. Constr. Build. Mater. 2020, 234, 117367. [Google Scholar] [CrossRef]
  44. Paral, A.; Roy, D.K.S.; Samanta, A.K. A deep learning-based approach for condition assessment of semi-rigid joint of steel frame. J. Build. Eng. 2021, 34, 101946. [Google Scholar] [CrossRef]
  45. Gao, X.; Lin, C. Prediction model of the failure mode of beam-column joints using machine learning methods. Eng. Fail. Anal. 2021, 120, 105072. [Google Scholar] [CrossRef]
  46. Degtyarev, V.V.; Naser, M.Z. Boosting machines for predicting shear strength of CFS channels with staggered web perforations. Structures 2021, 34, 3391–3403. [Google Scholar] [CrossRef]
  47. Rahman, J.; Ahmed, K.S.; Khan, N.I.; Islam, K.; Mangalathu, S. Data-driven shear strength prediction of steel fiber reinforced concrete beams using machine learning approach. Eng. Struct. 2021, 233, 111743. [Google Scholar] [CrossRef]
  48. Mangalathu, S.; Shin, H.; Choi, E.; Jeon, J.S. Explainable machine learning models for punching shear strength estimation of flat slabs without transverse reinforcement. J. Build. Eng. 2021, 39, 102300. [Google Scholar] [CrossRef]
  49. Xu, J.G.; Chen, S.Z.; Xu, W.J.; Shen, Z.S. Concrete-to-concrete interface shear strength prediction based on explainable extreme gradient boosting approach. Constr. Build. Mater. 2021, 308, 125088. [Google Scholar] [CrossRef]
  50. Sarothi, S.Z.; Ahmed, K.S.; Khan, N.I.; Ahmed, A.; Nehdi, M.L. Predicting bearing capacity of double shear bolted connections using machine learning. Eng. Struct. 2022, 251, 113497. [Google Scholar] [CrossRef]
  51. Chuang, P.H.; Goh, A.T.; Wu, X. Modeling the capacity of pin-ended slender reinforced concrete columns using neural networks. J. Struct. Eng. 1998, 124, 830–838. [Google Scholar] [CrossRef]
  52. Xu, Y.; Zheng, B.; Zhang, M. Capacity prediction of cold-formed stainless steel tubular columns using machine learning methods. J. Constr. Steel Res. 2021, 182, 106682. [Google Scholar] [CrossRef]
  53. El Ouni, M.H.; Raza, A. Data-driven analysis of concrete-filled steel-tube CFRP-confined NSC columns. Mech. Adv. Mater. Struct. 2022, 29, 5667–5688. [Google Scholar] [CrossRef]
  54. Bai, C.; Nguyen, H.; Asteris, P.G.; Nguyen-Thoi, T.; Zhou, J. A refreshing view of soft computing models for predicting the deflection of reinforced concrete beams. Appl. Soft Comput. 2020, 97, 106831. [Google Scholar] [CrossRef]
  55. Huang, H.; Xue, C.; Zhang, W.; Guo, M. Torsion design of CFRP-CFST columns using a data-driven optimization approach. Eng. Struct. 2022, 251, 113479. [Google Scholar] [CrossRef]
  56. Abambres, M.; He, J. Shear Capacity of Headed Studs in Steel-Concrete Structures: Analytical Prediction via Soft Computing. 2019. Available online: https://hal.archives-ouvertes.fr/hal-02074833 (accessed on 16 December 2023).
  57. Setvati, M.R.; Hicks, S.J. Machine learning models for predicting resistance of headed studs embedded in concrete. Eng. Struct. 2022, 254, 113803. [Google Scholar] [CrossRef]
  58. Degtyarev, V.V.; Hicks, S.J. Reliability-based design shear resistance of headed studs in solid slabs predicted by machine learning models. Archit. Struct. Constr. 2022, 3, 447–473. [Google Scholar] [CrossRef]
  59. Avci-Karatas, C. Application of machine learning in prediction of shear capacity of headed steel studs in steel–concrete composite structures. Int. J. Steel Struct. 2022, 22, 539–556. [Google Scholar] [CrossRef]
  60. Zhu, J.; Farouk, A.I.B. Development of hybrid models for shear resistance prediction of grouped stud connectors in concrete using improved metaheuristic optimization techniques. Structures 2023, 50, 286–302. [Google Scholar] [CrossRef]
  61. Zhang, F.; Wang, C.; Zou, X.; Wei, Y.; Chen, D.; Wang, Q.; Wang, L. Prediction of the Shear Resistance of Headed Studs Embedded in Precast Steel–Concrete Structures Based on an Interpretable Machine Learning Method. Buildings 2023, 13, 496. [Google Scholar] [CrossRef]
  62. Yosri, A.M.; Farouk, A.I.B.; Haruna, S.I.; Farouk Deifalla, A.; Shaaban, W.M. Sensitivity and robustness analysis of adaptive neuro-fuzzy inference system (ANFIS) for shear strength prediction of stud connectors in concrete. Case Stud. Constr. Mater. 2023, 18, e02096. [Google Scholar] [CrossRef]
  63. Elwell, D.J.; Fu, G. Compression Testing of Concrete: Cylinders vs. Cubes (No. FHWA/NY/SR-95/119). 1995. Available online: https://trid.trb.org/view/496307 (accessed on 16 December 2023).
  64. BS 8110-2; Structural Use of Concrete. British Standards Institution: London, UK, 1985.
  65. EN 1992-1-1; Eurocode 2: Design of Concrete Structures—Part 1-1: General Rules and Rules for Buildings. British Standard Institution: London, UK, 2004.
  66. Mander, J.B.; Priestley, M.J.; Park, R. Theoretical stress-strain model for confined concrete. J. Struct. Eng. 1988, 114, 1804–1826. [Google Scholar] [CrossRef]
  67. ASTM A108; Standard Specification for Steel Bar, Carbon and Alloy, Cold-Finished. ASTM Intenational: West Conshohocken, PA, USA, 2018.
  68. Oehlers, D.J. Deterioration in strength of stud connectors in composite bridge beams. J. Struct. Eng. 1990, 116, 3417–3431. [Google Scholar] [CrossRef]
  69. Lee, P.G.; Shim, C.S.; Chang, S.P. Static and fatigue behavior of large stud shear connectors for steel–concrete composite bridges. J. Constr. Steel Res. 2005, 61, 1270–1285. [Google Scholar] [CrossRef]
  70. Shim, C.S.; Kim, D.W. Structural performance of composite joints using bent studs. Int. J. Steel Struct. 2010, 10, 1–13. [Google Scholar] [CrossRef]
  71. Xu, C.; Sugiura, K.; Wu, C.; Su, Q. Parametrical static analysis on group studs with typical push-out tests. J. Constr. Steel Res. 2012, 72, 84–96. [Google Scholar] [CrossRef]
  72. Bonilla Rocha, J.D.; Arrizabalaga, E.M.; Larrúa Quevedo, R.; Recarey Morfa, C.A. Behavior and strength of welded stud shear connectors in composite beam. Rev. Fac. Ing. Univ. Antioq. 2012, 63, 93–104. [Google Scholar]
  73. Gascon, B.; Massicotte, F.; Lagier, A. Behaviour of headed shear stud connectors in composite beams with uhpfrc connection. In Proceedings of the AFGCACI-fib-RILEM International Symposium on Ultra-High Performance Fibre-Reinforced Concrete (Montpellier), Montpellier, France, 2–4 October 2017. [Google Scholar]
  74. Dallam, L.N. Push-Out Tests of Stud and Channel Shear Connectors in Normal-Weight and Lightweight Concrete Slabs; University of Missouri: Columbia, MO, USA, 1968. [Google Scholar]
  75. Chapman, J.C.; Balakrishnan, S. Experiments on composite beams. Struct. Eng. 1964, 42, 369–383. [Google Scholar]
  76. Shim, C.S.; Jeon, S.M.; Kim, D.W. Evaluation of Static Strength of Group Stud Shear Connection in Precast Concrete Deck Bridges. J. Korean Soc. Steel Constr. 2008, 20, 333–345. (In Korean) [Google Scholar]
  77. Zhang, J.; Hu, X.; Fu, W.; Du, H.; Sun, Q.; Zhang, Q. Experimental and theoretical study on longitudinal shear behavior of steel-concrete composite beams. J. Constr. Steel Res. 2020, 171, 106144. [Google Scholar] [CrossRef]
  78. Luo, Y.; Hoki, K.; Hayashi, K.; Nakashima, M. Behavior and strength of headed stud–SFRCC shear connection. I: Experimental study. J. Struct. Eng. 2016, 142, 04015112. [Google Scholar] [CrossRef]
  79. Chen, J.; Wang, S.; Zhang, X.; Xu, H.; Xu, F.; Liu, Y.; Yang, C.; Xia, Q.; Wang, H.; Ding, F.; et al. Investigations on the shearing performance of composite beams with group studs. Adv. Struct. Eng. 2023, 26, 1783–1802. [Google Scholar] [CrossRef]
  80. Saleh, S.M.; Majeed, F.H. Shear strength of headed stud connectors in self-compacting concrete with recycled coarse aggregate. Buildings 2022, 12, 505. [Google Scholar] [CrossRef]
  81. Han, Q.; Wang, Y.; Xu, J.; Xing, Y. Static behavior of stud shear connectors in elastic concrete–steel composite beams. J. Constr. Steel Res. 2015, 113, 115–126. [Google Scholar] [CrossRef]
  82. Peng, K.; Liu, L.; Wu, F.; Wang, R.; Lei, S.; Zhang, X. Experimental and numerical analyses of stud shear connectors in steel–SFRCC composite beams. Materials 2022, 15, 4665. [Google Scholar] [CrossRef]
  83. Huo, J.; Wang, H.; Zhu, Z.; Liu, Y.; Zhong, Q. Experimental study on impact behavior of stud shear connectors between concrete slab and steel beam. J. Struct. Eng. 2018, 144, 04017203. [Google Scholar] [CrossRef]
  84. Hu, Y.; Yin, H.; Ding, X.; Li, S.; Wang, J.Q. Shear behavior of large stud shear connectors embedded in ultra-high-performance concrete. Adv. Struct. Eng. 2020, 23, 3401–3414. [Google Scholar] [CrossRef]
  85. Zhan, Y.; Yin, C.; Liu, F.; Song, R.; Deng, K.; Sun, J. Pushout tests on headed studs and PBL shear connectors considering external pressure. J. Bridge Eng. 2020, 25, 04019125. [Google Scholar] [CrossRef]
  86. Dönmez, A.A. Size effect on the shear capacity of headed studs. Adv. Struct. Eng. 2021, 24, 815–826. [Google Scholar] [CrossRef]
  87. Valente, I.B.; Cruz, P.J. Experimental analysis of shear connection between steel and lightweight concrete. J. Constr. Steel Res. 2009, 65, 1954–1963. [Google Scholar] [CrossRef]
  88. Zhang, S.; Jia, Y.; Ding, Y. Study on the Flexural Behavior of Steel-Concrete Composite Beams Based on the Shear Performance of Headed Stud Connectors. Buildings 2022, 12, 961. [Google Scholar] [CrossRef]
  89. Kisała, D. A finite element analysis of steel plate–concrete composite beams including the influence of stiffness of the connectors on delefction. Czas. Tech. 2016, 2016, 69–80. [Google Scholar]
  90. Wu, F.; Tang, W.; Xue, C.; Sun, G.; Feng, Y.; Zhang, H. Experimental investigation on the static performance of stud connectors in steel-HSFRC composite beams. Materials 2021, 14, 2744. [Google Scholar] [CrossRef] [PubMed]
  91. He, Y.-L.; Guo, S.-J.; Wang, L.-C.; Yang, Y.; Xiang, Y.-Q. Experimental and numerical analysis of grouped stud shear connectors embedded in HFRC. Constr. Build. Mater. 2020, 242, 118197. [Google Scholar] [CrossRef]
  92. Wang, Y.H.; Yu, J.; Liu, J.P.; Chen, Y.F. Shear behavior of shear stud groups in precast concrete decks. Eng. Struct. 2019, 187, 73–84. [Google Scholar] [CrossRef]
  93. Qi, J.; Wang, J.; Li, M.; Chen, L. Shear capacity of stud shear connectors with initial damage: Experiment, FEM model and theoretical formulation. Steel Compos. Struct 2017, 25, 79–92. [Google Scholar] [CrossRef]
  94. Oehlers, D.J. Uni-Directional Fatigue Tests on Stud Shear Connectors. 1992. Available online: https://trid.trb.org/view/1200366 (accessed on 16 December 2023).
  95. Qian, S.; Li, V.C. Influence of concrete material ductility on shear response of stud connections. ACI Mater. J. 2006, 103, 60. [Google Scholar]
  96. Abbass, M.M.; Adi, A.S.; Karkare, B.S. Performance evaluation of shear stud connectors in composite beams with steel plate and RCC slab. Int. J. Earth Sci. Eng. 2011, 4, 586–591. [Google Scholar]
  97. Liu, Y.; Alkhatib, A. Experimental study of static behaviour of stud shear connectors. Can. J. Civ. Eng. 2013, 40, 909–916. [Google Scholar] [CrossRef]
  98. Lin, Z.; Liu, Y.; He, J. Behavior of stud connectors under combined shear and tension loads. Eng. Struct. 2014, 81, 362–376. [Google Scholar] [CrossRef]
  99. Nguyen, G.B.; Machacek, J. Effect of local small diameter stud connectors on behavior of partially encased composite beams. Steel Compos. Struct 2016, 20, 251–266. [Google Scholar] [CrossRef]
  100. Xu, Q.; Sebastian, W.; Lu, K.; Yao, Y.; Wang, J. Shear behaviour and calculation model for stud-UHPC connections: Finite element and theoretical analyses. Eng. Struct. 2022, 254, 113838. [Google Scholar] [CrossRef]
  101. Xu, C.; Sugiura, K. FEM analysis on failure development of group studs shear connector under effects of concrete strength and stud dimension. Eng. Fail. Anal. 2013, 35, 343–354. [Google Scholar] [CrossRef]
  102. Zhan, Y.; Lu, S.; Zheng, Y.; Jiang, H.; Xiong, S. Theoretical study on the influence of welding collar on the shear behavior of stud shear connectors. KSCE J. Civ. Eng. 2021, 25, 1353–1368. [Google Scholar] [CrossRef]
  103. Wang, Q.; Liu, Y.Q.; Lebet, J.P. Nonlinear Finite-Element Analysis of the Shear Behaviour of Stud Connectors. In Proceedings of the Eleventh International Conference on Computational Structure Technology, Dubrovnik, Croatia, 4–7 September 2012. [Google Scholar]
  104. Mia, M.M.; Bhowmick, A.K. Static Strength of Headed Shear Stud Connectors Using Finite Element Analysis. In Proceedings of the 6th International Conference on Engineering Mechanics and Materials, Vancouver, BC, Canada, 31 May–3 June 2017. [Google Scholar]
  105. Baldwin, J.W. Composite Bridge Stringers-Final Report (No. 63-2). 1970. Available online: https://trid.trb.org/view/102492 (accessed on 16 December 2023).
  106. Shim, C.S.; Lee, P.G.; Kim, D.W.; Chung, C.H. Effects of group arrangement on the ultimate strength of stud shear connection. In Composite Construction in Steel and Concrete VI; ASCE: Reston, VA, USA, 2011; pp. 92–101. [Google Scholar] [CrossRef]
  107. Zhang, J.; Hu, X.; Wu, J.; Lim, Y.M.; Gong, S.; Liu, R. Shear behavior of headed stud connectors in steel-MPC based high strength concrete composite beams. Eng. Struct. 2021, 249, 113302. [Google Scholar] [CrossRef]
  108. Liu, Y.; Zhang, Q.; Bao, Y.; Bu, Y. Static and fatigue push-out tests of short headed shear studs embedded in Engineered Cementitious Composites (ECC). Eng. Struct. 2019, 182, 29–38. [Google Scholar] [CrossRef]
  109. Sun, Q.; Nie, X.; Denavit, M.D.; Fan, J.; Liu, W. Monotonic and cyclic behavior of headed steel stud anchors welded through profiled steel deck. J. Constr. Steel Res. 2019, 157, 121–131. [Google Scholar] [CrossRef]
  110. Cui, C.; Song, L.; Liu, R.; Liu, H.; Yu, Z.; Jiang, L. Shear behavior of stud connectors in steel bridge deck and ballastless track structural systems of high-speed railways. Constr. Build. Mater. 2022, 341, 127744. [Google Scholar] [CrossRef]
  111. Prokhorenkova, L.; Gusev, G.; Vorobev, A.; Dorogush, A.V.; Gulin, A. Catboost: Unbiased boosting with categorical features. In Proceedings of the 32nd International Conference on Neural Information Processing Systems, Montréal, QC, Canada, 3–8 December 2018; Curran Associates Inc.: Red Hook, NY, USA, 2018; pp. 6639–6649. [Google Scholar]
  112. Chen, T.; Guestrin, C. Xgboost: A scalable tree boosting system. In Proceedings of the 22nd ACM Sigkdd International Conference on Knowledge Discovery and Data Mining, New York, NY, USA, 13–17 August 2016; pp. 785–794. [Google Scholar] [CrossRef]
  113. Breiman, L. Random forests. Mach. Learn. 2001, 45, 5–32. [Google Scholar] [CrossRef]
  114. Ke, G.L.; Meng, Q.; Finley, T.; Wang, T.F.; Chen, W.; Ma, W.D.; Ye, Q.W.; Liu, T.Y. LightGBM: A highly efficient gradient boosting decision tree. In Proceedings of the 31st Annual Conference on Neural Information Processing Systems, Long Beach, CA, USA, 4–9 December 2017; pp. 3146–3154. [Google Scholar]
  115. Geurts, P.; Ernst, D.; Wehenkel, L. Extremely randomized trees. Mach. Learn. 2006, 63, 3–42. [Google Scholar] [CrossRef]
  116. Lundberg, S.M.; Lee, S.I. A unified approach to interpreting model predictions. In Advances in Neural Information Processing Systems; MIT Press: Cambridge, MA, USA, 2017; pp. 4765–4774. [Google Scholar]
  117. Oehlers, D.J.; Bradford, M.A. Elementary Behaviour of Composite Steel and Concrete Structural Members; Elsevier: Amsterdam, The Netherlands, 1999. [Google Scholar]
Figure 1. Geometric dimensions and the principle of the resistance of the pushout test specimen.
Buildings 14 00328 g001
Figure 2. Digital twin in design phase for pushout model.
Buildings 14 00328 g002
Figure 3. Correlation matrix of features in the dataset: (a) experimental dataset (strength); (b) augmented dataset (strength); (c) experimental dataset (slip).
Buildings 14 00328 g003
Figure 4. Histogram of features derived from the augmented data for predicting ultimate strength.
Buildings 14 00328 g004
Figure 5. Histogram of features derived from experimental data for predicting ultimate slip.
Buildings 14 00328 g005
Figure 6. Data split for training and testing using a stratification strategy: (a) experimental dataset (strength) for stud diameter; (b) augmented dataset (strength) for stud diameter; (c) experimental dataset (slip) for concrete thickness.
Buildings 14 00328 g006
Figure 7. Comparison between traditional machine learning and AutoML.
Buildings 14 00328 g007
Figure 8. Model pipeline.
Buildings 14 00328 g008
Figure 9. Residuals of ensemble models for ultimate strength prediction using the experimental dataset: (a) CatBoost; (b) ExtraTree; (c) XGBoost; (d) LightGBM; (e) Random Forest; (f) Voting.
Buildings 14 00328 g009aBuildings 14 00328 g009b
Figure 10. SHAP value of each ensemble model for ultimate strength prediction with the experimental dataset: (a) CatBoost; (b) ExtraTrees; (c) XGBoost; (d) LightGBM; (e) Random Forest.
Buildings 14 00328 g010
Figure 11. SHAP value of the Voting Regressor for ultimate strength prediction with the experimental dataset.
Buildings 14 00328 g011
Figure 12. Residuals of ensemble models for ultimate strength prediction with the augmented dataset: (a) CatBoost; (b) ExtraTrees; (c) XGBoost; (d) Random Forest; (e) LightGBM; (f) Voting.
Buildings 14 00328 g012aBuildings 14 00328 g012b
Figure 13. SHAP value of each ensemble model for ultimate strength prediction with the augmented dataset: (a) CatBoost; (b) ExtraTrees; (c) XGBoost; (d) Random Forest; (e) LightGBM.
Buildings 14 00328 g013
Figure 14. SHAP value of the Voting Regressor for ultimate strength prediction with the augmented dataset.
Buildings 14 00328 g014
Figure 15. Residuals of ensemble models for ultimate slip prediction with the experimental dataset: (a) LightGBM; (b) Random Forest; (c) CatBoost; (d) ExtraTrees; (e) XGBoost; (f) Voting.
Buildings 14 00328 g015aBuildings 14 00328 g015b
Figure 16. SHAP value of each ensemble model for ultimate slip prediction with the experimental dataset: (a) LightGBM; (b) Random Forest; (c) CatBoost; (d) ExtraTrees; (e) XGBoost.
Buildings 14 00328 g016
Figure 17. SHAP value of the Voting Regressor for ultimate slip prediction with the experimental dataset.
Buildings 14 00328 g017
Figure 18. What-if simulation of predictions for the ultimate strength of static shear connections.
Buildings 14 00328 g018
Figure 19. Load–slip curve with experimental and predicted value: (a) ST25A; (b) ST25B; (c) ST27A; (d) ST27C; (e) ST30A; (f) ST30C.
Buildings 14 00328 g019
Table 1. Equations for ultimate strength specified in design codes.
Eurocode 4 [4]AASHTO LRFD [6]GB50017 [7]
Equation P R d = m i n 0.29 α d s 2 f c k E c γ v , 0.8 f u π d s 2 4 γ v Q r = Φ s c 0.5 A s . E c m f c d Φ s c A s . f u N v = 0.43 A s . E c f c 0.7 A s f s u
Partial factor γ V = 1.25
( α = 0.2 h s c d + 1 f o r 3 h s c d 4 , 1   f o r h s c d > 4
Φ s c = 0.85-
Range of
design parameter(s)
16   m m d s 25   m m
f u 500   N / m m 2
20   M p a f c k 60   M p a
414   M P a f u 400   M P a f s u
10   mm d s 25   mm
Table 2. Proposed equations for ultimate strength in research.
AuthorEquationAuthorEquation
Viest [1] Q n v = 5.25 d 2 f c 4000 f c ( i f d < 1 )
Q n v = 5 d f c 4000 f c ( i f d > 1 )
(units: pounds, inches)
Ollgaard et al. [3] Q n v s = 0.5 A s f c E c < A s F u
(units: kips, inches)
Driscoll and Slutter [8] Q n v = 932 d 2 f c ; A s ( i f f d > 4.2 )
Q n v = 222 h d f c ; A s ( i f f d < 4.2 )
(units: kips, inches)
Oehlers et al. [9] P R d = k f u π d 2 4 E c m E s c 0.4 f c k f u 0.35 1 γ v
(units: MPa, mm)
Döinghaus [10] P R d = 0.92 f u π d 2 4 + η f c k d d o h w 1 γ v
(units: MPa, mm)
Hicks [11] P R d = 0.25 d 2 f c k E c m γ v f o r h s c d > 4 ( c o n c r e t e   f a i l u r e )
P R d = 0.92 f u π d 2 4 + η f c k d d o h w 1 γ v s t e e l   f a i l u r e
(units: kips, inches)
Table 3. Various research on shear resistance prediction using machine learning.
ResearchNumber of Data and FeaturesML Models
Abambres et al. (2019) [56]
-
Number of data: 242
-
Features: D, h, fcm, Ecm, Fu, ddom, hdom
-
Artificial Neural Network (ANN)
Setvati et al. (2022) [57]
-
Number of data: 242
-
Features: D, h, fcm, Ecm, Fu, ddom, hdom
-
Linear Regression
-
Decision Tree
-
Ensemble Decision Tree
-
Support Vector Machine
-
Gausian Pross
-
ANN
Degtyrev et al. (2022) [58]
-
Number of data: 242 (NWC), 90 (LWC)
-
Features: fcm, Ecm, Fu, h, ddom, hdom, h/D, concrete density (only LWC)
-
KNN
-
Decision Tree
-
Random Forest
-
GBR
-
XGBoost
-
LightGBM
-
CATBOOST
-
SVR
-
ANN
Avci-karata et al. (2022) [59]
-
Number of data: 215
-
Features: D, fcm, Fu
-
Minimax Probability Machine Learning (MPMR)
-
Extreme Learning Machine (ELM)
Zhu et al. (2023) [60]
-
Number of data: 232
-
Features: fcm, Fu, D, h, s, n
-
ANN-IEPSO
-
ANN-PSO
Zhang et al. (2023) [61]
-
Number of data: 428
-
Features: D, h, fcm, Ecm, Fu, n
-
SVM
-
ANN
-
Decision Tree
-
Random Forest
-
GBDT
Yosri et al. (2023) [62]
-
Number of data: 232
-
Features: fc, Fu, h, s, n, ϕ
-
ANFIS
-
ELM
-
ANN
Table 4. Hyperparameters of the ensemble model.
HyperparameterCatboostXGBoostLightGBMRandom ForestExtraTrees
Learning_rate0.034/0.036/0.010.15/0.3/0.010.1
subsample0.80.2/1/0.91.0
n_estimators 140/100/110100/230/100100/100/210100/100/210
L2_leaf_reg3
Depth
Border_count254
Objective Reg_squarederrorRegression
Colsample_bynode 1
Eval_metricRMSERMSE
iterations1000
Gamma 0
Max_features 1.01.0
Max_depth 5/6/3 None/None/7None/None/7
Min_child_weight 2/1/40.001
Min_child_samples 20/26/20
Min_sample_leaf 1/1/21/1/2
Min_samples_split 2/2/22/2/2
Reg_alpha 0.2/0/0.00050.0/0.005/0.0
Reg_lambda 0.001/1/0.150.0/4/0.0
Scale_pos_weight 1.6/1/26.6
Num_leaves 31
Boosting type gbdt
boostrap TrueFalse
Experimental data for strength/augmented data for strength/experimental data for slips.
Table 5. Metrics for the prediction of ultimate strength and slip.
CatboostXGBoostRandom ForestLightGBMExtraTreesVoting
Prediction for ultimate strength
(Experimental data)
MAE4.67396.60955.82847.93782.83035.117
MSE49.044684.100377.5727145.668536.821058.0090
RMSE7.00329.17068.807512.06936.06807.6164
R20.98750.97850.98020.96280.99060.9852
RMSLE0.06550.08600.08450.10040.05620.0707
MAPE0.04260.06120.05400.09610.02510.0458
Prediction for ultimate strength
(Experimental data)
MAE4.57022.80285.20546.06412.48394.1127
MSE43.271529.482566.349283.379329.091041.4577
RMSE6.57815.42988.14559.13925.39366.4388
R20.98920.99260.98340.97910.99270.9890
RMSLE0.05970.04770.07390.08400.4740.0569
MAPE0.04000.02400.04600.05280.02130.0538
Prediction for ultimate slip
(Experimental data)
MAE1.14461.30731.04791.08051.26491.3768
MSE2.63403.28252.66832.53153.49543.2119
RMSE1.62291.81181.63351.59111.86961.7922
R20.57820.47440.57270.59470.44030.5838
RMSLE0.14430.16380.14320.14370.16730.1675
MAPE0.13070.15030.11860.12620.14480.1573
Disclaimer/Publisher’s Note: The statements, opinions and data contained in all publications are solely those of the individual author(s) and contributor(s) and not of MDPI and/or the editor(s). MDPI and/or the editor(s) disclaim responsibility for any injury to people or property resulting from any ideas, methods, instructions or products referred to in the content.

