
Research on Damage Identification of Arch Bridges Based on Deflection Influence Line Analytical Theory


Abstract
:1. Introduction
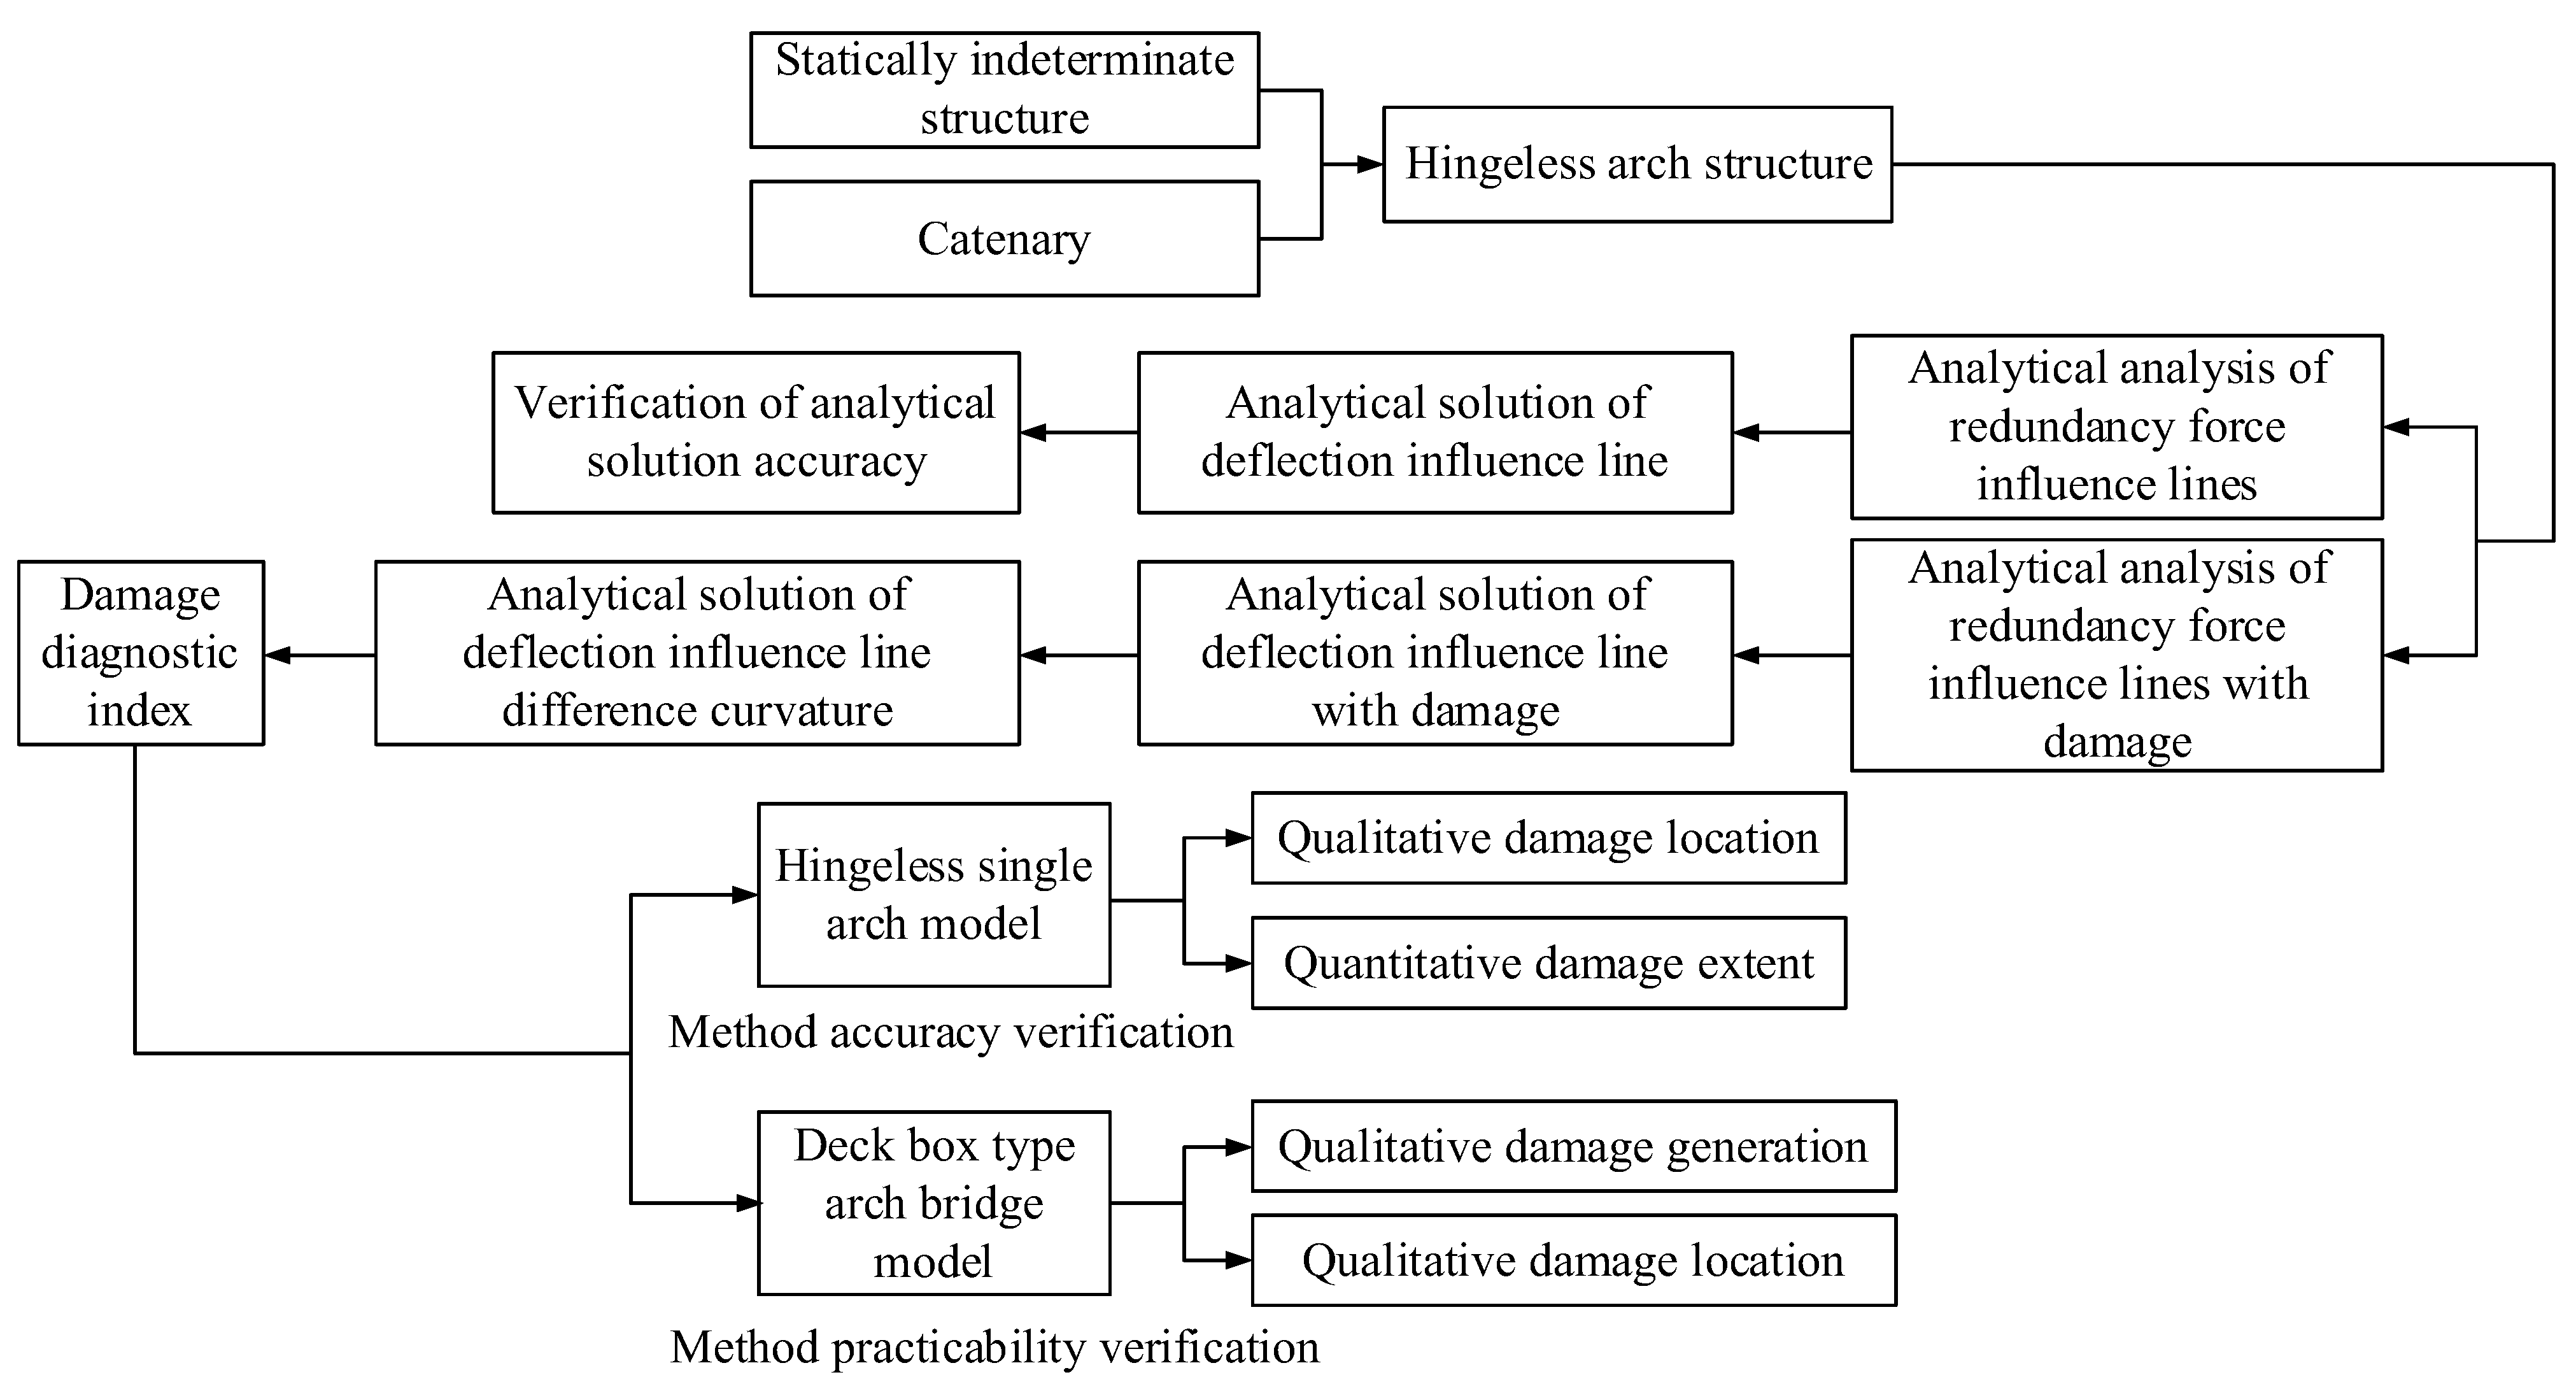
2. Deflection Influence Line Analytical Solution of Hingeless Arch in Non-Damaged Condition
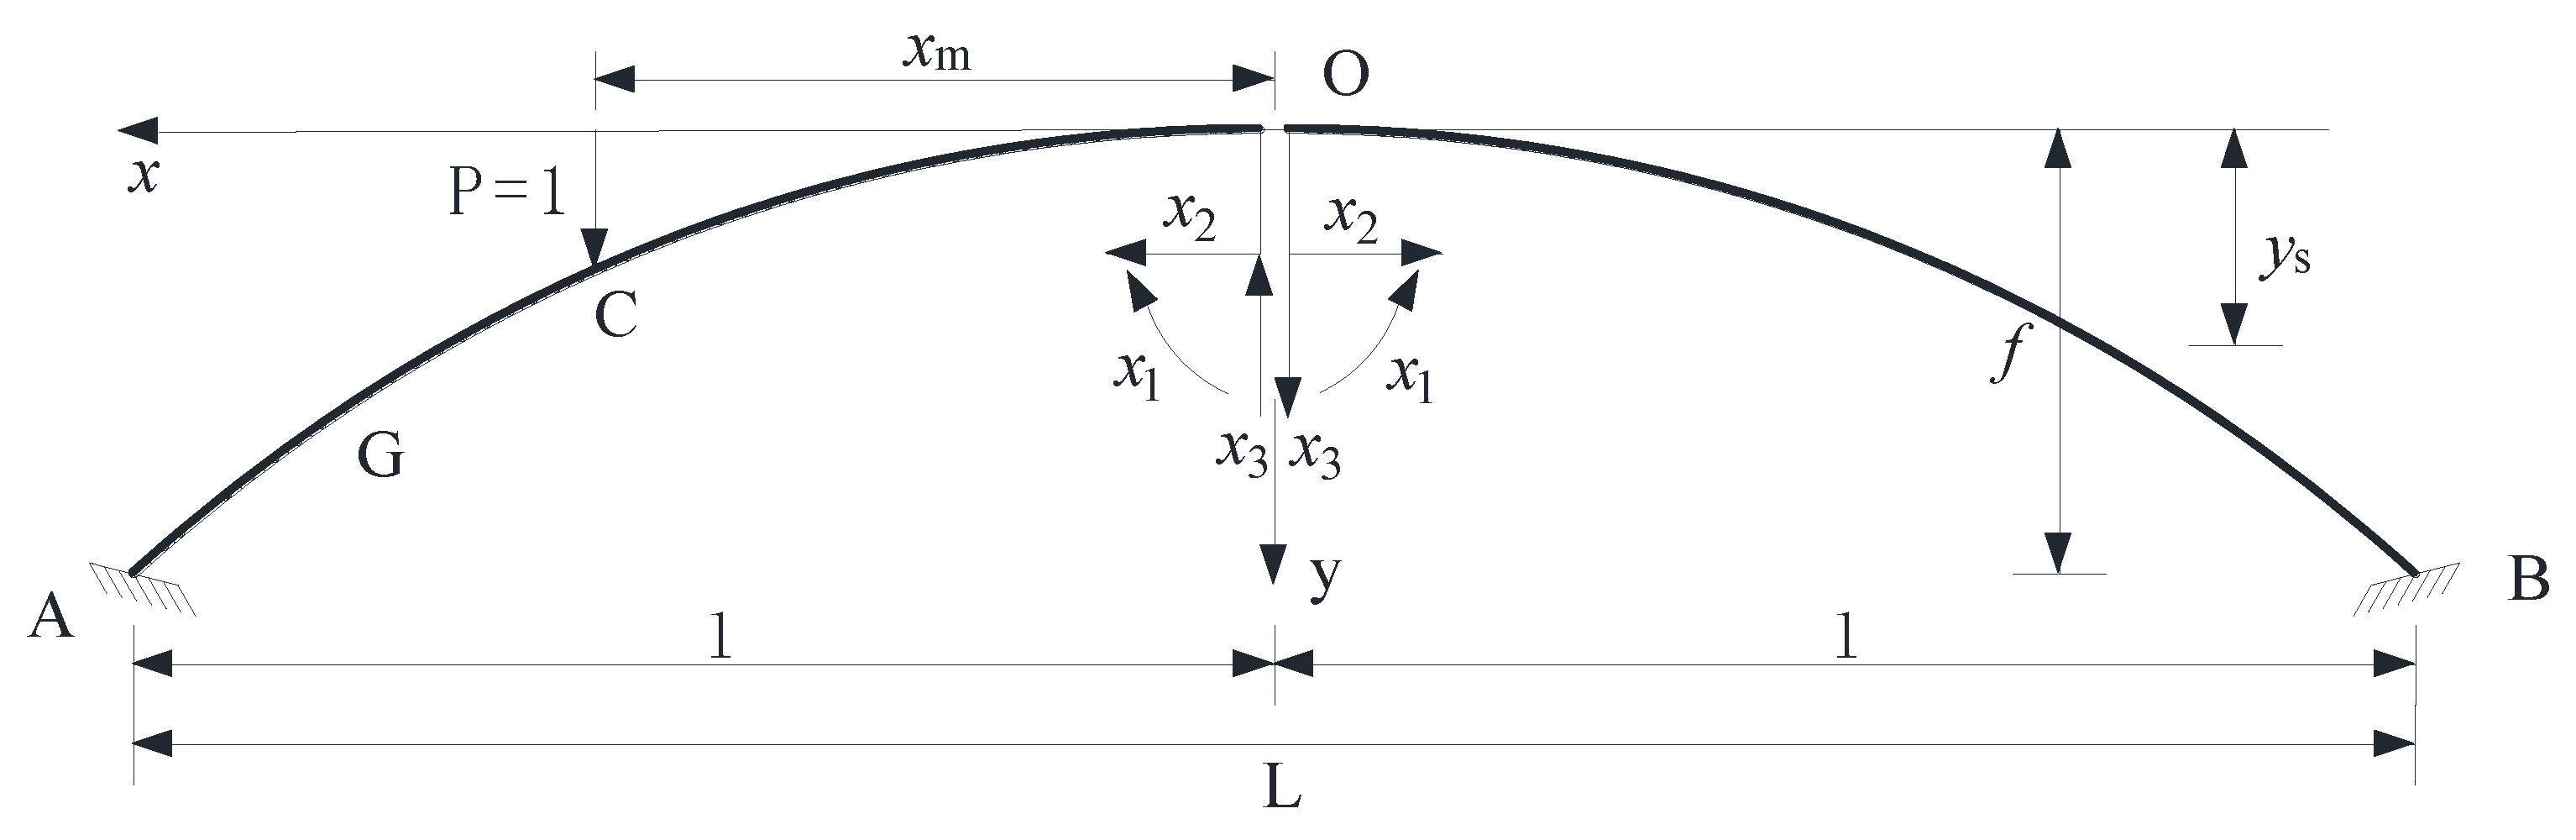
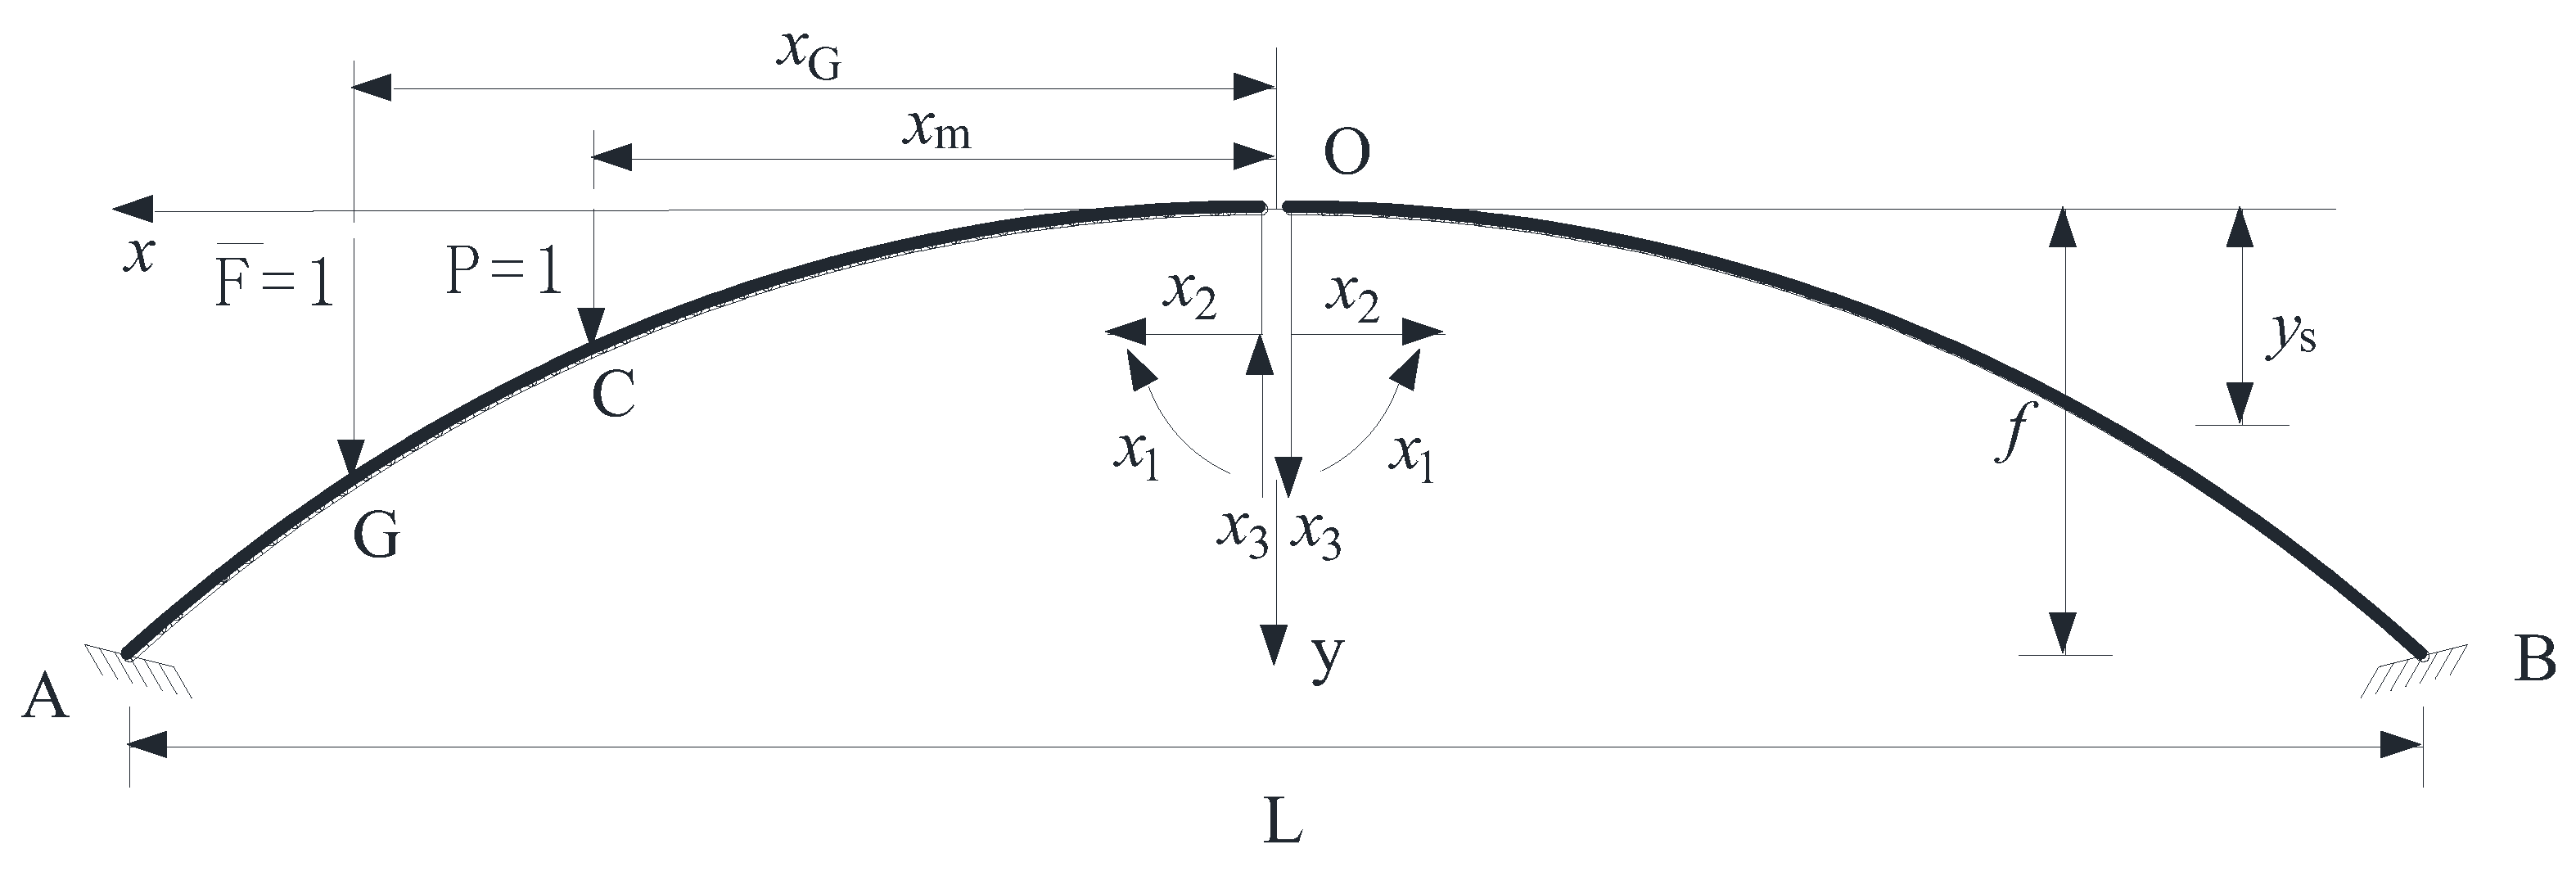
2.1. Redundancy Force Influence Line of Variable Section Hingeless Arch in Non-Damaged Condition
2.2. Deflection Influence Line Analytical Solution of Variable Section Hingeless Arch in Non-Damaged Condition
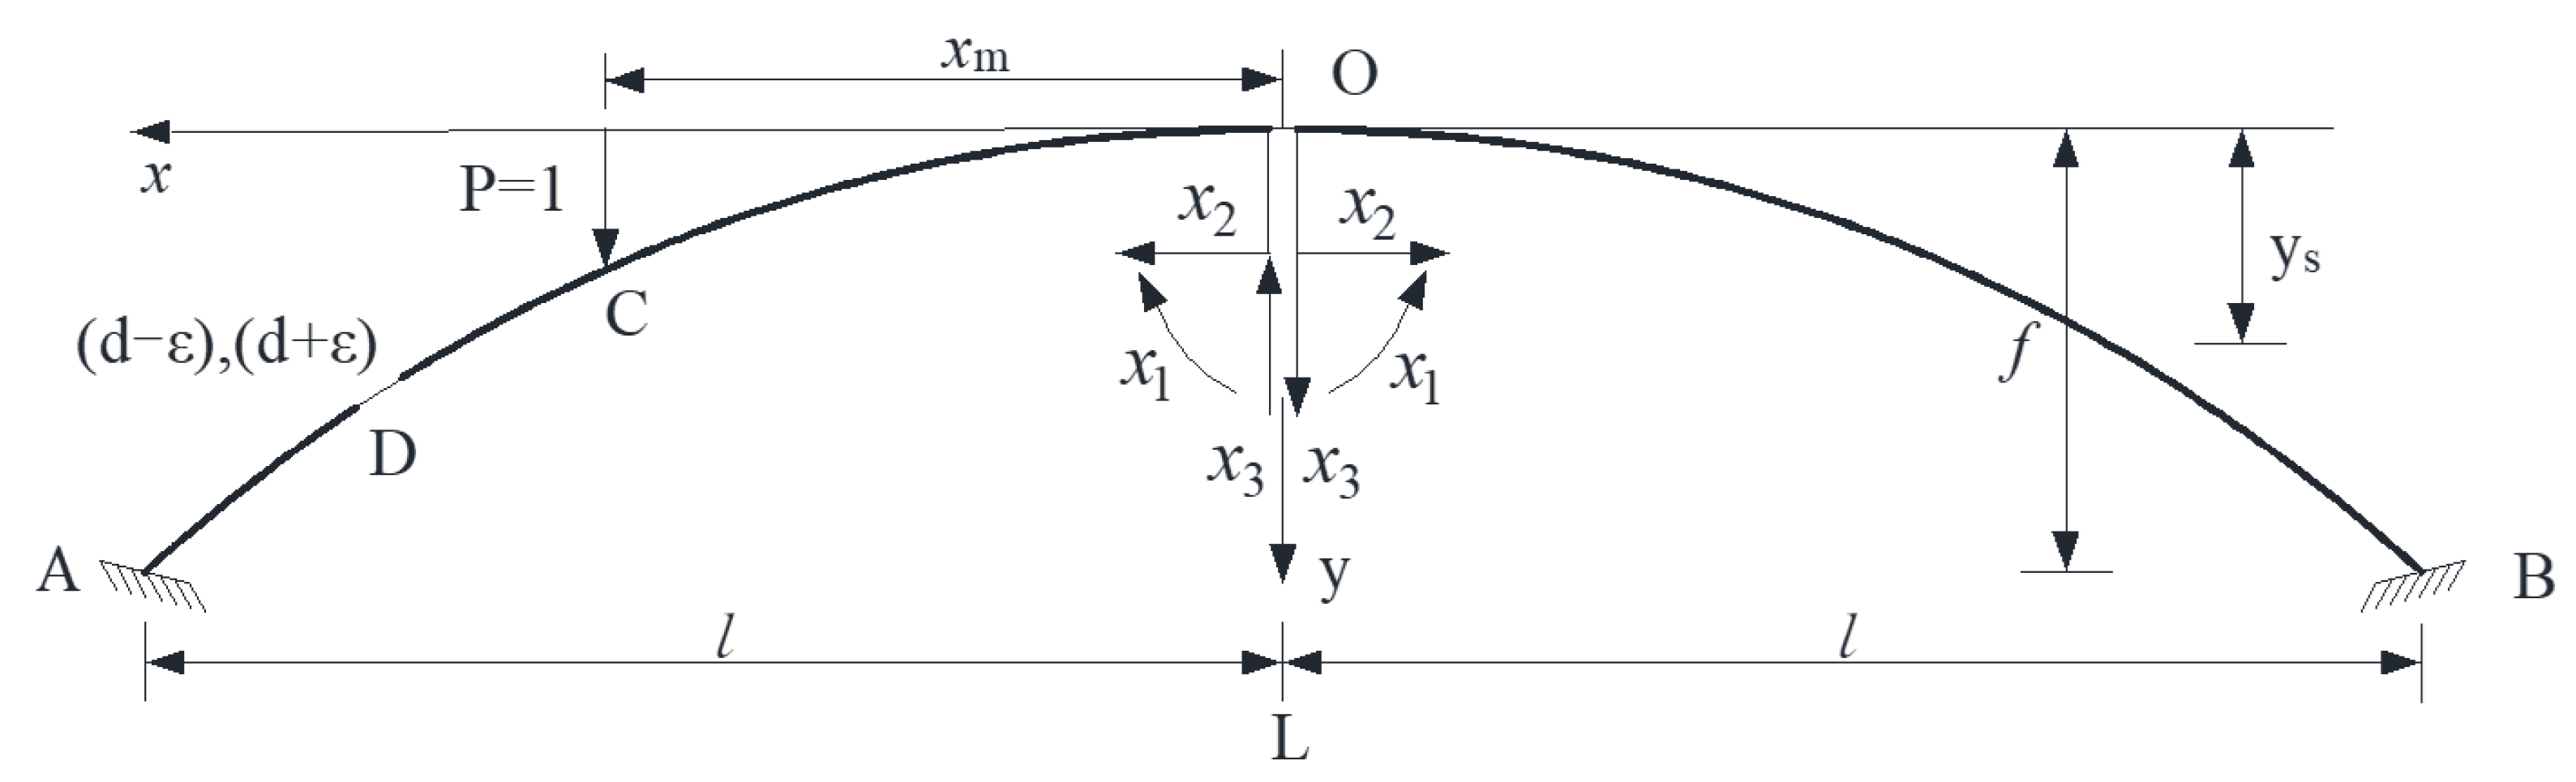
3. Deflection Influence Line Analytical Solution of Hingeless Arch in Damaged Condition
3.1. Redundancy Force Influence Line of Constant Section Hingeless Arch in Damaged Condition
3.2. Deflection Influence Line Analytical Solution of Constant Section Hingeless Arch in Damaged Condition
4. Establishment of Damage Identification Index DILDC
5. Example Analysis
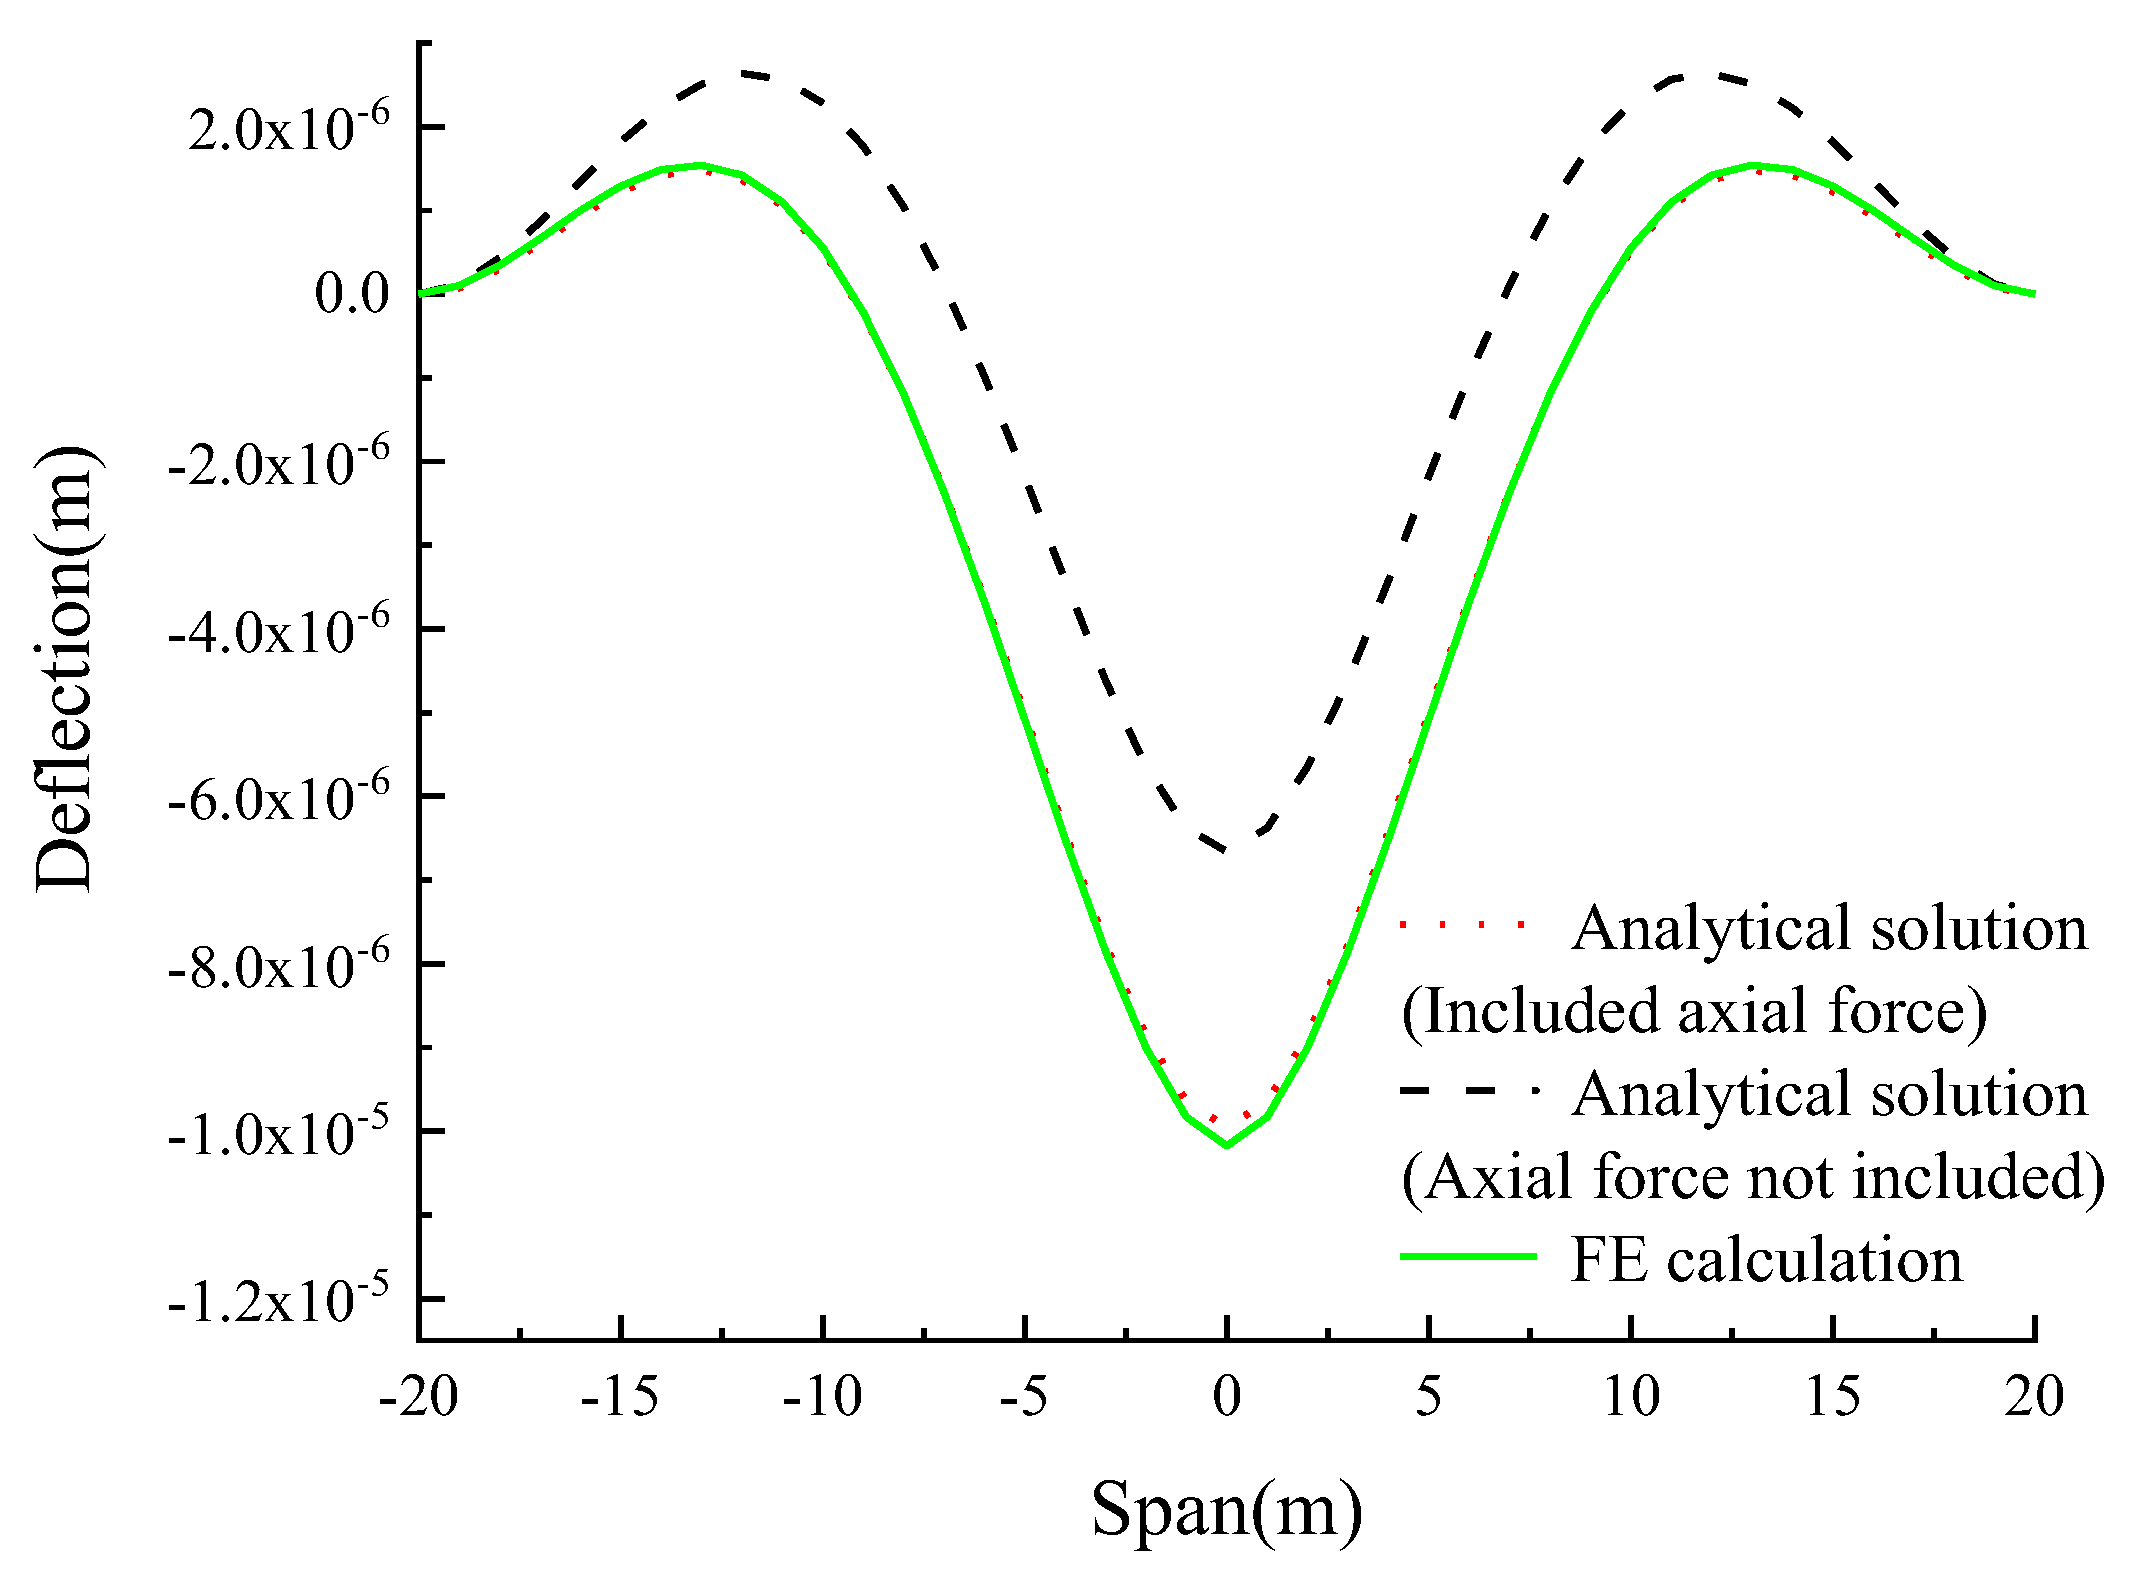
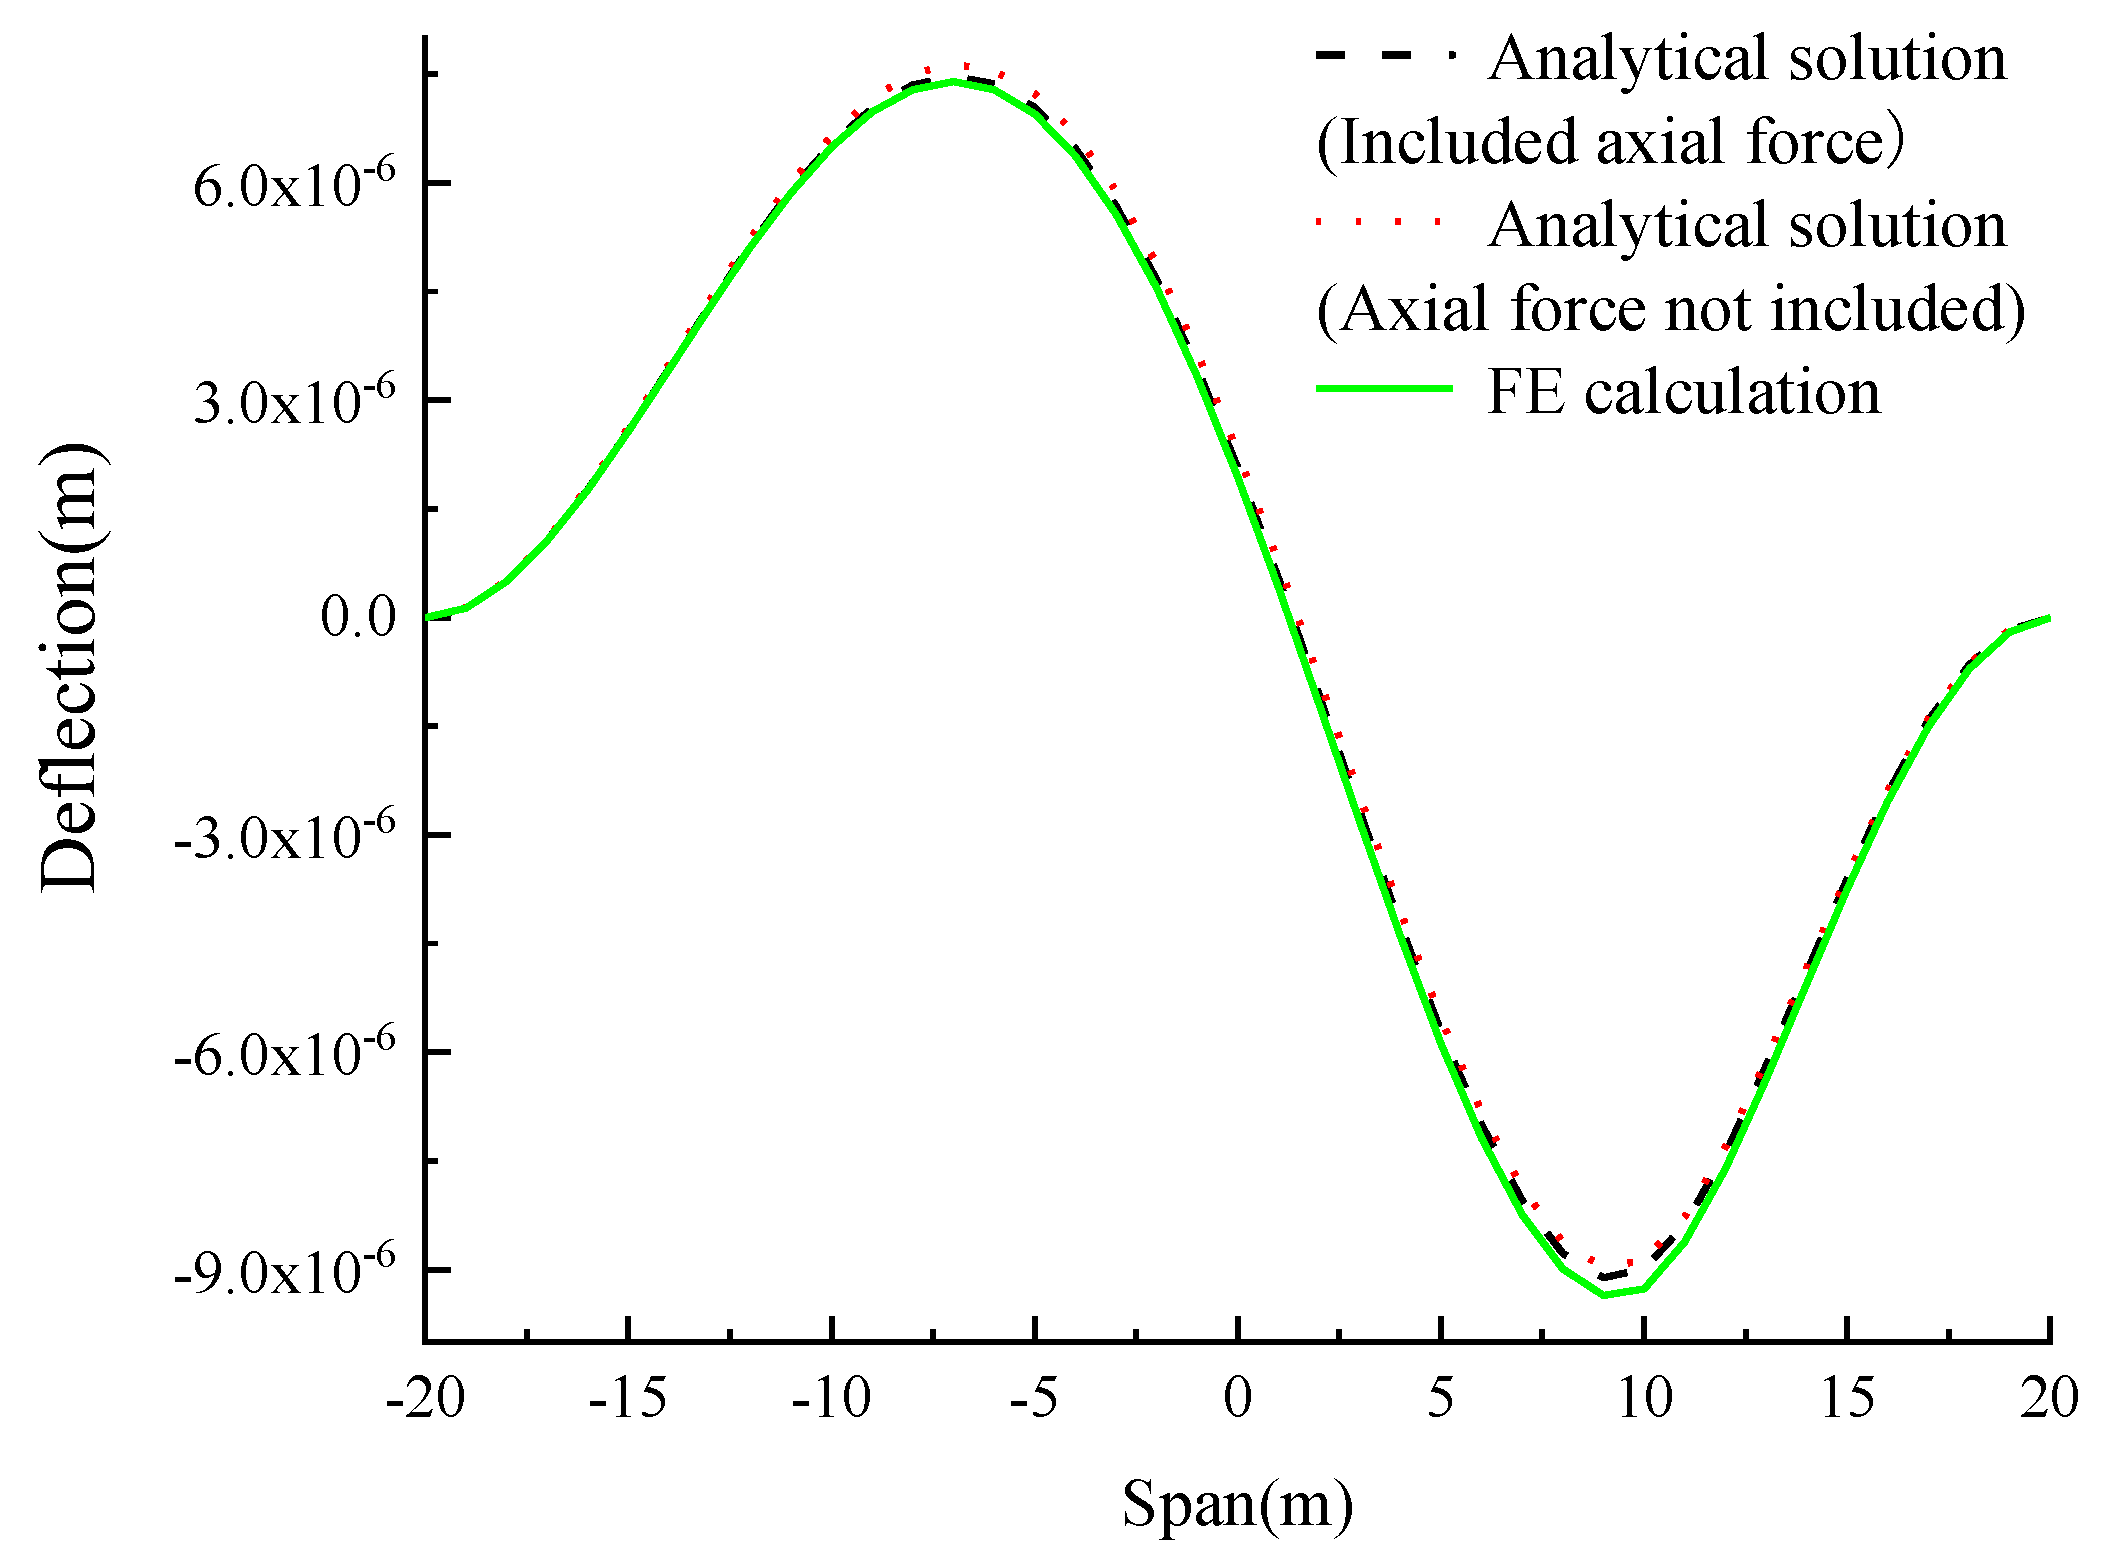
5.1. Accuracy Analysis of the Deflection Influence Line Analytical Solution
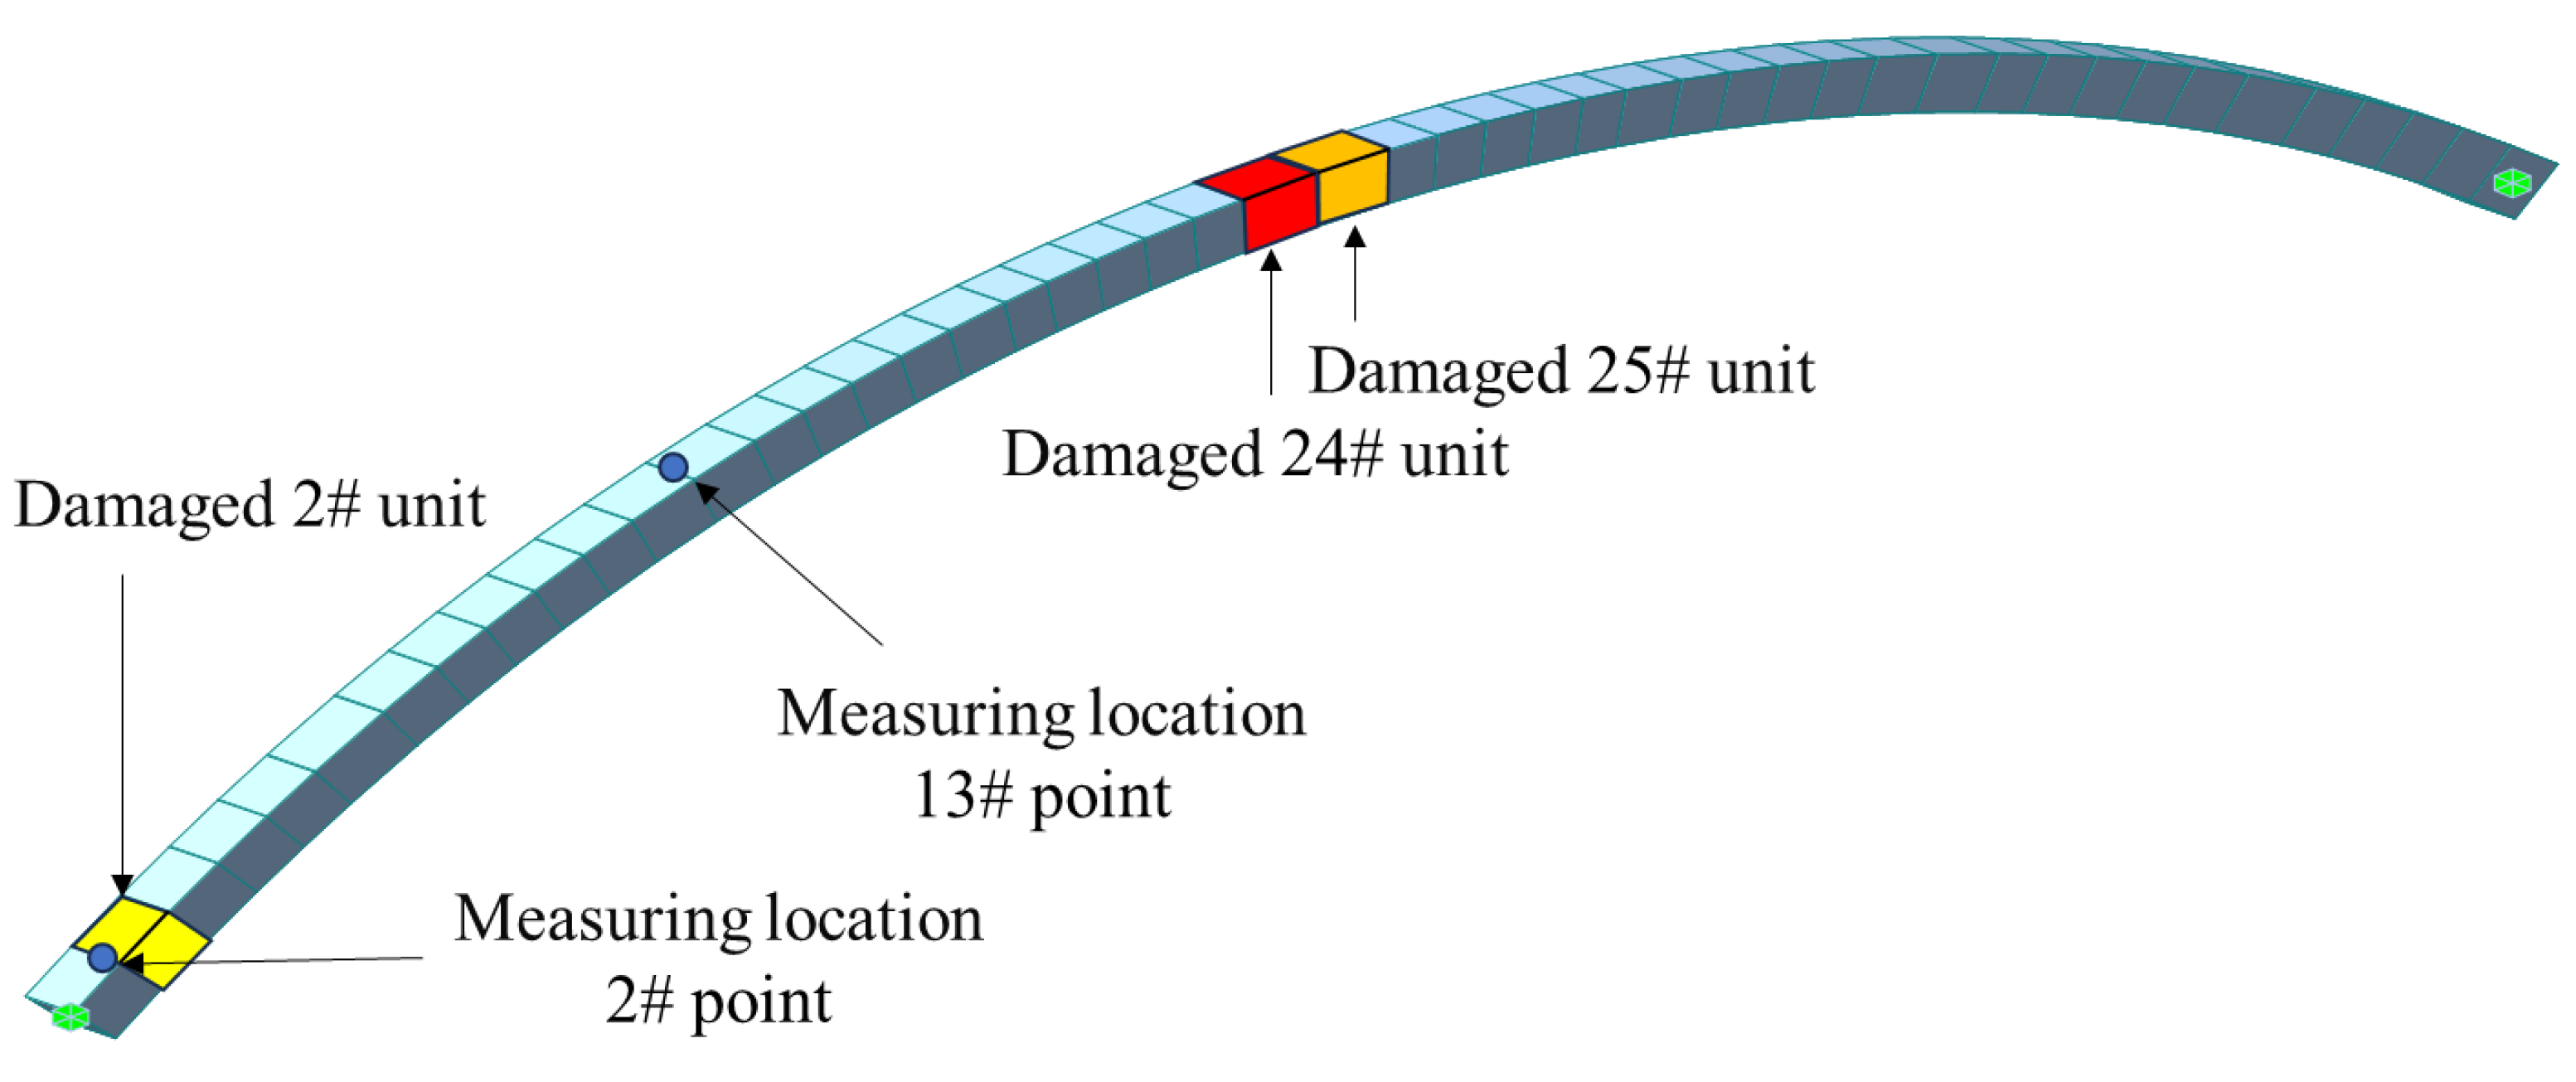
5.2. Arch Rib Structure Example Verification
- (1)
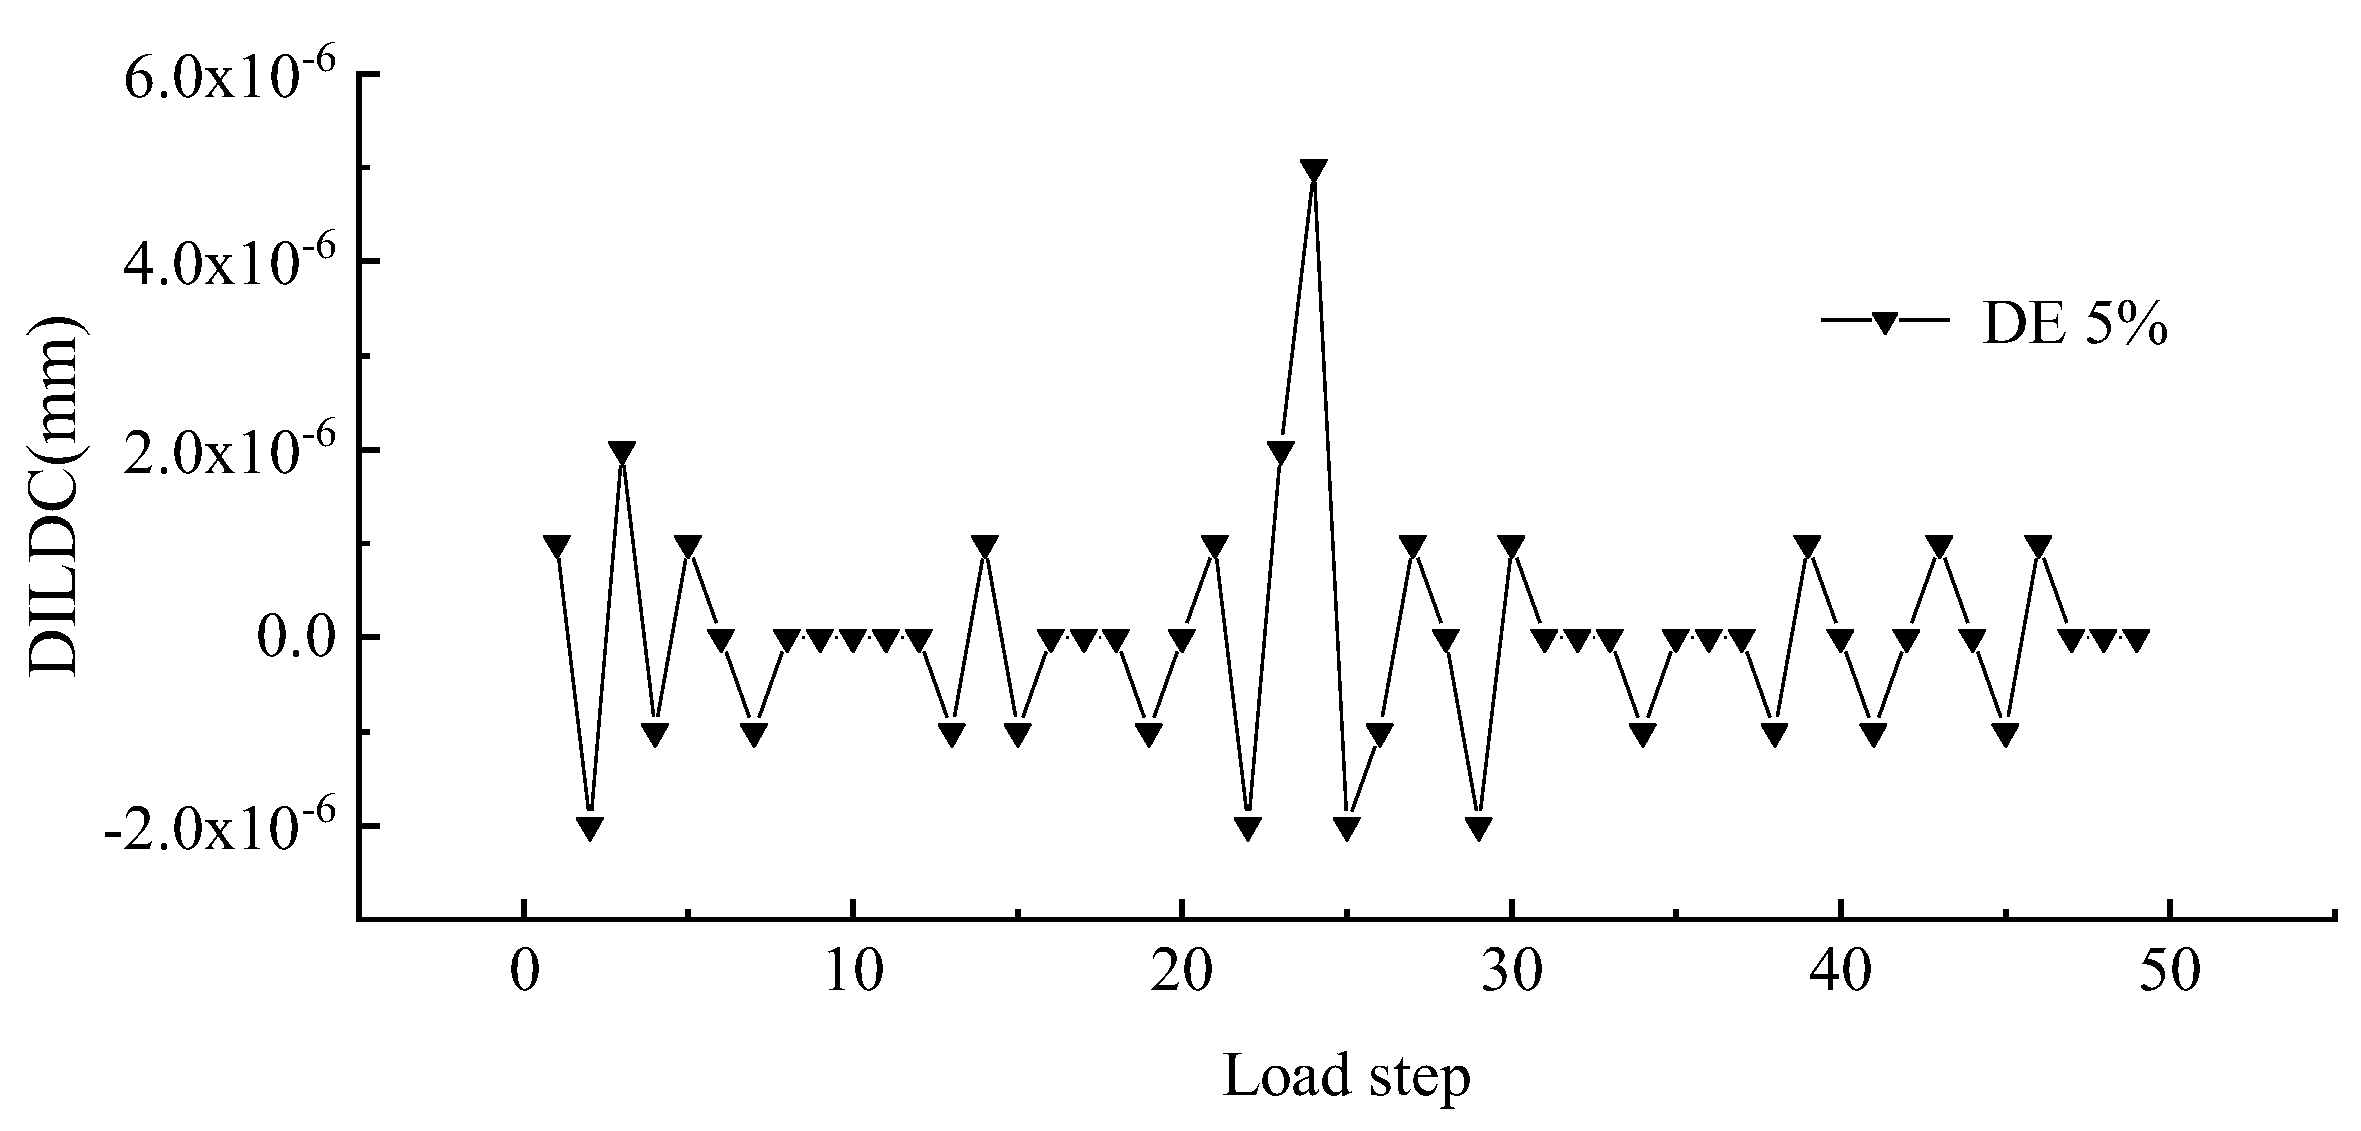
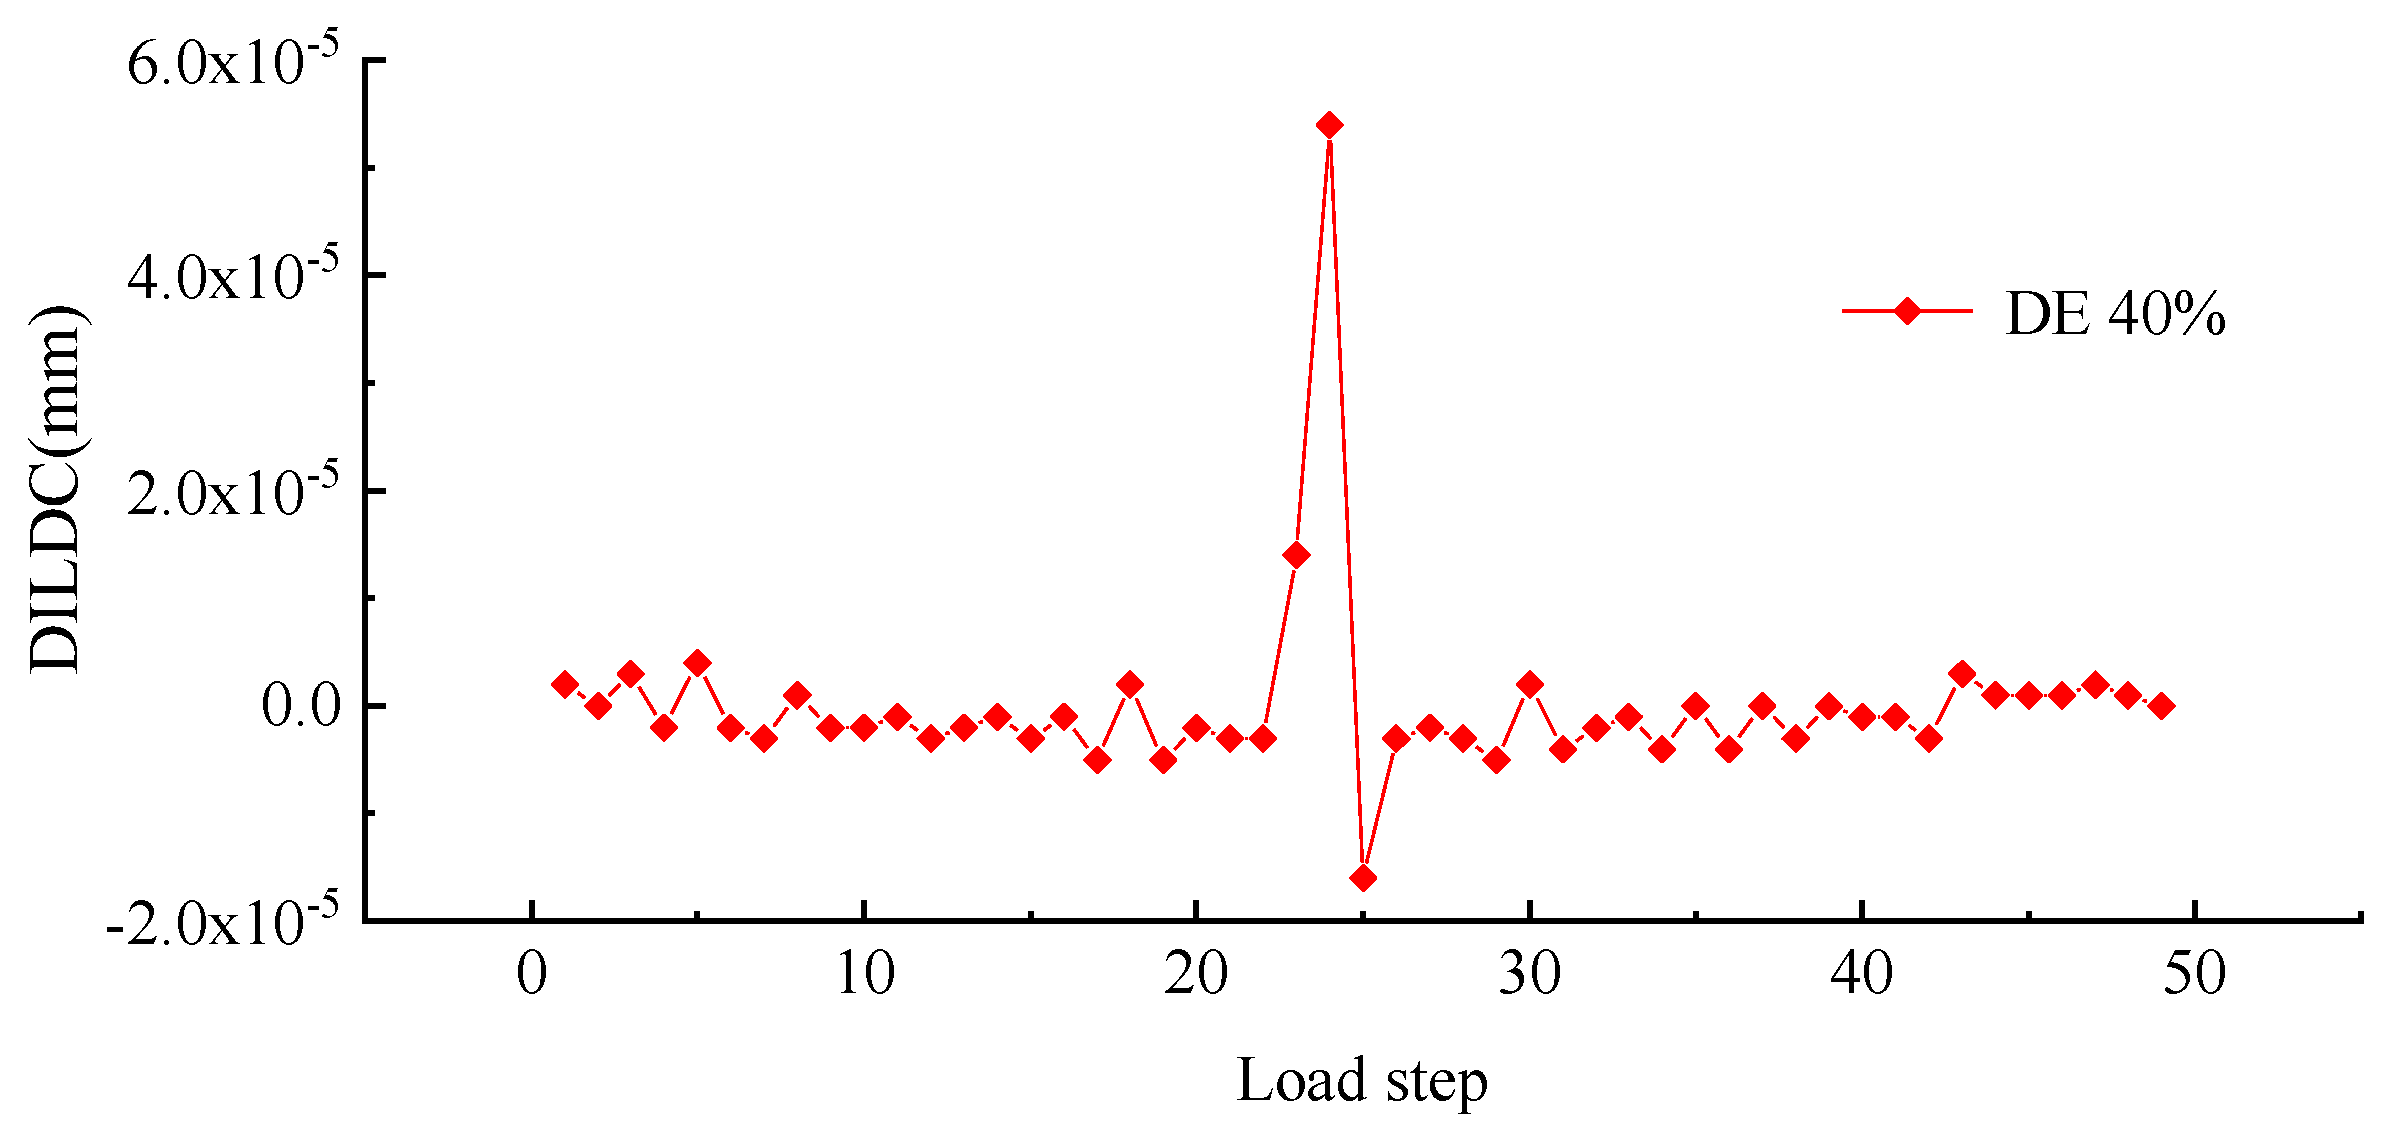
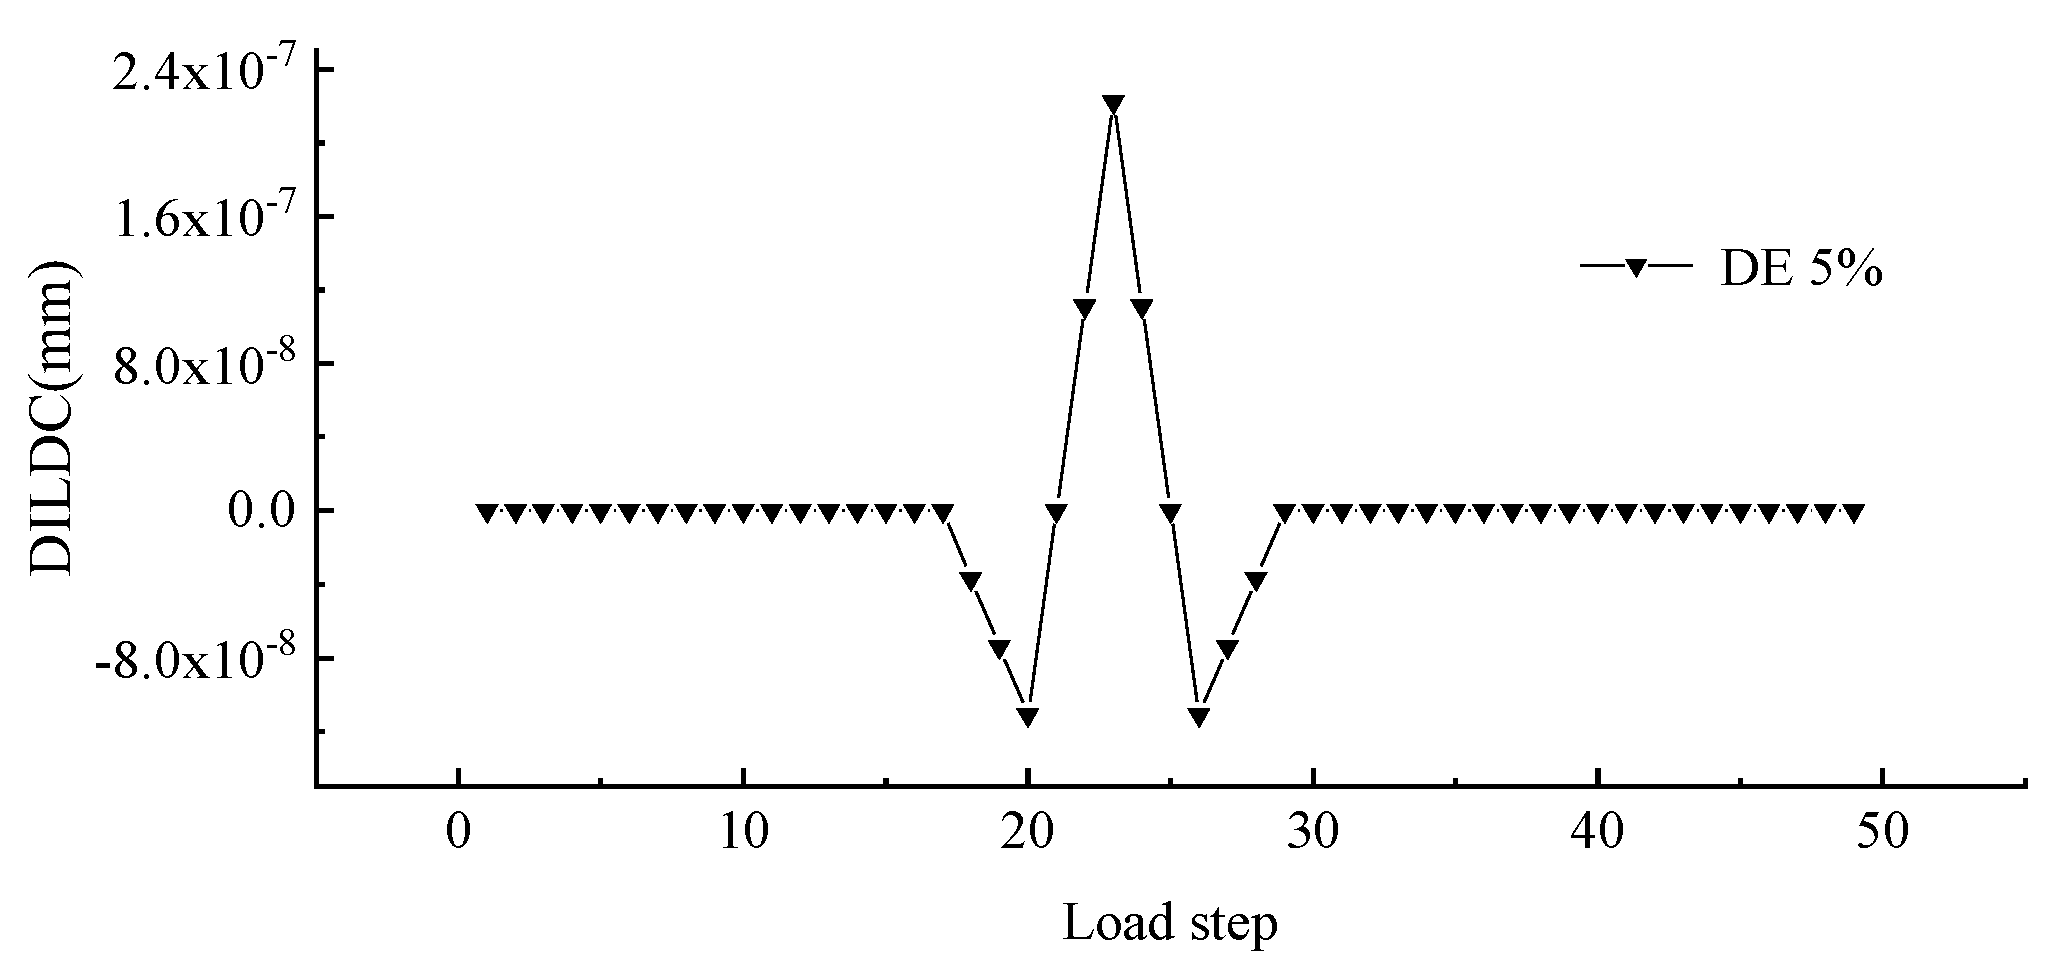
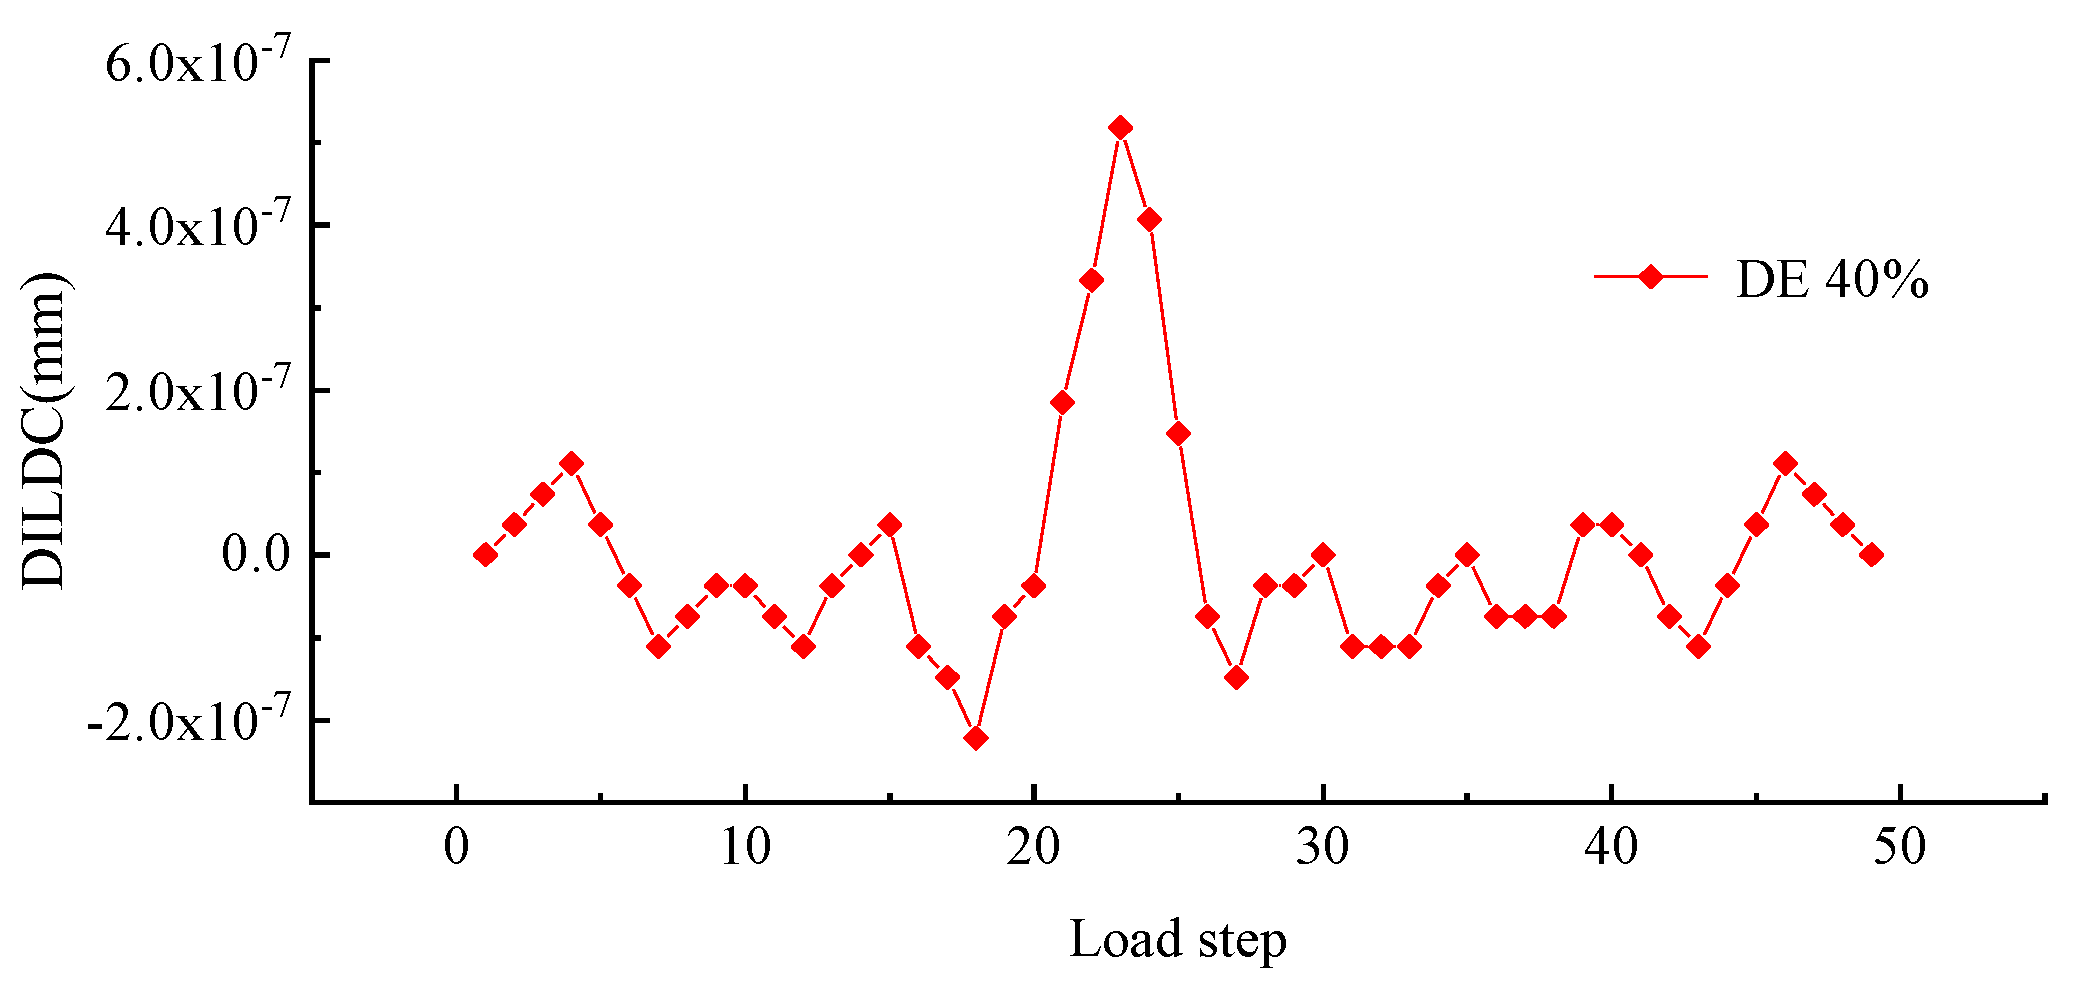
- The DILDC index identification method exhibits a satisfactory identification effect on both the single location damage and multiple location damage of hingeless arch structures, and it can accurately identify the damage location.
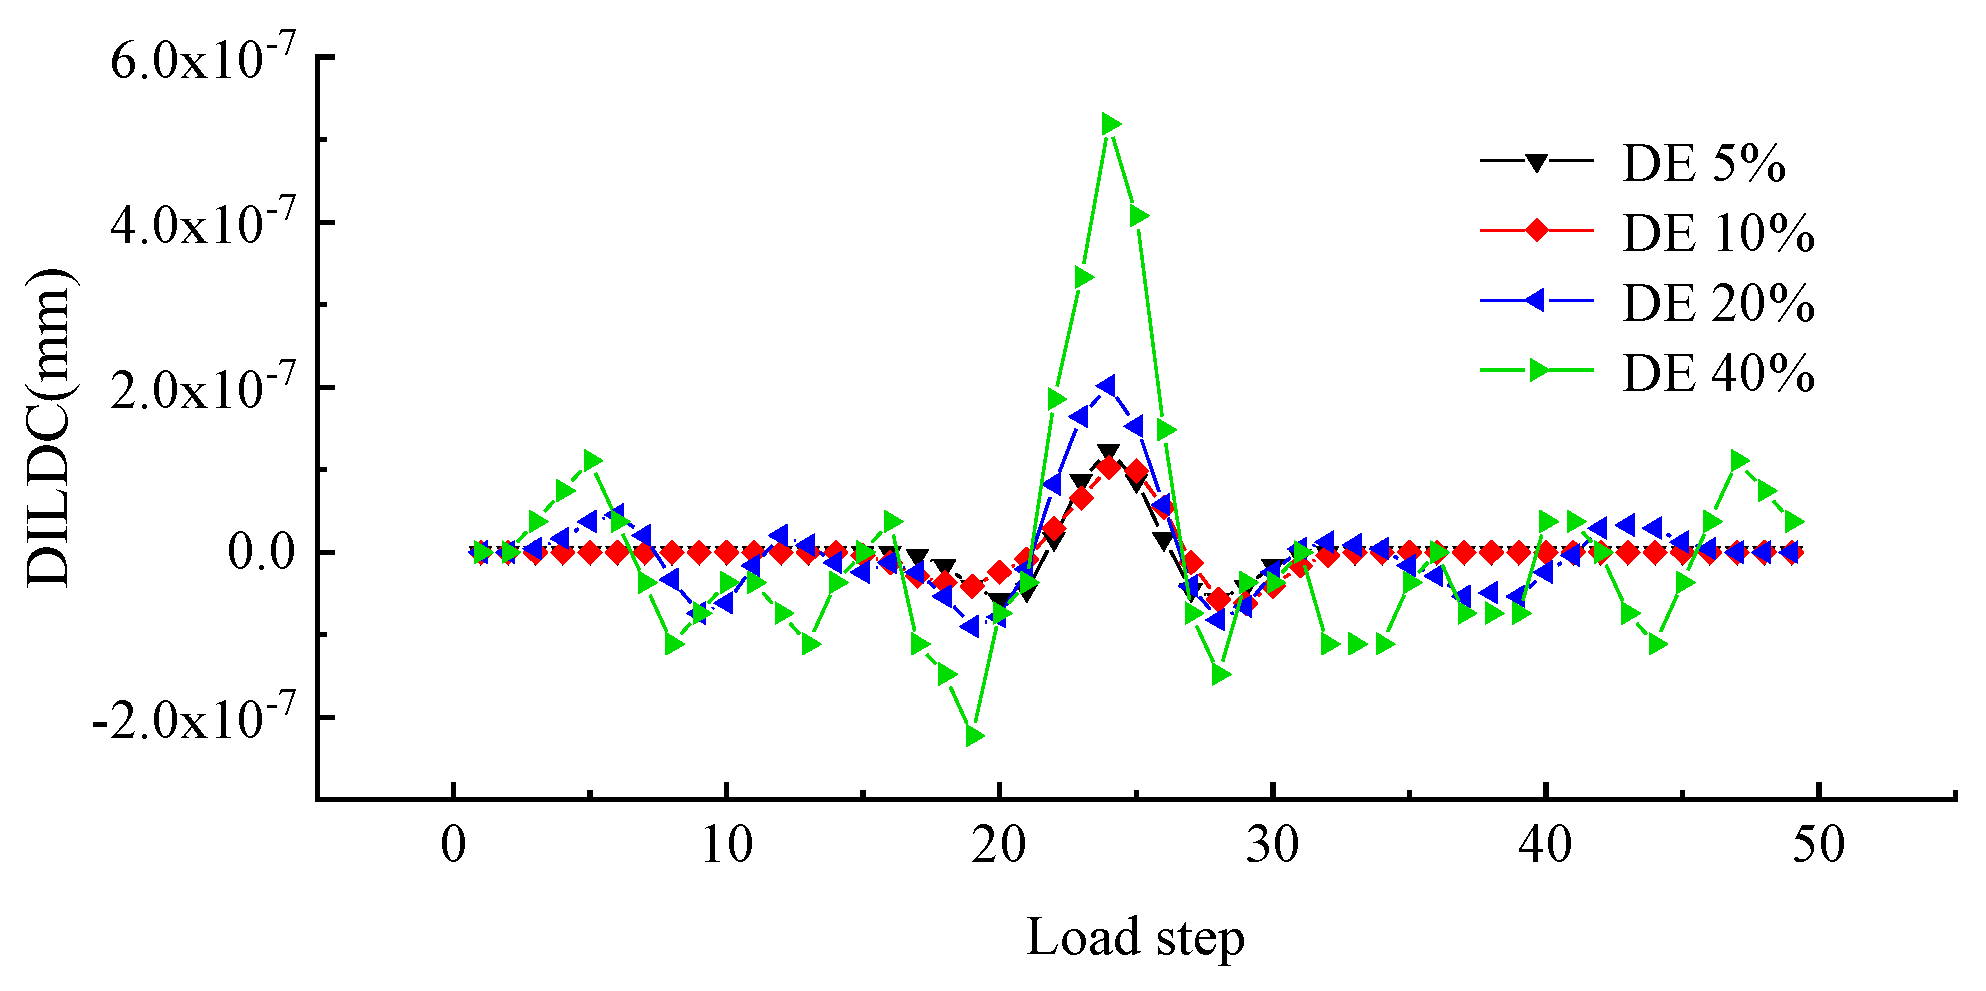
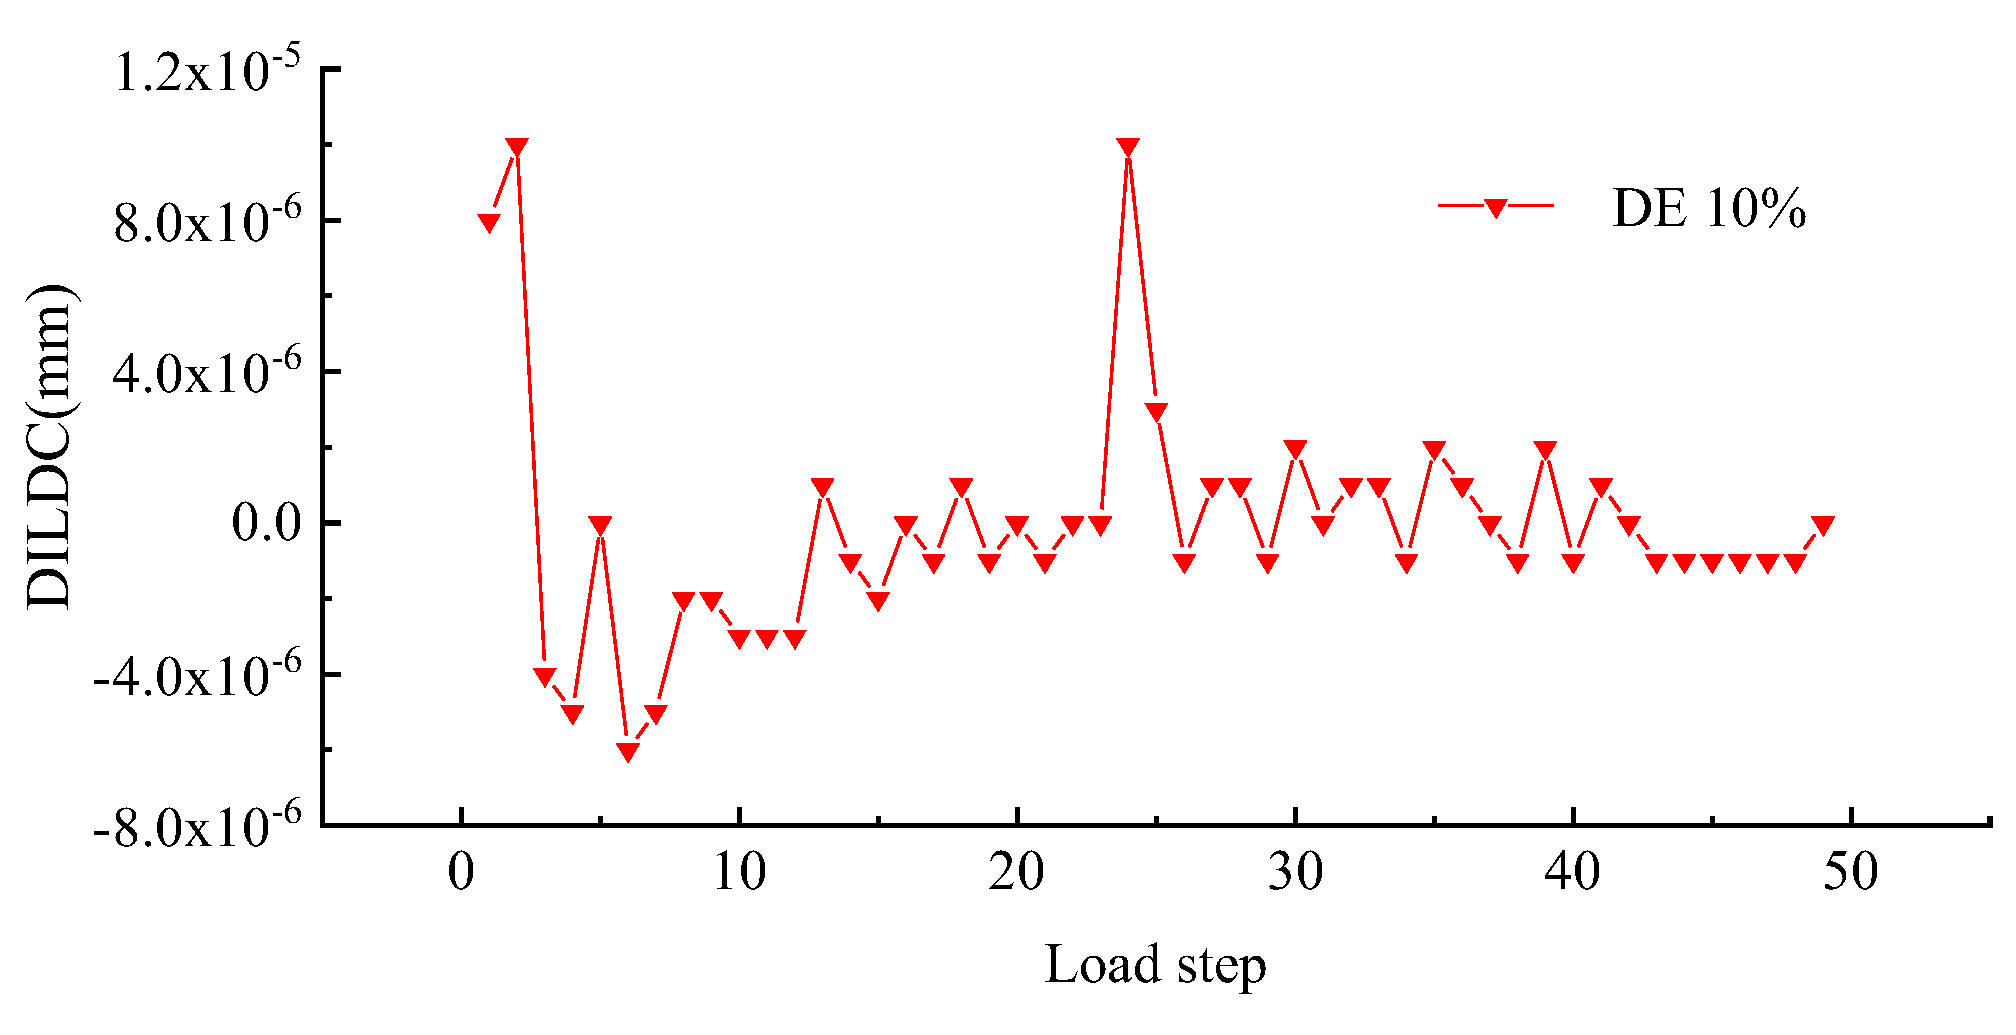
- (2)
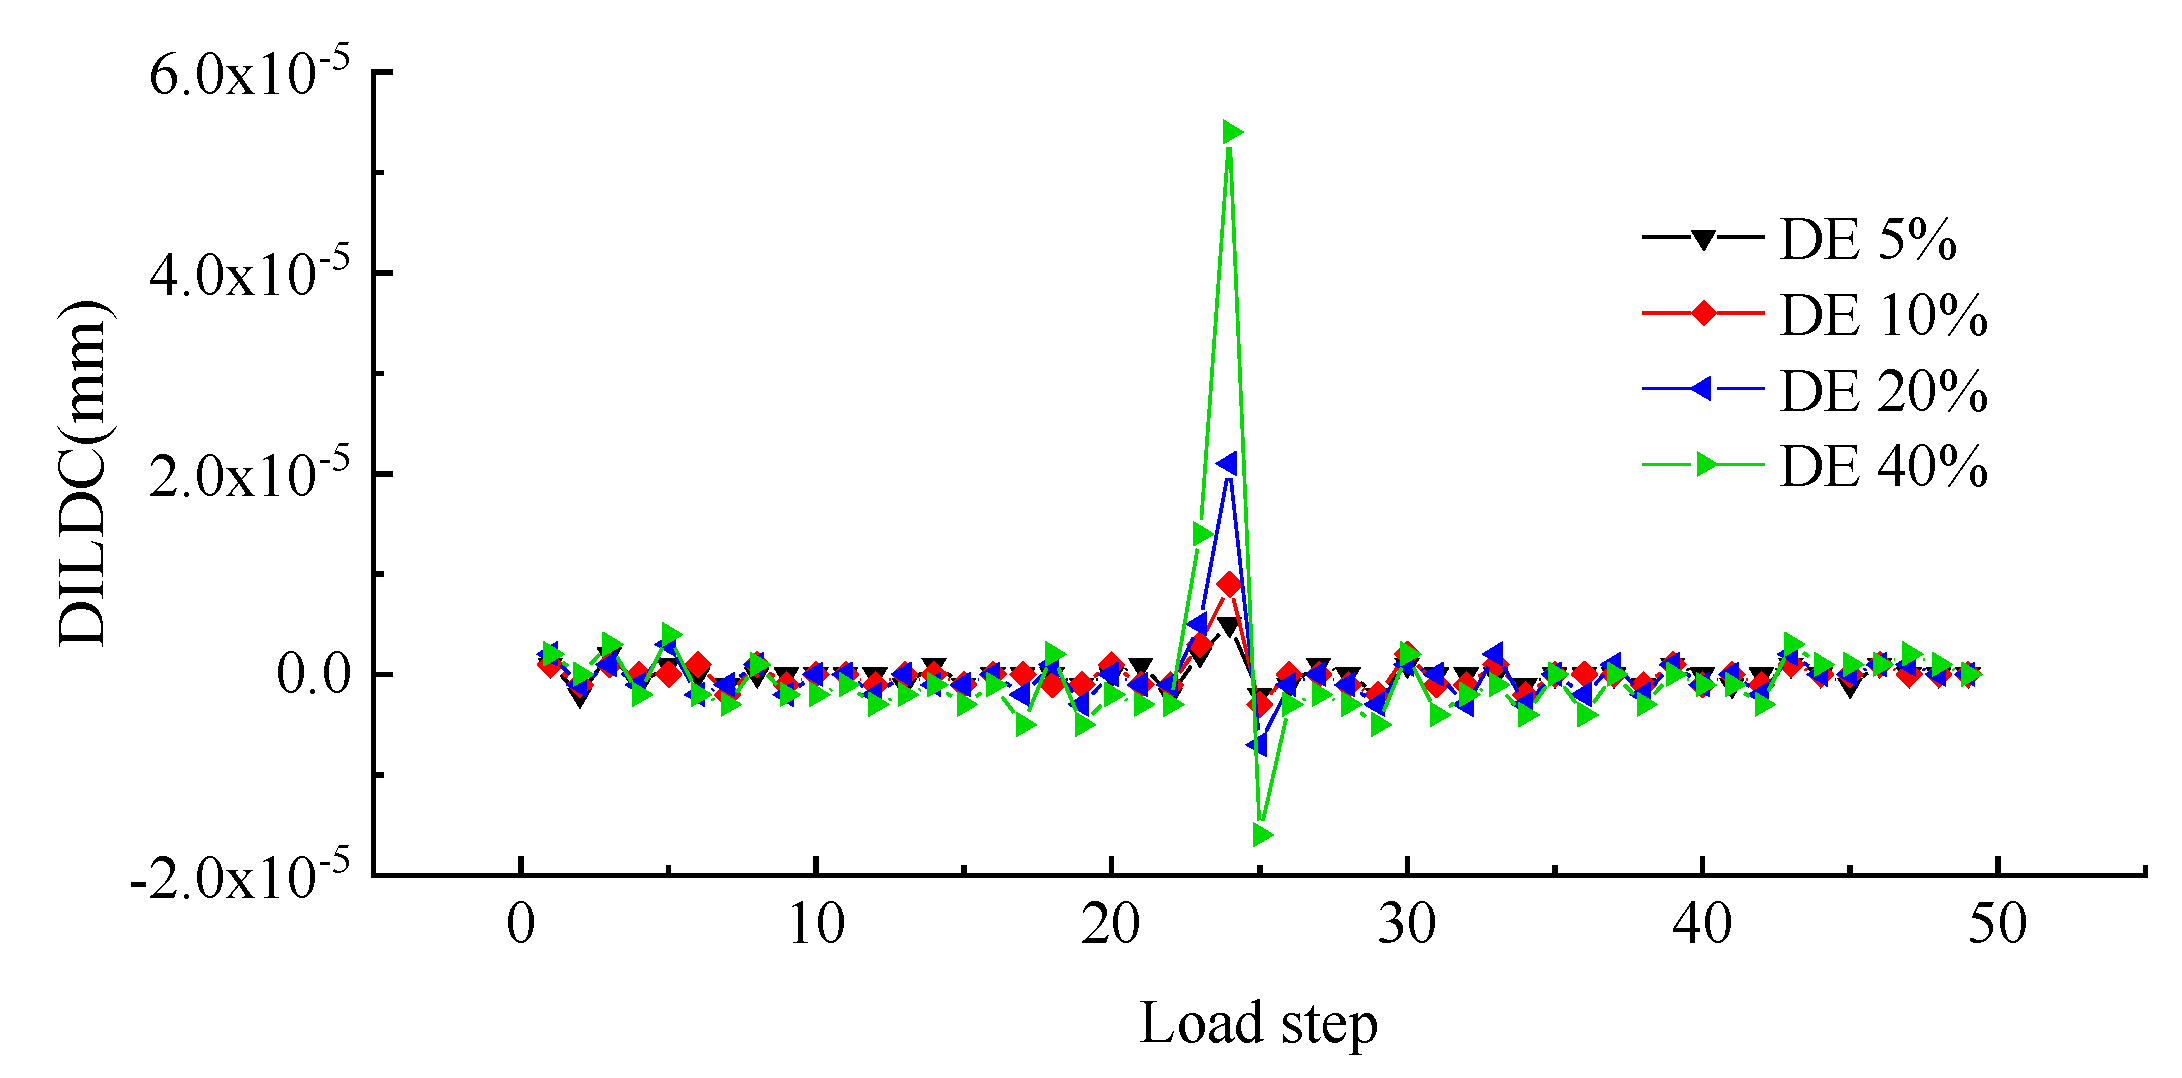
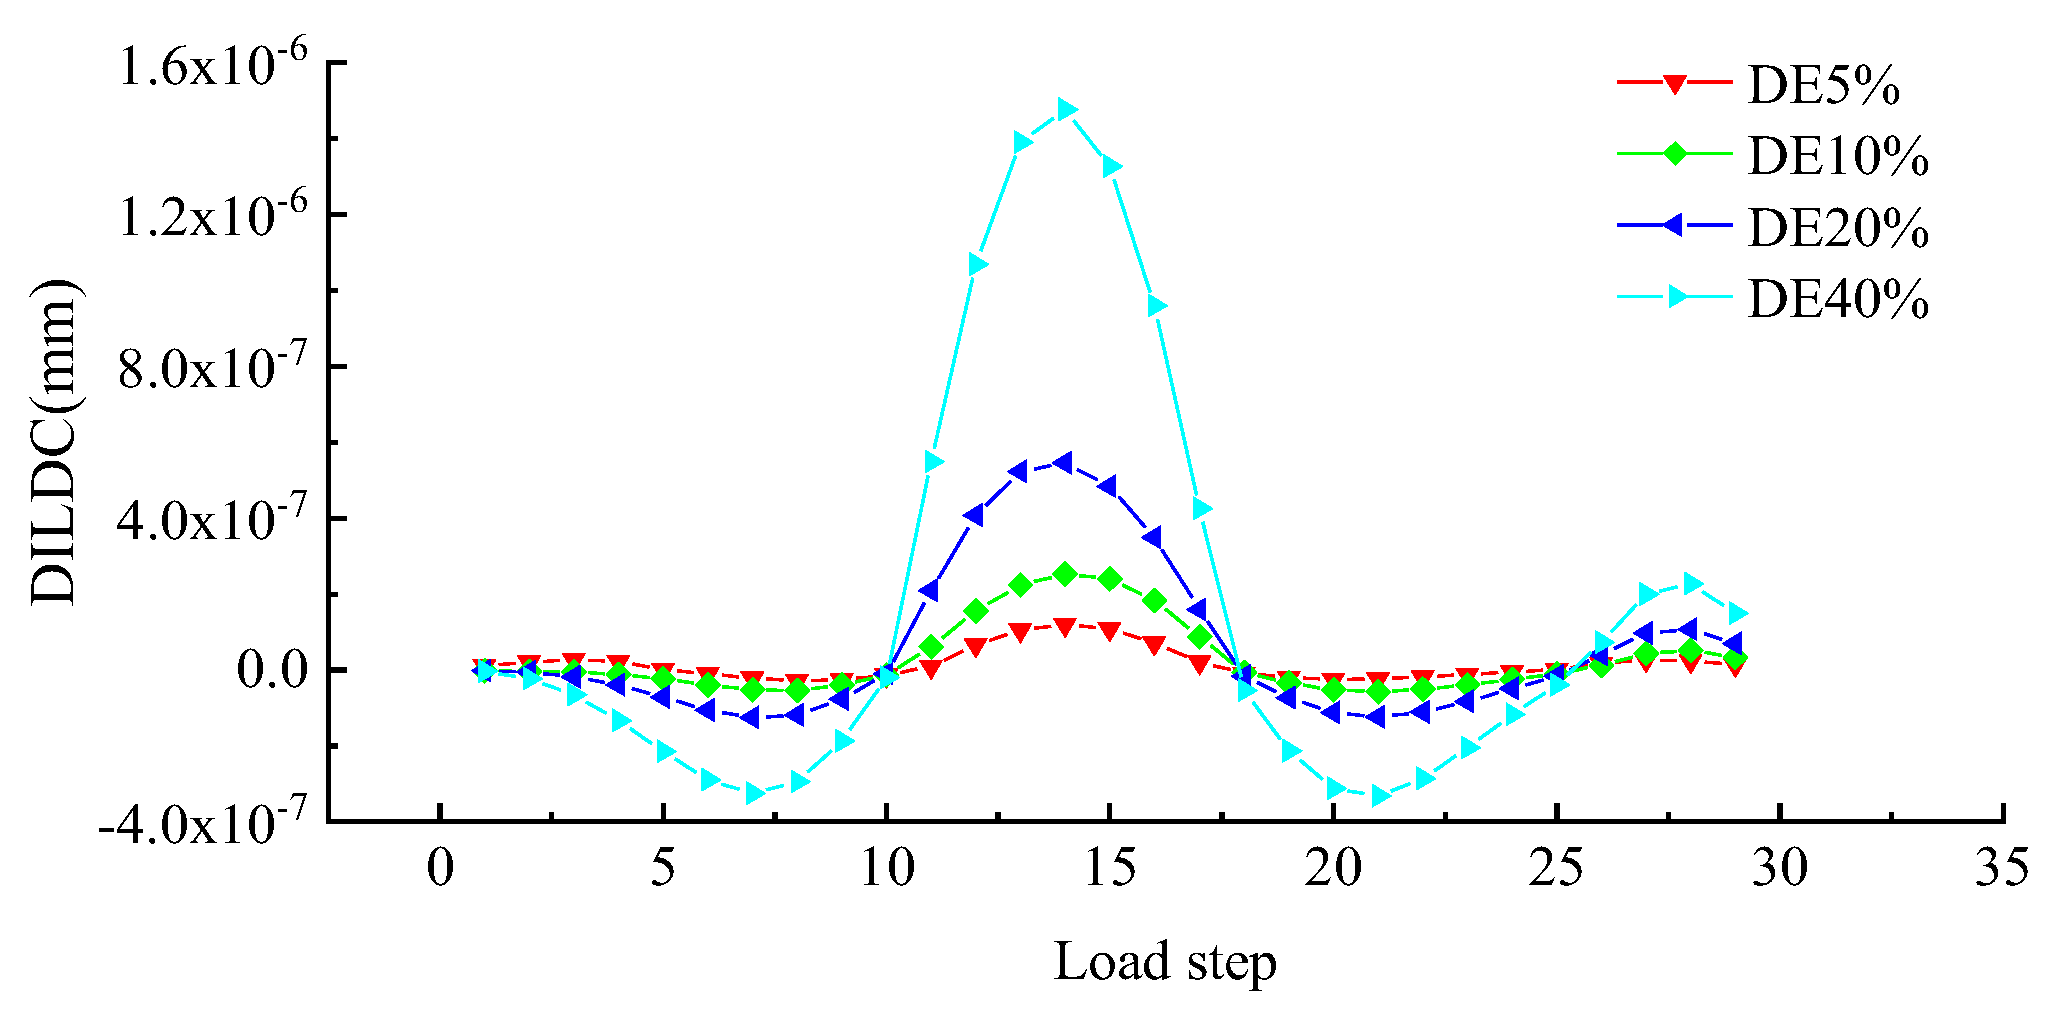
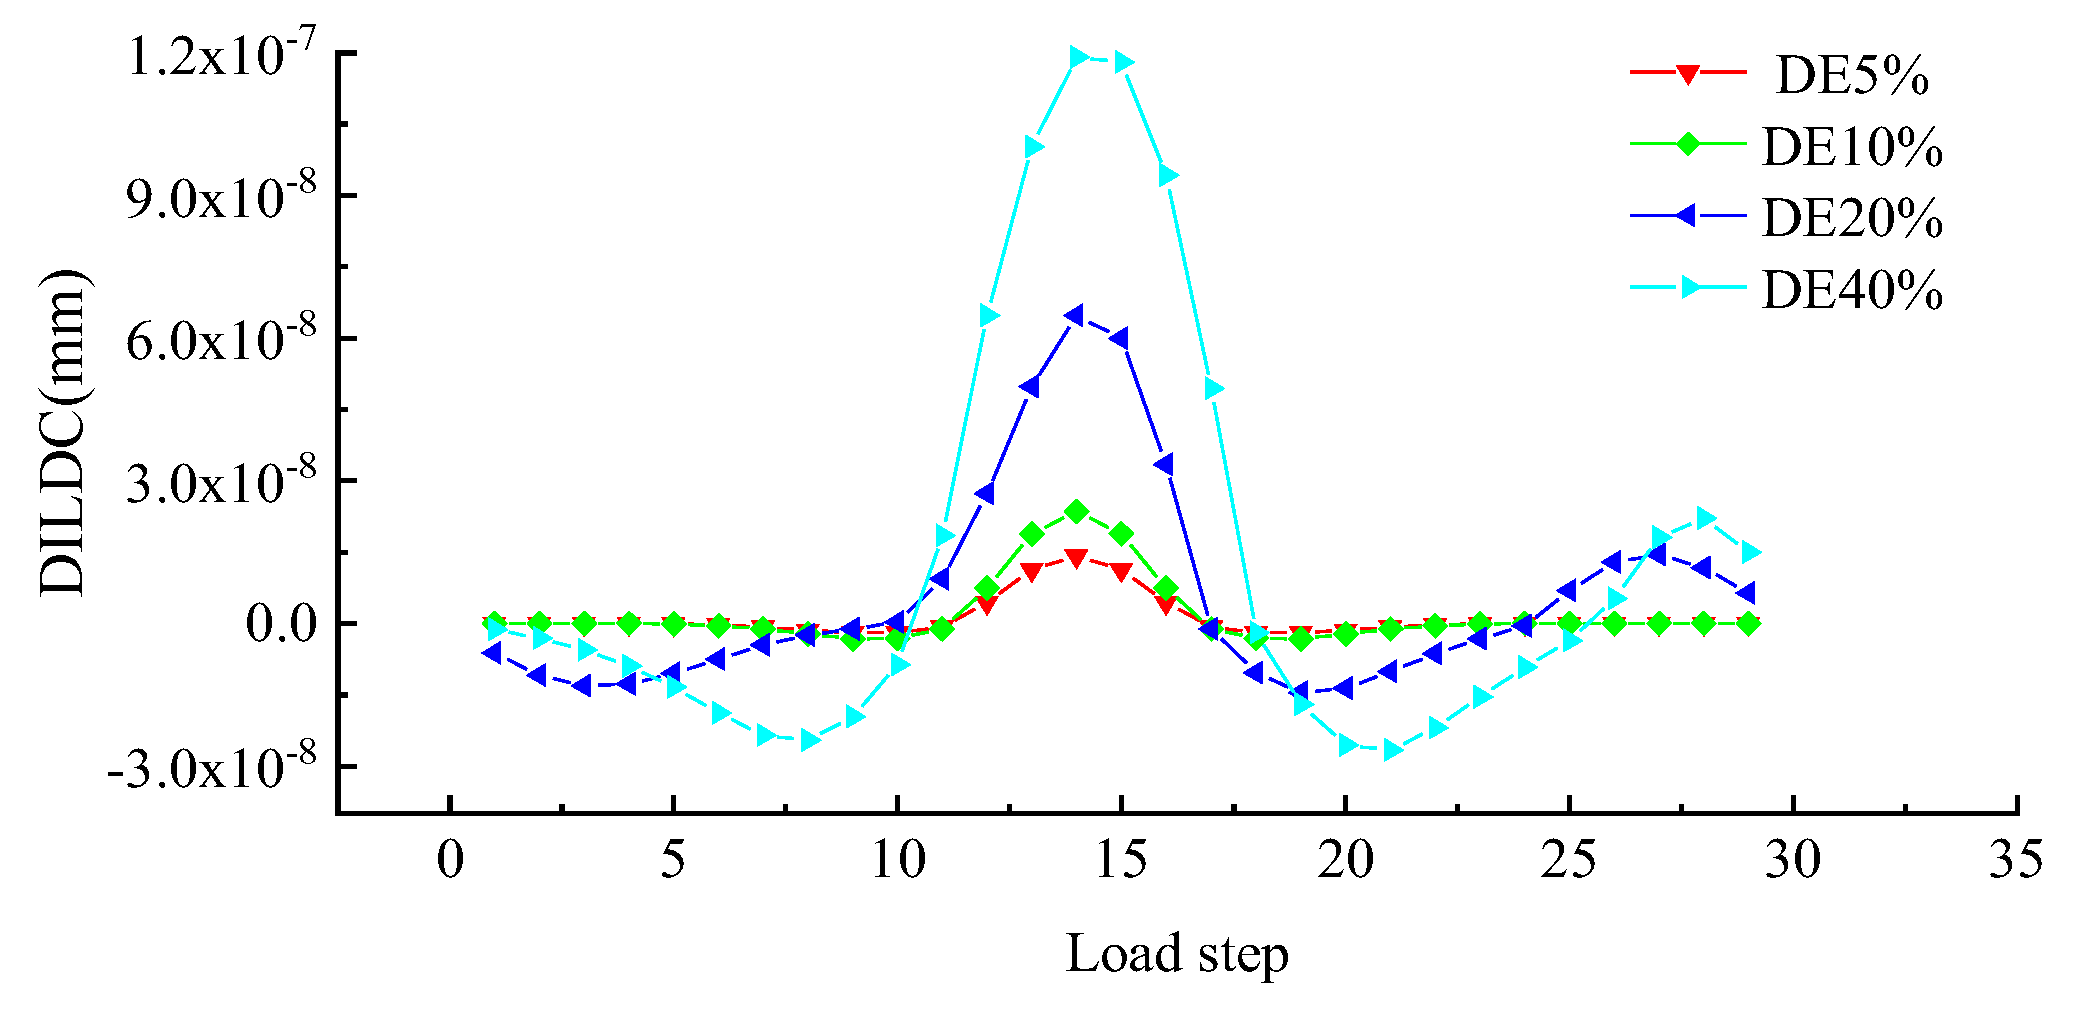
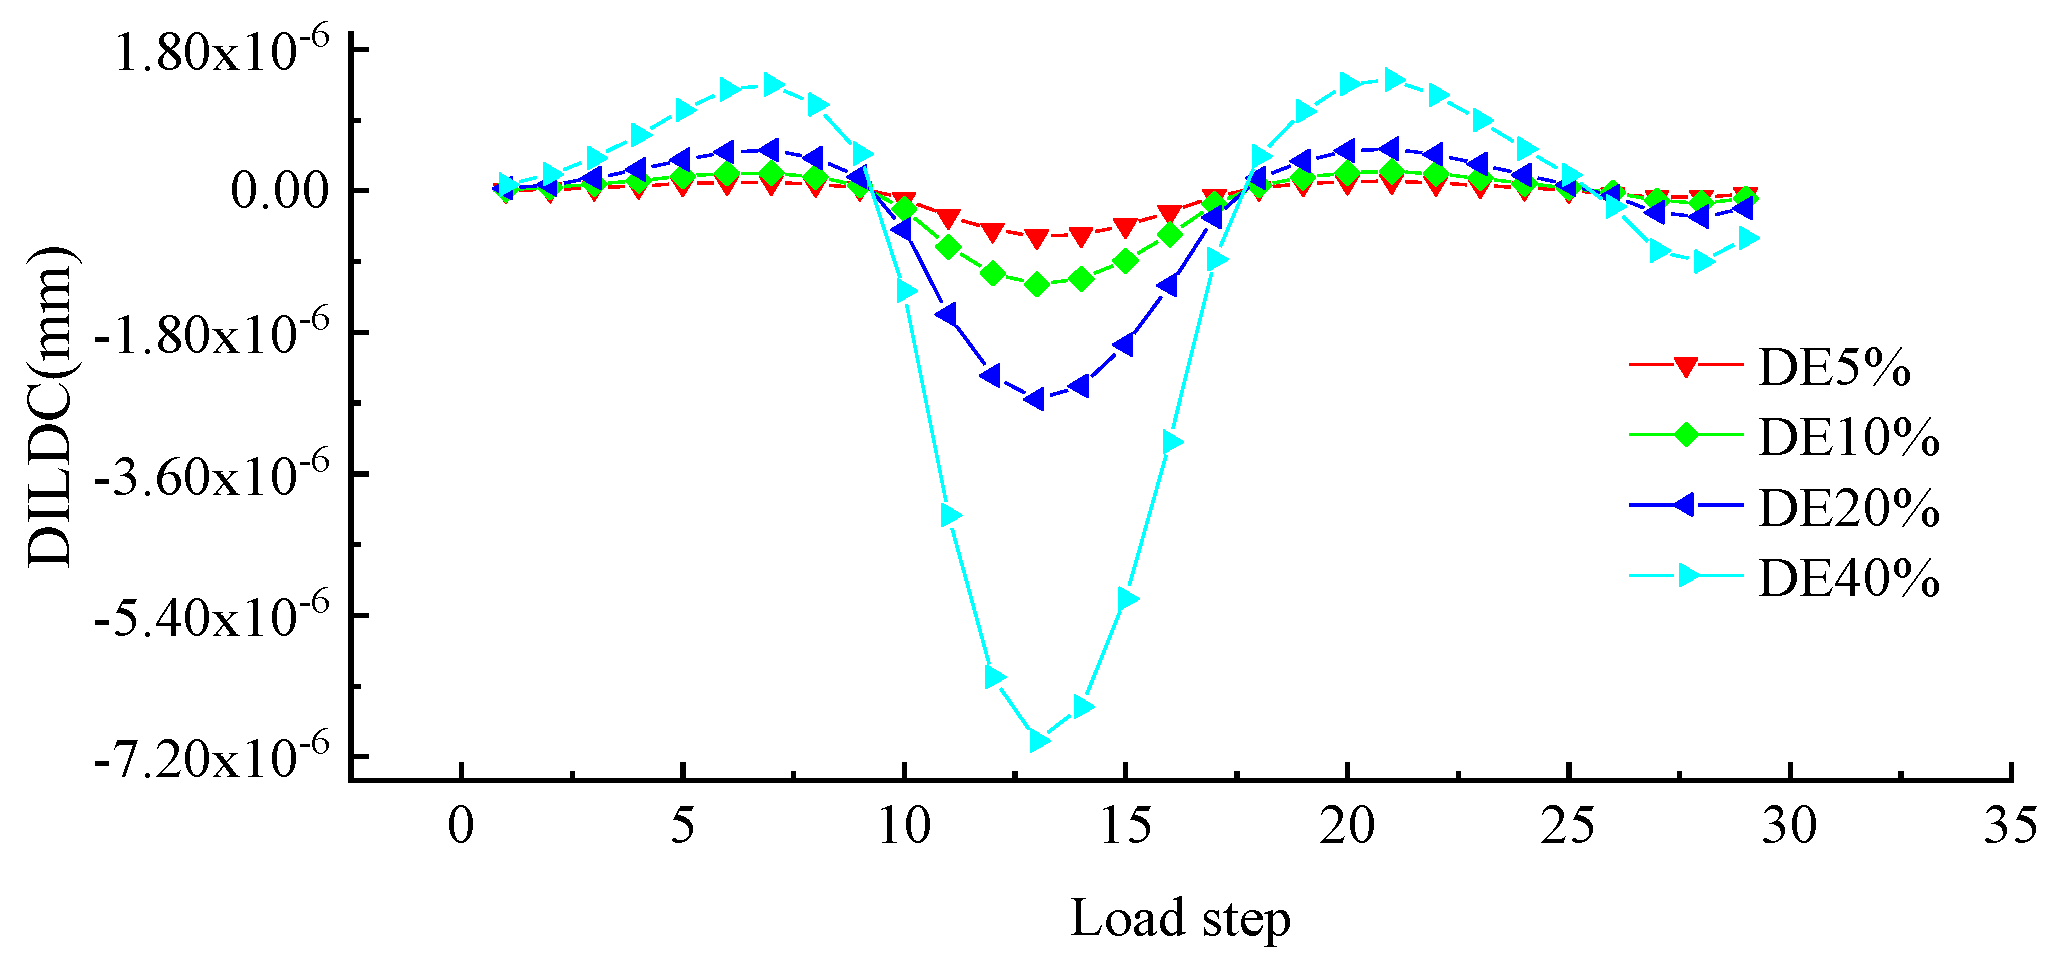
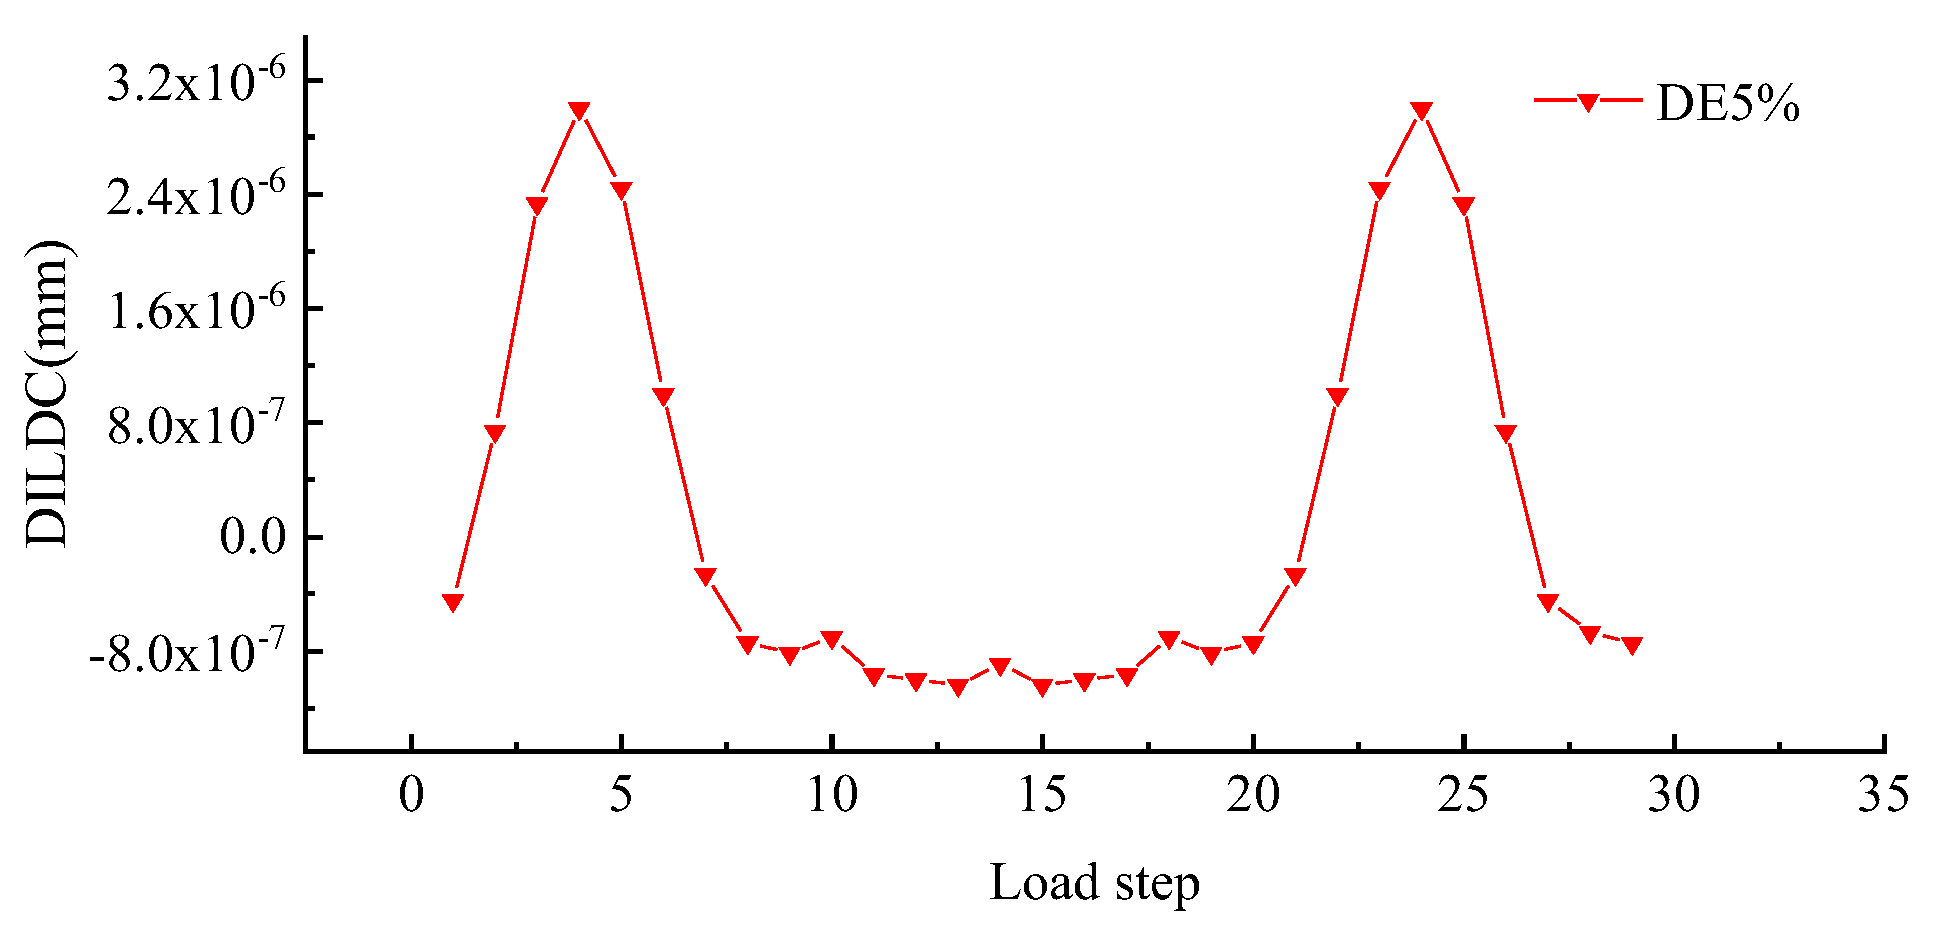
- According to conditions 1 and 2, the amplitude height of the curve is proportional to the damage extent at the same measuring location. Compared with Work conditions 1 and 2, the amplitude height of the quarter-span DILDC index curve at the measuring location is greater than that at the arch foot, and the damage identification effect of the measuring location at the quarter-span is better than that at the arch foot. Therefore, the closer the measuring location is to the damage location, the better the identification effect will be. It is worth noting that the damage identification effect of DILDC on unit damage at 40% is better than that of unit damage at 5% under the condition of one-quarter measuring location, and the situation is the opposite when the measuring location is located at the arch foot.
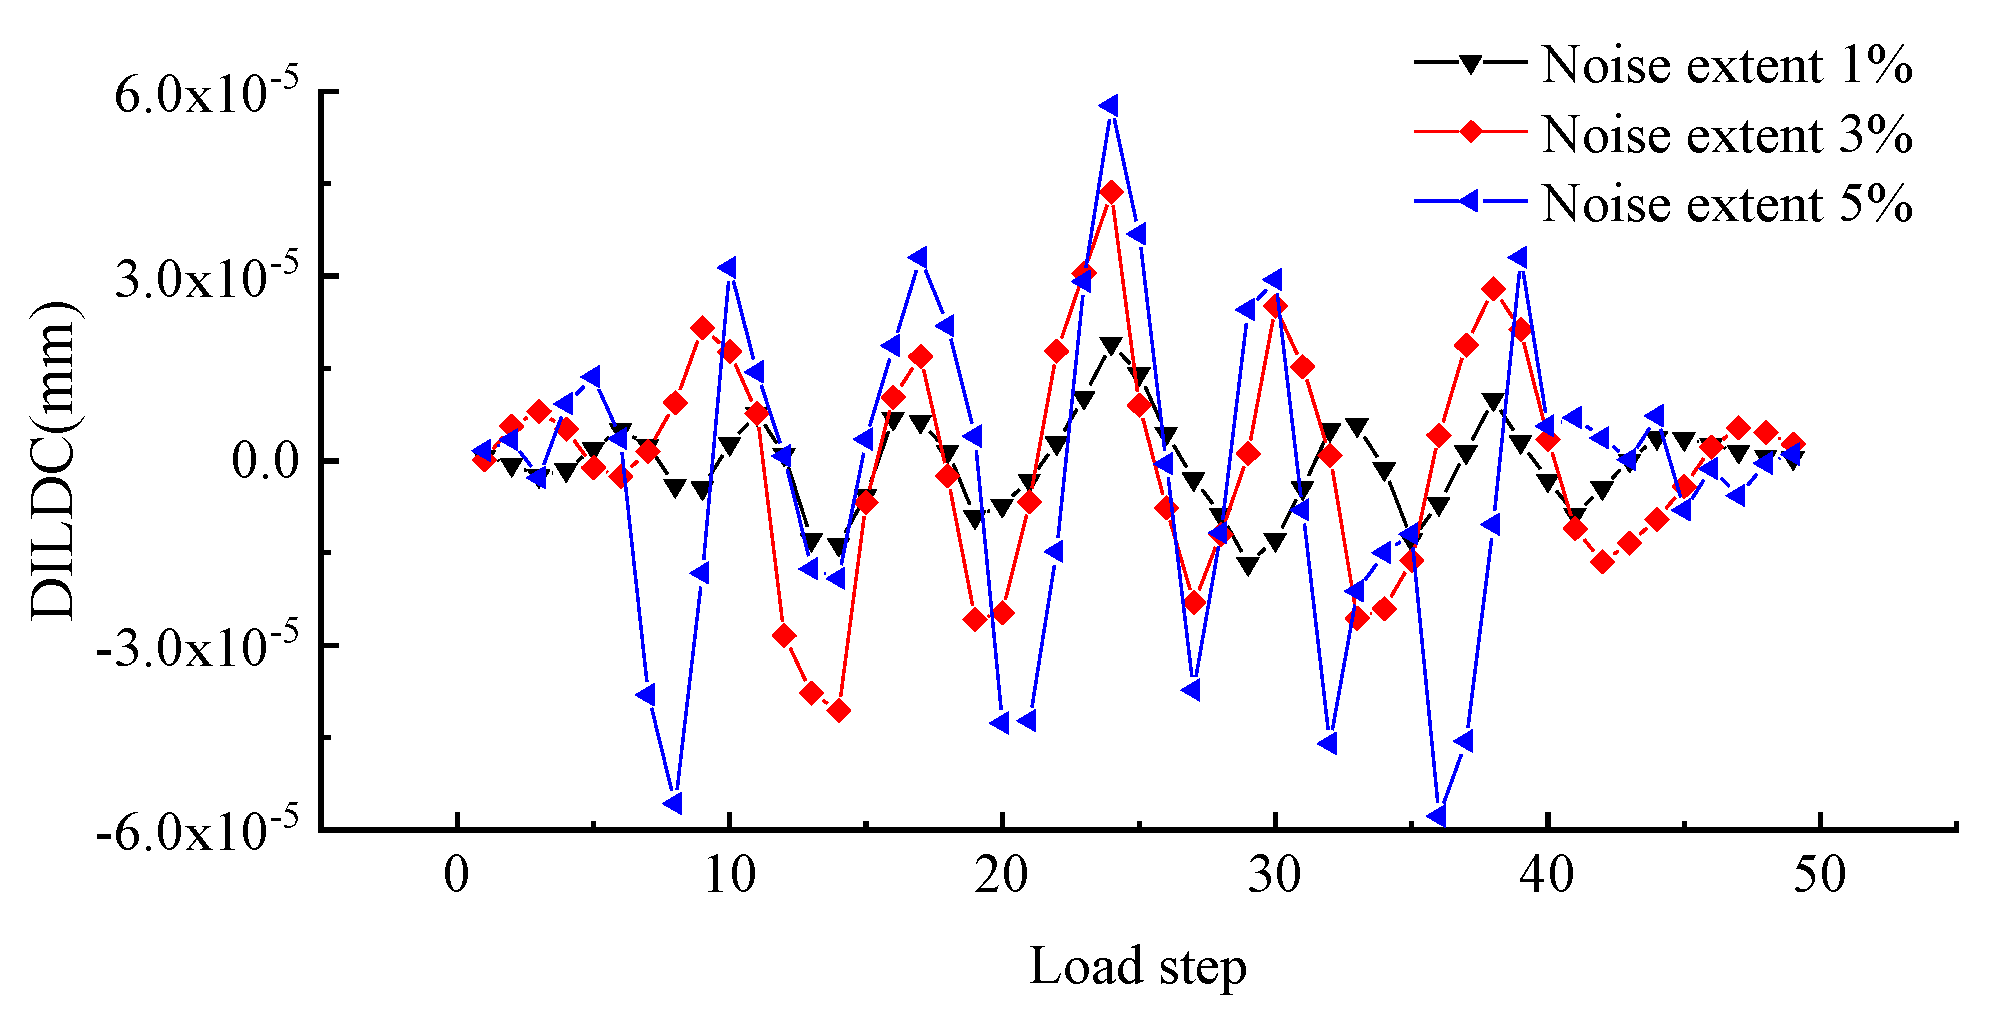
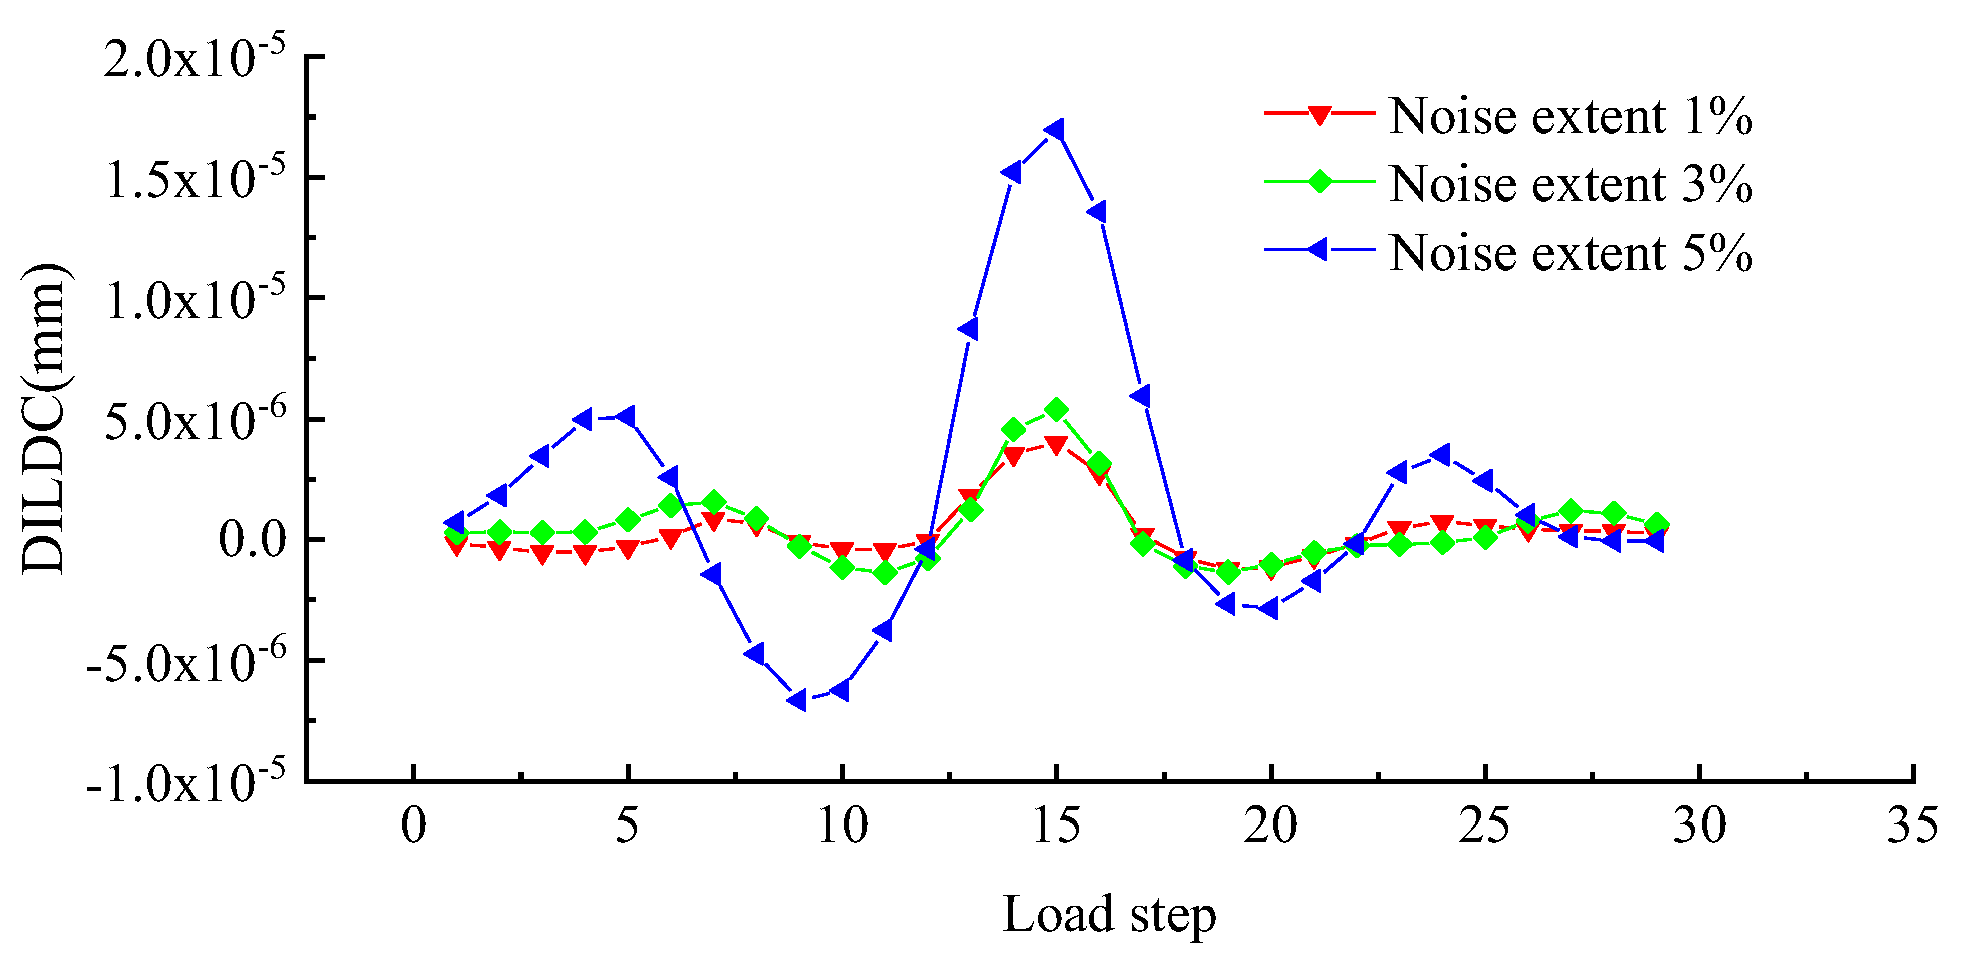
- (3)
- Figure 16 indicates that when the damage extent is 40% and the noise extents are 1%, 3% and 5%, the damage location can still be effectively identified, and the noise immunity of DILDC is good.
5.3. Example Verification of Deck Box-Type Arch Bridge
6. Practical Process of Damage Identification for Hingeless Arch Bridges
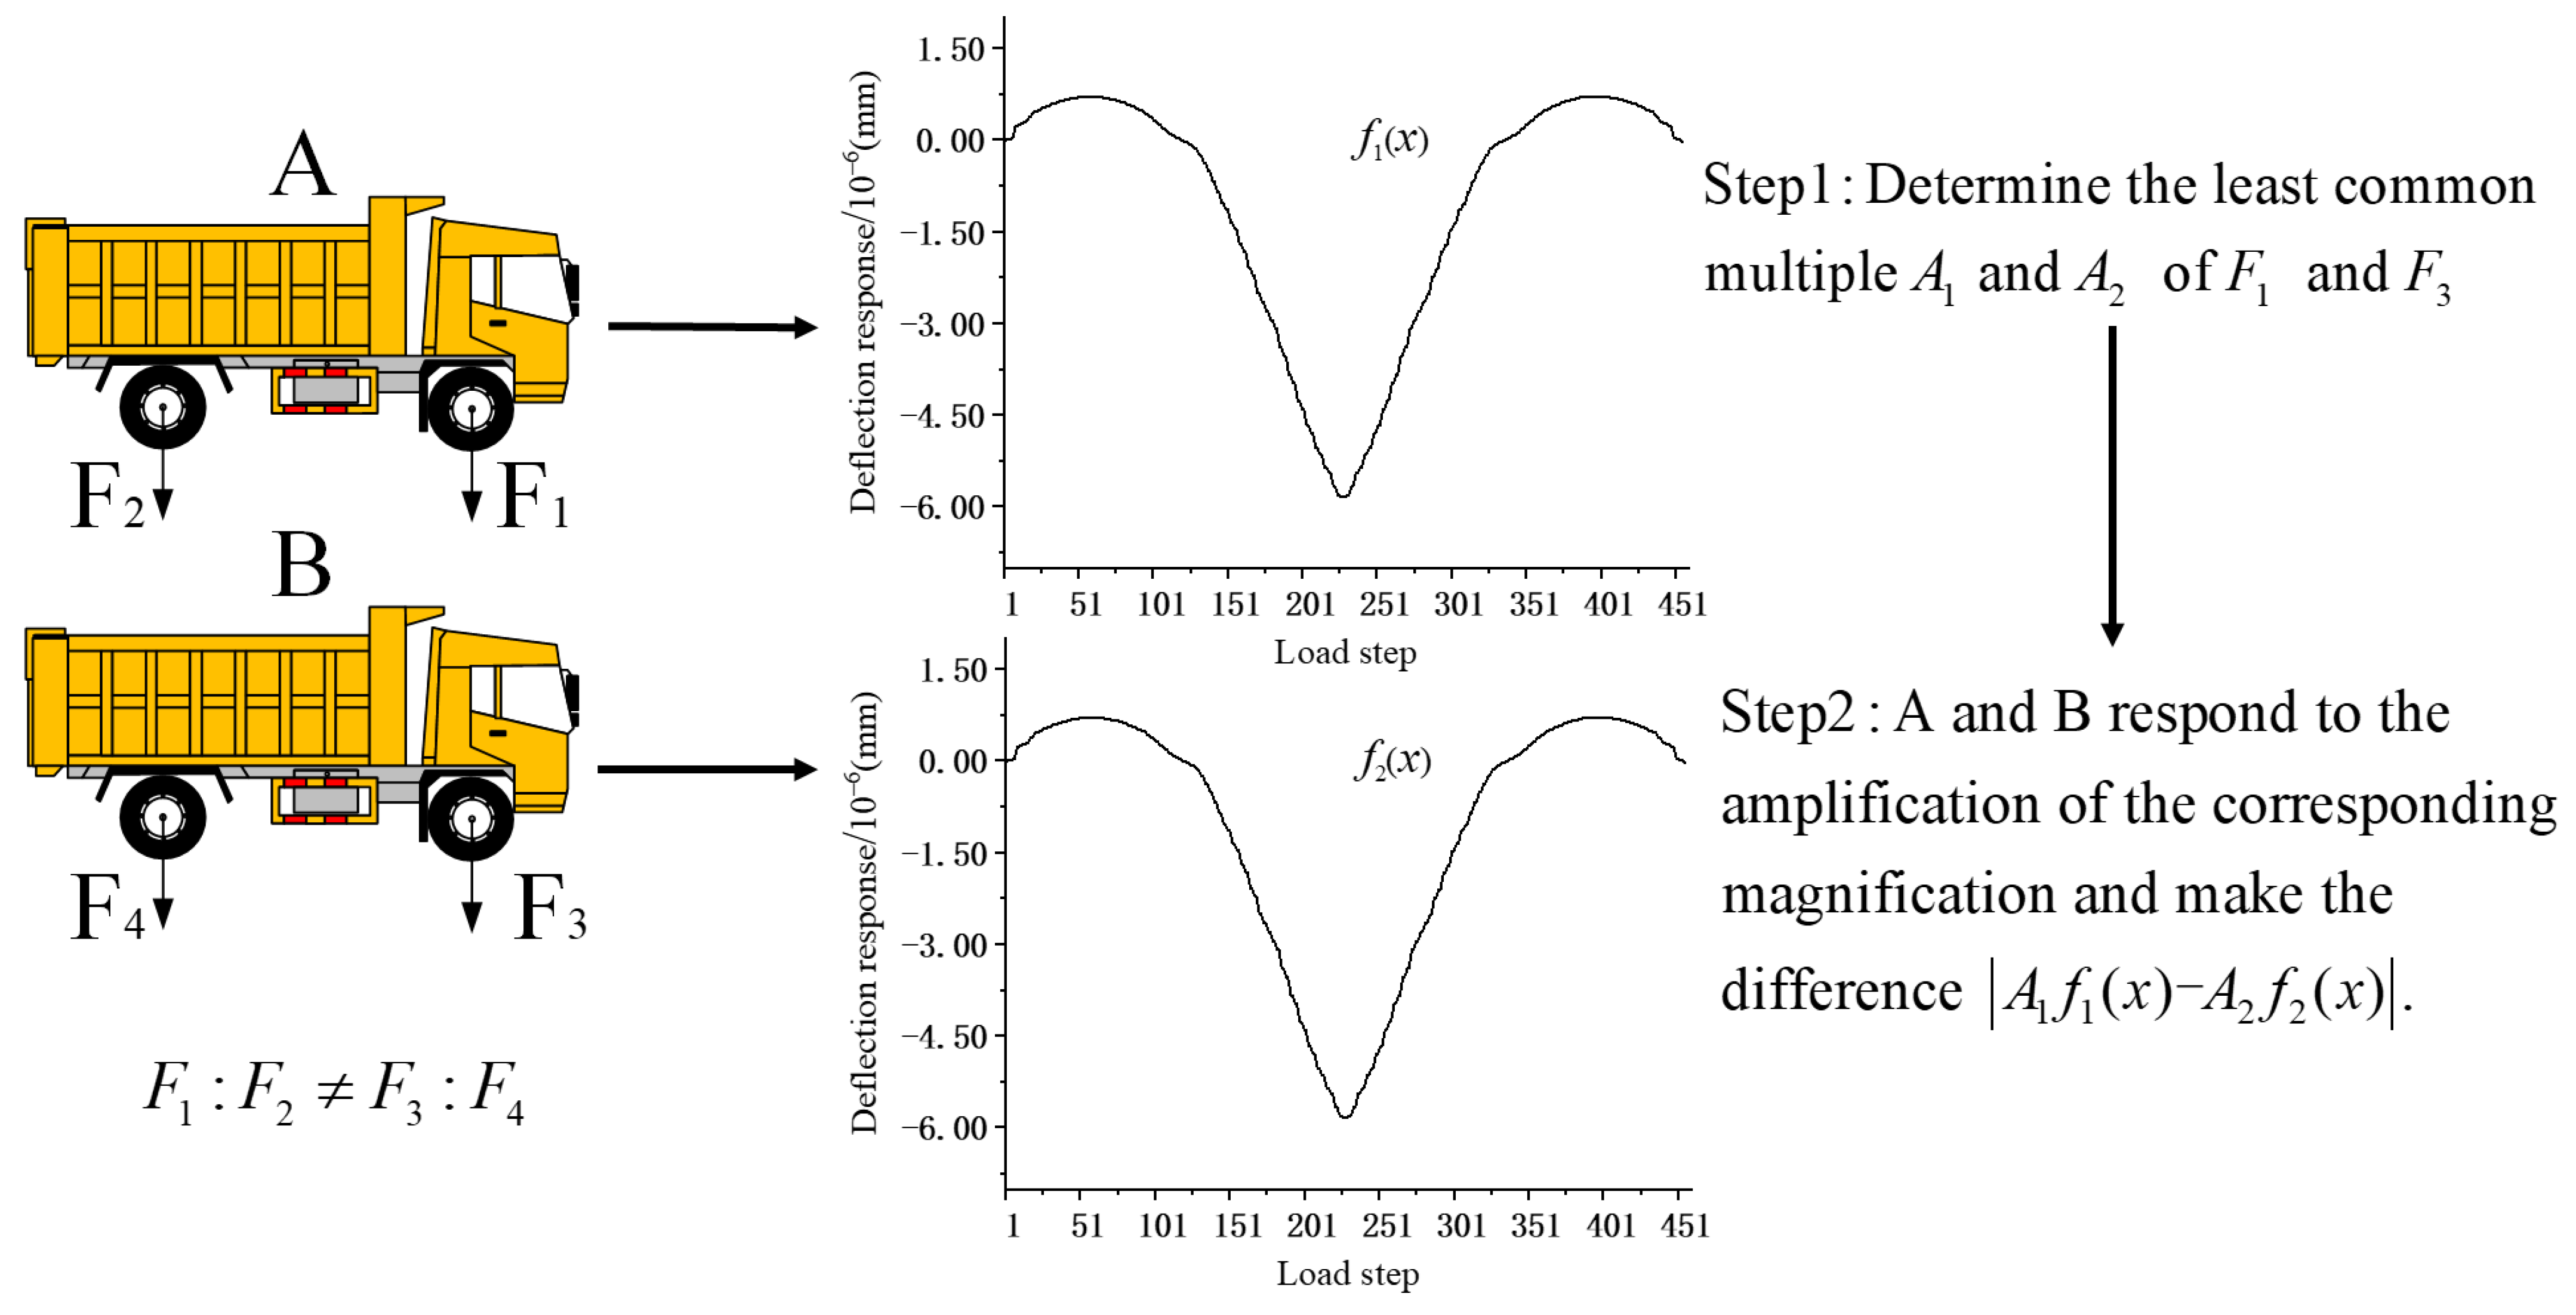
- (1)
- Select two two-axle loading vehicles with the same wheelbase and different front-to-rear axle load ratios. The front, back and axle of each vehicle can be simplified to the same relative position, while the value of the concentration force is different. It should be noted that the actual loading efficiency should consider both the effective stimulation of the structure and the potential damage condition of the bridge. Due to the limitation of the length of this study, we will not conduct in-depth research here.
- (2)
- Two vehicles are used to carry out quasi-static influence line loading on the bridge, respectively, requiring the same virtual loading node of the bridge for two times the influence line loading, which can be achieved by controlling the moving speed of the loading vehicle and extracting and recording the two deflection response data.
- (3)
- Find the lowest common multiple and of the equivalent concentrated force and of the front axles of the two vehicles; then, amplify the difference after the equivalent concentrated force of the rear axles of the two vehicles by the corresponding magnification, and is the equivalent loading concentrated force. The deflection data and measured two times are amplified, and then the deflection response corresponding to the concentrated force loading is obtained, which can be used to diagnose bridge damage.
7. Conclusions
- (1)
- The deflection influence line analytical solution of the hingeless arch in non-damaged condition is derived. It is found that the error of the analytical solution is up to 5.973% when the axial force is considered. The analytical solution can meet engineering precision requirements.
- (2)
- The DILDC solution before and after structural damage was derived, and the feasibility of damage identification of a hingeless arch structure by deflection influence line differential curvature was proved theoretically. It is verified by FE analysis software.
- (3)
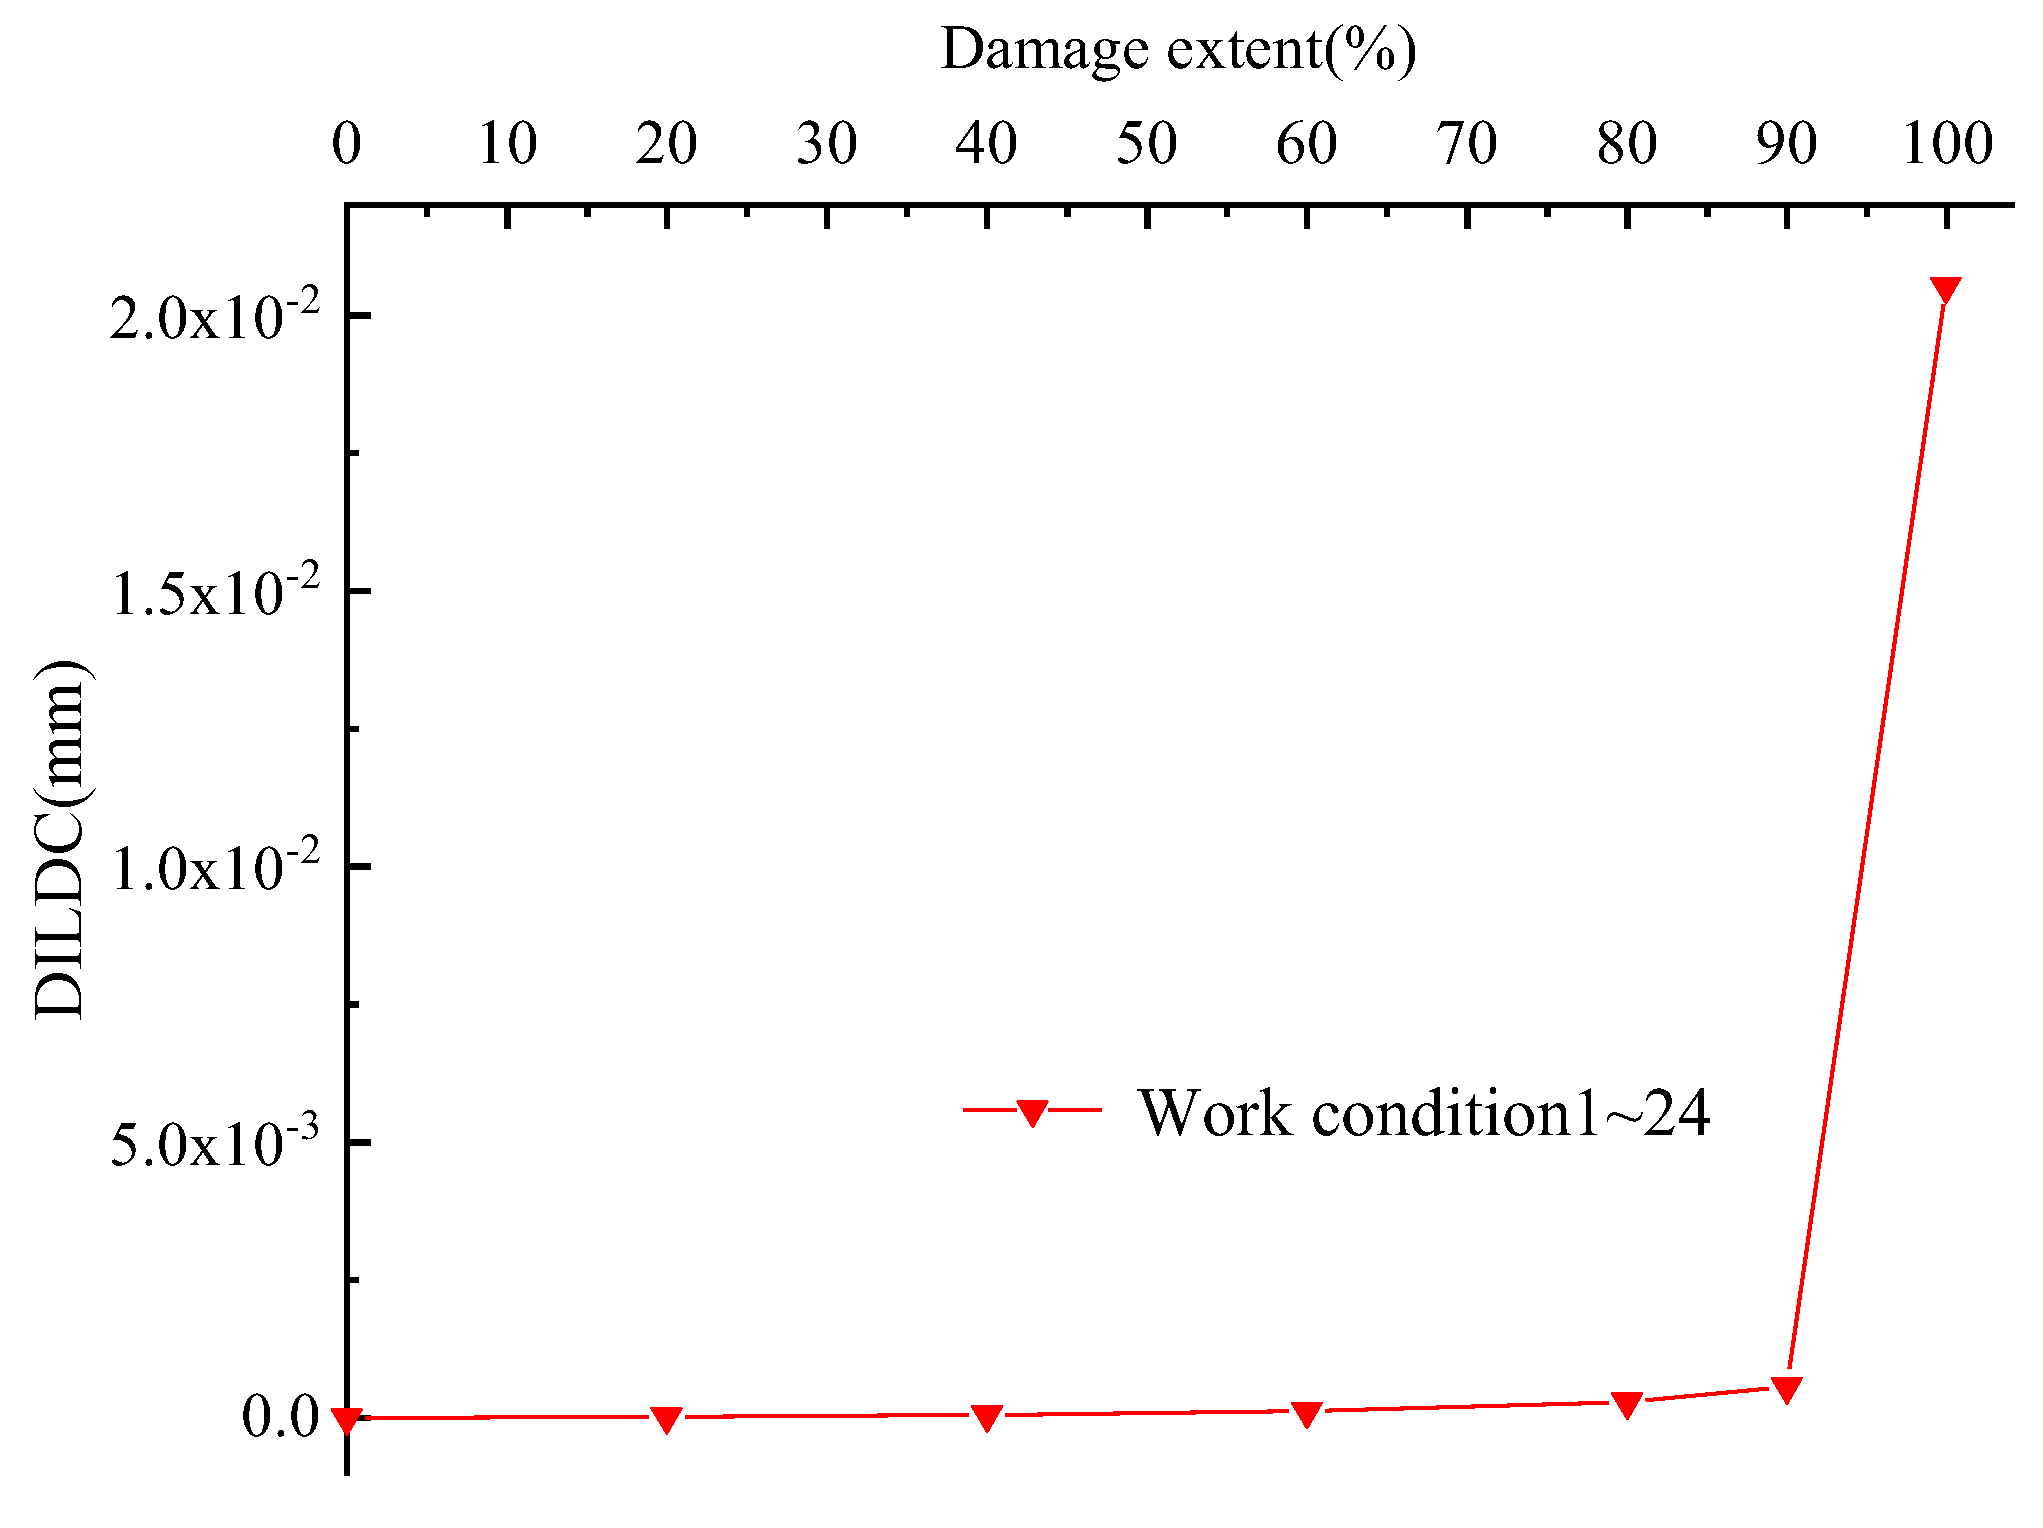
- In actual engineering, damage amplitude can be determined by the DILDC; afterwards, the DILDC amplitude curve under different damage conditions can be simulated by FE software, and the damage extent and amplitude relationship formula can be fitted to invert the damage extent so as to achieve accurate damage quantification.
- (4)
- The results show that the amplitude of DILDC index curve is proportional to the damage extent, and the DILDC index has a good effect on the identification of single-location and multiple-location damage of the arch bridge.
- (5)
- The research in this paper contributes to the development of damage diagnosis and load capacity assessment methods for arch bridges. With a combination of existing bridge monitoring methods, the identification method of arch-bridge damage proposed in this paper has the prospect of facilitating routine health assessment of in-service arch bridges in the future.
Author Contributions
Funding
Data Availability Statement
Conflicts of Interest
References
- Yang, J.F.; Huang, L.; Tong, K.; Tang, Q.; Li, H.; Cai, H.; Xin, J. A Review on Damage Monitoring and Identification Methods for Arch Bridges. Buildings 2023, 13. [Google Scholar] [CrossRef]
- An, Y.; Chatzi, E.; Sim, S.H.; Laflamme, S.; Blachowski, B.; Ou, J. Recent progress and future trends on damage identification methods for bridge structures. Struct. Control Health Monit. 2019, 26, e2416. [Google Scholar] [CrossRef]
- Chen, B.C.; Liu, J.P. Review of construction and technology development of arch bridges in the world. J. Traffic Transp. Eng. 2020, 20, 27–41. [Google Scholar]
- He, W.Y.; Ren, W.X.; Zhu, S.Y. Damage detection of beam structures using quasi-static moving load induced displacement response. Eng. Struct. 2017, 145, 70–82. [Google Scholar] [CrossRef]
- Yi, T.H.; Zheng, X.; Yang, D.H.; Li, H.N. Lightweight design method for structural health monitoring system of short- and medium-span bridges. J. Vib. Eng. 2023, 36, 458–466. (In Chinese) [Google Scholar]
- Zheng, X.; Yi, T.H.; Yang, D.H.; Li, H.N. Stiffness Estimation of Girder Bridges Using Influence Lines Identified from Vehicle-Induced Structural Responses. J. Eng. Mech. 2021, 147, 04021042. [Google Scholar] [CrossRef]
- Cheng, X.X.; Song, Z.Y. Modal experiment and model updating for Yingzhou Bridge. Structures 2021, 32, 746–759. [Google Scholar] [CrossRef]
- Gonçalves, M.S.; Carraro, F.; Lopez, R.H. A B-WIM algorithm considering the modeling of the bridge dynamic response. Eng. Struct. 2021, 228, 111533. [Google Scholar] [CrossRef]
- Zhou, Y.; Di, S.K.; Xiang, C.S.; Li, W.; Wang, L. Damage Identification in Simply Supported Bridge Based on Rotational-Angle Influence Lines Method. Trans. Tianjin Univ. 2018, 24, 587–601. [Google Scholar] [CrossRef]
- Wang, N.B.; Zuo, Q.; Li, J.; Huang, T.L. Damage detection method for statically indeterminate bridge based on multi-influence line information in current state. J. Cent. South Univ. (Sci. Technol.) 2021, 52, 3284–3294. (In Chinese) [Google Scholar]
- Fan, C.C.; Zheng, Y.X.; Wang, B.L.; Zhou, Y.; Sun, M. Damage identification method for tied arch bridge suspender based on quasi-static displacement influence line. Mech. Syst. Signal Process. 2023, 200, 110518. [Google Scholar] [CrossRef]
- Wang, N.B.; Wang, C.; Zhou, H.; Zuo, Q. A novel extraction method for the actual influence line of bridge structures. J. Sound Vib. 2023, 553, 117605. [Google Scholar] [CrossRef]
- Zhang, G.W.; Zhao, W.J.; Zhang, J. Bridge distributed rigidity identification of continuous beam bridge based on microwave interferometric radar technology and rotation influence line. Measurement 2023, 220, 113353. [Google Scholar] [CrossRef]
- Zhu, J.S.; Zhang, C.; Li, X.T. Structural damage detection of the bridge under moving loads with the quasi-static displacement influence line from one sensor. Measurement 2023, 211, 112599. [Google Scholar] [CrossRef]
- He, W.Y.; Li, Z.D.; Zhou, L.; Ren, W.-X.; Li, Y. The effect of environmental temperature on influence line of concrete beam type bridge. Structures 2023, 48, 1468–1478. [Google Scholar] [CrossRef]
- Mustafa, S.; Yoshida, I.; Sekiya, H. An investigation of bridge influence line identification using time-domain and frequency-domain methods. Structures 2021, 33, 2061–2065. [Google Scholar] [CrossRef]
- Ge, L.; Koo, K.Y.; Wang, M.; Brownjohn, J.; Dan, D. Bridge damage detection using precise vision-based displacement influence lines and weigh-in-motion devices: Experimental validation. Eng. Struct. 2023, 288, 116185. [Google Scholar] [CrossRef]
- Nady, H.O.; Mohamed, A.B.; Abdo; Kaiser, F. Comparative study of using rotation influence lines and their derivatives for structural damage detection. Structures 2023, 48, 397–409. [Google Scholar] [CrossRef]
- Feng, Q.; Wei, P.; Lou, J.B.; Cai, J.; Xu, R. Analytical solution for quick decision of tied–arch bridge parameters at early-design stage based on Hellinger–Reissner variational method. Structures 2022, 44, 1443–1453. [Google Scholar] [CrossRef]
- Hejazi, M.; Mehdian, A. Experimental and numerical investigation on masonry arch bridges under uniform and line loads. Structures 2023, 47, 665–680. [Google Scholar] [CrossRef]
- You, R.Z.; Yi, T.H.; Ren, L. Equivalent estimation method (EEM) for quasi-distributed bridge-deflection measurement using only strain data. Measurement 2023, 221, 113492. [Google Scholar] [CrossRef]
- Bowen, L.; Anastasios, D.; Vasilis, S. A material characterisation framework for assessing brickwork masonry arch bridges: From material level to component level testing. Constr. Build. Mater. 2023, 397, 132347. [Google Scholar]
- Soleymani, A.; Jahangir, H.; Nehdi, M.L. Damage detection and monitoring in heritage masonry structures: Systematic review. Constr. Build. Mater. 2023, 397, 132402. [Google Scholar] [CrossRef]
- Doeva, O.; Masjedi, P.K. Exact analytical solution for static deflection of Timoshenko composite beams on two-parameter elastic foundations. Thin-Walled Struct. 2022, 172, 108812. [Google Scholar] [CrossRef]
- Shuo, W.; Farhad, H.; Casero, M.; Obrien, E.J.; Fidler, P.; McCrum, D.P. A Novel Bridge Damage Detection Method Based on the Equivalent Deflection Influence Lines–Theoretical Basis and Field Validation. SSRN 2023, 31, 110738. [Google Scholar]
- Zhou, Y.; Di, S.K.; Xiang, C.S.; Wang, L. Damage Detection for Simply Supported Bridge with Bending Fuzzy Rigidity Consideration. J. Shanghai Jiaotong Univ. (Sci.) 2018, 23, 308–319. [Google Scholar] [CrossRef]
- Xiang, C.S.; Liu, H.L.; Liu, C.Y.; Zhou, Y.; Wang, L.-X.; Memmolo, V. Structure Damage Identification Based on Information Entropy and Bayesian Fusion. Math. Probl. Eng. 2022, 2022, 1–19. [Google Scholar] [CrossRef]
- Wang, X.J.; Chen, F.; Zhou, H.Y.; Ni, P.; Wang, L.; Zhang, J. Structural damage detection based on cross-correlation function with data fusion of various dynamic measurements. J. Sound Vib. 2022, 541, 117373. [Google Scholar] [CrossRef]
- Wang, N.B.; Shen, W.; Guo, C.R.; Wan, H.P. Moving load test-based rapid bridge capacity evaluation through actual influence line. Eng. Struct. 2022, 252, 113630. [Google Scholar] [CrossRef]
- Wang, J.J.; Chen, M.; Yin, C.B. Test and research of long-term stress variation of high-pier and long-span continuous rigid-frame bridge. Adv. Mater. Res. 2013, 639–640, 269–273. [Google Scholar] [CrossRef]


| Internal Force | Redundancy Force | Dummy-Moving Load | |||||||
|---|---|---|---|---|---|---|---|---|---|
| Moment | 1 | 0 | |||||||
| Axial force | 0 | ||||||||
| Shear force | |||||||||
| Parameter | Significance | Fundamental Mechanical Expression | Practical Analytical Solution |
|---|---|---|---|
| Elastic center | |||
| The self-displacement of hingeless arch | |||
| The load–displacement of hingeless arch | |||
| Redundancy force | |||
| Parameter | Significance | Practical Analytical Solution |
|---|---|---|
| Deflection at G under moving load | ||
| Deflection at G under redundancy force | ||
| Deflection at G under redundancy force | ||
| Deflection at G under redundancy force |
| Parameter | Significance | Practical Analytical Solution |
|---|---|---|
| Deflection at G under moving load P | ||
| Deflection at G under redundancy force | ||
| Deflection at G under redundancy force | ||
| Deflection at G under redundancy force |
| Deflection of Section | ||||||||
|---|---|---|---|---|---|---|---|---|
| Load Position | Analytical Solution/m | Numerical Solution/m | Relative Error/% | Analytical Solution/m | Numerical Solution/m | Relative Error/% | ||
| Example 1 (rise–span ratio 1/7) | Axial force | 5.233 × 10⁻⁷ | 5.540 × 10⁻⁷ | 5.541 | 5.723 × 10⁻⁶ | 5.795 × 10⁻⁶ | 1.242 | |
| −9.951 × 10⁻⁶ | −1.017 × 10⁻⁵ | 2.153 | 5.233 × 10⁻⁷ | 5.540 × 10⁻⁷ | 5.541 | |||
| 5.233 × 10⁻⁷ | 5.540 × 10⁻⁷ | 5.541 | −9.806 × 10⁻⁶ | −9.988 × 10⁻⁶ | 1.822 | |||
| Axial force not included | 2.279 × 10⁻⁶ | 5.540 × 10⁻⁷ | 311.460 | 6.660 × 10⁻⁶ | 5.795 × 10⁻⁶ | 12.987 | ||
| −6.660 × 10⁻⁶ | −1.017 × 10⁻⁵ | 34.540 | 2.279 × 10⁻⁶ | 5.540 × 10⁻⁷ | 311.460 | |||
| 2.279 × 10⁻⁶ | 5.540 × 10⁻⁷ | 311.460 | 8.870 × 10⁻⁶ | −9.988 × 10⁻⁶ | 11.193 | |||
| Example 2 (rise–span ratio 1/5) | Axial force | 1.296 × 10⁻⁶ | 1.295 × 10⁻⁶ | 0.077 | 6.131 × 10⁻⁶ | 6.169 × 10⁻⁶ | 0.615 | |
| −8.486 × 10⁻⁶ | −8.720 × 10⁻⁶ | 2.683 | 1.296 × 10⁻⁶ | 1.295 × 10⁻⁶ | 0.077 | |||
| 1.296 × 10⁻⁶ | 1.295 × 10⁻⁶ | 0.077 | −9.399 × 10⁻⁷ | −9.590 × 10⁻⁶ | 1.991 | |||
| Axial force not included | 2.279 × 10⁻⁶ | 1.295 × 10⁻⁶ | 43.176 | 6.660 × 10⁻⁶ | 6.169 × 10⁻⁶ | 7.372 | ||
| −6.660 × 10⁻⁶ | −8.720 × 10⁻⁶ | 23.623 | 2.279 × 10⁻⁶ | 1.295 × 10⁻⁶ | 43.176 | |||
| 2.279 × 10⁻⁶ | 1.295 × 10⁻⁶ | 43.176 | −8.870 × 10⁻⁶ | −9.590 × 10⁻⁶ | 7.507 | |||
| Example 3 (rise–span ratio 1/3) | Axial force | 1.861 × 10⁻⁶ | 1.795 × 10⁻⁶ | 3.546 | 6.431 × 10⁻⁶ | 6.417 × 10⁻⁶ | 0.217 | |
| −7.423 × 10⁻⁶ | −7.700 × 10⁻⁶ | 3.597 | 1.861 × 10⁻⁶ | 1.795 × 10⁻⁶ | 3.546 | |||
| 1.861 × 10⁻⁶ | 1.795 × 10⁻⁶ | 3.546 | −9.099 × 10⁻⁶ | −9.322 × 10⁻⁶ | 2.392 | |||
| Axial force not included | 2.279 × 10⁻⁶ | 1.795 × 10⁻⁶ | 21.237 | 6.660 × 10⁻⁶ | 6.417 × 10⁻⁶ | 3.648 | ||
| −6.660 × 10⁻⁶ | −7.700 × 10⁻⁶ | 13.506 | 2.279 × 10⁻⁶ | 1.795 × 10⁻⁶ | 21.237 | |||
| 2.279 × 10⁻⁶ | 1.795 × 10⁻⁶ | 21.237 | −8.870 × 10⁻⁶ | −9.322 × 10⁻⁶ | 4.848 | |||
| Example 4 (rise–span ratio 1/2) | Axial force | 2.059 × 10⁻⁶ | 1.936 × 10⁻⁶ | 5.973 | 6.538 × 10⁻⁸ | 6.495 × 10⁻⁶ | 0.657 | |
| −7.055 × 10⁻⁶ | −7.373 × 10⁻⁶ | 4.313 | 2.059 × 10⁻⁶ | 1.936 × 10⁻⁶ | 5.973 | |||
| 2.059 × 10⁻⁶ | 1.936 × 10⁻⁶ | 5.973 | −8.991 × 10⁻⁶ | −9.265 × 10⁻⁶ | 2.957 | |||
| Axial force not included | 2.279 × 10⁻⁶ | 1.936 × 10⁻⁶ | 15.050 | 6.660 × 10⁻⁶ | 6.495 × 10⁻⁶ | 2.477 | ||
| −6.660 × 10⁻⁶ | −7.373 × 10⁻⁶ | 9.670 | 2.279 × 10⁻⁶ | 1.936 × 10⁻⁶ | 15.050 | |||
| 2.279 × 10⁻⁶ | 1.936 × 10⁻⁶ | 15.050 | −8.870 × 10⁻⁶ | −9.265 × 10⁻⁶ | 4.263 | |||
| Damage Condition | Damage Unit | Damage Extent | Measuring Location (Point) | Result of Identify |
|---|---|---|---|---|
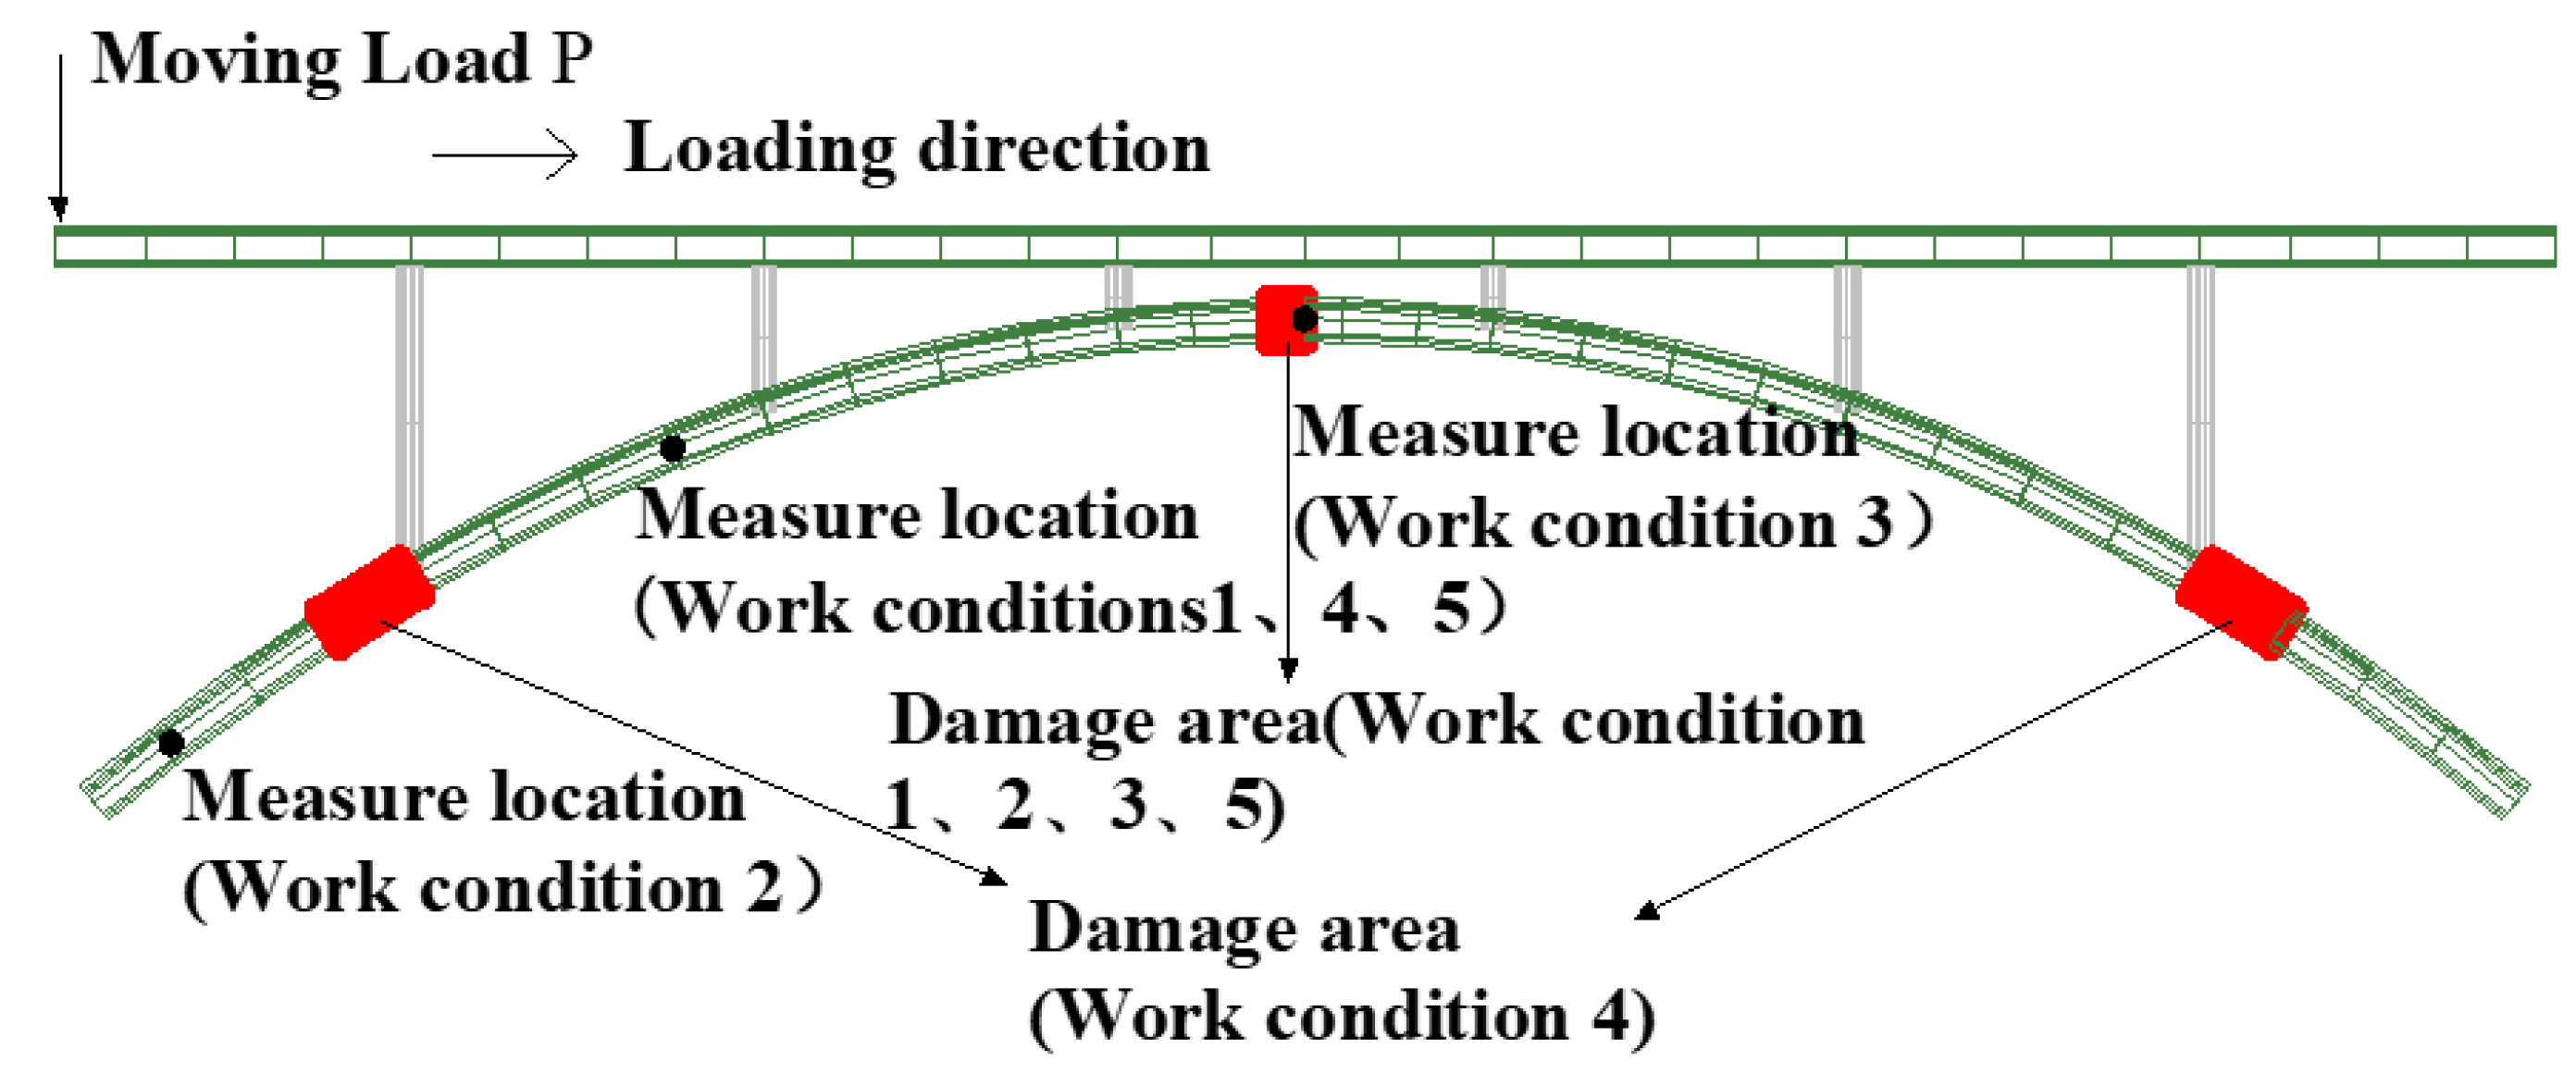
| Work condition 1 | 24# | 5%, 10%, 20%, 40% | 13# | Figure 12 |
| Work condition 2 | 24# | 5%, 10%, 20%, 40% | 2# | Figure 13 |
| Work condition 3 | 2#, 24# | 10% | 13# | Figure 14 |
| Work condition 4 | Between Unit 24# and unit 25# | Mid-span plastic hinge | 13# | Figure 15 |
| Work condition 5 | 24# | 40% (Noise extent 1%, 3%, 5%) | 13# | Figure 16 |
| Damage Extent x | 0% | 20% | 40% | 60% | 80% | 90% | 99.9% |
|---|---|---|---|---|---|---|---|
| Amplitude S(x)max | 0 | 2.10 × 10⁻⁵ | 5.40 × 10⁻⁵ | 1.21 × 10⁻⁴ | 2.93 × 10⁻⁴ | 5.67 × 10⁻⁴ | 2.05 × 10⁻² |
| Damage Condition | Damage Unit | Damage Extent | Measuring Location (Point) | Identify the Result |
|---|---|---|---|---|
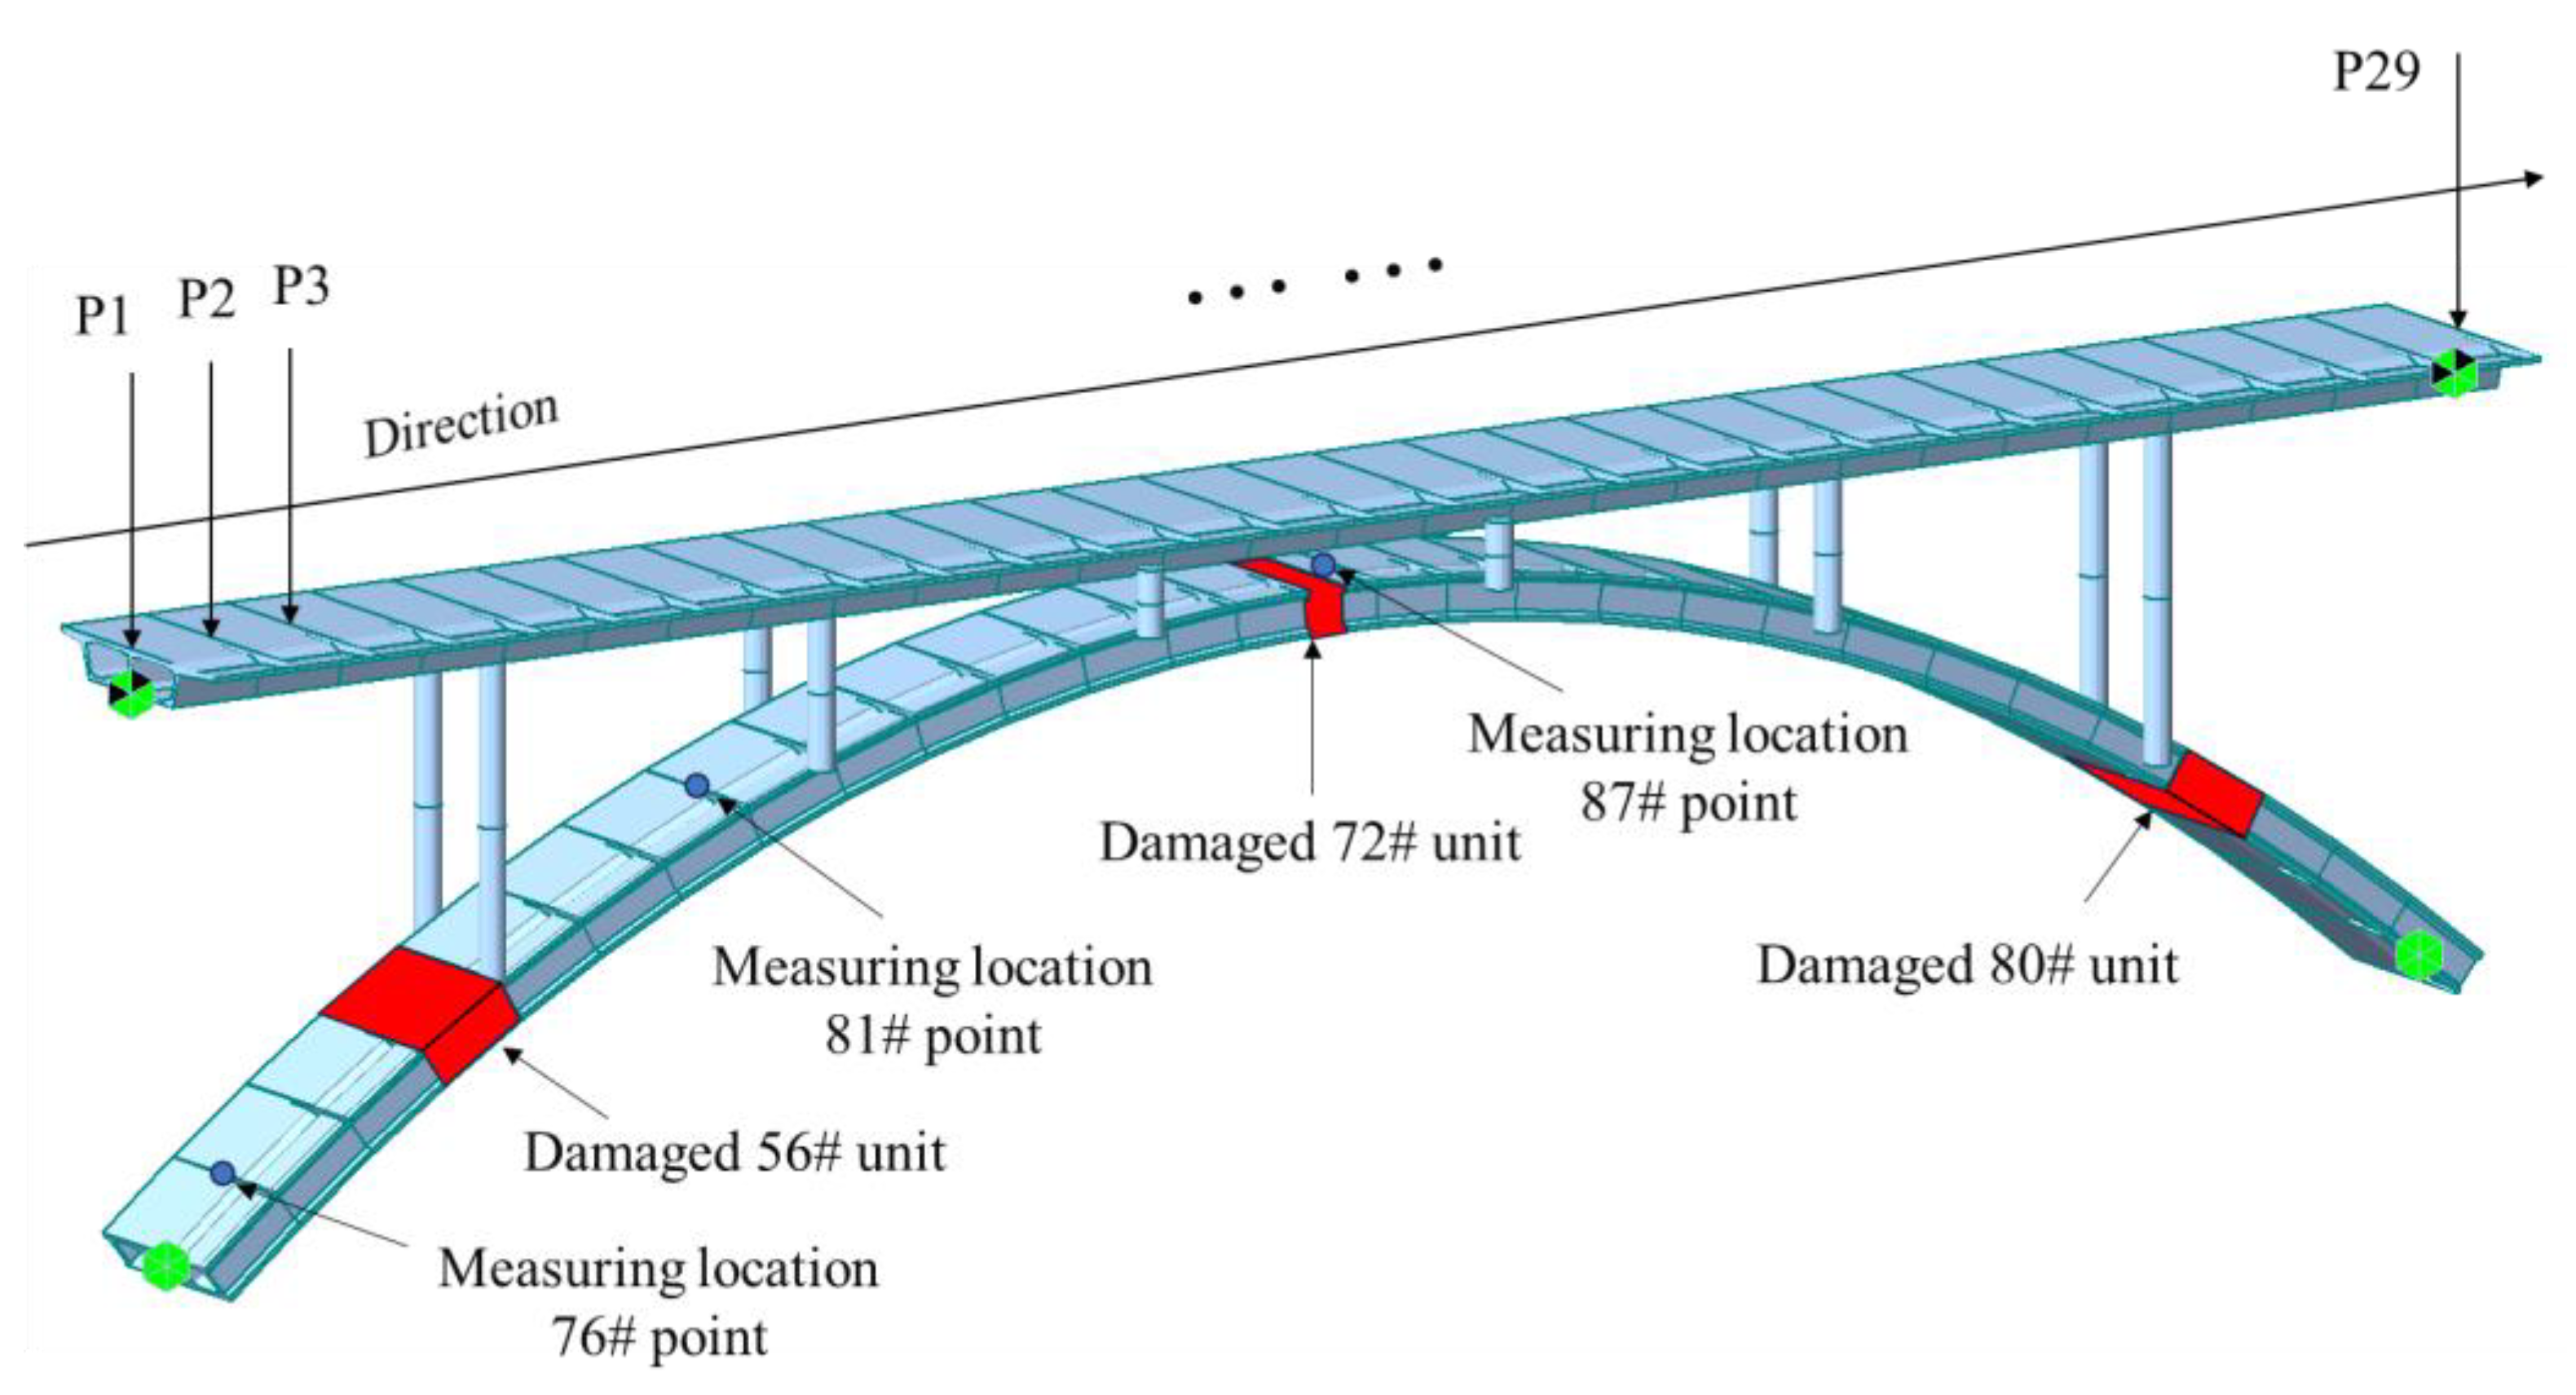
| Work condition 1 | Main arch ring top 72# | 5%, 10%, 20%, 40% | 81# | Figure 25 |
| Work condition 2 | Main arch ring top 72# | 5%, 10%, 20%, 40% | 76# | Figure 26 |
| Work condition 3 | Main arch ring top 72# | 5%, 10%, 20%, 40% | 87# | Figure 27 |
| Work condition 4 | Main arch ring 56, 80# | 5% | 81# | Figure 28 |
| Work condition 5 | Main arch ring top 72# | 5% (Noise intensity 1%, 3%, 5%) | 81# | Figure 29 |
Disclaimer/Publisher’s Note: The statements, opinions and data contained in all publications are solely those of the individual author(s) and contributor(s) and not of MDPI and/or the editor(s). MDPI and/or the editor(s) disclaim responsibility for any injury to people or property resulting from any ideas, methods, instructions or products referred to in the content. |
© 2023 by the authors. Licensee MDPI, Basel, Switzerland. This article is an open access article distributed under the terms and conditions of the Creative Commons Attribution (CC BY) license (https://creativecommons.org/licenses/by/4.0/).
Share and Cite
Zhou, Y.; Li, M.; Shi, Y.; Xu, C.; Zhang, D.; Zhou, M. Research on Damage Identification of Arch Bridges Based on Deflection Influence Line Analytical Theory. Buildings 2024, 14, 6. https://doi.org/10.3390/buildings14010006
Zhou Y, Li M, Shi Y, Xu C, Zhang D, Zhou M. Research on Damage Identification of Arch Bridges Based on Deflection Influence Line Analytical Theory. Buildings. 2024; 14(1):6. https://doi.org/10.3390/buildings14010006
Chicago/Turabian StyleZhou, Yu, Meng Li, Yingdi Shi, Chengchao Xu, Dewei Zhang, and Mingyang Zhou. 2024. "Research on Damage Identification of Arch Bridges Based on Deflection Influence Line Analytical Theory" Buildings 14, no. 1: 6. https://doi.org/10.3390/buildings14010006