Article

Variability in the Distinctive Features of Silica Sands in Central Europe

1
Department of Metallurgical Technologies, Faculty of Materials Science and Technology, VSB–Technical University of Ostrava, 17. Listopadu 2172/15, 708 00 Ostrava, Czech Republic
2
Department of Chemistry and Physico-Chemical Processes, Faculty of Materials Science and Technology, VSB–Technical University of Ostrava, 17. Listopadu 2172/15, 708 00 Ostrava, Czech Republic
3
Department of Enviromental Engineering, Faculty of Mining and Geology, VSB–Technical University of Ostrava, 17. Listopadu 2172/15, 708 00 Ostrava, Czech Republic
*
Author to whom correspondence should be addressed.
Buildings 2024, 14(1), 279; https://doi.org/10.3390/buildings14010279
Submission received: 30 November 2023 / Revised: 12 January 2024 / Accepted: 16 January 2024 / Published: 19 January 2024
(This article belongs to the Special Issue Advances in Cement Composite Materials)

Abstract

:
Quality quartz sand is globally utilized in construction due to its availability and economic factors, especially in the production of composite cements. Despite its positive properties, quartz sand also has several disadvantages. The dilation of quartz sand can be technologically significant for certain high-temperature applications. This dilation has a non-continuous character with sharp volume change caused by the phase transformation from β to α SiO2 at temperatures around 573 °C. The extent of dilation depends on various factors such as compaction, grain size, the quantity of sand, as well as the shape and character of the grain and chemical purity, particularly the SiO2 content. In this study, six types of quartz sand from different locations in Central Europe were examined, and the influence of chemical composition and grain shape was correlated with the final dilation of these samples. Evaluation methods included X-ray fluorescence spectroscopy (XRFS), scanning electron microscopy (SEM), energy-dispersive X-ray spectroscopy (EDX), differential thermal analysis (DTA), and linear thermal expansion analysis. It was found that angular grains, despite their chemical purity, may exhibit minimal dilation. Conversely, the least suitable combination in terms of dilation appears to be a high SiO2 content and high roundness of grains with a smooth surface.

1. Introduction

Quartz fine sand, known for its easy availability, properties, and cost-effectiveness, is utilized not only in the glass, foundry, and electrical sectors but also extensively in the construction industry [1,2,3]. These sands serve as a crucial component in various construction materials, such as composite cements, concretes, and mortars, influencing the resulting characteristics of the material. Fine quartz sands typically exhibit grain sizes ranging from 0.02 to 0.5 mm. Finer grades of sands can effectively act as partial substitutes for fine aggregates or cement in concrete applications [4,5,6]. This fineness is the key factor allowing for the creation of smooth and compact concrete surfaces with sufficient strength [7,8]. For example, in study [9], the authors confirmed the effect of fine sand (granite rock stone powder was used) on the unconfined compressive strength of cement-treated clay mixed composites, where the addition of 50–70% rock stone powder sand led to an increase in surface area and hence higher strength compared to the control specimen and allowed for a 28.6% reduction in the amount of cement in the mix. Generally, used sands should also possess a suitable mineralogical composition and a minimal content of fine particles, such as clays and dust (particles smaller than 0.02 mm) [10]. Another significant characteristic of quartz sands that influences the properties of the resulting material is the shape and surface structure of the grains [11].
In some cases, fine sands can be replaced or mixed with appropriate additives or recycled materials. This can reduce the environmental footprint while customizing the material to specific requirements. The primary focus in such cases is on harnessing existing sand sources, with ongoing experiments involving desert sands [12,13]. As an alternative, from a more ecological point of view instead of landfilling, various kinds of sands sourced from the foundry industry, encompassing both pristine and recycled sands, are also tested [14,15,16]. For example, in [17], the authors studied mixtures of soil and foundry sand with the addition of cement and lime to assess their applicability as base materials for highways. The results of the study show that the winter resistance of the foundry sand-based samples is generally better than that of a typical reference base material and that there will be no environmental impact (effect on groundwater quality).
In the field of construction materials, continuous research is underway to enhance the properties of sands and their utilization in concrete. Innovations involve exploring alternative materials and optimizing compositions to achieve optimal results. Fine sands are a key component in structural concrete, especially where high strength or aesthetic properties are required [18,19,20]. They are also used in special types of concrete, such as self-sealing or low thermal conductivity concretes, or in concretes used for high-temperature applications [21,22,23]. They significantly influence the workability of concrete and can affect properties such as density, strength, and freeze–thaw resistance. The sands are not only crucial in various construction materials but also in 3D-printed rock analogs and other experimental model preparations. For those, some previous studies were suggested [24,25,26].
Fine sands are incorporated into construction materials with the aim of achieving the optimal physical and mechanical properties of concrete and cement, taking into account the specific requirements of particular applications [18,21]. The thermal expansion of sands, especially quartz sands, is an important factor in their use in various applications such as cement, concrete, or ceramics. Quartz sand, composed mainly of the mineral quartz (SiO2), plays a crucial role in influencing the characteristics of the final product. Unlike other fine aggregates, it exhibits a non-continuous thermal expansion due to multiple changes in its crystal lattice when subjected to heat [27]. Some of these changes result in substantial fluctuations in volume. The extent of this dilation varies based on the specific type of quartz sand, its purity, and the morphology of its grains [28,29,30]. The presence of impurities (so-called mineralizers) can significantly influence thermal expansion or reduce the temperature of the phase transformation to cristobalite, which can occur under specific conditions starting from around 900 °C [29]. However, technologically more significant is the transformation from β-SiO2 to α-SiO2, occurring at lower temperatures, around 573 °C, accompanied by a sharp increase in volume of up to approximately 3.9% [11]. This transformation is reversible and is significantly affected by grain size (smaller particles resulted in higher dilatation) and chemical composition (sample with a SiO2 content higher by 1.1% achieved 19.8% more dilatation compared with a sample with less SiO2), as suggested by some studies [31,32,33].
The thermal expansion of quartz sand becomes a critical consideration at elevated temperatures because it can affect the overall thermal expansion of the resulting concrete or composite cement. Despite concrete and composite cement being generally considered materials with low thermal expansion compared to metal, they are suitable for structures such as bridge decks and similar constructions. The thermal expansion of concrete is in the order of tenths of millimeters per meter [34]. The thermal expansion of composite cement and concrete plays a key role in the design and construction of buildings and technological units, especially where they are exposed to significant temperature changes [35]. For instance, it is used to create heat-resistant insulation materials. These materials can be used to form thermal insulation layers or protective coatings for constructions exposed to high temperatures. This is the case, for example, in applications such as the cement sheath of heavy oil reservoirs subjected to hot steam injection reaching temperatures up to 380 °C, where there is ongoing exploration into quartz-enhanced cement [36,37,38]. For example, study [36] found that the proposed cement system with SiO2 particles significantly increased the compressive strength by more than 50 MPa even under the conditions of the seventh round of steam curing. It can also involve the use of so-called refractory (high-temperature resistant) concretes and cements used in the construction of industrial furnaces, waste incinerators, fireplace linings, and other structures exposed to temperatures above 200–1000 °C. These materials must be resistant to thermal shocks and oxidation [39]. Further experimentation is being conducted in the construction industry with concretes that can be used in solar structures. For these concretes, the ability to accumulate heat during the day and release it at night is assumed, contributing to the energy efficiency of buildings.
When working with sands containing quartz for the production of composite cement, one of the key factors, besides grain size, should be the character (such as surface structure with pores and cavities and smoothness) and shape of the grain and its chemical composition (oxides). Individual quartz sands differ from each other in their origin, which then determines these grain properties and their subsequent technological parameters. One of these technological parameters is the resulting linear thermal expansion of quartz sands, which can be crucial when used at high temperatures. Therefore, understanding the influence of grain character and its chemical composition on the resulting dilation can be an important part of the decision-making process in selecting suitable raw materials, which, especially in terms of grain shape, has not received much attention, and differences in individual sands have been little explored so far. The aim of this experiment is to evaluate the impact of origin and grain shape, as well as its chemical composition, on the resulting thermal dilation. For greater variability, six high-quality quartz sands from mining sites in Central Europe were examined.

2. Materials and Methods

2.1. Sand Samples

In the context of this experiment, natural washed quartz sands were analyzed. These sands were obtained from 6 different mining locations in Central Europe, specifically from the Czech Republic (designated as ST 54), Poland (designated as GL 21, BG 21, and BK 23), and Slovakia (designated as SH 35 and SE 22). All six samples consisted of highly pure natural washed quartz sands, characterized by a high SiO2 content (all 90% SiO2 and above), representing sands of glassmaking or foundry quality also used in construction. Washing and purification of these sands ensured the minimal presence of clay particles and dust. Individual sand samples from different mining locations differ in their characteristic properties (shape and grain structure), as well as in chemical composition. Within this experiment, samples of sands with the same granulometric composition were used, with a declared median grain size around 0.21 ± 0.02 mm.

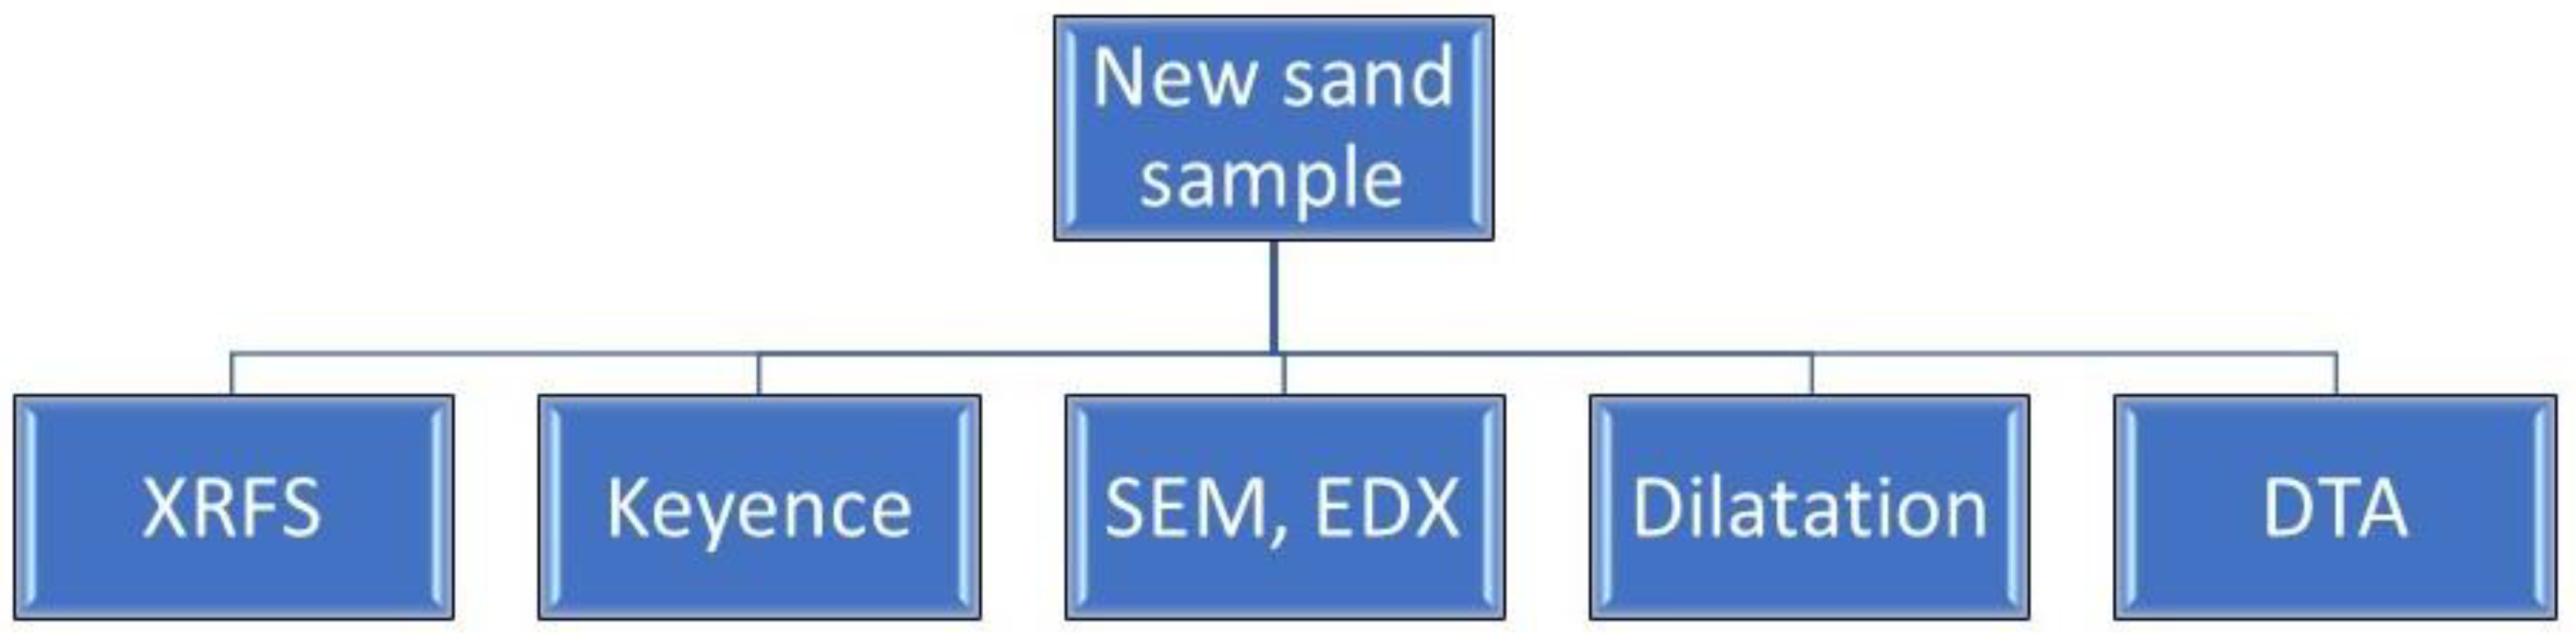
2.2. Testing Methods

Under the conditions of this experiment, the determination of the chemical composition, particularly the actual SiO2 content and impurities, was carried out through X-ray fluorescence spectroscopy (XRFS) using the Rigaku Supermini 200 analyzer. The EasySken method (a non-standard method) was employed for measurements, set up and calibrated by the analyzer manufacturer. The initial state of individual samples for this measurement involved finely grinding the samples into powder (<0.1 mm) using a laboratory mill, homogenizing them, and subsequently forming tablets by pressing with a sample-to-binder ratio of 4:1. The binder used was Hoechst wax C. Loss on ignition (LOI) was carried out on dried samples (at 130 °C) in preannealed crucibles in a chamber annealing oven. The measurement temperature was set at 1000 °C and the holding time was 2 h. Three measurements were taken for each sample.
The grain shape of all six samples of quartz sand, including visual assessments of captured impurities and the presence of inclusions, was examined using images taken with the Keyence VHX 6000 digital microscope at a magnification of 200× and coaxial illumination. Images from the digital microscope were complemented by scanning electron microscopy (SEM) measurements using the FEI QUANTA 450 FEG (FEI Czech Republic, Brno, Czech Republic), allowing for a visual assessment of impurity quantity, including grain shape and surface, at a magnification of 600×. The previous XRFS analysis was subsequently complemented by point EDX analysis. For each sample, a number of images were taken at different magnifications so that the most common grain shape and surface could be assessed and a reference grain for point EDX could be determined. The composition was evaluated only for pure quartz grains, not for inclusions or grains of other minerals.
Linear thermal expansion analysis was conducted using a special Al2O3 container for powdered materials on the Netzch DIL402/C (Netzch, Selb, Germany) dilatometer. Free-flowing samples, without any compaction, were placed into the container and gently leveled using 3 taps with tweezers. The size of the obtained samples for measurement in the container ranged from 10.0 ± 0.1 mm. The parameters of the measurement procedure were as follows: the heating rate of the samples was 15 °C/min until reaching the final temperature of 1130 °C. The measurement took place under an inert atmosphere of 6.0 Argon with a flow rate of 100 L/min.
Differential thermal analysis (DTA) was performed to precisely determine the temperature of the onset of the β-SiO2 to α-SiO2 phase transformation, as the measurement of thermal expansion captures only the temperature of the change itself, not its exact beginning. DTA analysis was conducted using the SETARAM Setsys 18TM (SETARAM, Caluire, France) instrument. The temperature calibration of the instrument was performed using the calibration material Al 5N. A sample weighing approximately 80 mg was placed in an Al2O3 crucible with a lid (100 μL). An isotherm was set at 20 °C (2 h), followed by heating from 20 to 1100 °C at a rate of 10 °C/minute and cooling from 1100 to 20 °C, also at a rate of 10 °C/min. The measurement was conducted under an inert atmosphere of 6.0 Argon.
All measurements were performed on at least 3 samples of each investigated material in its initial state. The results were then averaged. If any values differed by more than 5%, subsequent measurements were conducted to confirm the result.
Figure 1 provides a straightforward schematic depiction of the step-by-step process involving individual measurements and sample production. Detailed information regarding the specific measurements and the materials employed is outlined in the subsequent sections.

3. Results and Discussion

3.1. Chemical Composition

The chemical composition assessment, specifically the quantities of oxides, for all types of sand was conducted using XRFS analysis. It was confirmed that in all cases, these are highly chemically pure sands, designated as glassmaking quality sands, with a SiO2 content exceeding 90%. In quartz sands, the technologically most important content is SiO2, defining refractoriness; Al2O3 indicates the possible presence of clay residues, while Fe2O3 and potential inclusions (indicated by K2O content) inversely reduce refractoriness. In addition to the major and technologically significant oxides, sands may contain traces of other minerals and oxides, generally in minor proportions. The comprehensive results of the chemical composition are presented for major oxides in Table 1 and for minor oxides in Table 2. The difference between the results of the individual measurements did not exceed 5%.
The highest chemical purity was achieved by sample ST 54, specifically 99.15% SiO2, with a minimal presence of other oxides, below 0.5%. It contained no minor oxides. Sample ST 54 was closely followed in chemical purity by sample GL 21 (0.269 mass % less SiO2 compared to ST 54) and sample BG 21 (1.35 mass % less SiO2 compared to ST 54). In the case of GL 21 and BG 21, these were samples of sand from related deposits close to each other, where, due to the same origin of the sand, similar or nearly identical properties, including chemical composition, were expected. However, sample BG 21 exhibited almost double the content of Al2O3, Fe2O3, and K2O, indicating a higher presence of inclusions and clay minerals, compared to sample GL 21. In comparison with other samples, the content of TiO2 was also unusual, specifically 0.83%, approximately 3.5 times higher on average. Samples GL 21 and BG 21 did not contain minor oxides.
On the other hand, the lowest chemical purity was observed in sample SH 35 with a SiO2 content of 91.024%, which is 8.13 mass % less compared to ST 54. This sample also showed more than 3% content of Al2O3 and K2O oxides, indicating a higher level of inclusions and clays negatively affecting the refractoriness of the sand. The content of Fe2O3 was nine times higher than in the purest ST 54 and also compared to the other two highly pure samples. A similar representation of individual oxides was also exhibited by another sample labeled SE 22, which again was a sample from a related deposit of the same origin. This sample showed a SiO2 content 0.44 mass % higher than sample SH 35 and a slightly lower content of impurities, including minor oxides. However, this difference can be considered negligible compared to other samples. Both samples exhibited a similar range of minor oxides. Sample BK 23 represented an intermediate between the investigated samples with high and low chemical purity in terms of SiO2 content, which was 94.117%, 5.03 mass % less than ST 54. Major oxides were primarily represented by a higher content of Al2O3 (2.54 mass %) and K2O (1.60 mass %). In the case of sample BK 23, as with sample ST 54, it was not a related sample from the same locality as any other sample examined.

3.2. Shape and Character of Grains

Using the Keyence VHX 6000 (Keyence, Osaka, Japan) digital microscope, detailed images of all sand samples were captured at a magnification of 200× (visible in Figure 2), allowing for the observation of grain shape, surface structure, and the influence of chemical composition on the appearance and color of the sand.
Natural quartz sands occur in nature in deposits accompanied mostly by clay minerals. These sands are either supplied together with some natural clay content (illites and kaolinites) in the so-called mined state, or after extraction they are washed with water and dried, the so-called washed sands. In this way, the individual grains are separated from the clay. Most quartz sands in nature then contain varying amounts of SiO2 in different mineralogical forms (most quartz, lesser amounts of cristobalite, and tridymite) and other minerals such as fayalite, spinels, feldspars, etc. Depending on the deposit and the origin of the deposit, their content and relative proportions vary. Highly chemically pure sands after washing (SiO2 content above 90%) form only a part of European deposits. These sands then reach the so-called glass or foundry quality.
The examined samples shown in Figure 2 are all washed sands from deposits characterized by high SiO2 content after washing. Nevertheless, the presence of other minerals or contamination by residual clays or quartz grains with lower SiO2 content can also be observed according to the coloration. This is due to the formation of the deposit and it is recognized as a “nature” of the particular sand. These less pure sands generally have rounder grains, as they were transported from long distances by water or air to the present-day deposit sites (aeolian sands) at the time of formation. For this reason, they also contain more feldspars and other minerals than the more angular, so-called marine sands that were formed at the site of extraction. The aeolian sands then have generally different technological properties, such as lower refractoriness due to the presence of low-melting feldspars.
The greatest color variation, and therefore different composition, was observed in the case of samples SH 35 (Figure 2a) and SE 22 (Figure 2f), consistent with the previous results of XRFS analysis and their lower chemical purity. There were also visible grains of a different character, cracked with depressions and cavities and a dull or non-transparent surface, likely composed of inclusions. Individual grains were round to oval-shaped; in the case of transparent grains, composed mainly of SiO2, they had a smooth surface. Another sample with round to oval-shaped grains was sample BK 23 (Figure 2e). However, this sample visibly contained more transparent, colorless, or slightly colored quartz grains with a high SiO2 content. The proportion of impurities was noticeably smaller, corresponding to the previous chemical composition.
Sample ST 54 was without visible impurities (Figure 2b). The grains were clear and angular, with sharp edges and visible fracture surfaces. The transparency of the grains corresponds to the previously determined high SiO2 content, where almost the majority of grains were composed mainly of this oxide. Samples GL 21 (Figure 2c) and BG 21 (Figure 2d) represented an intermediate stage between sample ST 54 and rounded-grain samples with lower purity. In both samples GL 21 and BG 21, there were occasionally visible grains with lower chemical purity, tinted slightly pink. However, these were not grains of visibly different composition and character (inclusions) as in the case of SH 35 and SE 22, but rather adhered impurities and contaminants, such as clay.
The detailed grain characteristics of each sample were evaluated based on images captured with a SEM microscope at a magnification of 600×. The focus was solely on quartz grains, thus those with a high SiO2 content, excluding grains of other minerals, inclusions, or impurities. Evaluation primarily considered the grain surface, erosion, the quantity of cracks, and angularity. The point EDX composition of each reference pure grain, a centrally displayed grain with a marked point, was subsequently assessed. The results are evident in Figure 3 and Figure 4. Detailed point EDX analysis results are shown in Table 3. Similar to the Keyence images, grains of samples SH 35 (Figure 3a) and SE 22 (Figure 4d) were round to oval in shape with rounded edges. The surface was smooth, without cracks, erosion, or significant porosity. There were no pronounced fracture surfaces from the crushing of sand grains. A similar character was exhibited by sample BK 23 (Figure 4e), with rather rounded oval grains. In the EDX point analysis, these three sand samples showed a high oxygen content compared to the other evaluated samples and the lowest Si content (Table 3). They also demonstrated a higher amount of Al and traces of Mg, K, and Fe, indicating the previously confirmed higher presence of other oxides besides SiO2. The presence of K and Fe, shown in the EDX results, indicates the presence of probably residues of potassium feldspars (orthoclase) and fayalite, which are common in quartz sands. In both cases, these are minerals with lower refractoriness compared to quartz. Considering that the quartz grains were examined (high Si peak), these were likely residues of clay (Al peak) or dust remnants from the crushing of softer inclusions (Mg and K peaks).
In the case of samples GL 21 (Figure 3c) and BG 21 (Figure 4d), the larger grains were oval to slightly angular with rounded edges. The surface was mostly smooth, occasionally with shallow cracks or minor erosion. Smaller grains already showed signs of fractures, sharp unpolished edges, deeper cracks, or surface fissures, indicating grain crushing. Erosion was particularly evident in the porous structure of some grains. The Si and O content was high for both samples according to point EDX (Table 3). Additionally, trace amounts of Al were noticeable, likely from impurities adhering to the surface of the quartz sand grain. Sample ST 54 (Figure 3b) was characterized by its most angular grain shape among all six examined samples. The grain surface was very rugged, rimosed with pronounced cracks and fissures. The grains had sharp edges and distinct fracture surfaces. Some areas exhibited a porous character. EDX confirmed a high content of Si and O, consistent with the previously confirmed chemical composition with a high SiO2 content. The Si content (Table 3) there is the highest from all tested sands, namely 46.45%. Furthermore, the grain showed a slightly higher content of Al compared to samples GL 21 and BG 21. This could be attributed to captured particles on an otherwise highly cracked grain surface.
Based on the grain shape, samples SH 35, BK 23, and SE 22 are classified as aeolian sands, which were transported to the mining site by wind or water, i.e., allochthonous in origin. This transport caused the abrasion of grain edges and their rounded shape. From a technological perspective, aeolian sands exhibit a smaller surface area compared to angular sands. The rounded shape and smooth surface directly affect the fluid absorption by the grains (e.g., water), which is lower, or the amount of material (e.g., binder) needed to coat the grain surface. Rounded sands with a smooth surface can also contribute to higher strengths in mixtures, considering the results of studies evaluating the impact of grain shape on the strengths of cured organic or inorganic molding mixtures for foundry purposes, where these sands are also used [40,41]. On the contrary, angular grains with sharp edges (ST 54) or rounded edges (GL 21 and BG 21) result from sand extraction directly at the source. These sands were not transported but formed by the erosion of original rocks or sediment beds. Angular sands are characterized by their large surface area compared to rounded aeolian sands, due to their pronounced ruggedness (considering cracks, fissures, etc.). This directly leads to the higher absorption of these grains or lower strengths of mixtures. Conversely, during compaction, angular sands fit together much better.

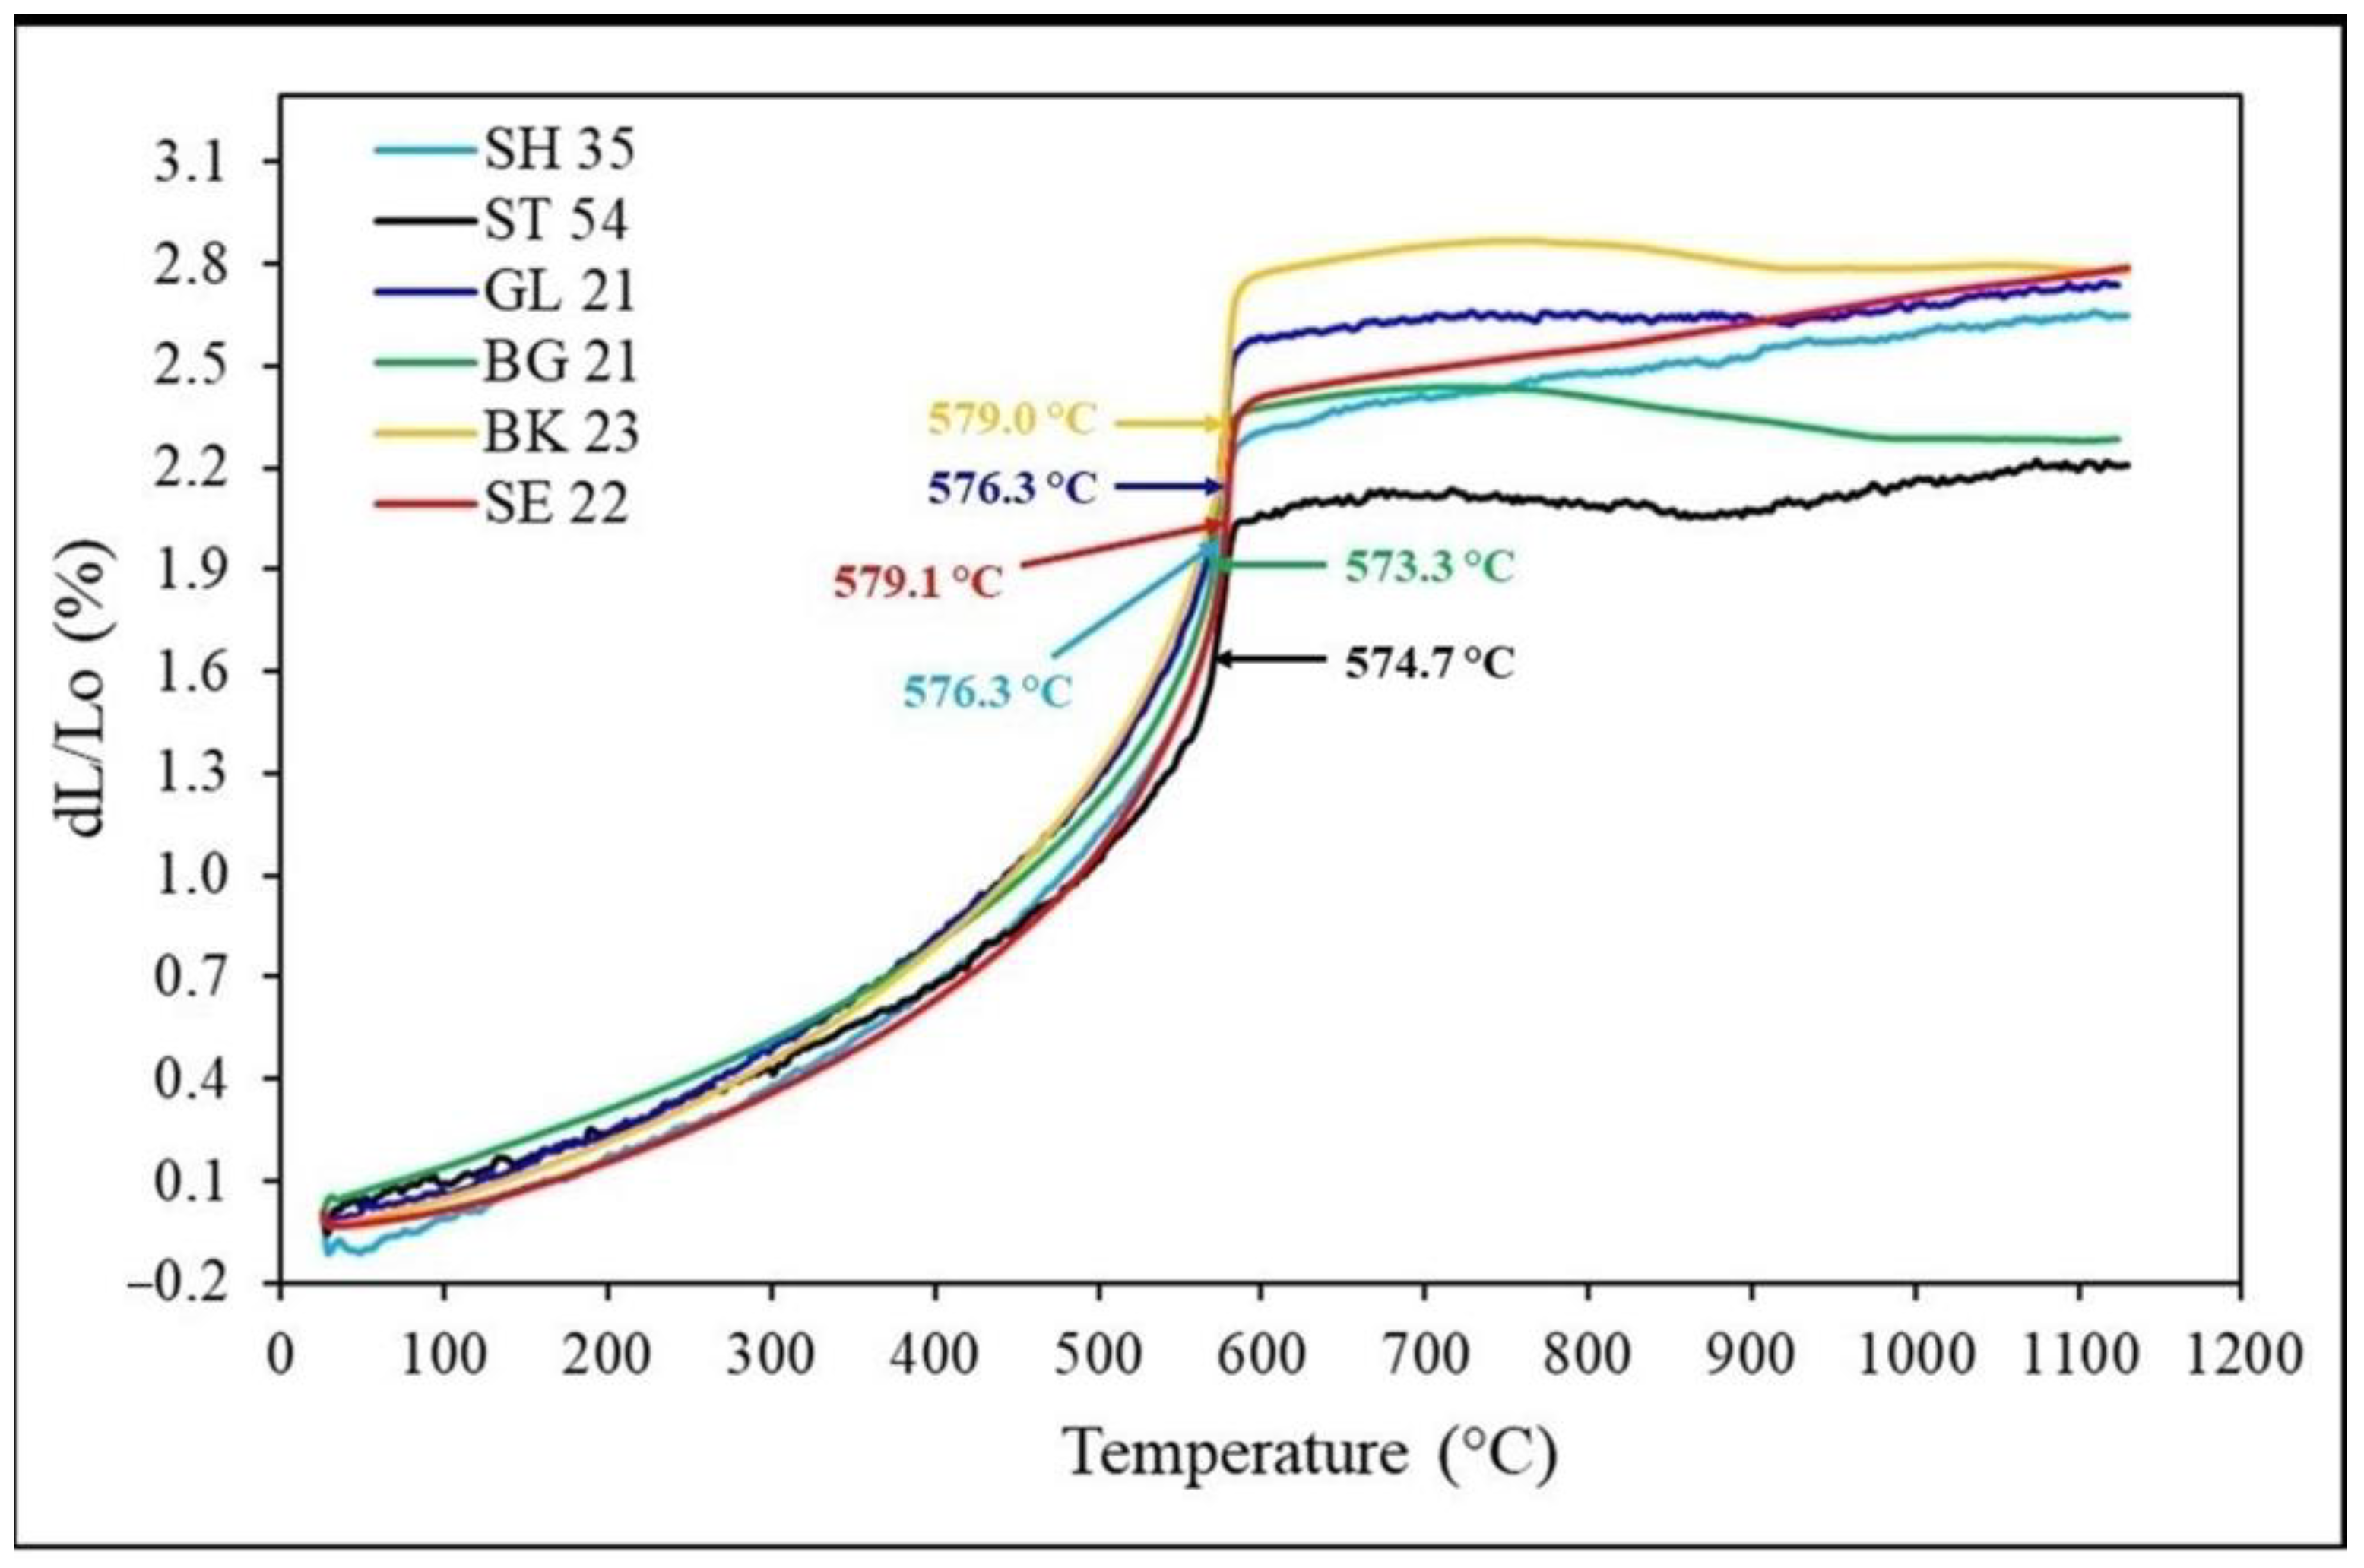
3.3. Linear Thermal Expansion and Phase Transformation

Unlike other natural sands (such as olivine) or synthetic sands (ground chamotte or other aluminosilicates) and recycled materials, quartz sands exhibit a non-linear expansion curve due to numerous changes in the crystal lattice of the main mineral, namely quartz. During thermal exposure, a phase transformation from β-SiO2 to α-SiO2 occurs, accompanied by a sharp volumetric change. This specific transformation is technologically significant as it occurs, unlike other phase transformations in quartz, at a relatively low temperature, around 573 °C.
All samples were measured in the same manner to prevent the introduction of errors. Table 4 provides specific results of the final expansion of the samples at a temperature of 1130 °C. The resulting expansion curves for individual sand samples and the specific temperature of the β to α SiO2 phase transformation are evident from Figure 5. Because the phase transformation temperatures considered during the expansion assessment only account for the temperature of the full course of the volumetric change itself, it was necessary to perform DTA evaluation to determine the onset temperature of this transformation. The results of DTA for individual samples are then mentioned in Figure 6.
The lowest expansion was achieved in the case of sample ST 54, specifically 2.21%. This sample also exhibited the mildest volumetric change compared to other samples, where the phase transition change was accompanied by a much more abrupt volumetric expansion, as evident from the graph. The actual phase transition change occurred at a temperature of 574.7 °C, the second-lowest temperature compared to other samples. On the other hand, the highest final expansion at 1130 °C was achieved in the case of sample SE 22, specifically 2.79%, which is 26.2% higher compared to ST 54. A related sand sample from a nearby deposit, SH 35, showed a lower final expansion, only 2.65%. Thus, compared to SE 22, it was 5.0% lower and 19.9% higher compared to the lowest measured expansion in ST 54. The most abrupt phase transformation from β to α SiO2 was recorded in sample BK 23. The highest expansion immediately after the phase transformation achieved with this sample was 2.97%, which is 34.4% more than ST 54, even though the final expansion at 1130 °C was only 2.78%. Sample GL 21 exhibited a final expansion of 2.73%, which is 23.5% higher than ST 54 and 19.7% higher than its related sample BG 21, which, in turn, showed a final expansion of only 2.28%. This was higher than ST 54 by only 3.2%. However, sample BG 21 showed an uneven and somewhat steeper slope of the expansion curve compared to GL 21, exhibiting a significant expansion peak. At the highest point, this peak reached an expansion of 2.49%, and the difference between BG 21 and GL 21 was only 6.8% at this temperature of 798 °C (GL 21 expansion at 798 °C was 2.66%).
The most significant factor influencing the overall expansion rate is the grain shape. In the case of samples SH 35, SE 22, and BK 23, they were rounded-grain sands with a smooth grain surface, as evident from Figure 3a and Figure 4e,f. Rounded grains interlock well under load, forming assemblies with minimal pore content and point contact with adjacent grains [32]. The absence of pores between grains and cracks or otherwise irregular surfaces in samples SH 35, SE 22, and BK 23 made these samples more susceptible to higher expansion because there was no space to compensate for grain expansion, thus preventing a certain natural relaxation of this expansion. The resulting samples expanded more than sands with more angular grain shapes (ST 54, as well as GL 21 and BG 21).
In the case of sample ST 54, it was the opposite extreme, i.e., sand with very angular grains and sharp edges. Unlike spheres or rounded-grain sands, where the contact between individual grains could only be point-like, in the case of very angular grains, SEM images (Figure 3b) revealed both edges and entire fracture surfaces of the grain, allowing for several touch variants. These variants included surface-to-surface, surface-to-edge, and edge-to-edge contacts. When assembling angular grains, due to the possibilities of mutual grain contact, there was subsequently an increase in the volume of free spaces between grains, i.e., pores, in contrast to rounded-grain sands. This large number of free pores allowed sample ST 54, unlike rounded-grain sands SH 35, SE 22, and BK 23, to relax thermal grain expansion by allowing the grain to expand into these free spaces.
Samples GL 21 and BG 21, in terms of grain shape, represented an intermediate between rounded-grain sands and angular ST 54. By nature, they were more oval with rounded edges, as evident from SEM Figure 3c and Figure 4d. This shape allowed grains to interlock better while maintaining sufficient porosity and intergranular spaces. Occasional cracks and depressions in the grains also provided additional space for grain expansion compensation. As a result, GL 21 and BG 21, while not achieving as low expansions as ST 54, still exhibited lower expansions compared to rounded-grain sands (SH 35, SE 22, and BK 23).
Another significant factor influencing the extent of dilation is the chemical composition of the sand, specifically the SiO2 content. In general, a higher SiO2 content in sands leads to higher dilation, as confirmed by some studies [28,30], but also to various temperature profiles during the phase transformation from β to α SiO2. From the results of the chemical composition and their relation to the resulting dilation, it was evident that samples with a higher chemical purity exhibited more dilation. This was particularly observed in samples of related character and origin, considering the major influence of grain shape mentioned above. Differential dilation was observed in samples SH 35 and SE 22, as well as GL 21 and BG 21. In the case of rounded-grain sands, a 5.3% greater dilation was observed for the chemically purer SE 22 (91.464% SiO2) compared to the less pure SH 35 (91.024% SiO2), as shown in Table 1. The temperature of the phase transition progression, and thus the abrupt volumetric change, increased with increasing SiO2 content (Figure 5, Table 4), as did the temperature of the beginning of the phase change according to DTA (Figure 6). Chemically purer SE 22 initiated the phase change at 552 °C, which was 6.0 °C higher than the less pure SH 35 (546 °C). The abrupt volumetric change occurred for SE 22 at a temperature of 579.1 °C, which was 2.8 °C higher than for sample SH 35 (576.3 °C). This trend was repeated in the case of oval sands GL 21 and BG 21, where chemically purer GL 21 showed an overall 19.7% greater dilation than the less pure BG 21. The temperature of the onset of the phase transition according to DTA was 555 °C for chemically purer GL 21, which was 8.0 °C higher than for less pure BG 21 (547 °C). The temperature of the abrupt volumetric change for GL 21 was 576.3 °C, a whole 3.0 °C higher than for less pure BG 21 (573.3 °C). The content of impurities, specifically feldspars, reduced dilation and the phase transformation temperature. Feldspars are characterized by lower refractoriness and hardness on the Mohs scale compared to quartz. The reduction in dilation and transformation temperature can be explained by the earlier melting of these minerals, where the melt subsequently filled intergranular spaces, releasing its original space for the dilation of the remaining more refractory grains. Feldspar grains are also significantly softer and likely facilitated the crushing of harder grains (SiO2) to some extent, thereby releasing space.
In the case of sample BK 23, it was a combination of rounded grains with a smooth surface and higher chemical purity compared to samples SH 35 and SE 22. This particular combination of grain shape, minimal presence of intergranular spaces, and expansiveness based on SiO2 content, as demonstrated in previous samples, allowed for the sand to exhibit a much more abrupt volumetric change, with a significant dilation reaching higher values (2.97% at a temperature of 932 °C) compared to other examined samples, specifically 34.4% higher than ST 54. Sample ST 54, despite its highest chemical purity, paradoxically exhibited the lowest dilation. The reason was precisely the grain characteristics, where their angularity and structure significantly reduced dilation instead.

4. Conclusions

This experiment investigated the basic characteristics of six types of quartz sands from locations in Central Europe. The examined characteristics primarily included chemical composition and the influence of grain character and shape, which can significantly contribute to the resulting linear thermal dilation of sand and be the cause of many related issues. Based on the conducted tests, the following were confirmed:
  • Influence of grain shape: Rounded grains exhibit more dilation than angular grains due to the better interlocking of rounded grains and a higher number of contacts, resulting in a smaller number of intergranular pores for the grain to expand into. On the contrary, angular grains create a larger number of intergranular spaces during stacking, allowing for dilation relaxation.
  • It was found that the values of the resulting dilatation for oval grains are on average higher than for square-grained sands but generally lower than for purely round-grained sands with a smooth surface. Influence of chemical purity: Higher SiO2 content increases susceptibility to dilation and can shift the temperature of the phase transition from β to α SiO2 to higher temperatures.
  • The presence of impurities and feldspars reduces dilation and the temperature of phase transitions by influencing the lower hardness and lower refractoriness of feldspars. The formation of the melt helps relax the expansion of grains.
  • The combination of higher chemical purity and rounded grain shape with a smooth surface achieved the highest dilation, namely 2.78%.
  • Angular quartz sand with high chemical purity achieved the lowest dilation at 2.21%, despite having the highest SiO2 content, due to the shape of its grains.
It is not entirely certain how other factors that may affect the resulting dilation of quartz sands, such as grain size and granulometric composition, would impact the final dilatation. This verification could be the subject of further investigation.

Author Contributions

Conceptualization, M.B. and P.L.; methodology, M.B.; validation, P.L. and T.D.; formal analysis, M.B., J.V., S.Z. and M.K.; investigation, M.B., J.V., S.Z. and M.K.; resources, M.B.; writing—original draft preparation, M.B.; visualization, M.B.; supervision, P.L. and T.D.; funding acquisition, P.L. All authors have read and agreed to the published version of the manuscript.

Funding

This research was funded by the project of MEYS (grant number CZ.02.1.01/0.0/0.0/17_049/0008399). This research was carried out with the support of projects of student grant competition (project number SP2023/022). Additionally, the infrastructure used was made available through project No. CZ.02.01.01/00/22_008/0004631, “Materials and Technologies for Sustainable Development”, funded by the European Union and the state budget of the Czech Republic within the framework of the Jan Amos Komensky Operational Program.

Data Availability Statement

Data is contained within the article.

Conflicts of Interest

The authors declare no conflicts of interest.

References

  1. Mansour, M. Develop a strategic forecast of silica sand based on supply chain decomposition. Int. J. Eng. 2015, 9, 9–27. [Google Scholar]
  2. Orr, I.; Krumenacher, M. Environmental impacts of industrial silica sand (frac sand) mining. Heartl. Policy Study 2015, 137, 1–37. [Google Scholar]
  3. Chukwu, P.; Maduabum, A. Silica sand: The architecture material of the 21st century. Int. J. Innov. Sci. Res. Technol. 2020, 5, 705–709. [Google Scholar]
  4. Kerai, J.V.; Vaniya, S.R. Use of Silica Sand as Fine Material in Concrete. Int. J. Sci. Res. Dev. 2015, 3, 745–751. [Google Scholar]
  5. Chaudhary, J.L.; Harison, A.; Srivastava, V. Use of silica sand as cement replacement in ppc concrete. Int. J. Res. Eng. Technol. 2015, 4, 55–58. [Google Scholar]
  6. Malathy, R.; Sentilkumar, S.R.R.; Prakash, A.R.; Das, B.B.; Chung, I.M.; Kim, S.H.; Prabakaran, M. Use of Industrial Silica Sand as a Fine Aggregate in Concrete—An Explorative Study. Buildings 2022, 12, 1273. [Google Scholar] [CrossRef]
  7. Wang, Y.; Chung, D.D.L. Effects of sand and silica fume on the vibration damping behavior of cement. Cem. Concr. Res. 1998, 28, 1353–1356. [Google Scholar] [CrossRef]
  8. Tayeh, B.A.; Akeed, M.H.; Qaidi, S.; Bakar, B.A. Influence of sand grain size distribution and supplementary cementitious materials on the compressive strength of ultrahigh-performance concrete. Case Stud. Constr. Mater. 2022, 17, e01495. [Google Scholar] [CrossRef]
  9. Nakayenga, J.; Cikmit, A.A.; Tsuchida, T.; Hata, T. Influence of stone powder content and particle size on the strength of cement-treated clay. Constr. Build. Mater. 2021, 305, 124710. [Google Scholar] [CrossRef]
  10. Heeschen, K.U.; Schicks, J.M.; Oeltzschner, G. The promoting effect of natural sand on methane hydrate formation: Grain sizes and mineral composition. Fuel 2016, 181, 139–147. [Google Scholar] [CrossRef]
  11. Bašistová, M.; Radkovský, F.; Kroupová, I.; Lichý, P. Dilatation of New Progressive Hybrid Sand and Its Effect on Surface Structure, Roughness, and Veining Creation within Grey Cast Iron. Materials 2023, 16, 2004. [Google Scholar] [CrossRef] [PubMed]
  12. Zhang, M.; Zhu, X.; Shi, J.; Liu, B.; He, Z.; Liang, C. Utilization of desert sand in the production of sustainable cement-based materials: A critical review. Constr. Build. Mater. 2022, 327, 127014. [Google Scholar] [CrossRef]
  13. Al-Aghbari, M.Y.; Dutta, R.K. Suitability of desert sand cement mixes for base courses in highway pavements. Electron. J. Geotech. Eng. 2005, 10, 1–17. [Google Scholar]
  14. Ahmad, J.; Zhou, Z.; Martínez-García, R.; Vatin, N.I.; de-Prado-Gil, J.; El-Shorbagy, M.A. Waste foundry sand in concrete production instead of natural river sand: A review. Materials 2022, 15, 2365. [Google Scholar] [CrossRef] [PubMed]
  15. Bhardwaj, B.; Kumar, P. Waste foundry sand in concrete: A review. Constr. Build. Mater. 2017, 156, 661–674. [Google Scholar] [CrossRef]
  16. Bostanci, C.; Limbachiya, M.; Kew, H. Portland-composite and composite cement concretes made with coarse recycled and recycled glass sand aggregates: Engineering and durability properties. Constr. Build. Mater. 2016, 128, 324–340. [Google Scholar] [CrossRef]
  17. Guney, Y.; Aydilek, A.H.; Demirkan, M.M. Geoenvironmental behavior of foundry sand amended mixtures for highway subbases. Waste Manag. 2006, 26, 932–945. [Google Scholar] [CrossRef]
  18. Ansari, W.S.; Chang, J. Influence of fine cement sand paste in preparation of cementitious materials. Constr. Build. Mater. 2020, 230, 116928. [Google Scholar] [CrossRef]
  19. Katzer, J. Median diameter as a grading characteristic for fine aggregate cement composite designing. Constr. Build. Mater. 2012, 35, 884–887. [Google Scholar] [CrossRef]
  20. Al-Harthy, A.S.; Halim, M.A.; Taha, R.; Al-Jabri, K.S. The properties of concrete made with fine dune sand. Constr. Build. Mater. 2017, 21, 1803–1808. [Google Scholar] [CrossRef]
  21. Ma, Q.; Guo, R.; Zhao, Z.; Lin, Z.; He, K. Mechanical properties of concrete at high temperature—A review. Constr. Build. Mater. 2015, 93, 371–383. [Google Scholar] [CrossRef]
  22. Xiao, J.; König, G. Study on concrete at high temperature in China—An overview. Fire Saf. J. 2004, 39, 89–103. [Google Scholar] [CrossRef]
  23. Schneider, U. Concrete at high temperatures—A general review. Fire Saf. J. 1988, 13, 55–68. [Google Scholar] [CrossRef]
  24. Song, R.; Wang, Y.; Ishutov, S.; Zambrano-Narvaez, G.; Hodder, K.J.; Chalaturnyk, R.J.; Sun, S.; Liu, J.; Gamage, R.P. A comprehensive experimental study on mechanical behavior, microstructure and transport properties of 3D-printed rock analogs. Rock Mech. Rock Eng. 2020, 53, 5745–5765. [Google Scholar] [CrossRef]
  25. Hodder, J.; Nychka, J.A. Silane treatment of 3D-printed sandstone models for improved spontaneous imbibition of water. Transp. Porous Media 2019, 129, 583–598. [Google Scholar] [CrossRef]
  26. Song, R.; Wu, M.; Wang, Y.; Liu, J.; Yang, C. In-situ X-CT scanning and numerical modeling on the mechanical behavior of the 3D printing rock. Powder Technol. 2023, 416, 118240. [Google Scholar] [CrossRef]
  27. Zihms, S.G.; Switzer, C.; Irvine, J.; Karstunen, M. Effects of high temperature processes on physical properties of silica sand. Eng. Geol. 2013, 164, 139–145. [Google Scholar] [CrossRef]
  28. Svidró, J.; Svidró, J.T.; Diószegi, A. The role of purity level in foundry silica sand on its thermal properties. J. Phys. Conf. Ser. 2020, 1527, 012039. [Google Scholar] [CrossRef]
  29. Chao, C.H.; Lu, H.Y. Stress-Induced β→α-Cristobalite Phase Transformation in (Na2O + Al2O3)-codoped Silica. Mater. Sci. Eng. A 2002, 328, 267–276. [Google Scholar] [CrossRef]
  30. Svidró, J.; Diószegi, A.; Svidró, J.T. The origin of thermal expansion differences in various size fractions of silica sand. Int. J. Cast. Met. Res. 2020, 33, 242–249. [Google Scholar] [CrossRef]
  31. Hrubovčáková, M.; Vasková, I.; Benková, M.; Conev, M. Opening Material as the Possibility of Elimination Veining in Foundries. Arch. Foundry Eng. 2016, 16, 157–161. [Google Scholar] [CrossRef]
  32. Radkovský, F.; Gawronová, M.; Merta, V.; Lichý, P.; Kroupová, I.; Nguyenová, I.; Kocich, R. Effect of the composition of Hybrid Sands on the change in thermal expansion. Materials 2022, 15, 6180. [Google Scholar] [CrossRef] [PubMed]
  33. Bašistová, M.; Lichý, P. Differences in characteristic Properties of Silica sands from neighbouring deposits. Adv. Sci. Technol. 2023, 135, 101–108. [Google Scholar] [CrossRef]
  34. Ndon, U.J.; Bergeson, K.L. Thermal expansion of concretes: Case study in Iowa. J. Mater. Civ. Eng. 1995, 7, 246–251. [Google Scholar] [CrossRef]
  35. Aleem, S.A.E.; Heikal, M.; Morsi, W.M. Hydration characteristic, thermal expansion and microstructure of cement containing nano-silica. Constr. Build. Mater. 2014, 59, 151–160. [Google Scholar] [CrossRef]
  36. Liu, H.; Bu, Y.; Zhou, A.; Du, J.; Zhou, L.; Pang, X. Silica sand enhanced cement mortar for cementing steam injection well up to 380 °C. Constr. Build. Mater. 2021, 308, 125142. [Google Scholar] [CrossRef]
  37. De Souza, W.R.M.; Bouaanani, N.; Martinelli, A.E.; Bezerra, U.T. Numerical simulation of the thermomechanical behavior of cement sheath in wells subjected to steam injection. J. Pet. Sci. Eng. 2018, 167, 664–673. [Google Scholar] [CrossRef]
  38. Dai, T.; Liu, T.; Jiang, G.; Qu, B.; Zheng, S. Evaluation of Microstructural and Mechanical Properties of Silica-Enriched Oil Well Cement Pastes in Steam Injection Wells, Available at SSRN 4048736. Available online: https://papers.ssrn.com/sol3/papers.cfm?abstract_id=4048736 (accessed on 21 November 2023).
  39. Bamonte, P.; Gambarova, P. Properties of concrete subjected to extreme thermal conditions. J. Struct. Fire Eng. 2014, 5, 47–62. [Google Scholar] [CrossRef]
  40. Thiel, J. Thermal Expansion of Chemically Bonded Silica Sand; American Foundry Society: Schaumburg, IL, USA, 2011; pp. 1–10. [Google Scholar]
  41. Wang, H.; Lu, Y.; Ripplinger, K.; Detwiler, D.; Luo, A.A. A statistics-based cracking criterion of resin-bonded silica sand for casting process simulation. Metall. Mater. Trans. B. 2017, 48, 260–267. [Google Scholar] [CrossRef]
Figure 1. Illustrates the sequence of measurements in a schematic manner.
Buildings 14 00279 g001
Figure 2. Photos of sand samples taken by Keyence VHX 6000 (Keyence, Osaka, Japan), 200× magnification.
Buildings 14 00279 g002
Figure 3. SEM + EDX results for sand samples: (a) SH 35, (b) ST 54, and (c) GL 21.
Buildings 14 00279 g003
Figure 4. SEM + EDX results for sand samples: (d) BG 21, (e) BK 23, and (f) SE 22.
Buildings 14 00279 g004
Figure 5. Linear thermal expansion curves for all 6 tested sand samples.
Buildings 14 00279 g005
Figure 6. DTA results and the temperature of the beginning of the phase transformation of each tested sand sample.
Buildings 14 00279 g006
Table 1. Results from XRFS mineralogical analysis for 6 tested sands—major minerals and the results of loss on ignition test.
SampleSiO2Al2O3Fe2O3TiO2K2OZrO2CaOP2O5SO3LOI
(Mass%)(%)
SH 3591.023.190.99-3.750.010.440.05-0.09
Sx SH 350.0210.0160.013-0.0170.0010.0180.004-0.00016
ST 5499.150.500.100.130.040.020.02-0.020.02
Sx ST 540.0370.0120.0160.0080.0160.0040.001-0.0060.00034
GL 2198.880.490.140.300.040.040.030.010.020.04
Sx GL 210.0370.0210.0050.0080.0050.0050.0060.0060.0020.00010
BG 2197.800.780.230.830.080.150.04-0.020.07
Sx BG 210.0160.0070.0130.0330.0070.0160.002-0.0020.00003
BK 2394.122.540.690.231.600.060.190.060.020.18
Sx BK 230.0370.0100.0130.0060.0130.0020.0080.0020.0010.00004
SE 2291.463.520.790.153.15-0.290.060.040.22
Sx SE 220.0580.0230.0060.0040.013-0.0100.0020.0030.00014
Table 2. Results from XRFS mineralogical analysis for 6 tested sands—minor minerals.
SampleNa2OMgOMnORb2OSrOCl
(Mass%)
SH 350.250.120.050.020.020.010
Sx SH 350.0130.0020.0010.0010.0010.0006
ST 54
GL 21 0.004
Sx GL 21 0.0002
BG 21
BK 230.0030.0030.002 0.0003
Sx BK 23
SE 220.180.08 0.020.020.007
Sx SE 220.0030.002 0.0020.0020.0002
Table 3. Results of point EDX analysis of 6 tested sand samples.
SampleOMgAlSiKFe
(Mass%)
SH 3552.340.221.9443.971.320.73
Sx SH 355.550.011.023.300.930.30
ST 5451.96-1.5946.45--
Sx ST 540.95-1.021.50--
GL 2154.25-1.0644.69--
Sx GL 212.91-0.222.97--
BG 2154.72-1.0644.23--
Sx BG 212.12-0.072.05--
BK 2355.880.243.1138.960.341.46
Sx BK 232.750.020.072.250.070.38
SE 2257.810.363.7736.150.681.22
Sx SE 222.220.222.151.760.610.92
Table 4. Linear thermal expansion results at 1130 °C of 6 tested sand samples.
SH 35ST 54GL 21BG 21BK 23SE 22
dL/Lo (%)2.652.212.732.282.782.79
Β to α SiO2 (°C)576.5574.7576.3573.3579.0579.1
Disclaimer/Publisher’s Note: The statements, opinions and data contained in all publications are solely those of the individual author(s) and contributor(s) and not of MDPI and/or the editor(s). MDPI and/or the editor(s) disclaim responsibility for any injury to people or property resulting from any ideas, methods, instructions or products referred to in the content.

