

An Investigative Study for the Seismic Performance of Composite-Reinforced Masonry Wall with Prestressing Technology

Abstract
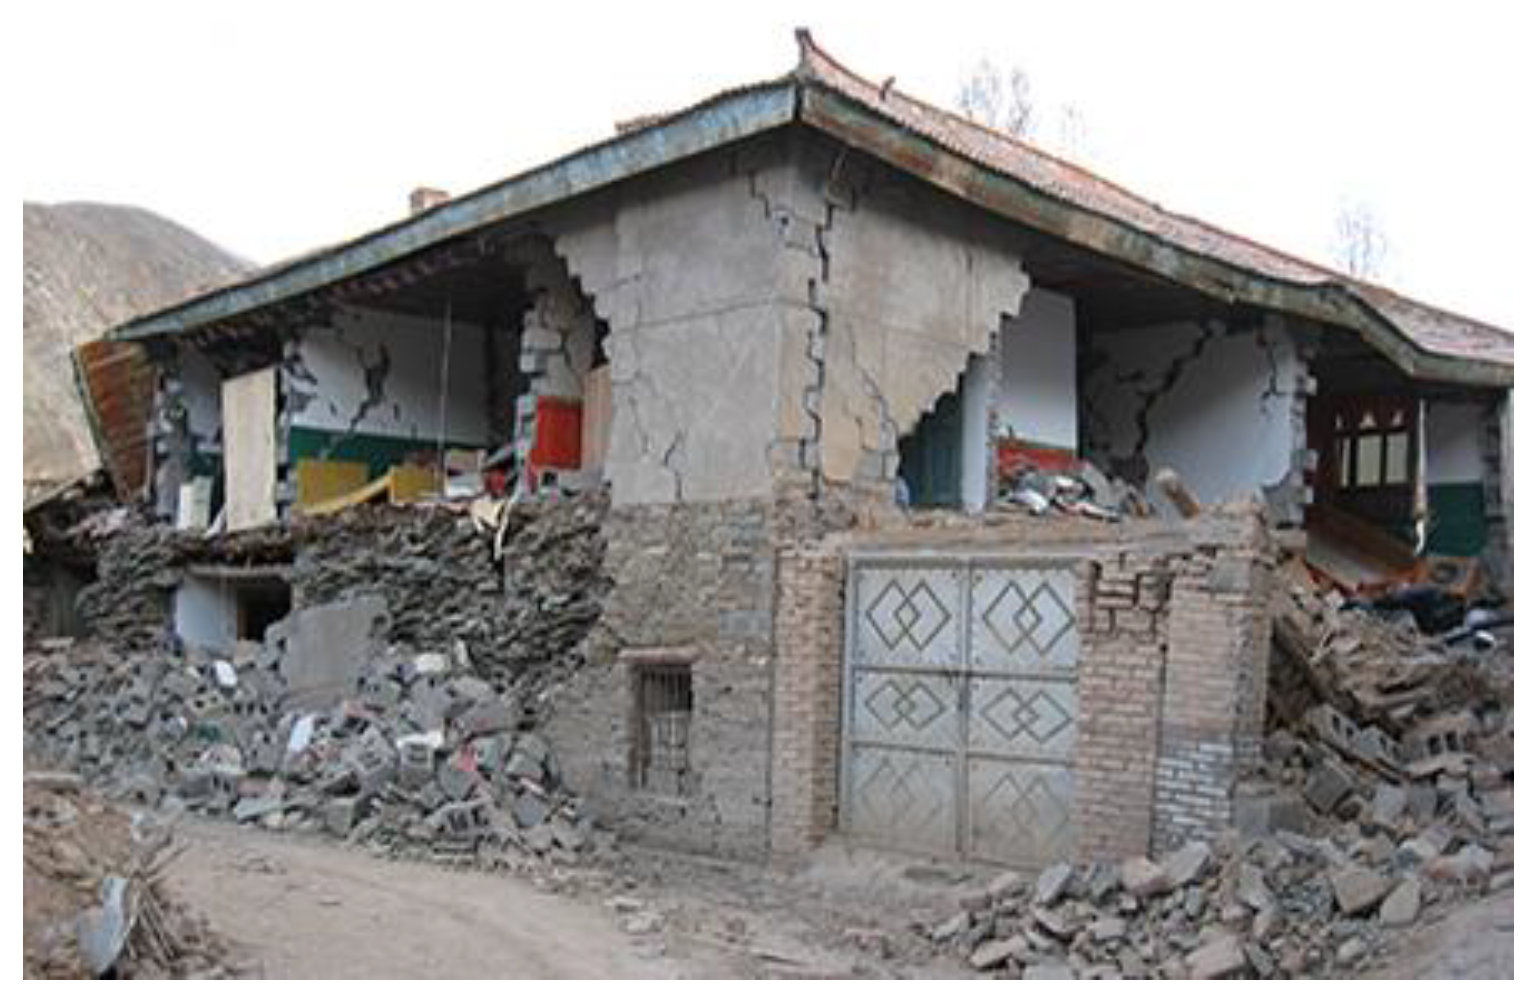
:1. Introduction
2. Experiment Program
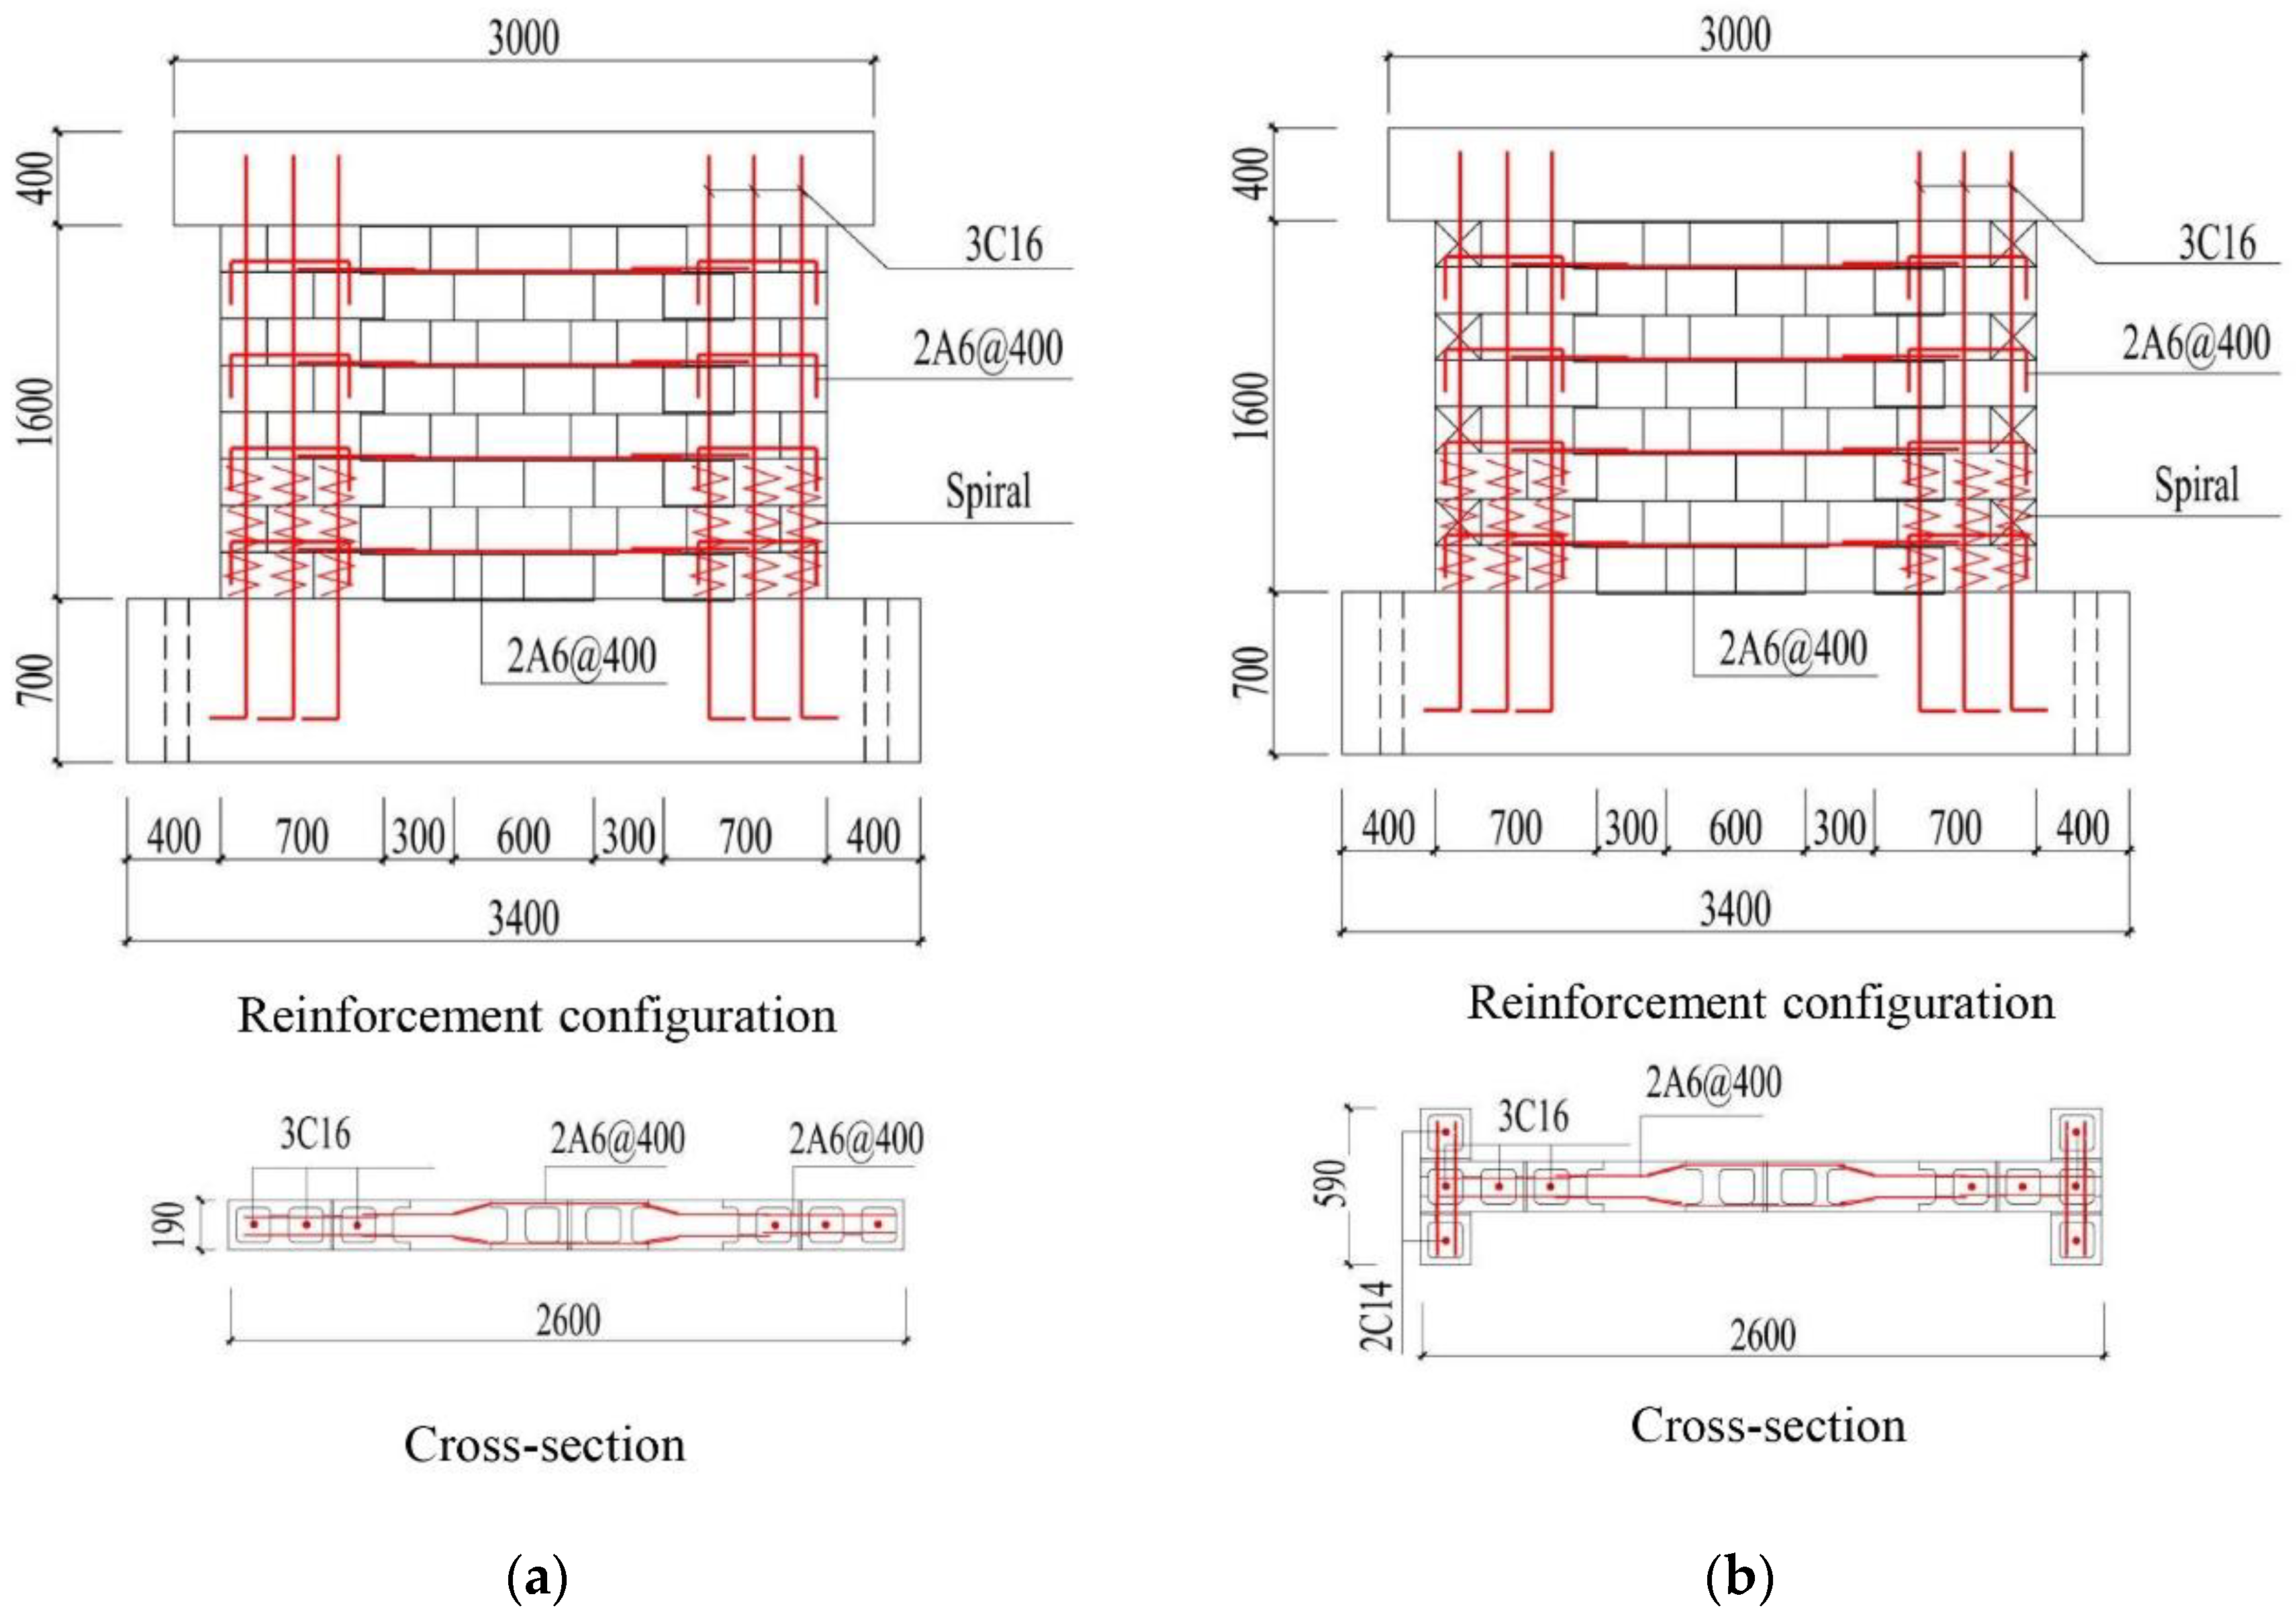
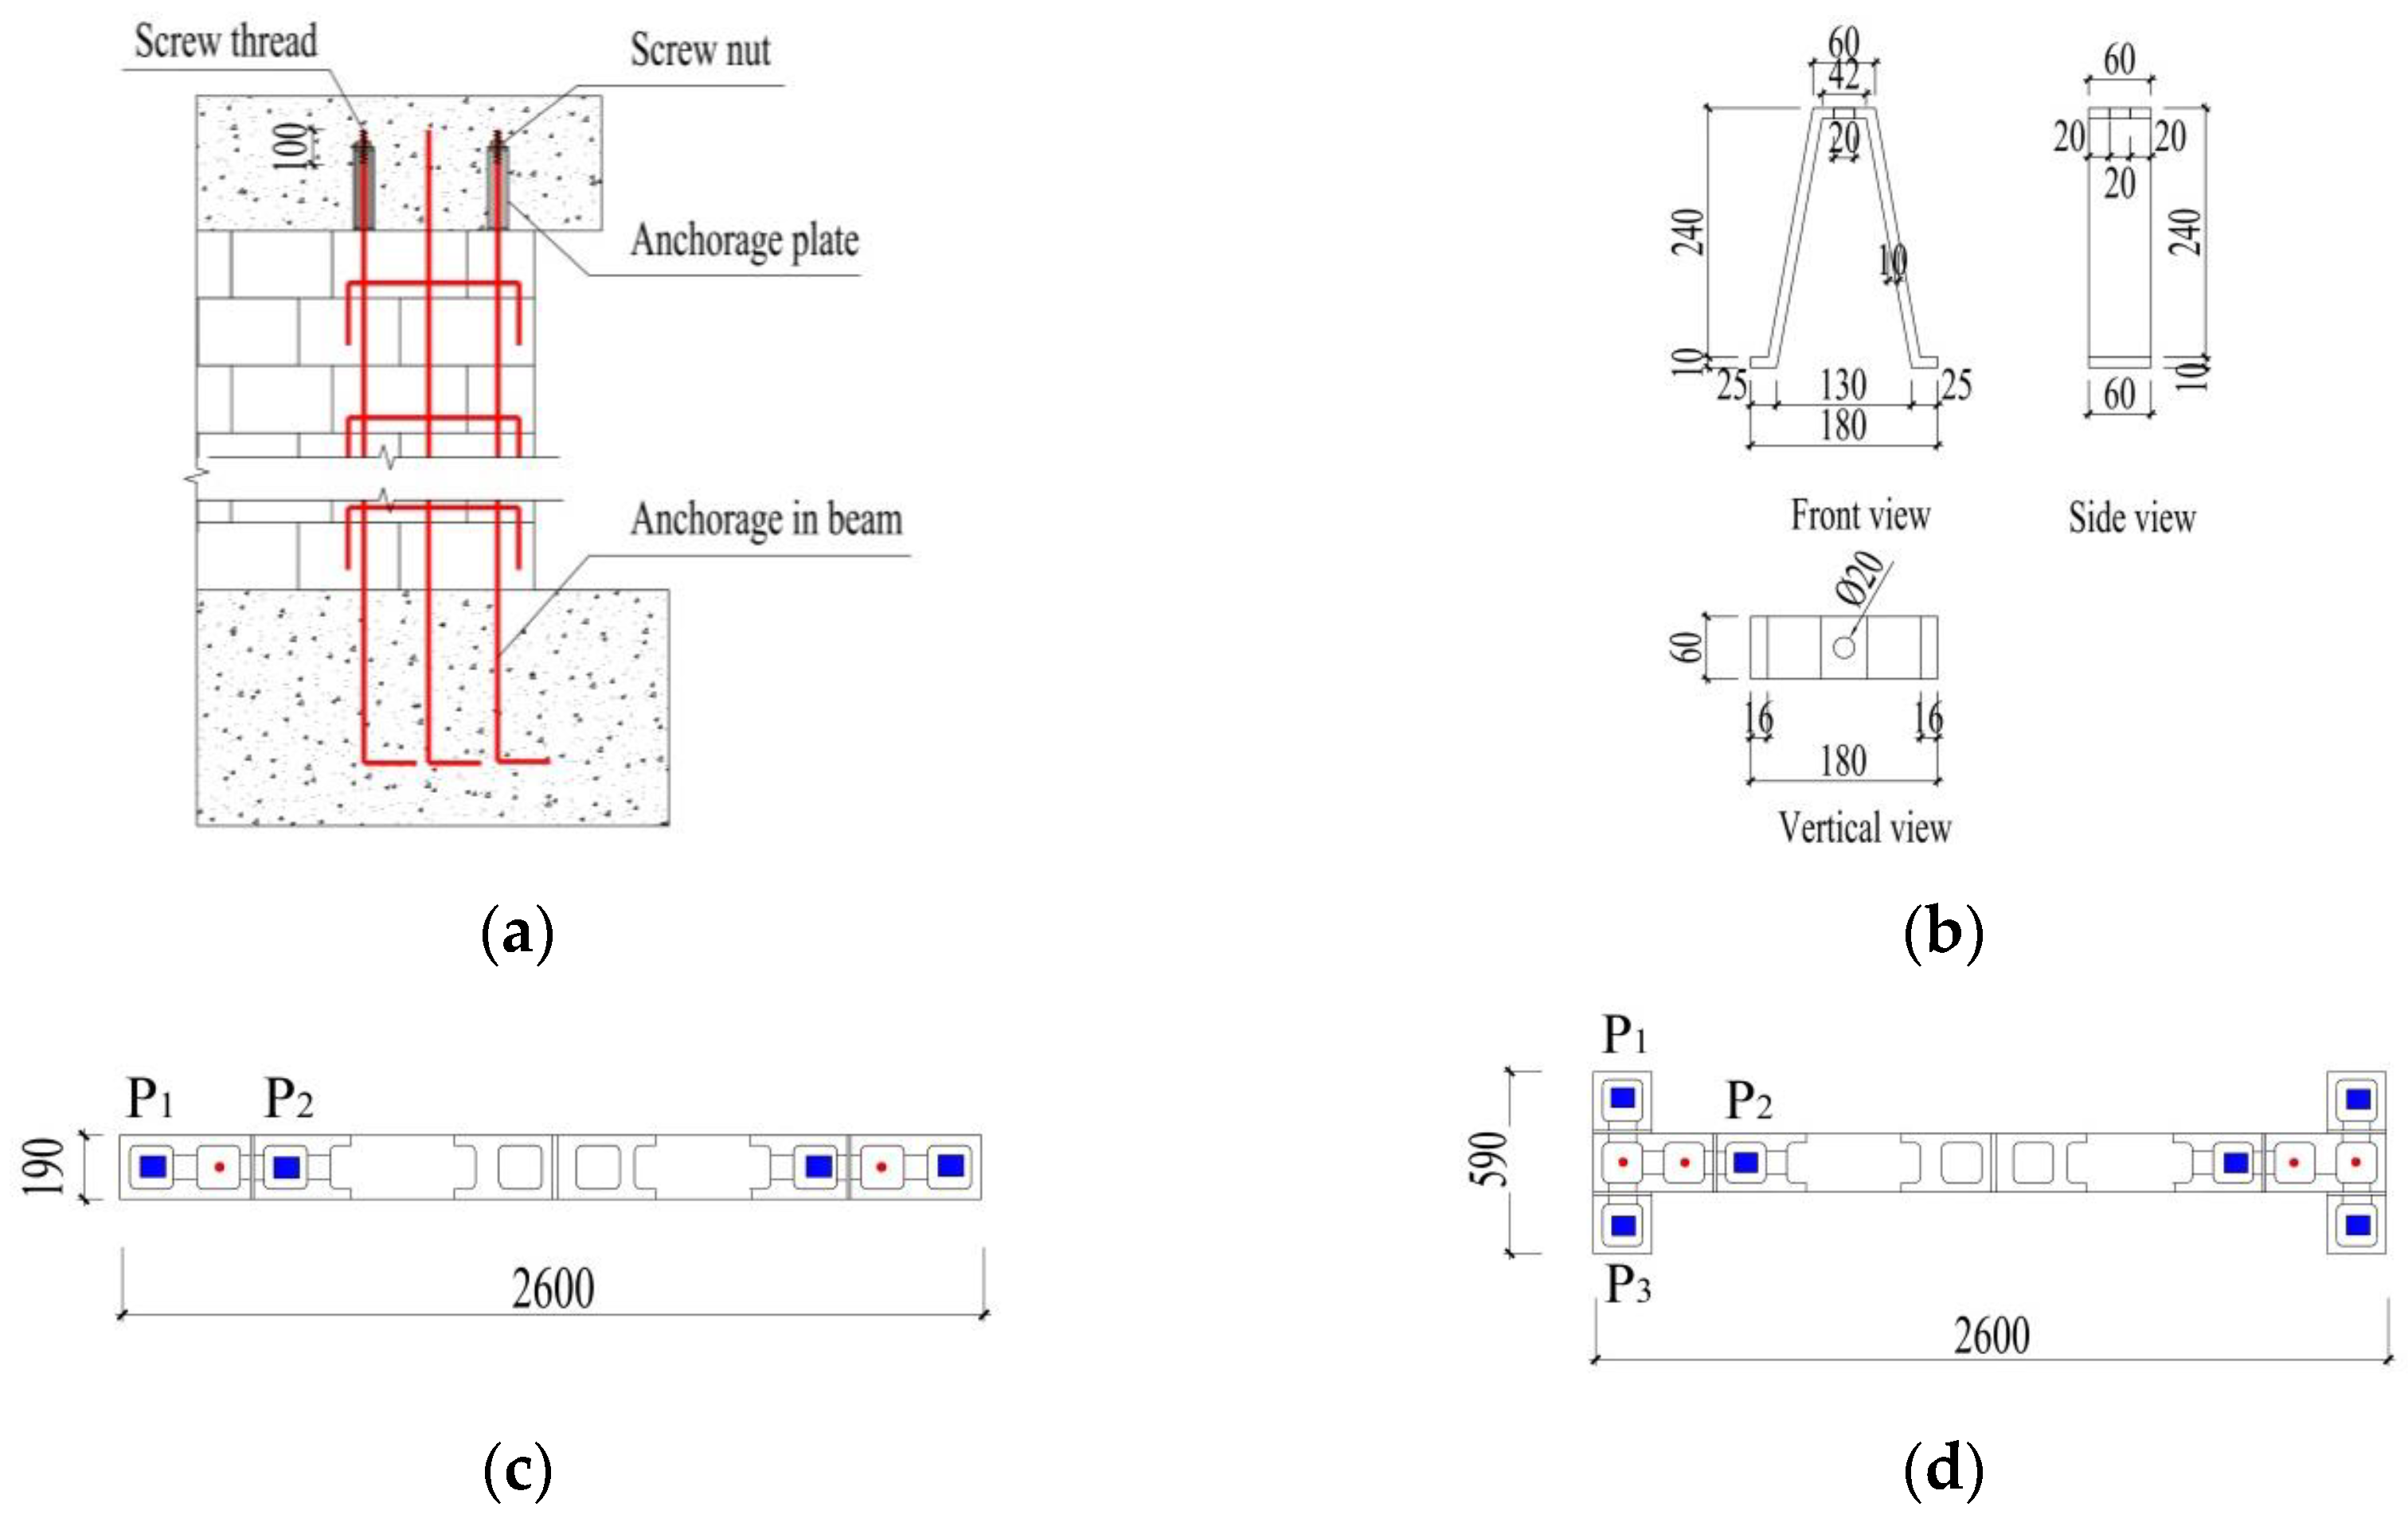
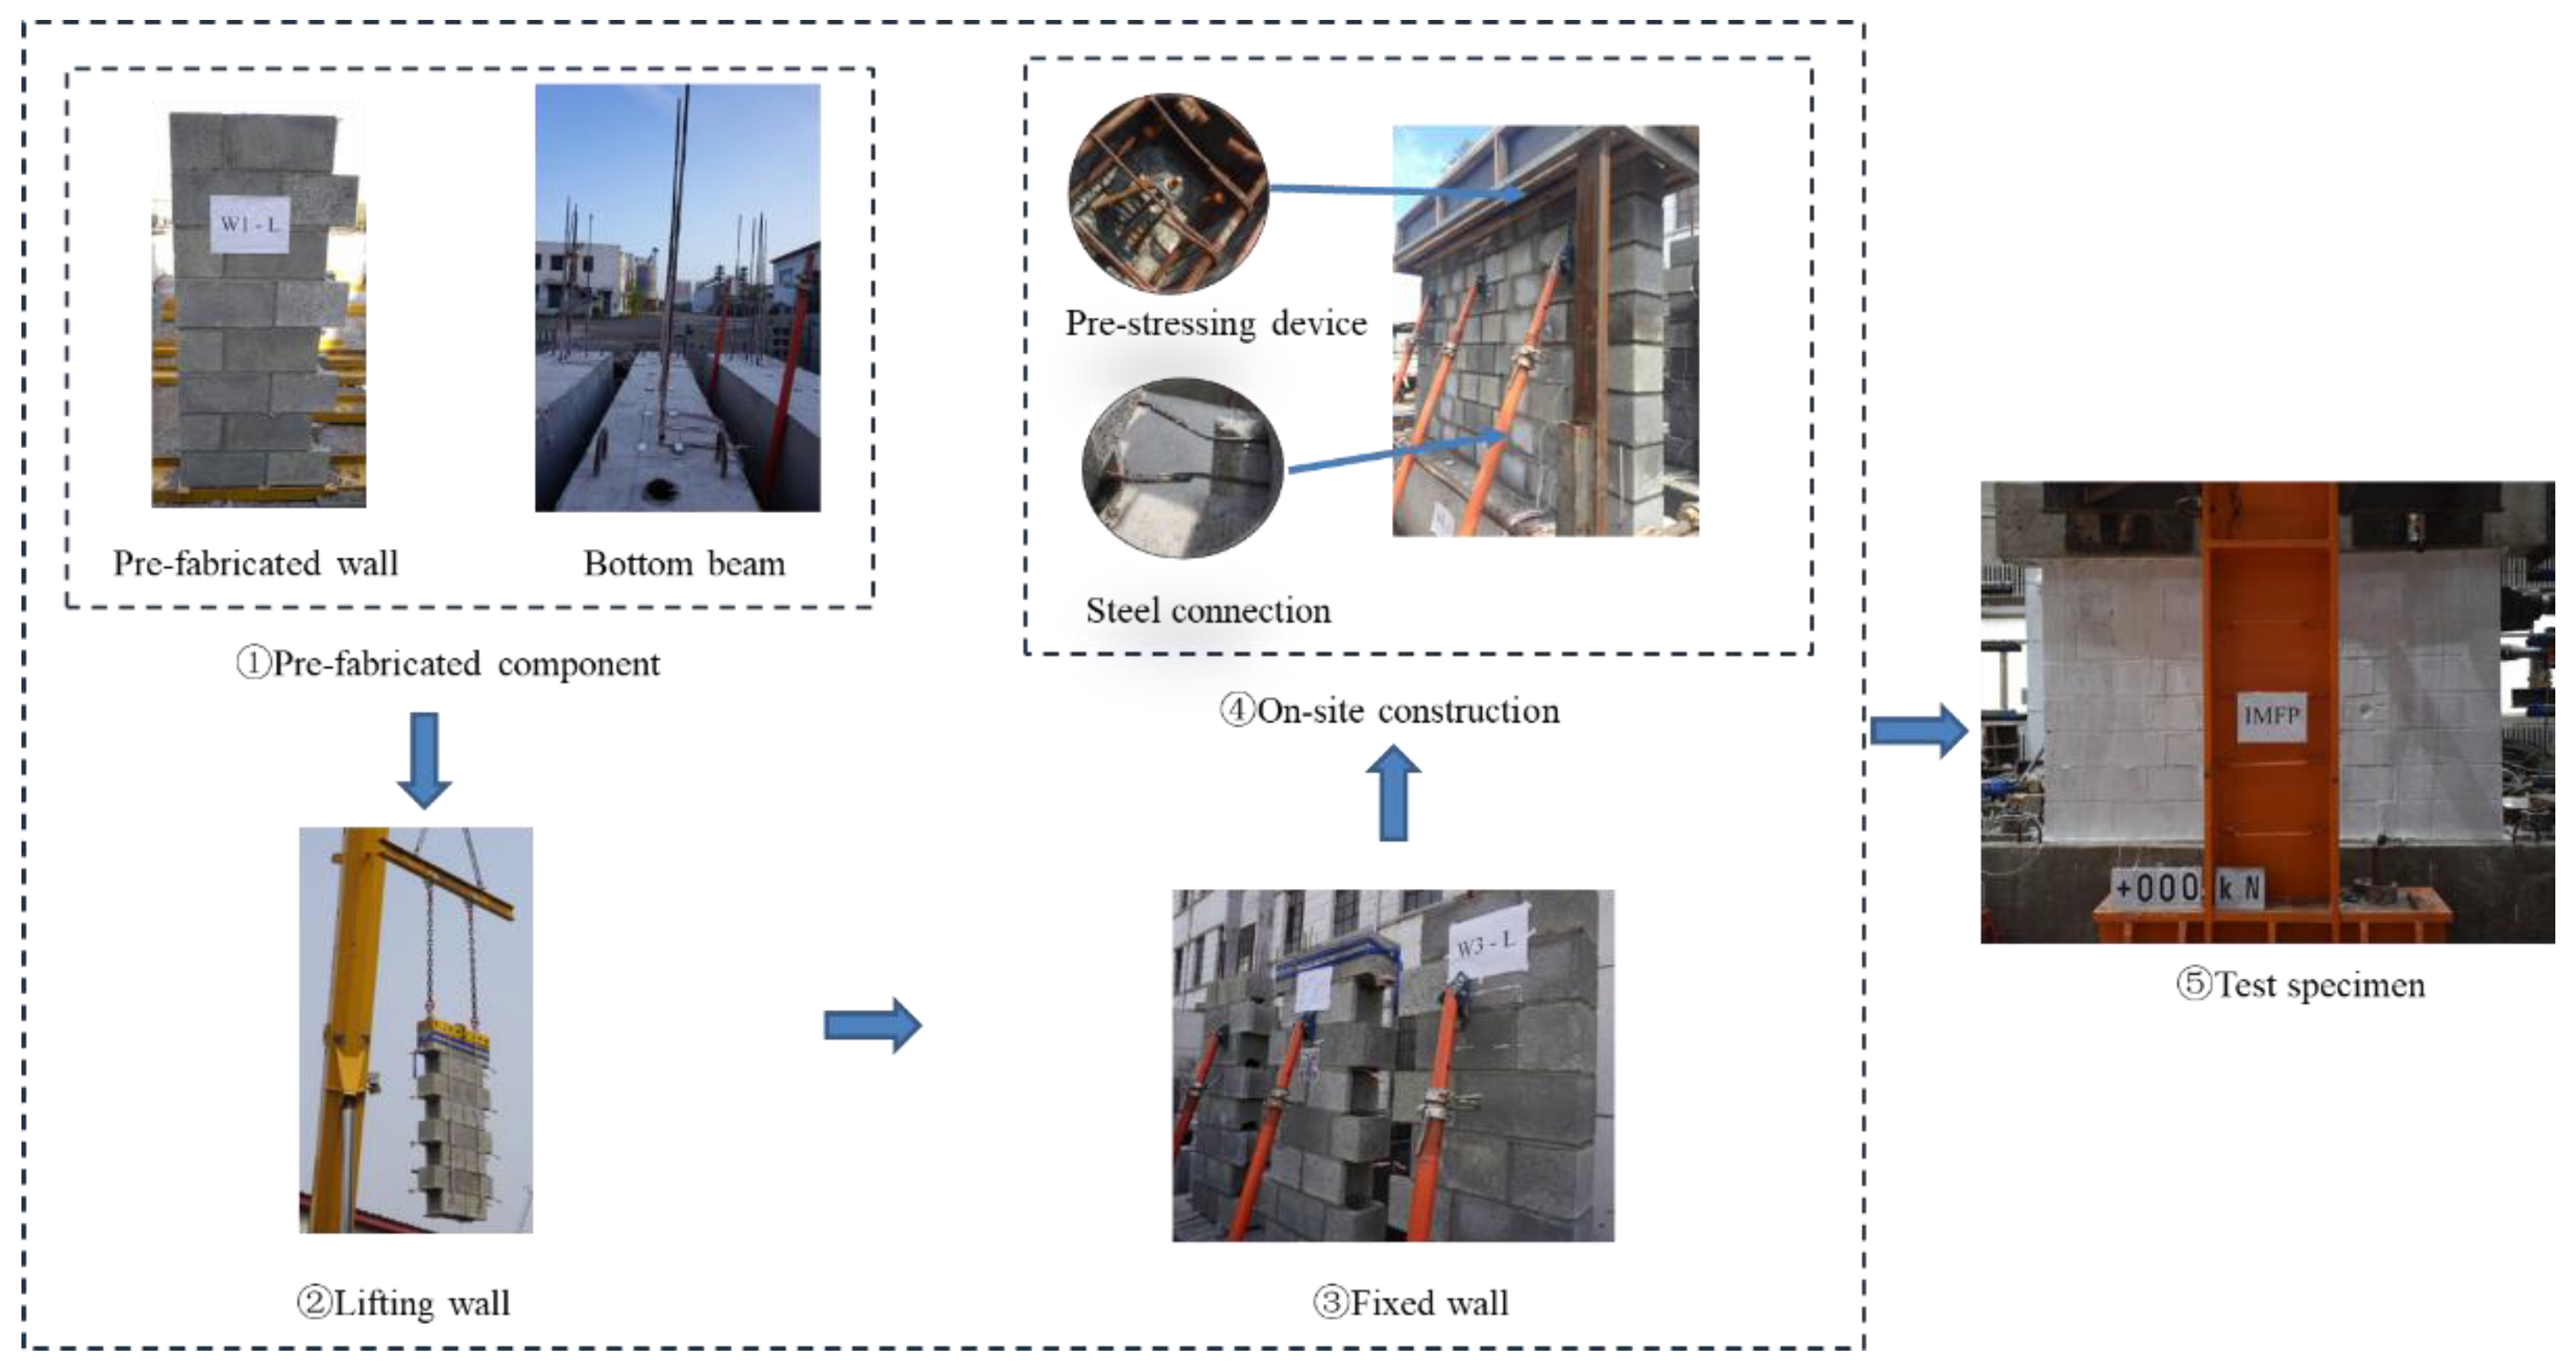
2.1. Test Specimens and Construction
2.2. Material Properties
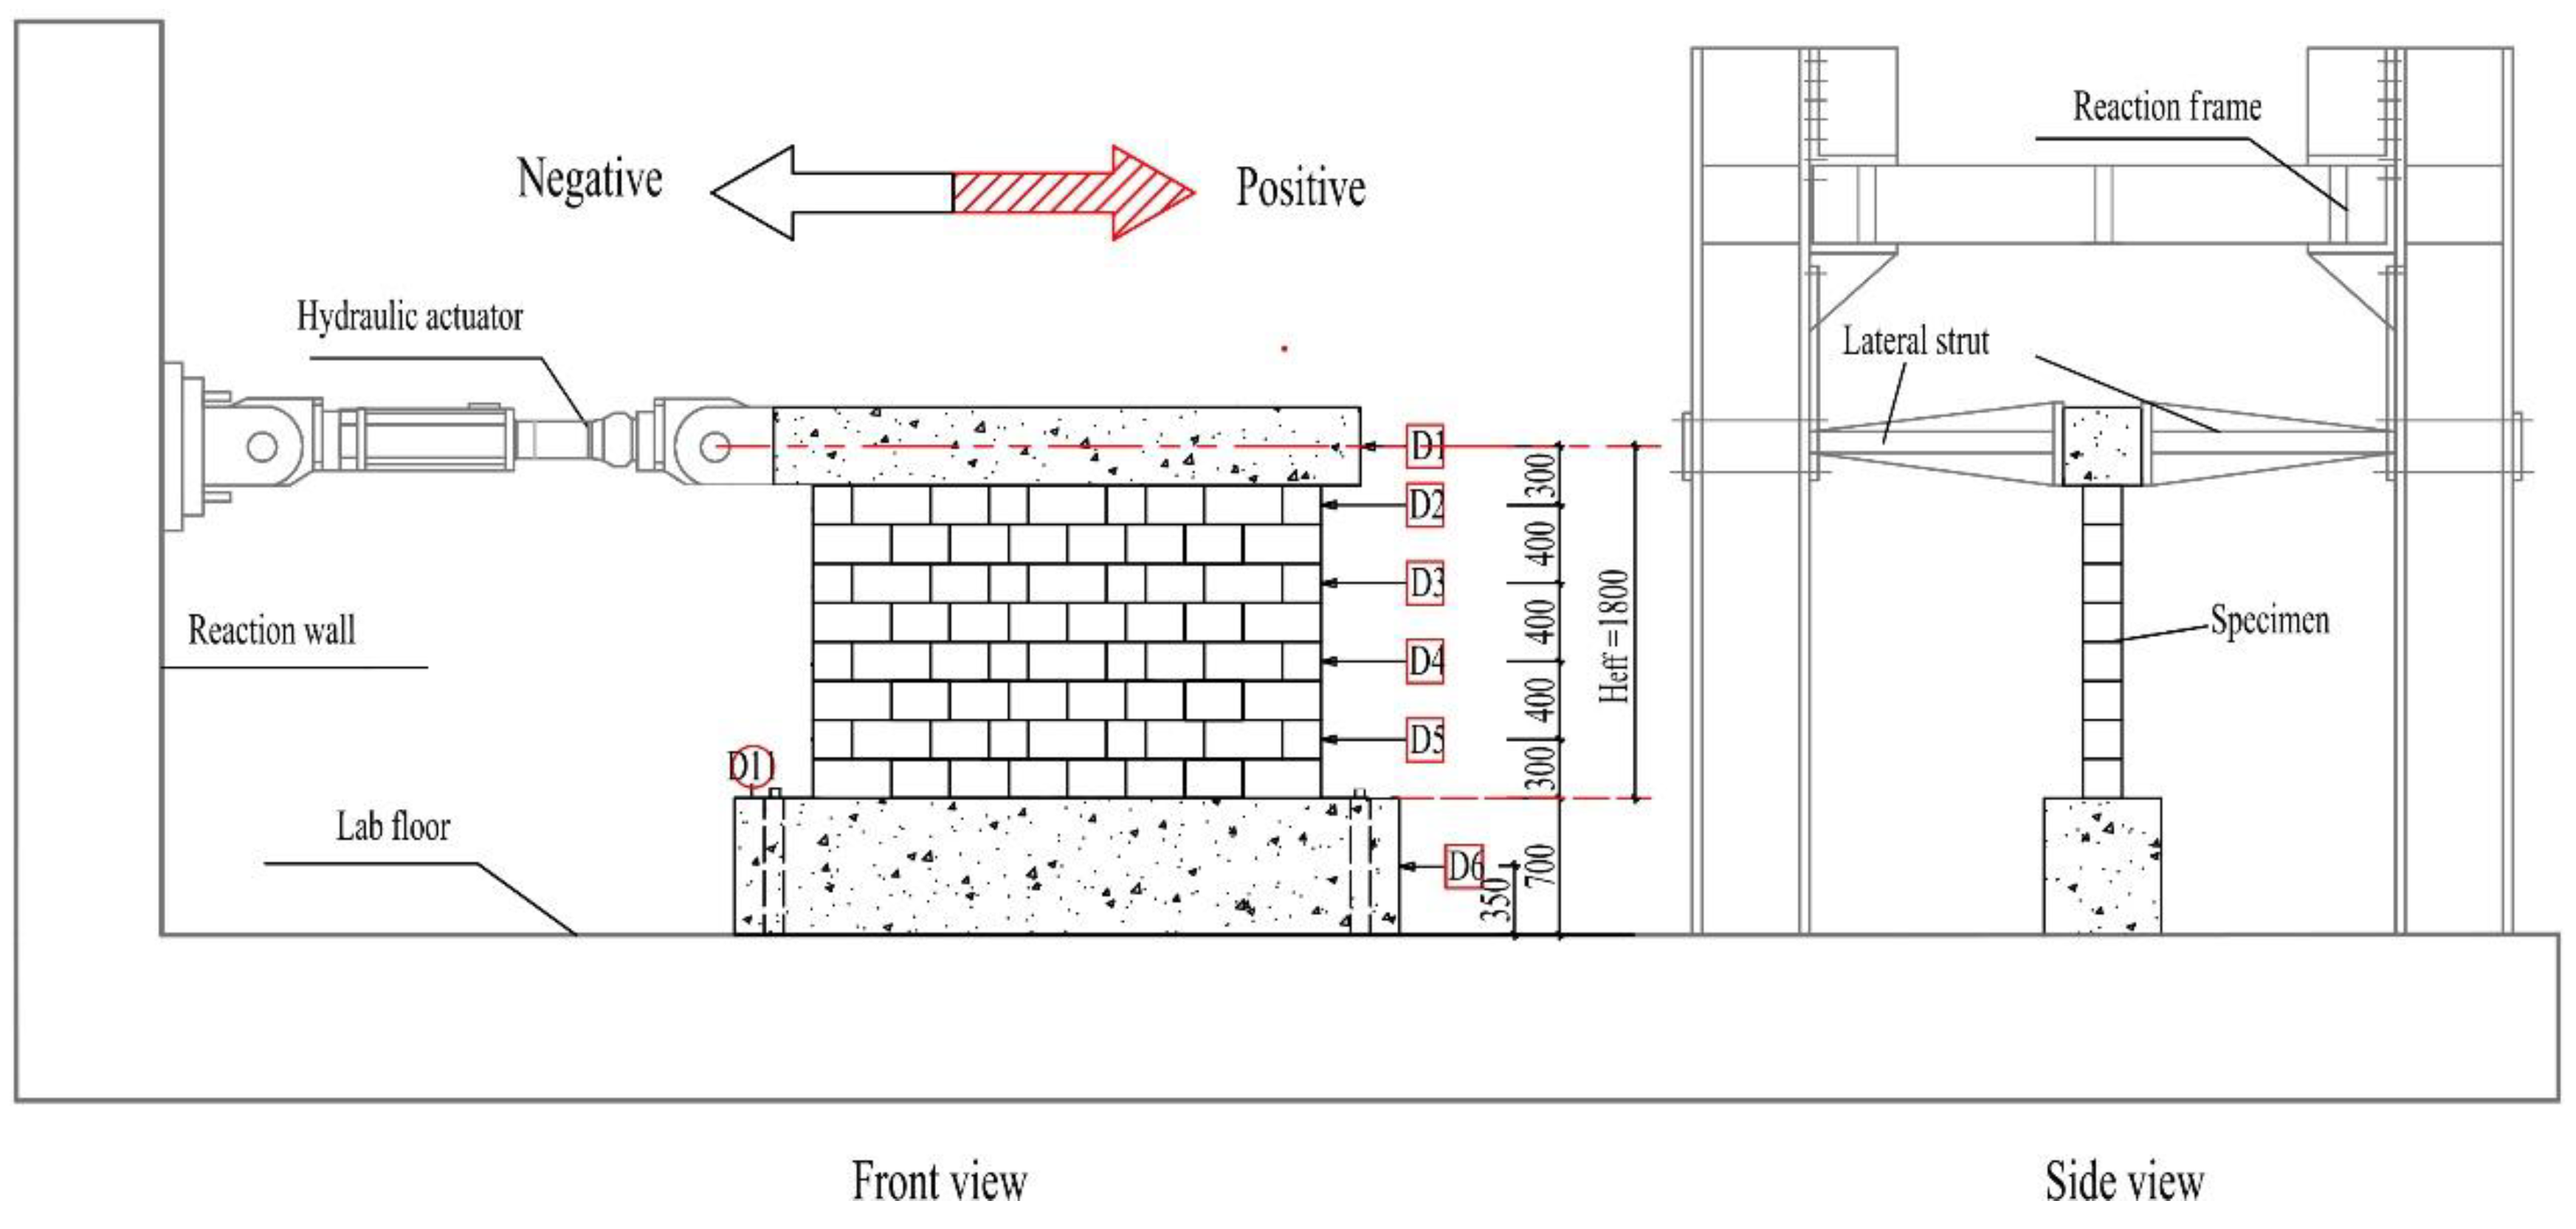
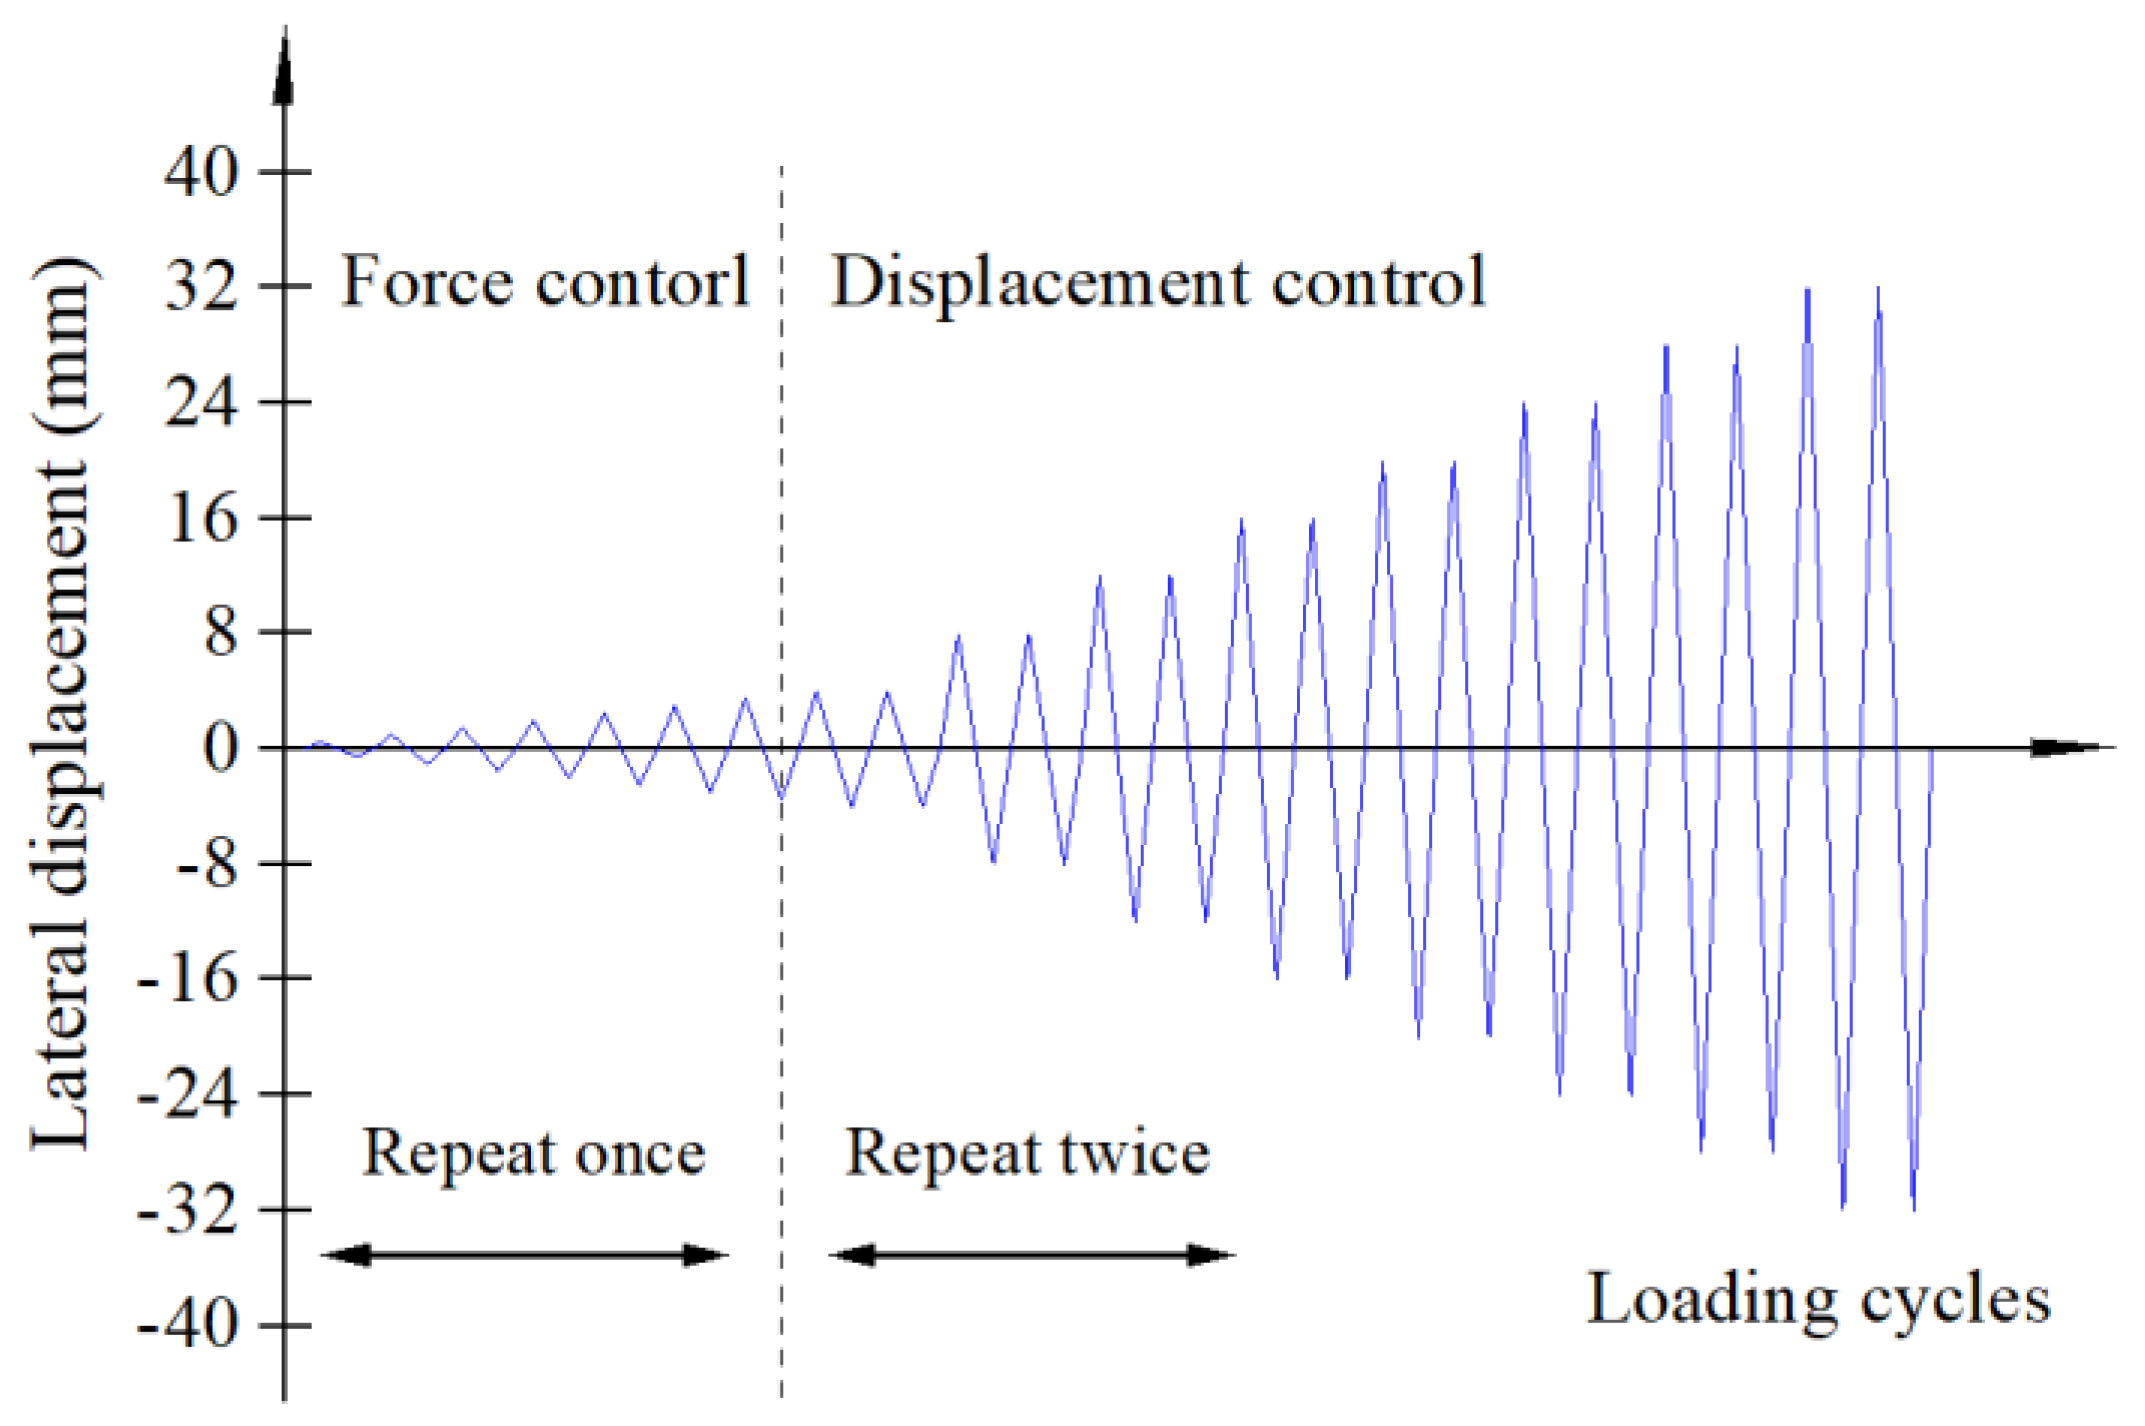
2.3. Test Setup and Measurements
3. Experimental Results
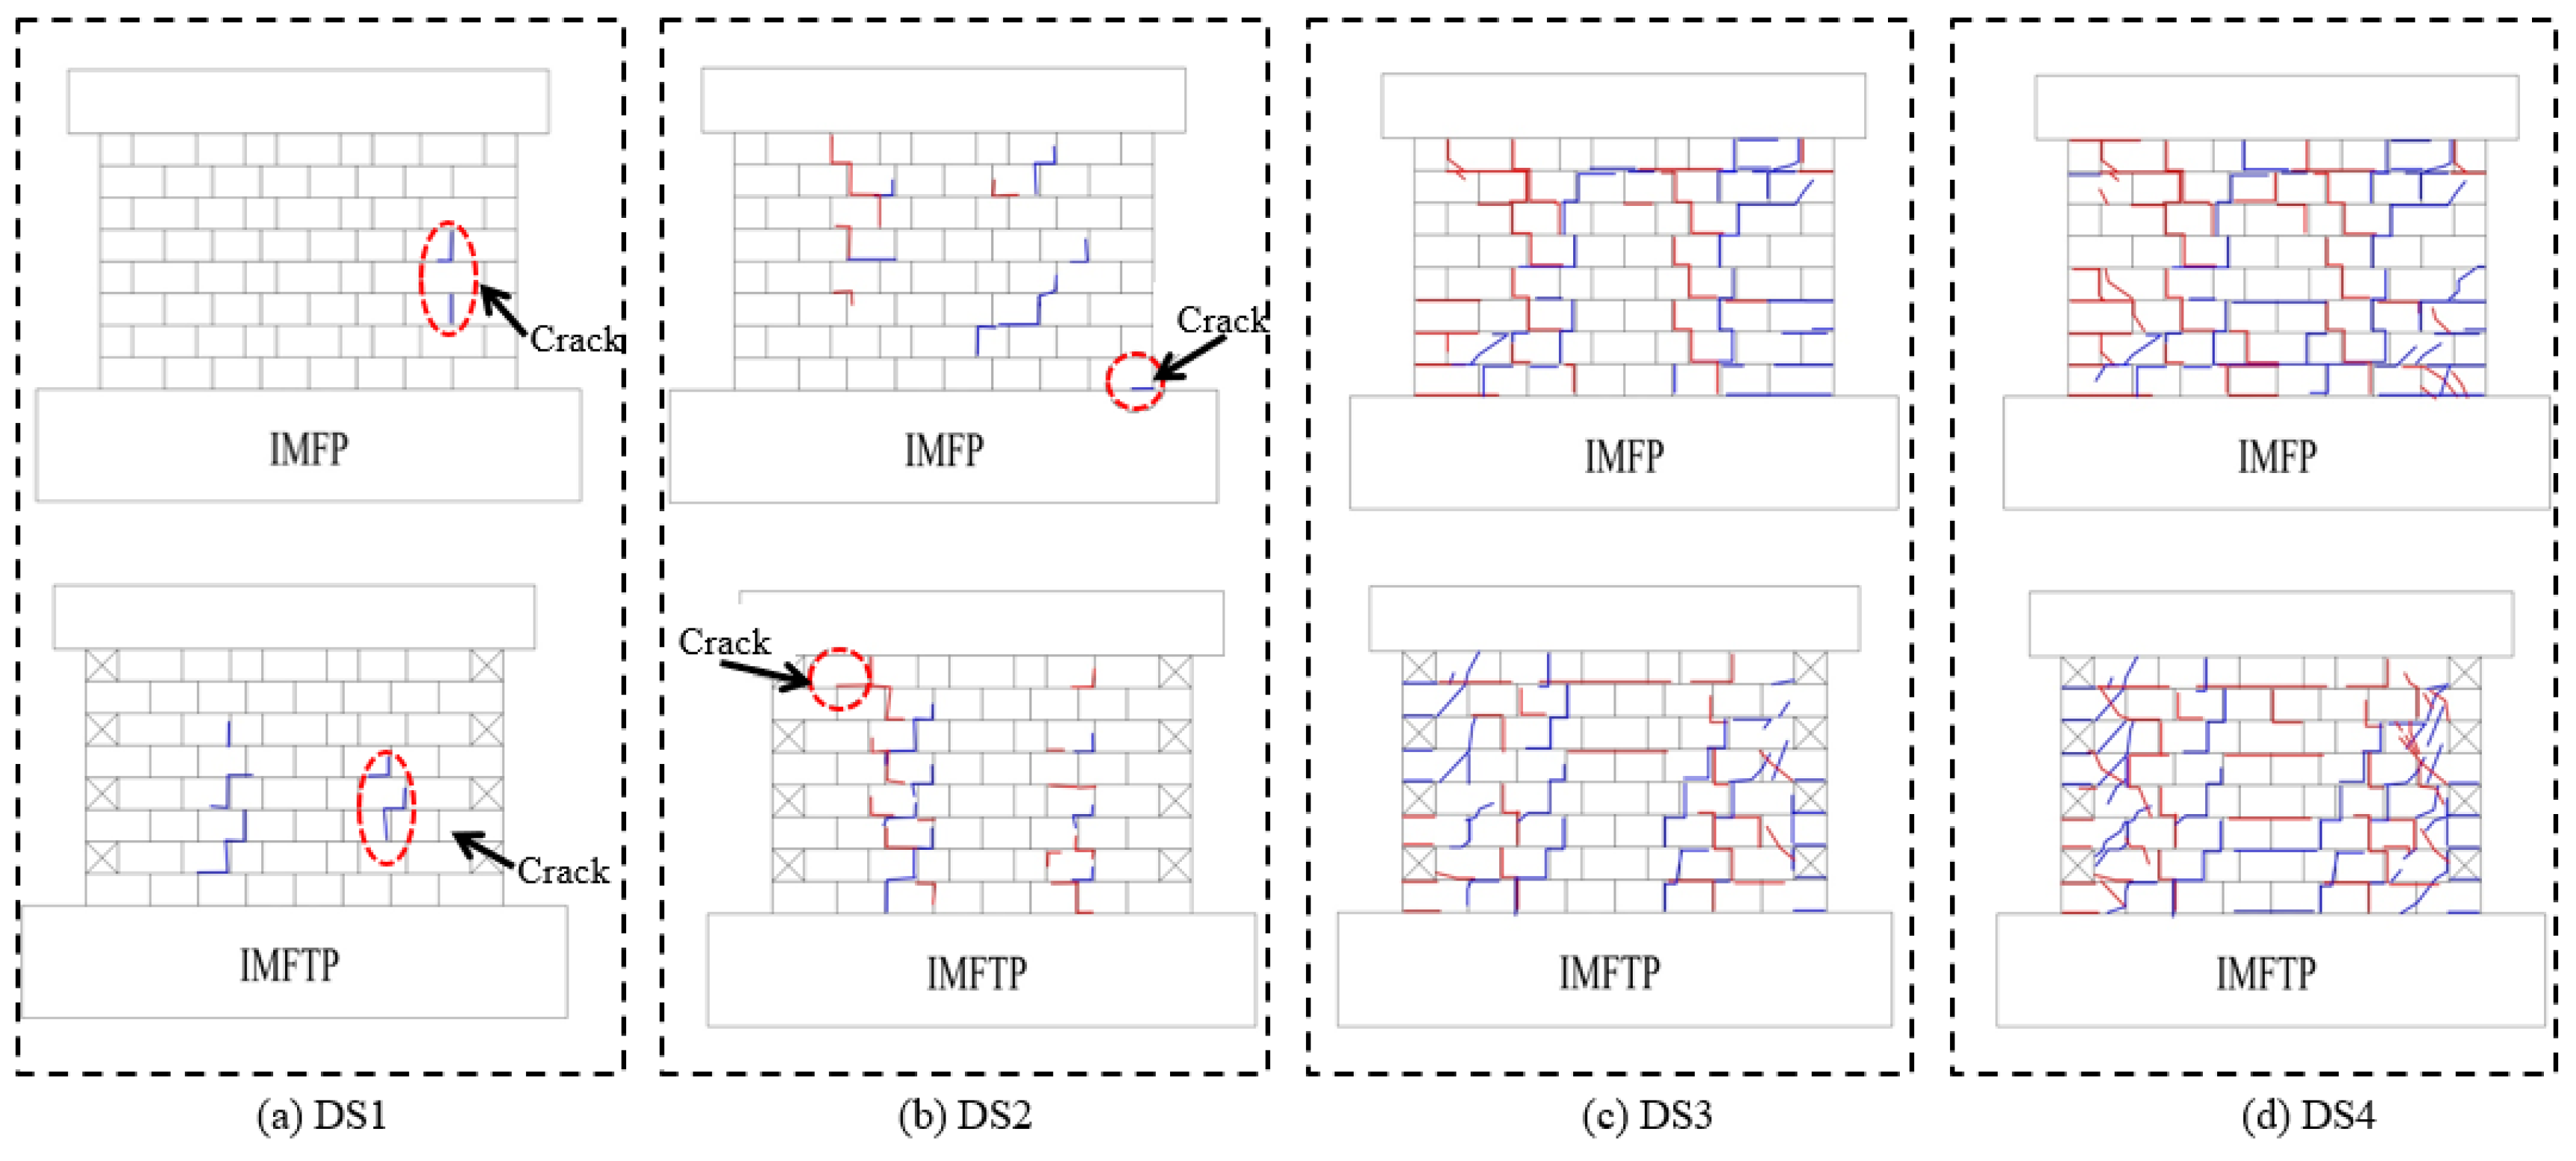
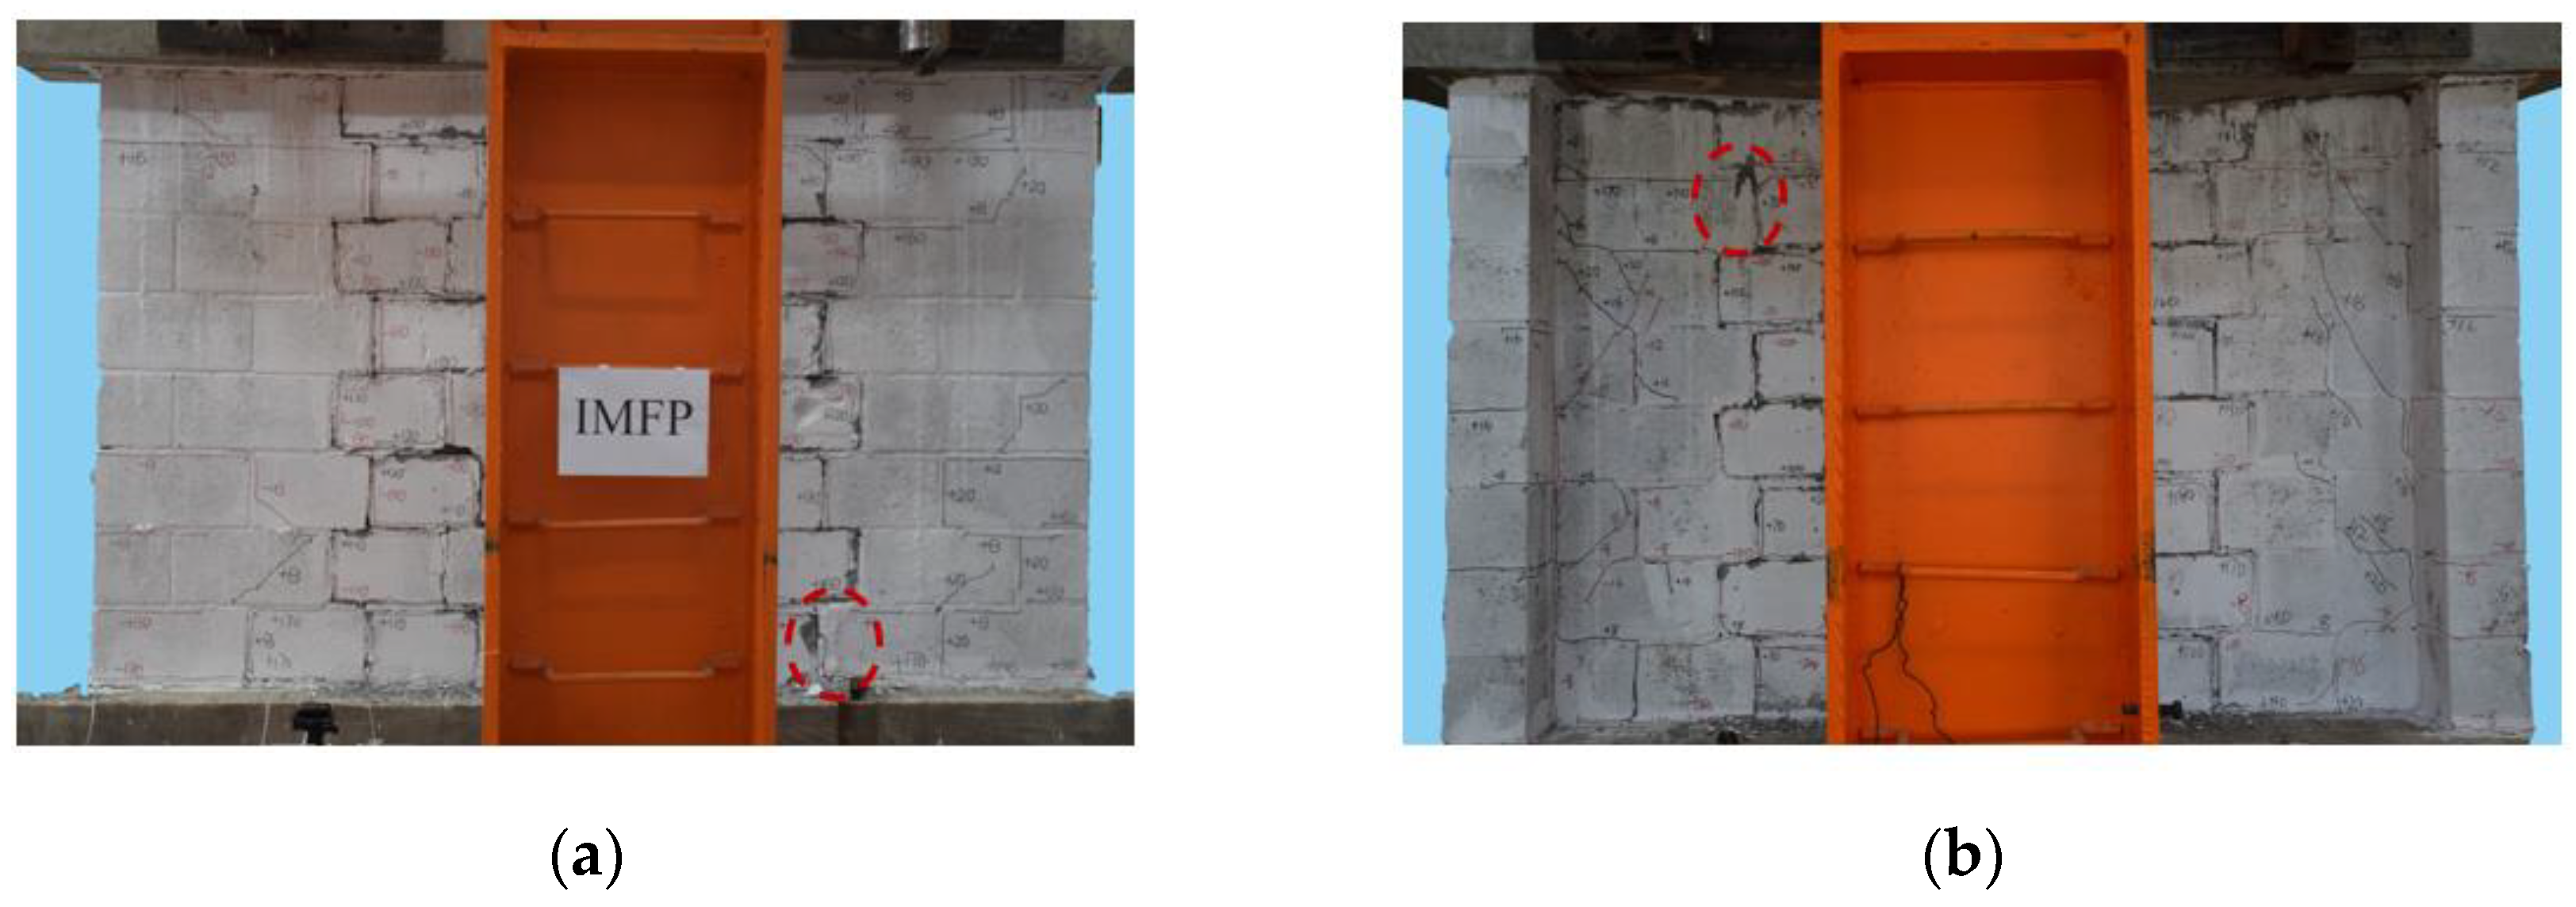
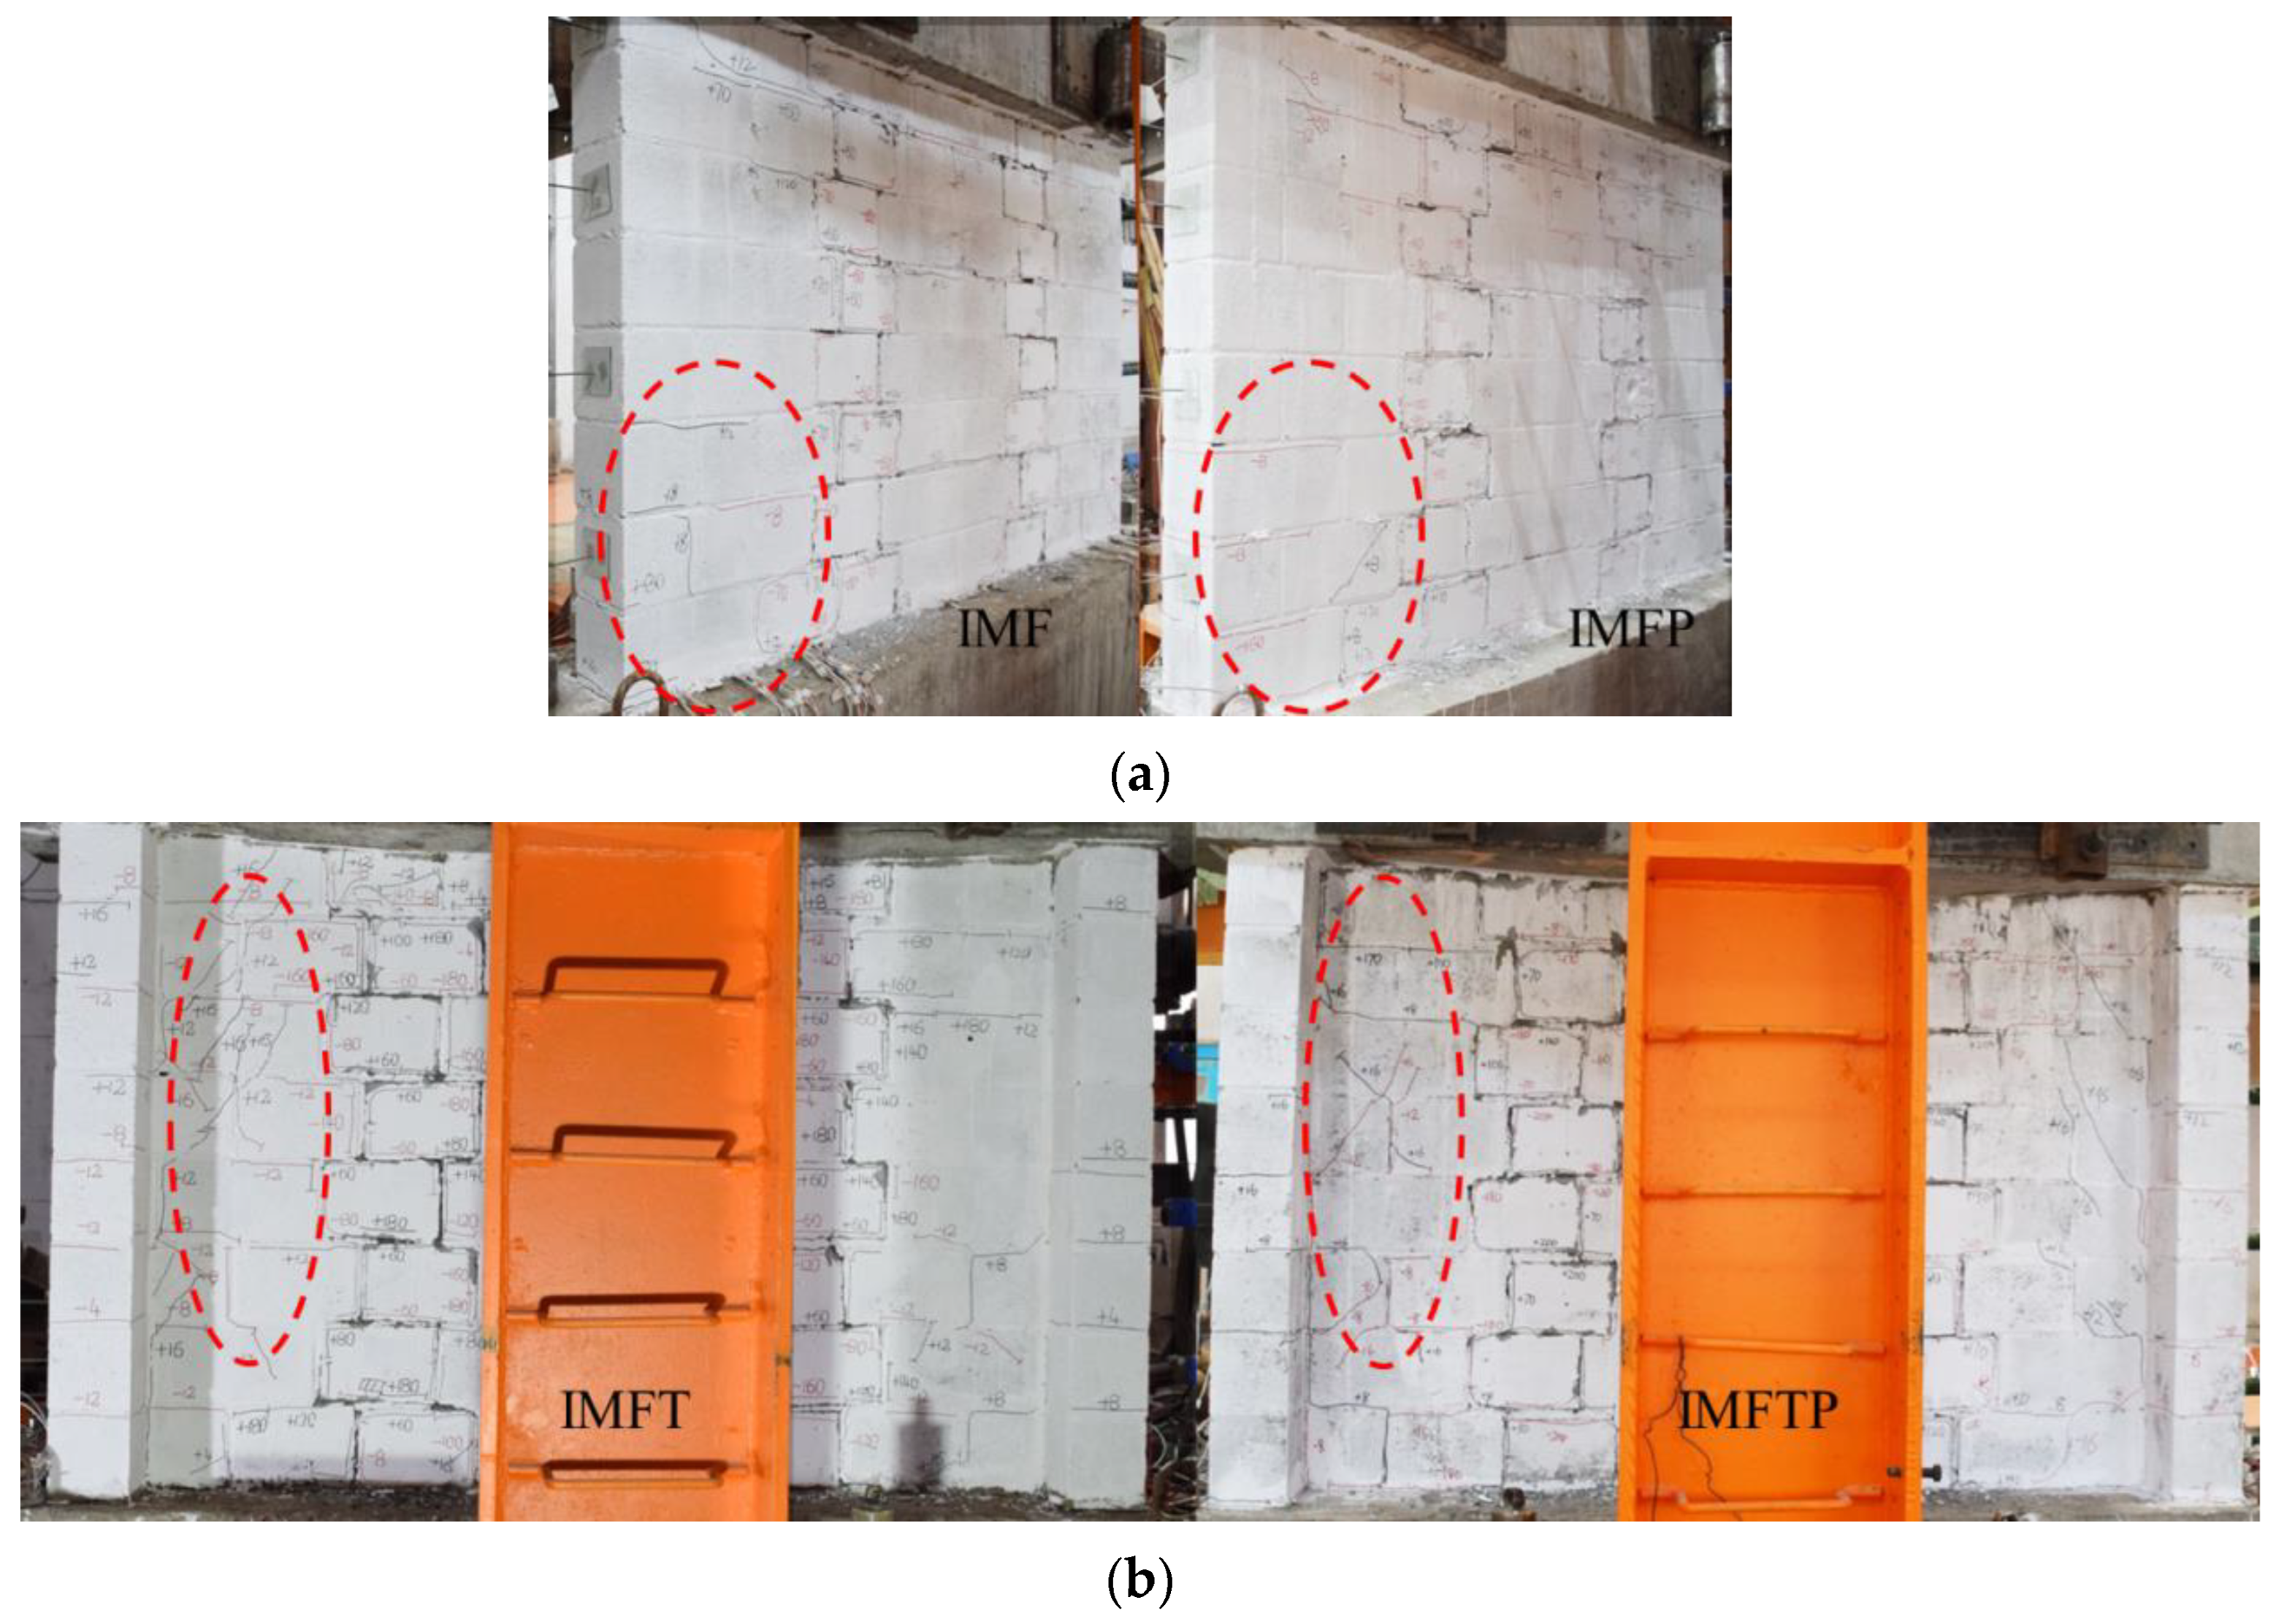
3.1. Damage Propagation
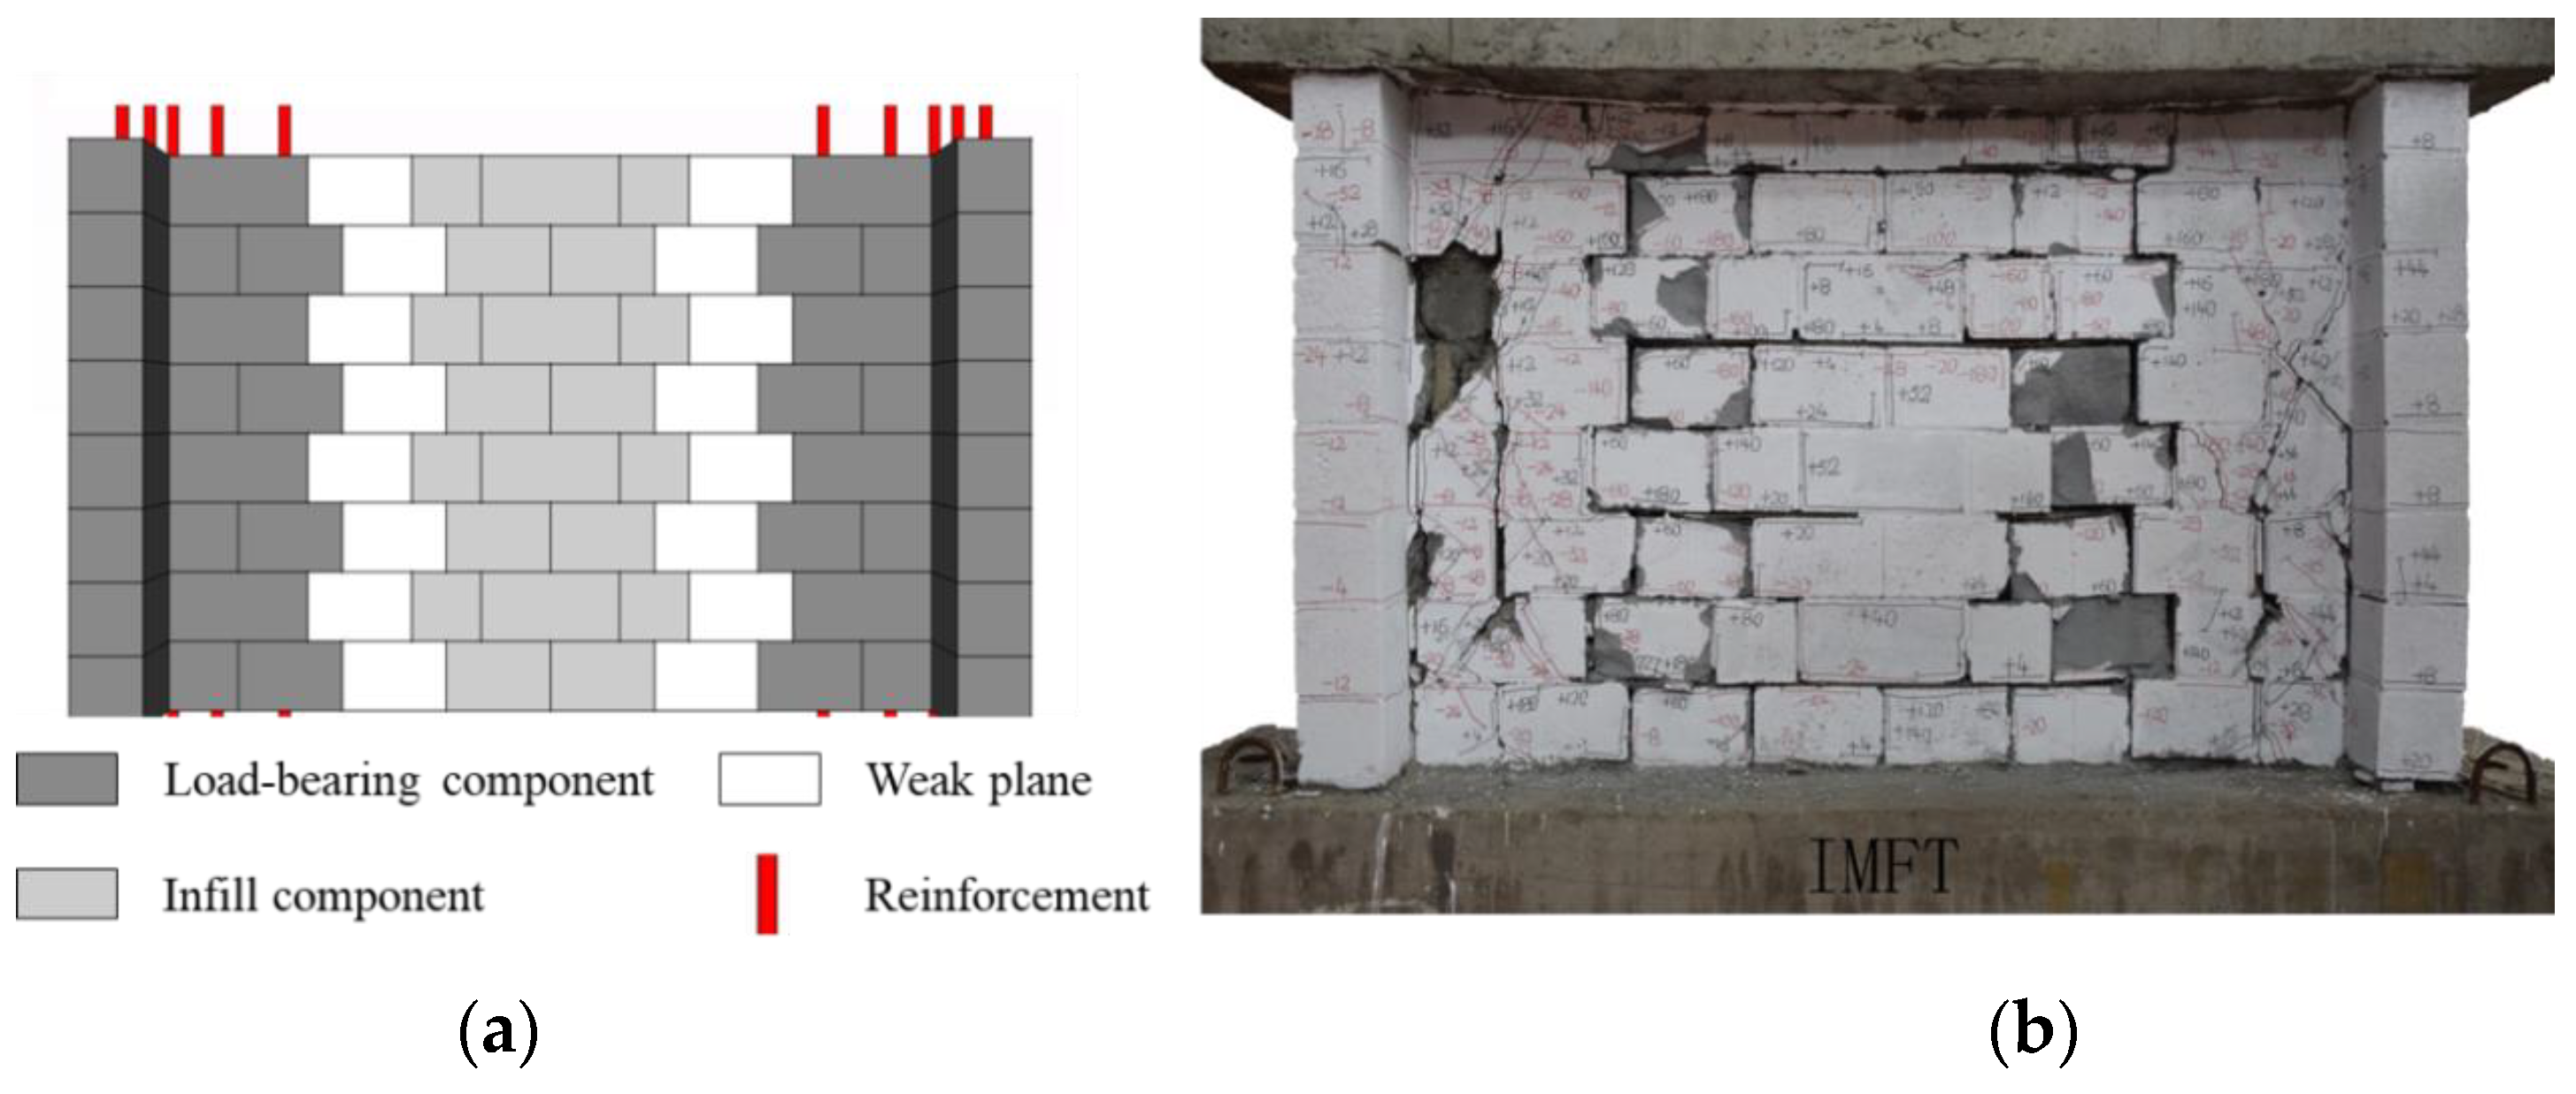
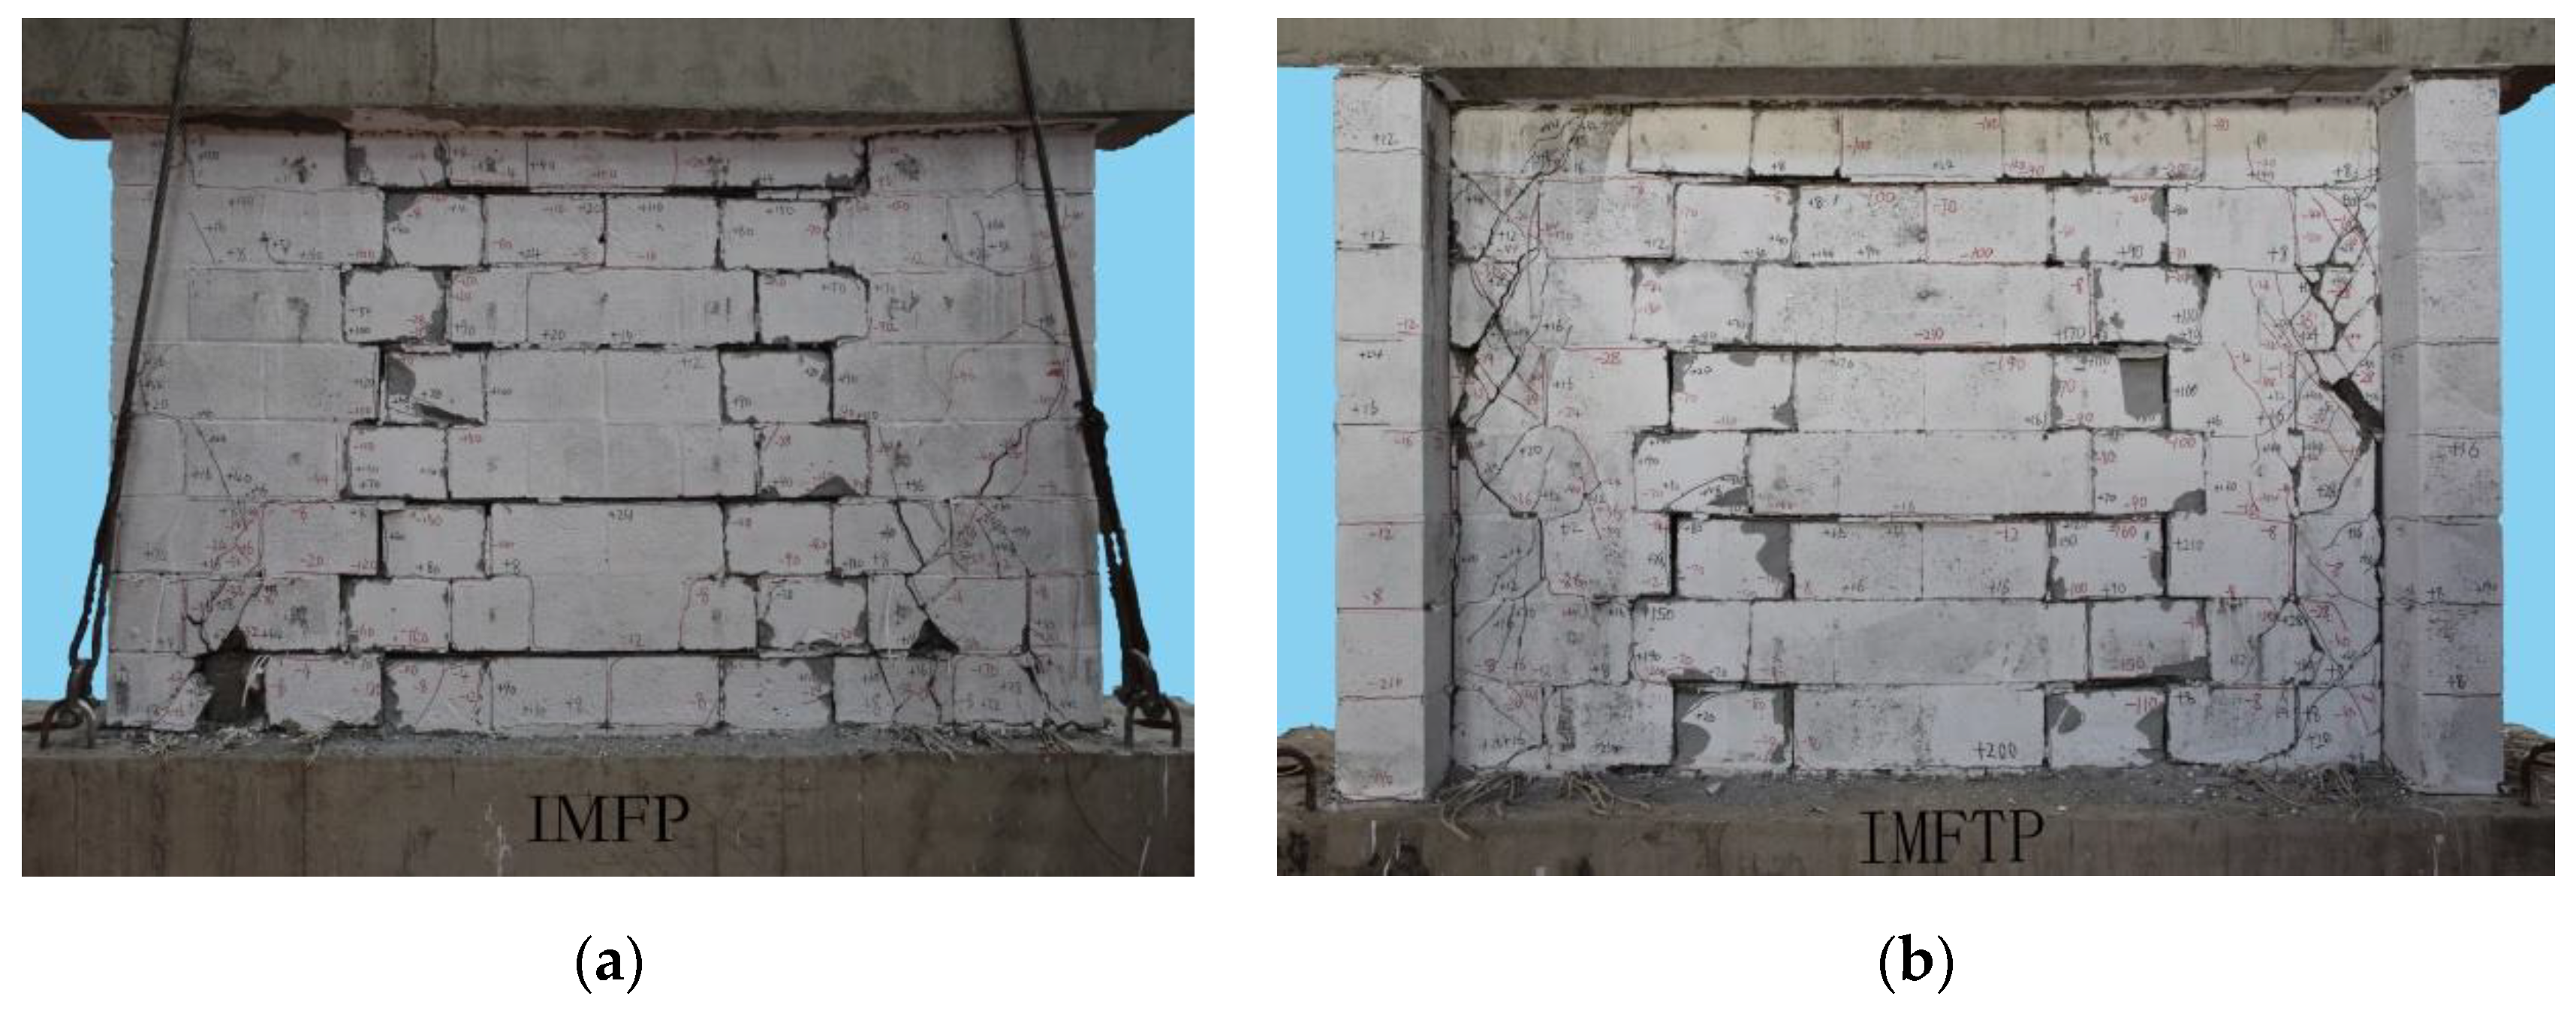
3.2. Failure Pattern
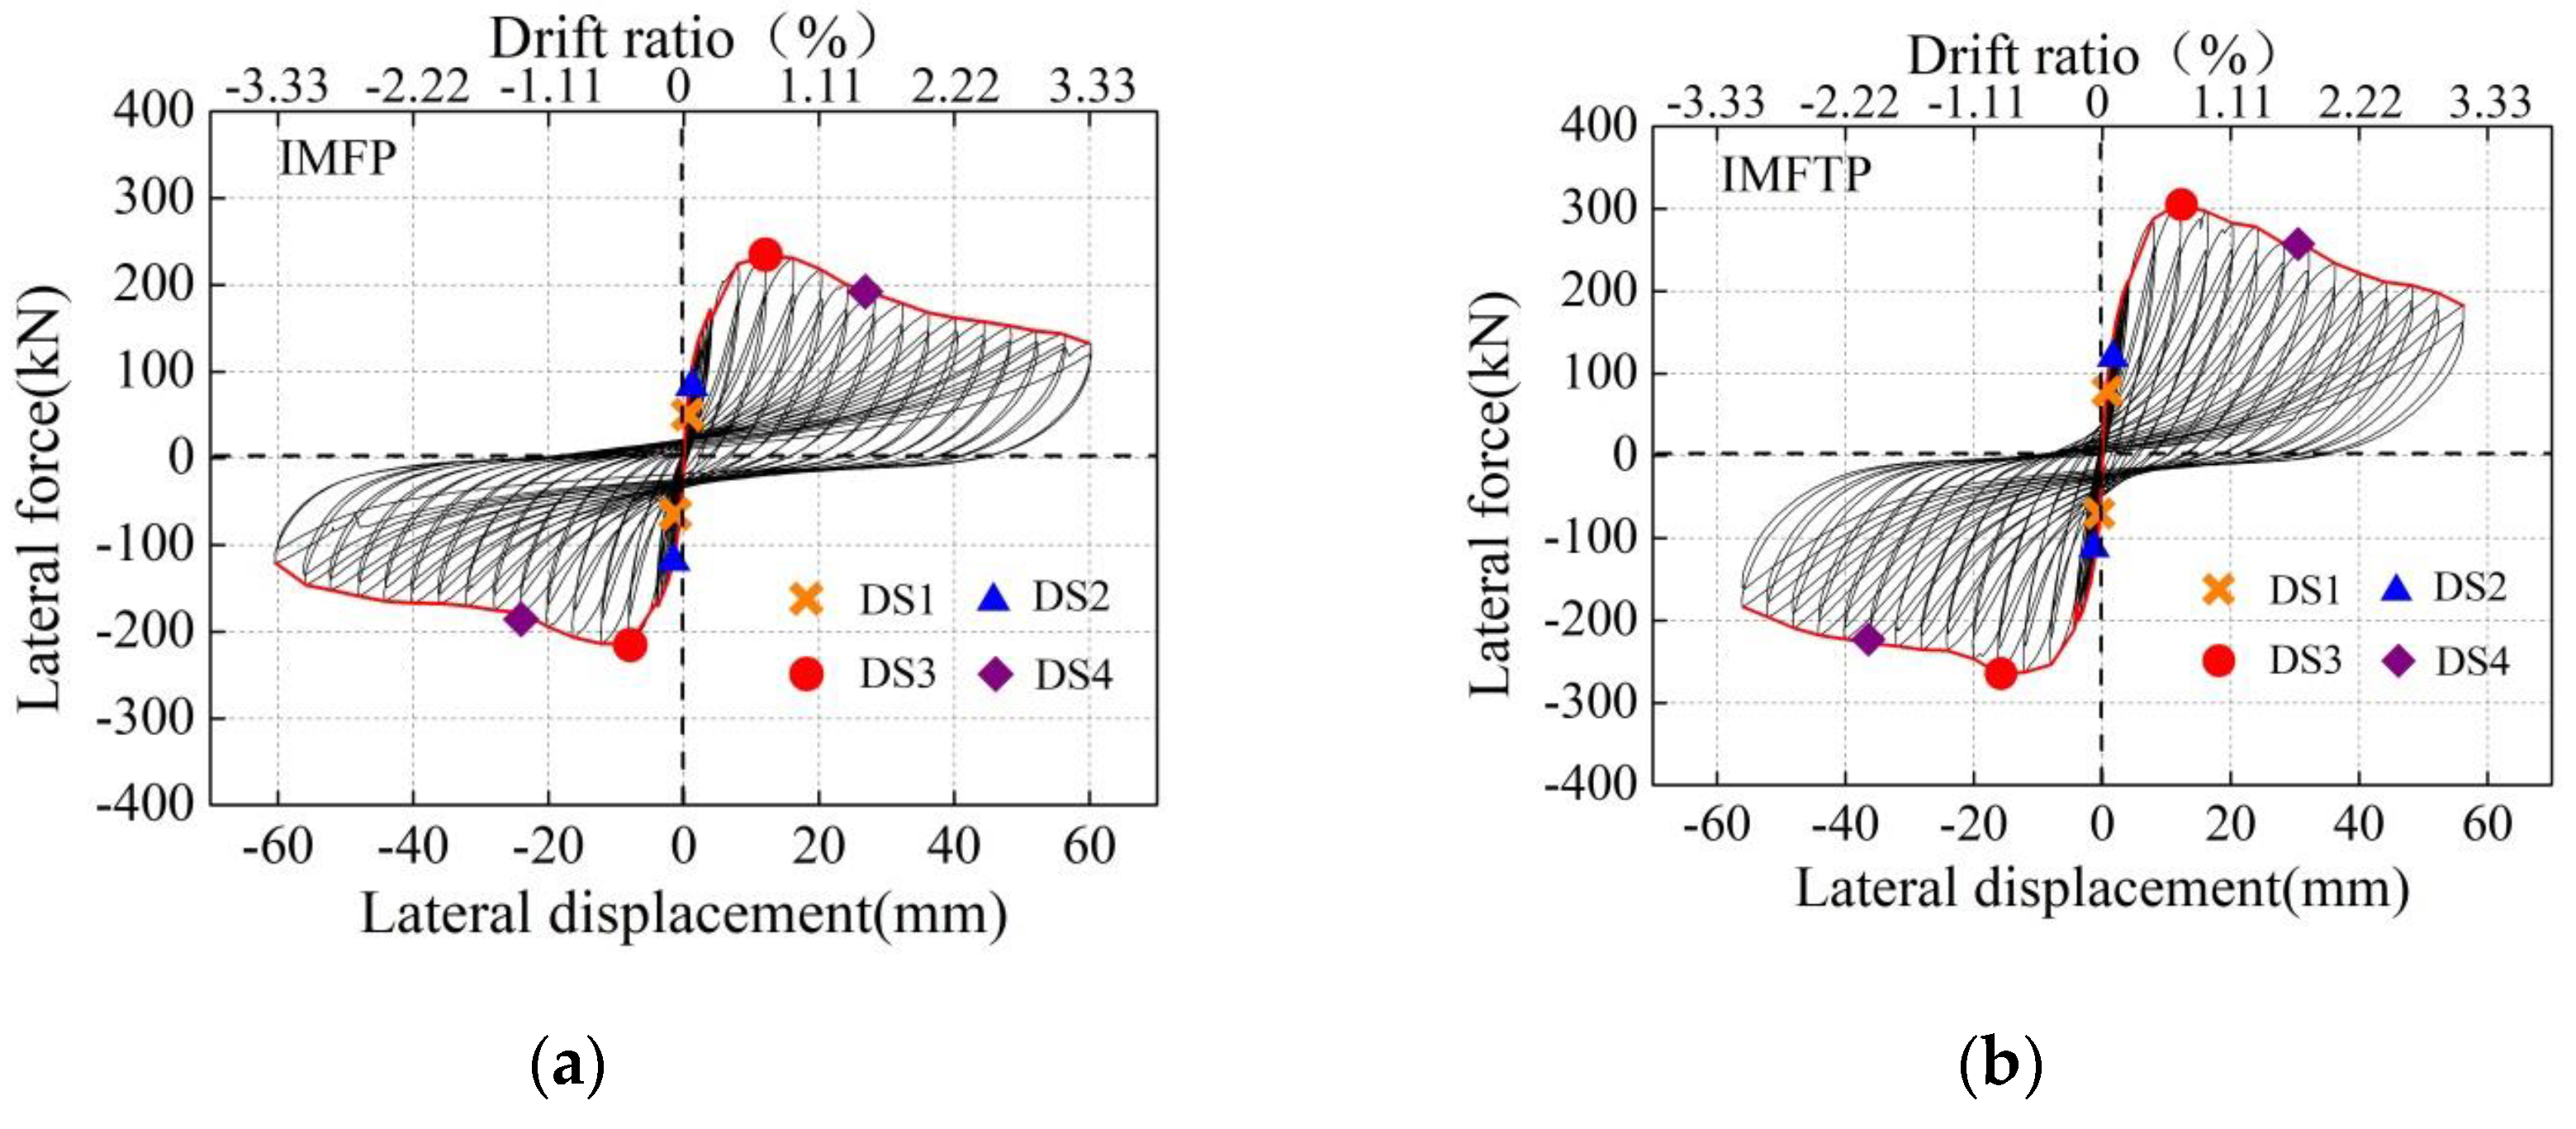
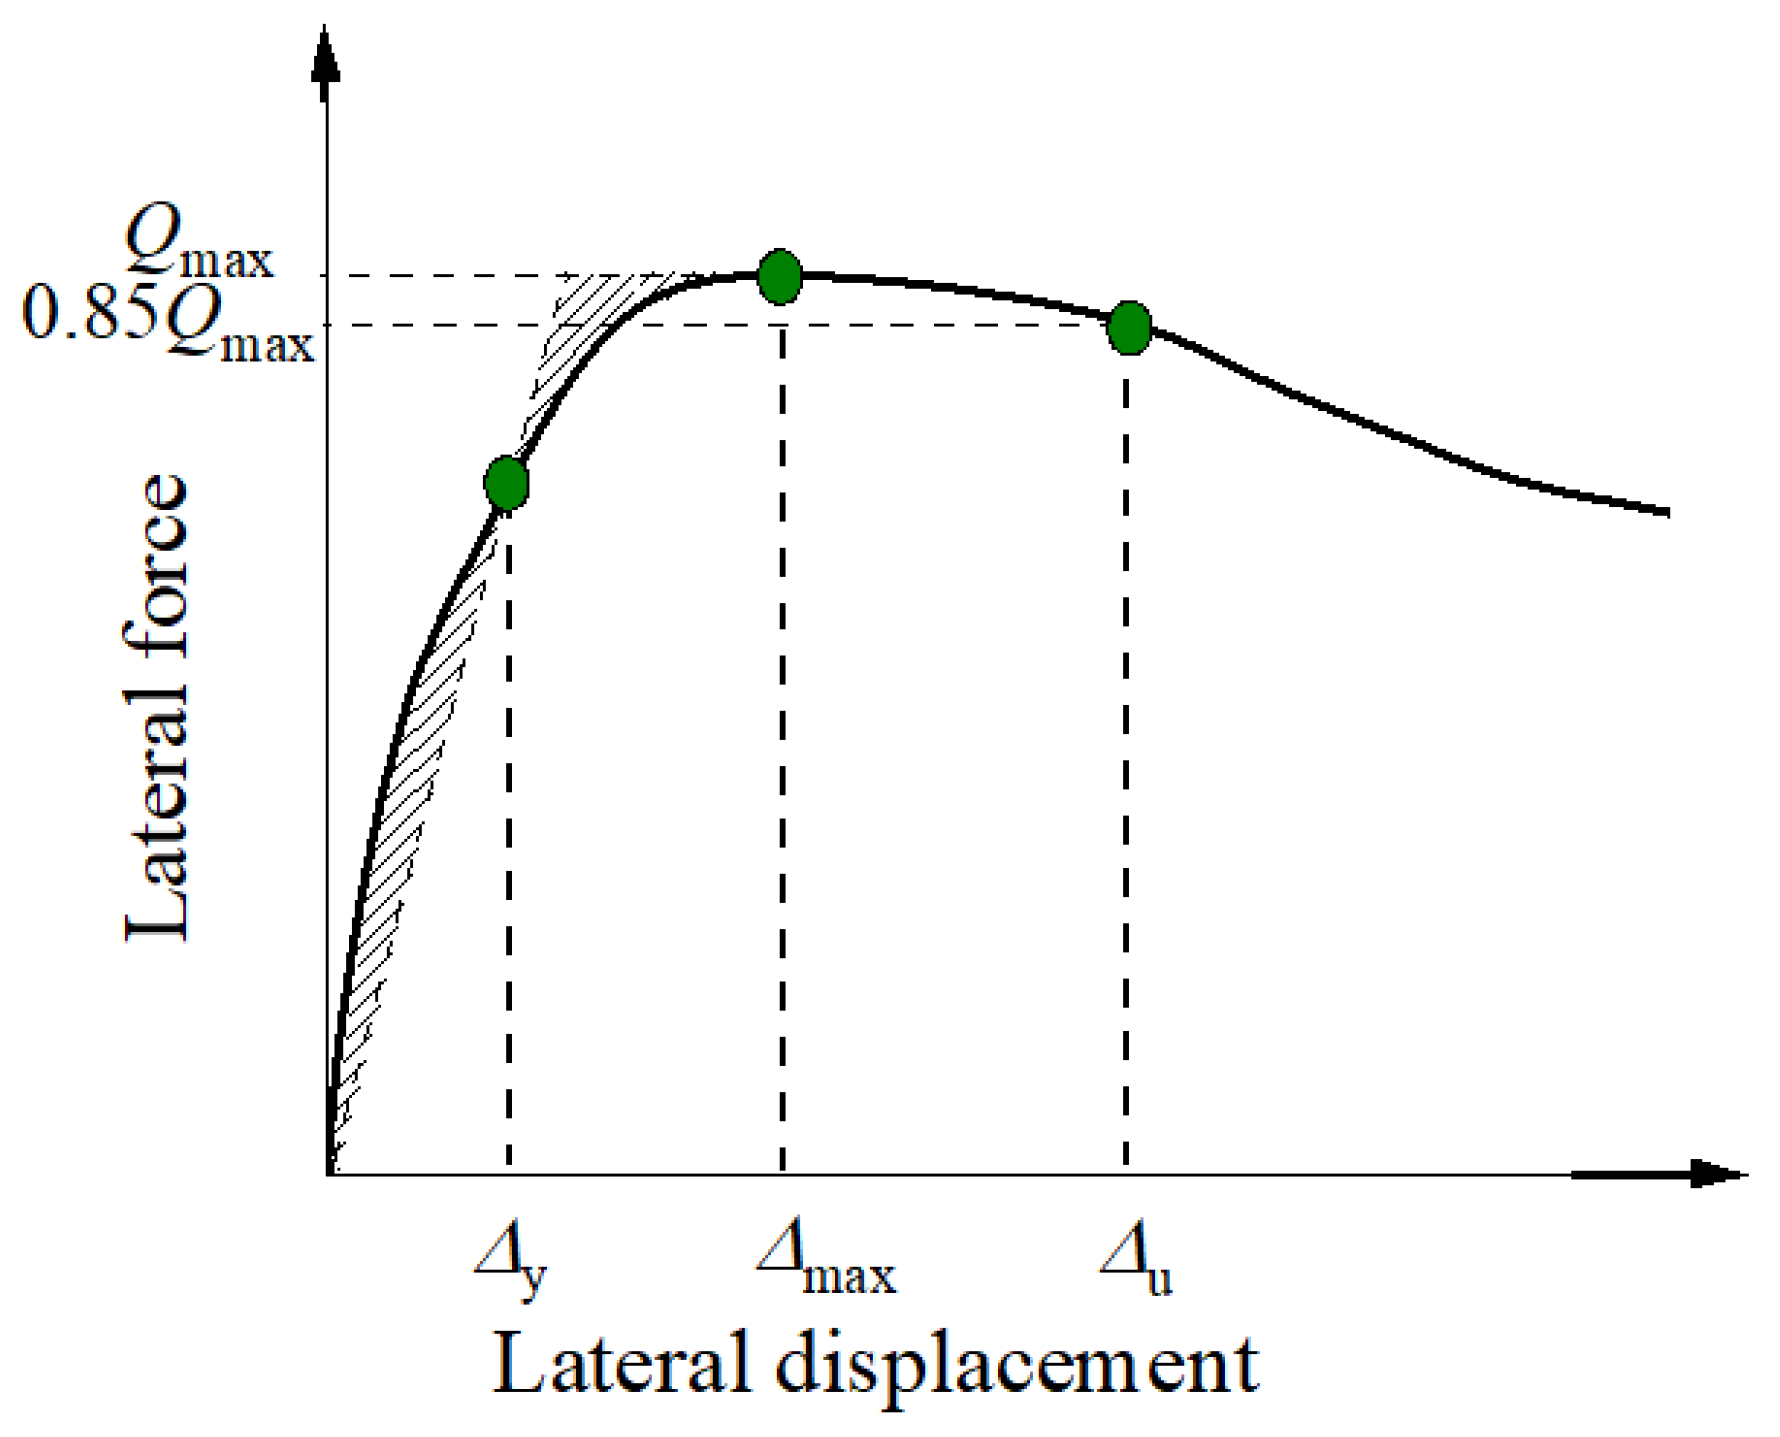
3.3. Hysteretic Curves and Characteristic Points
4. Parameter Discussion
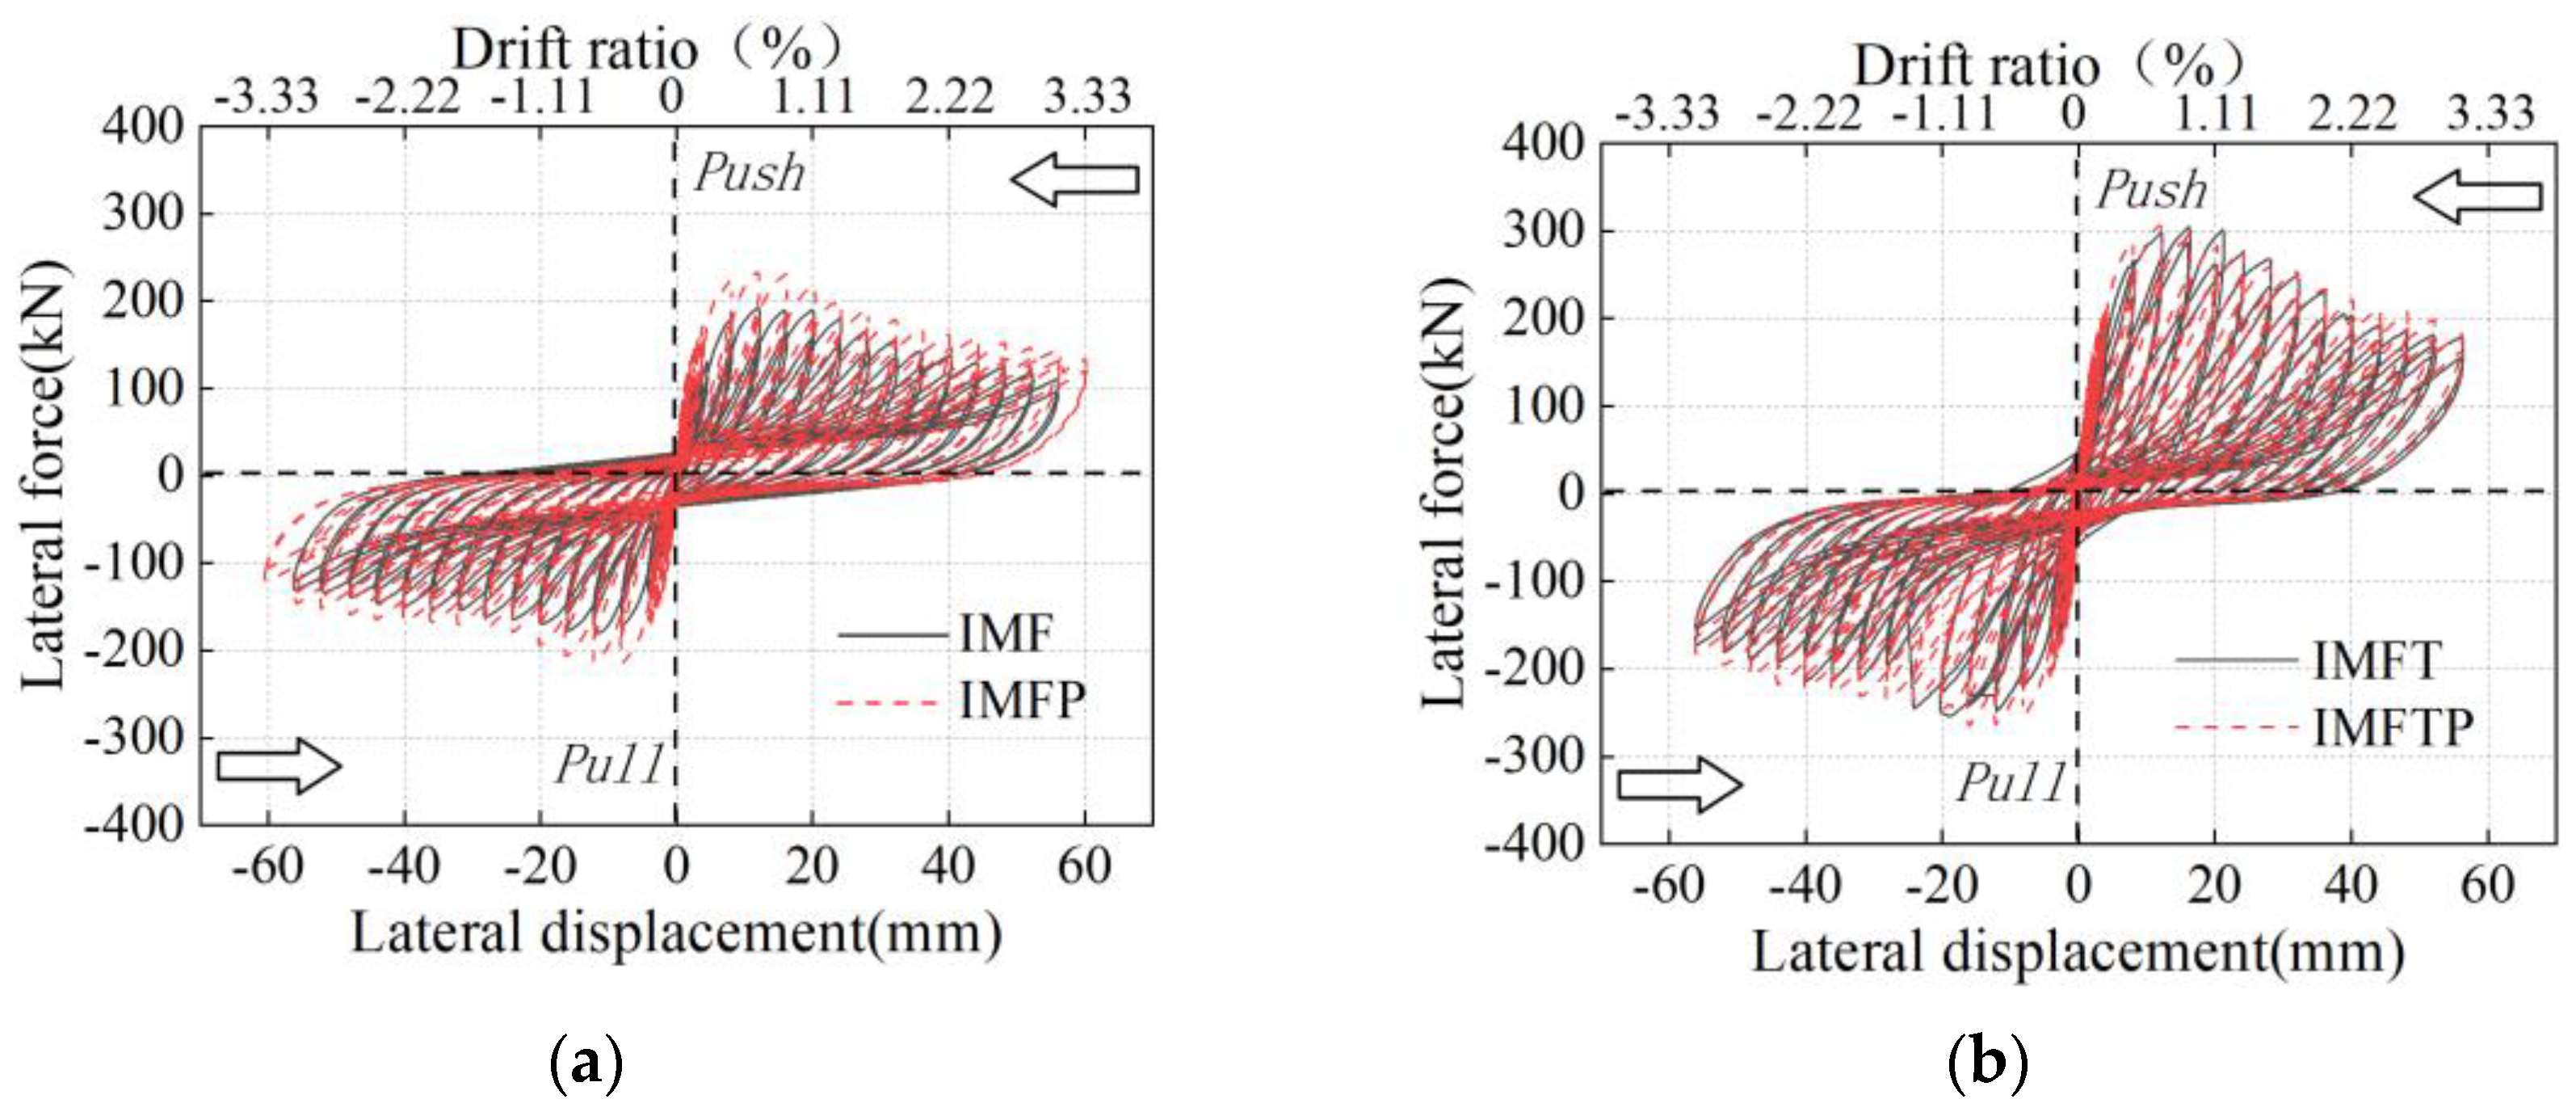
4.1. Influence on Hysteretic Curves
4.2. Influence on Stiffness Degradation
4.3. Influence on Displacement Ductility
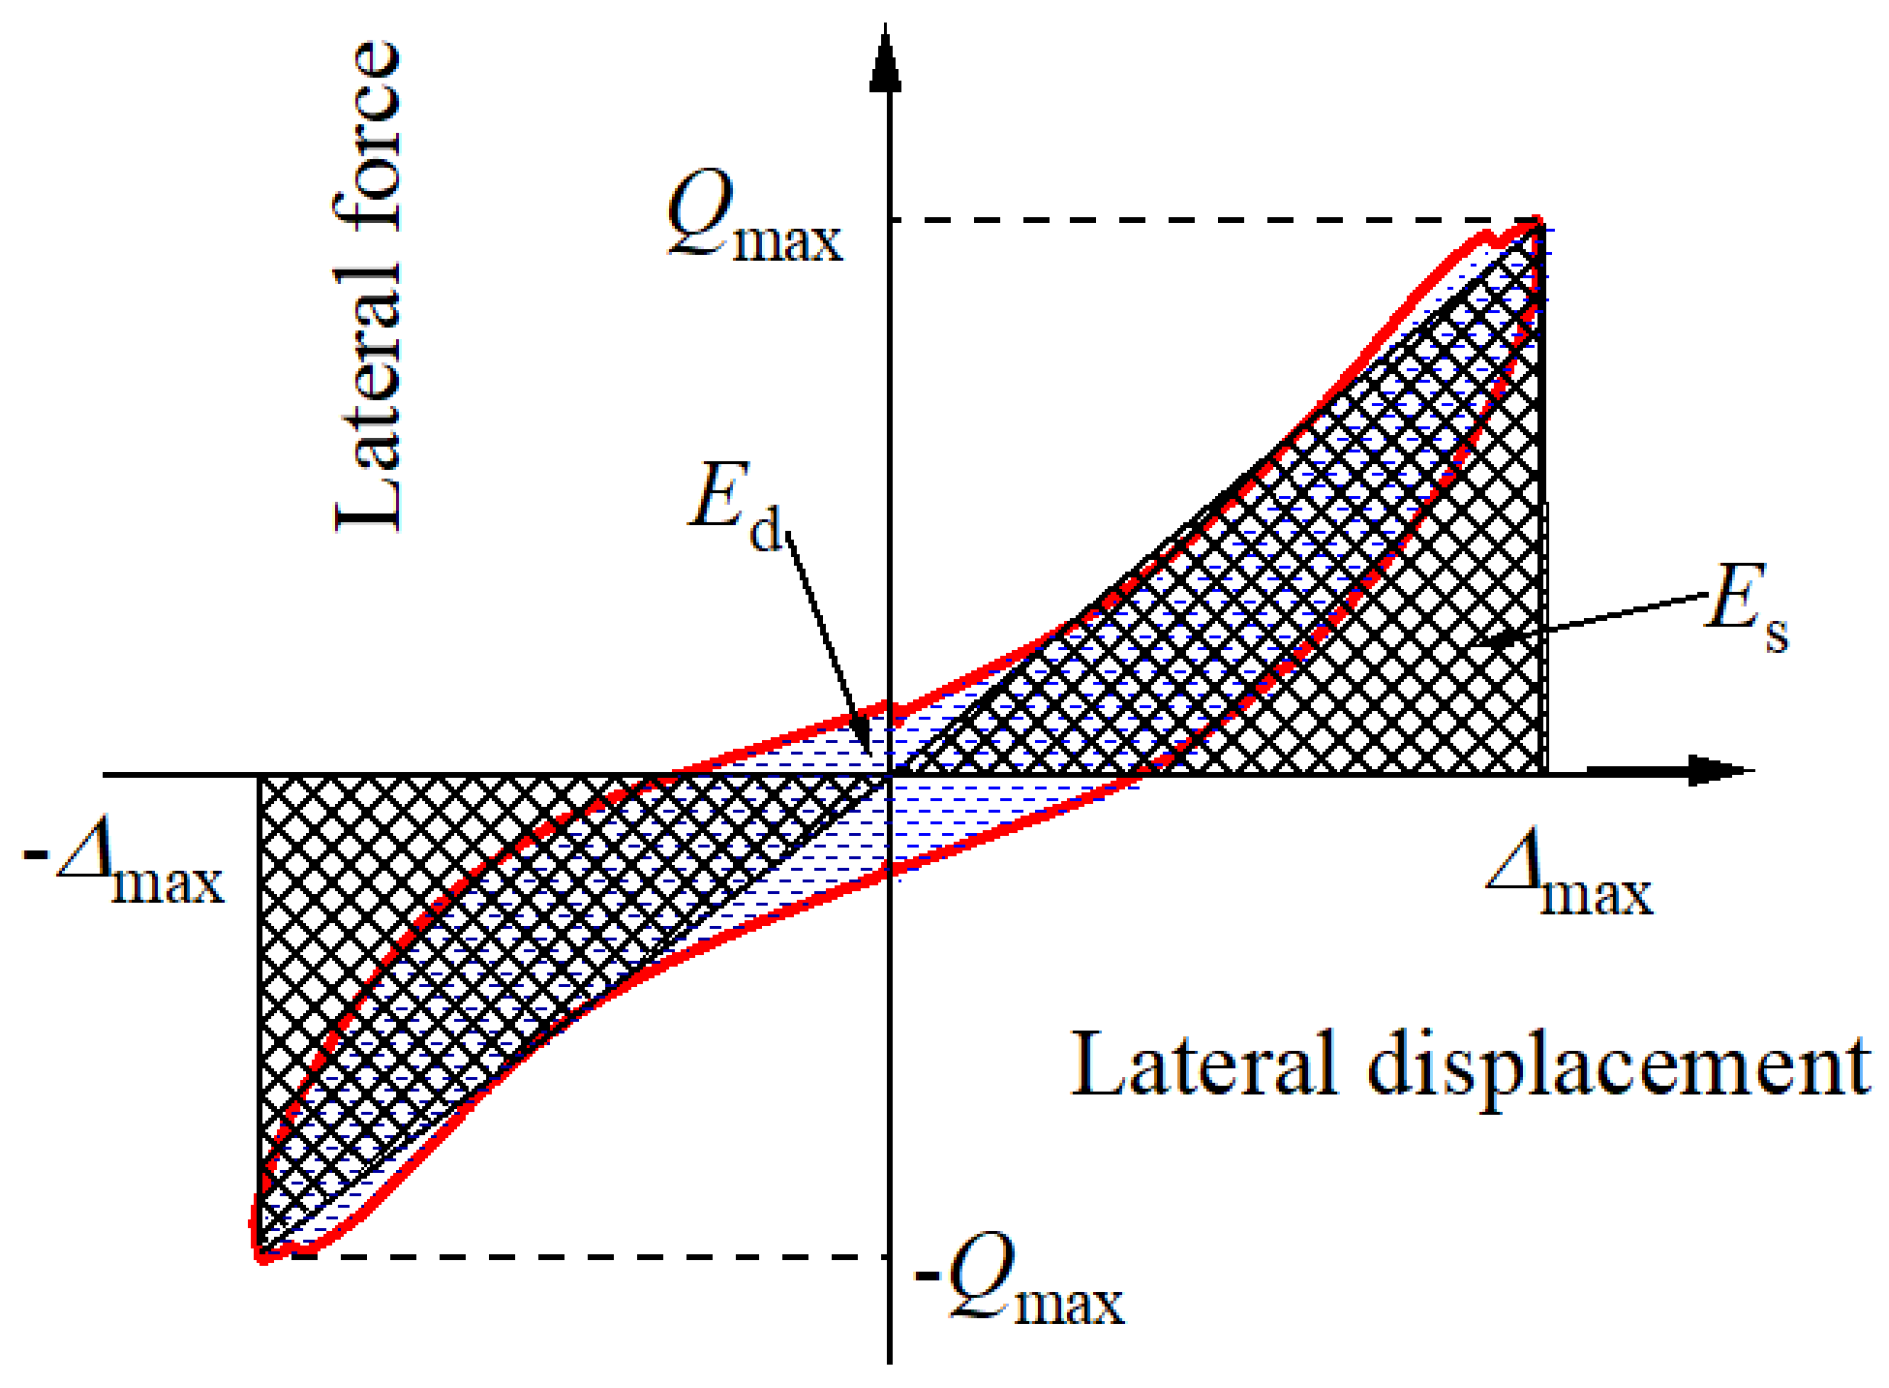
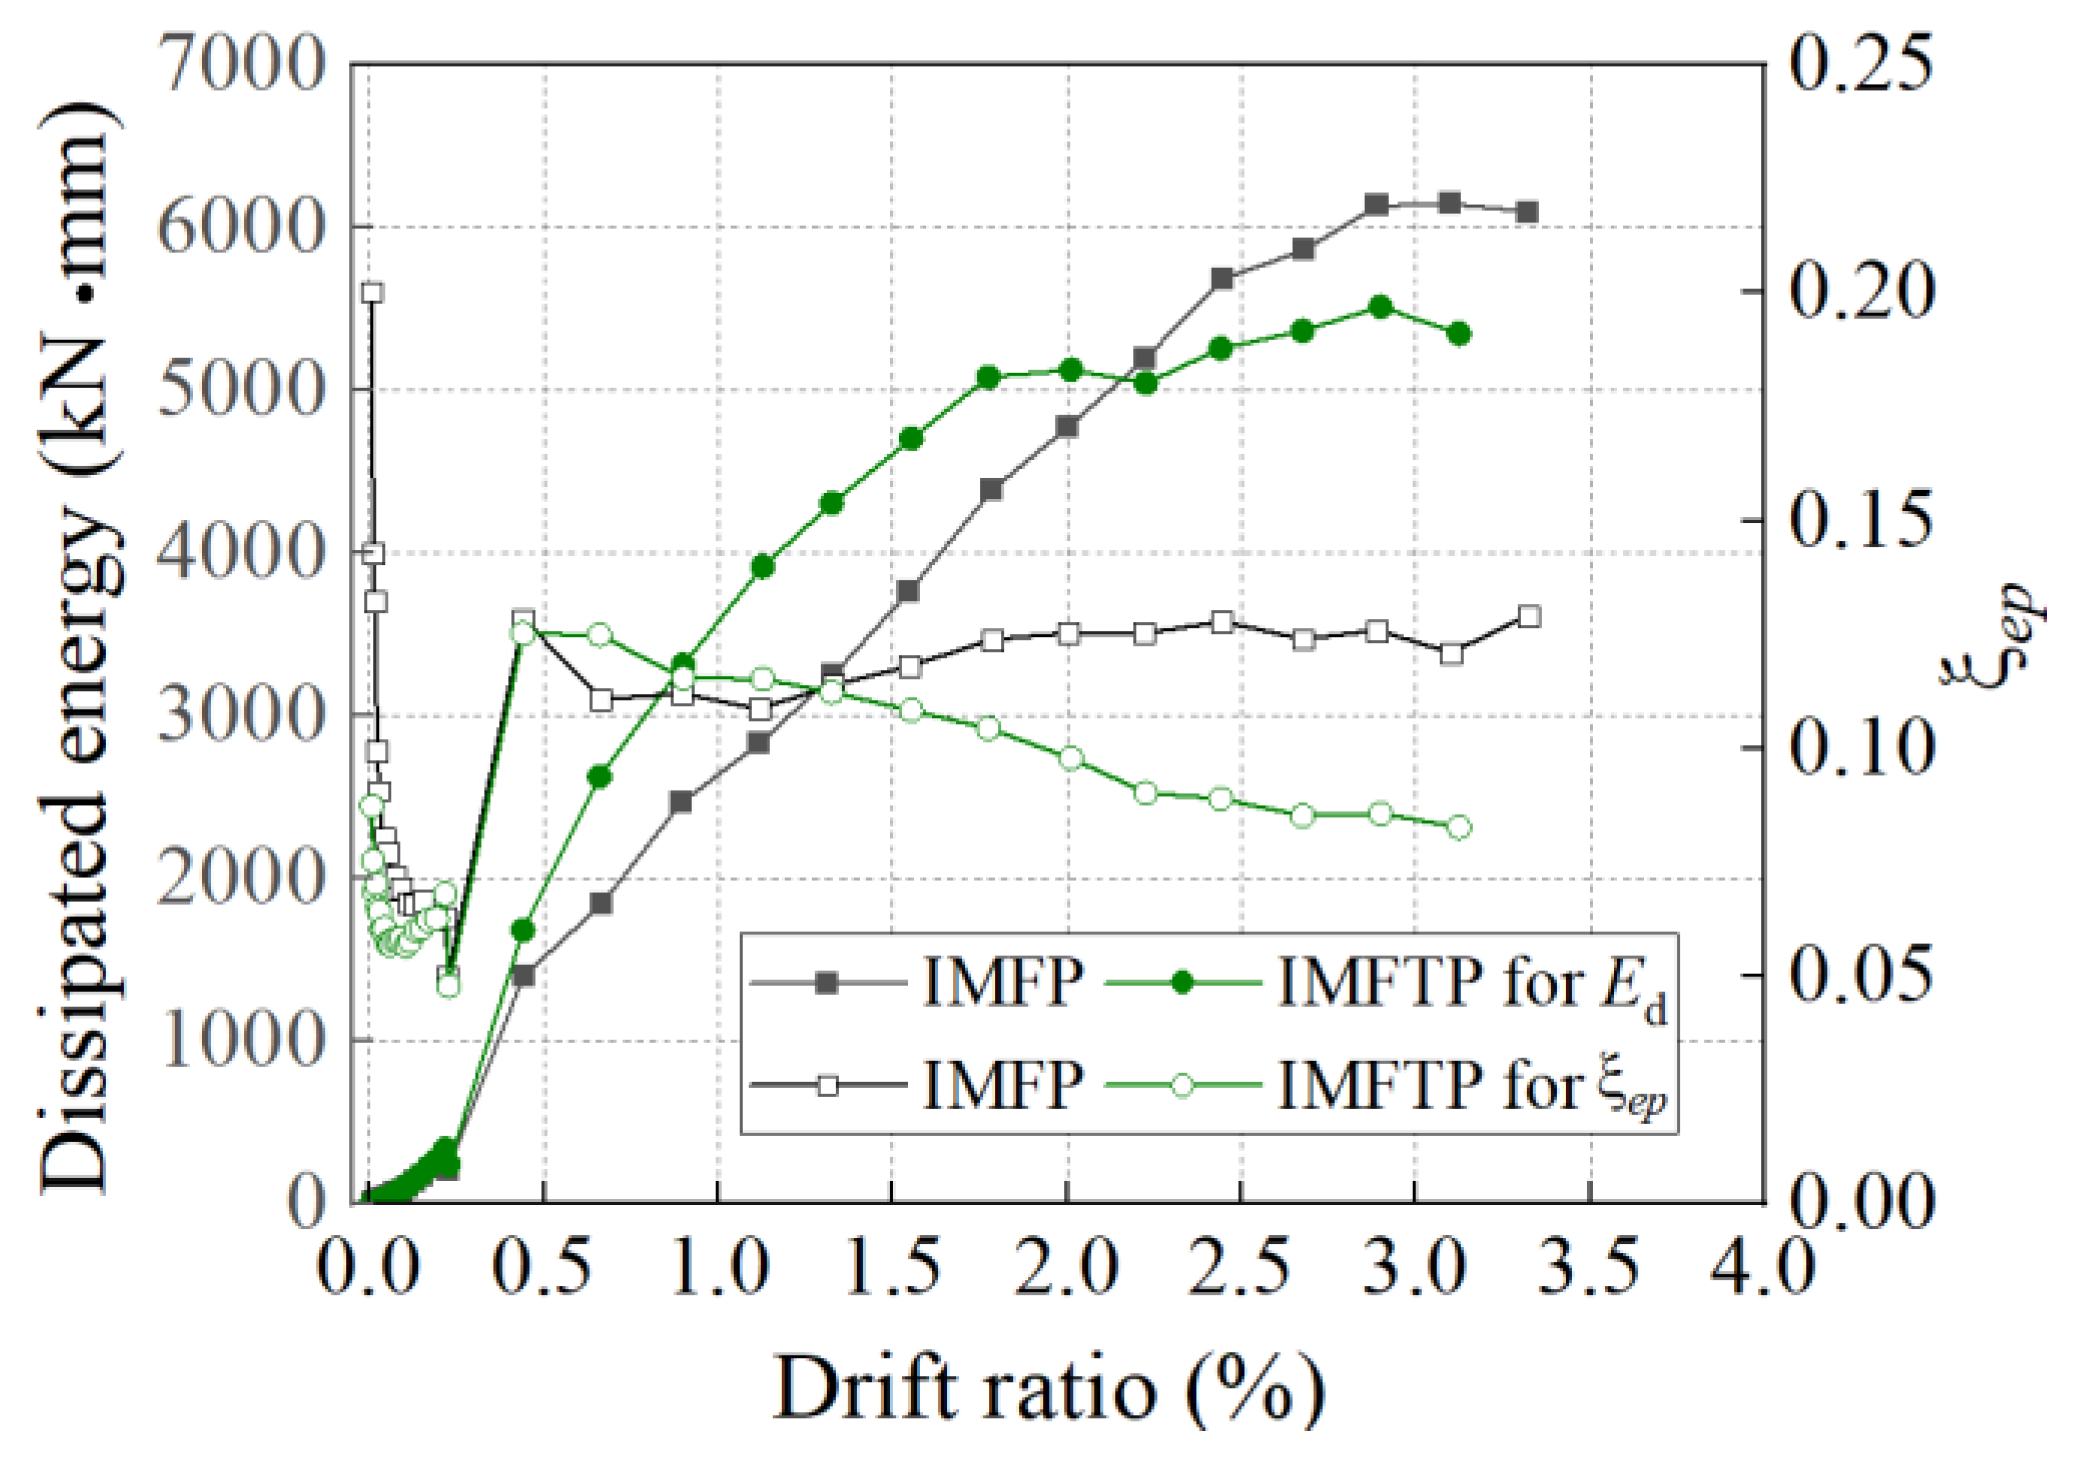
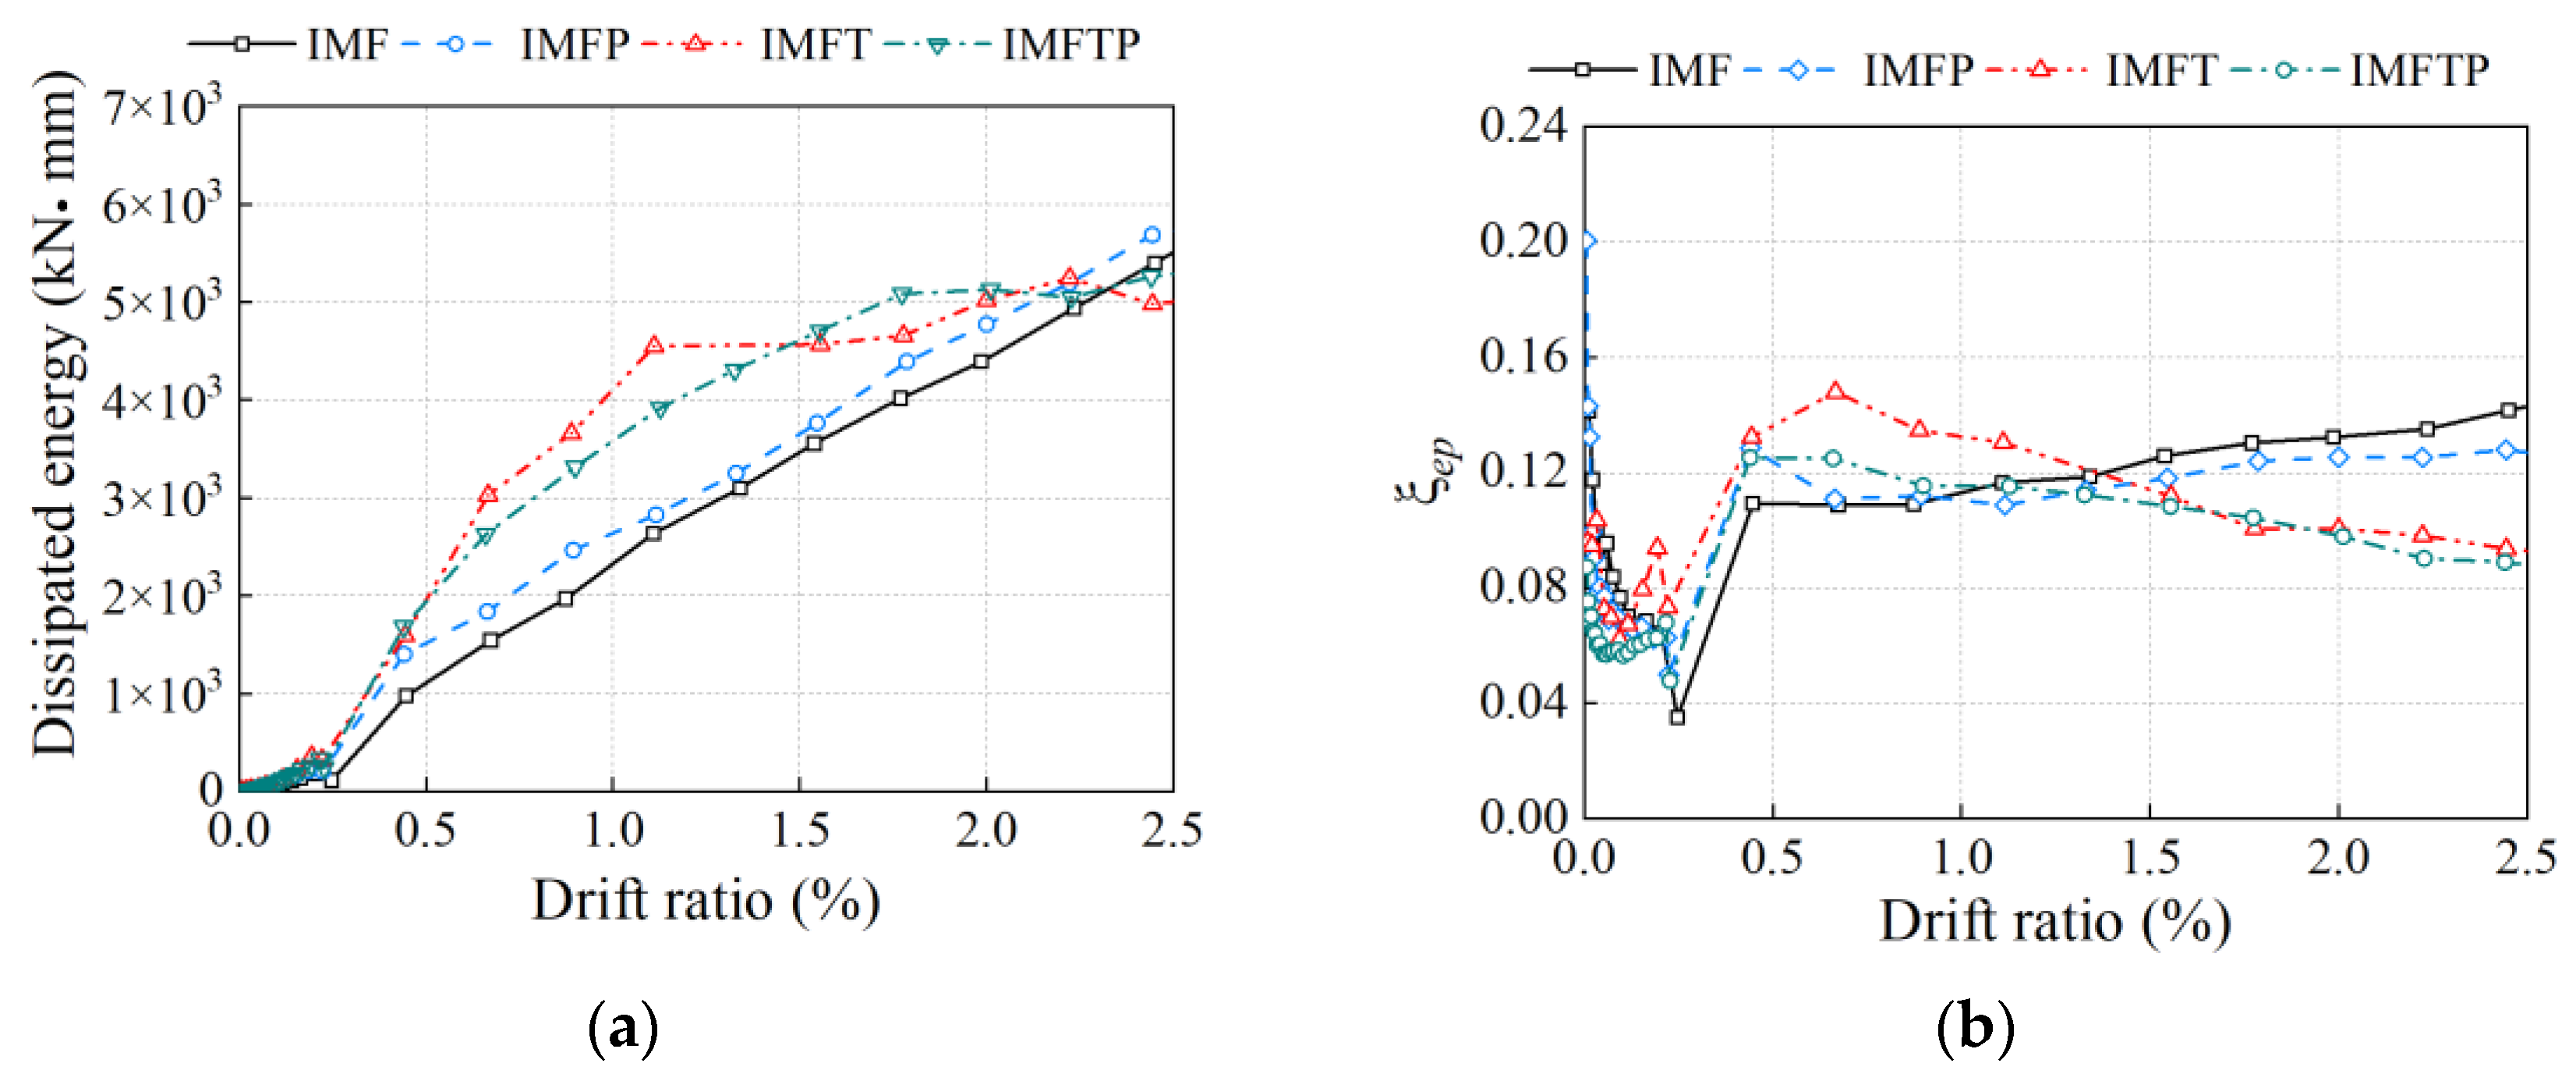
4.4. Influence on Energy Dissipation and Equivalent Viscous Damping
4.5. Influence on Damage Propagation and Deformation
5. Conclusions
- (1)
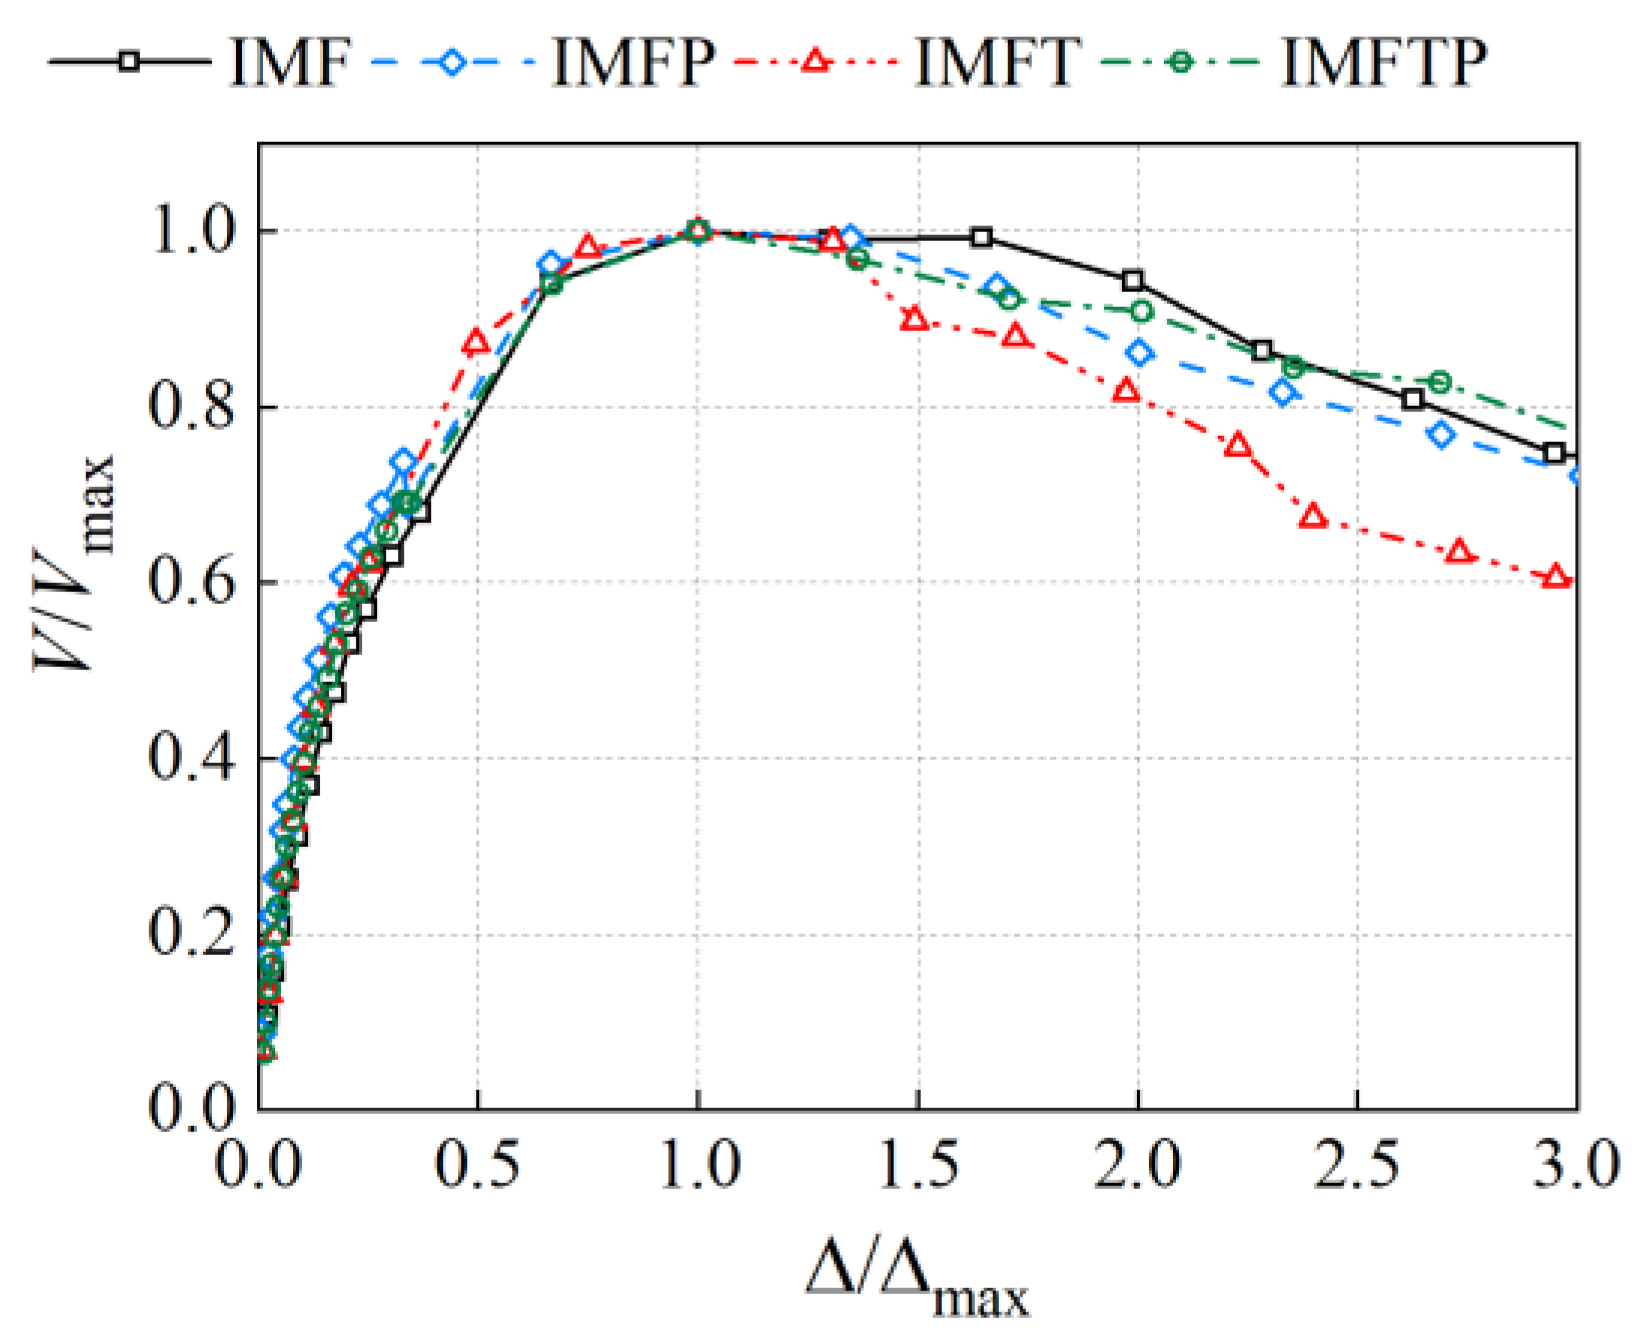
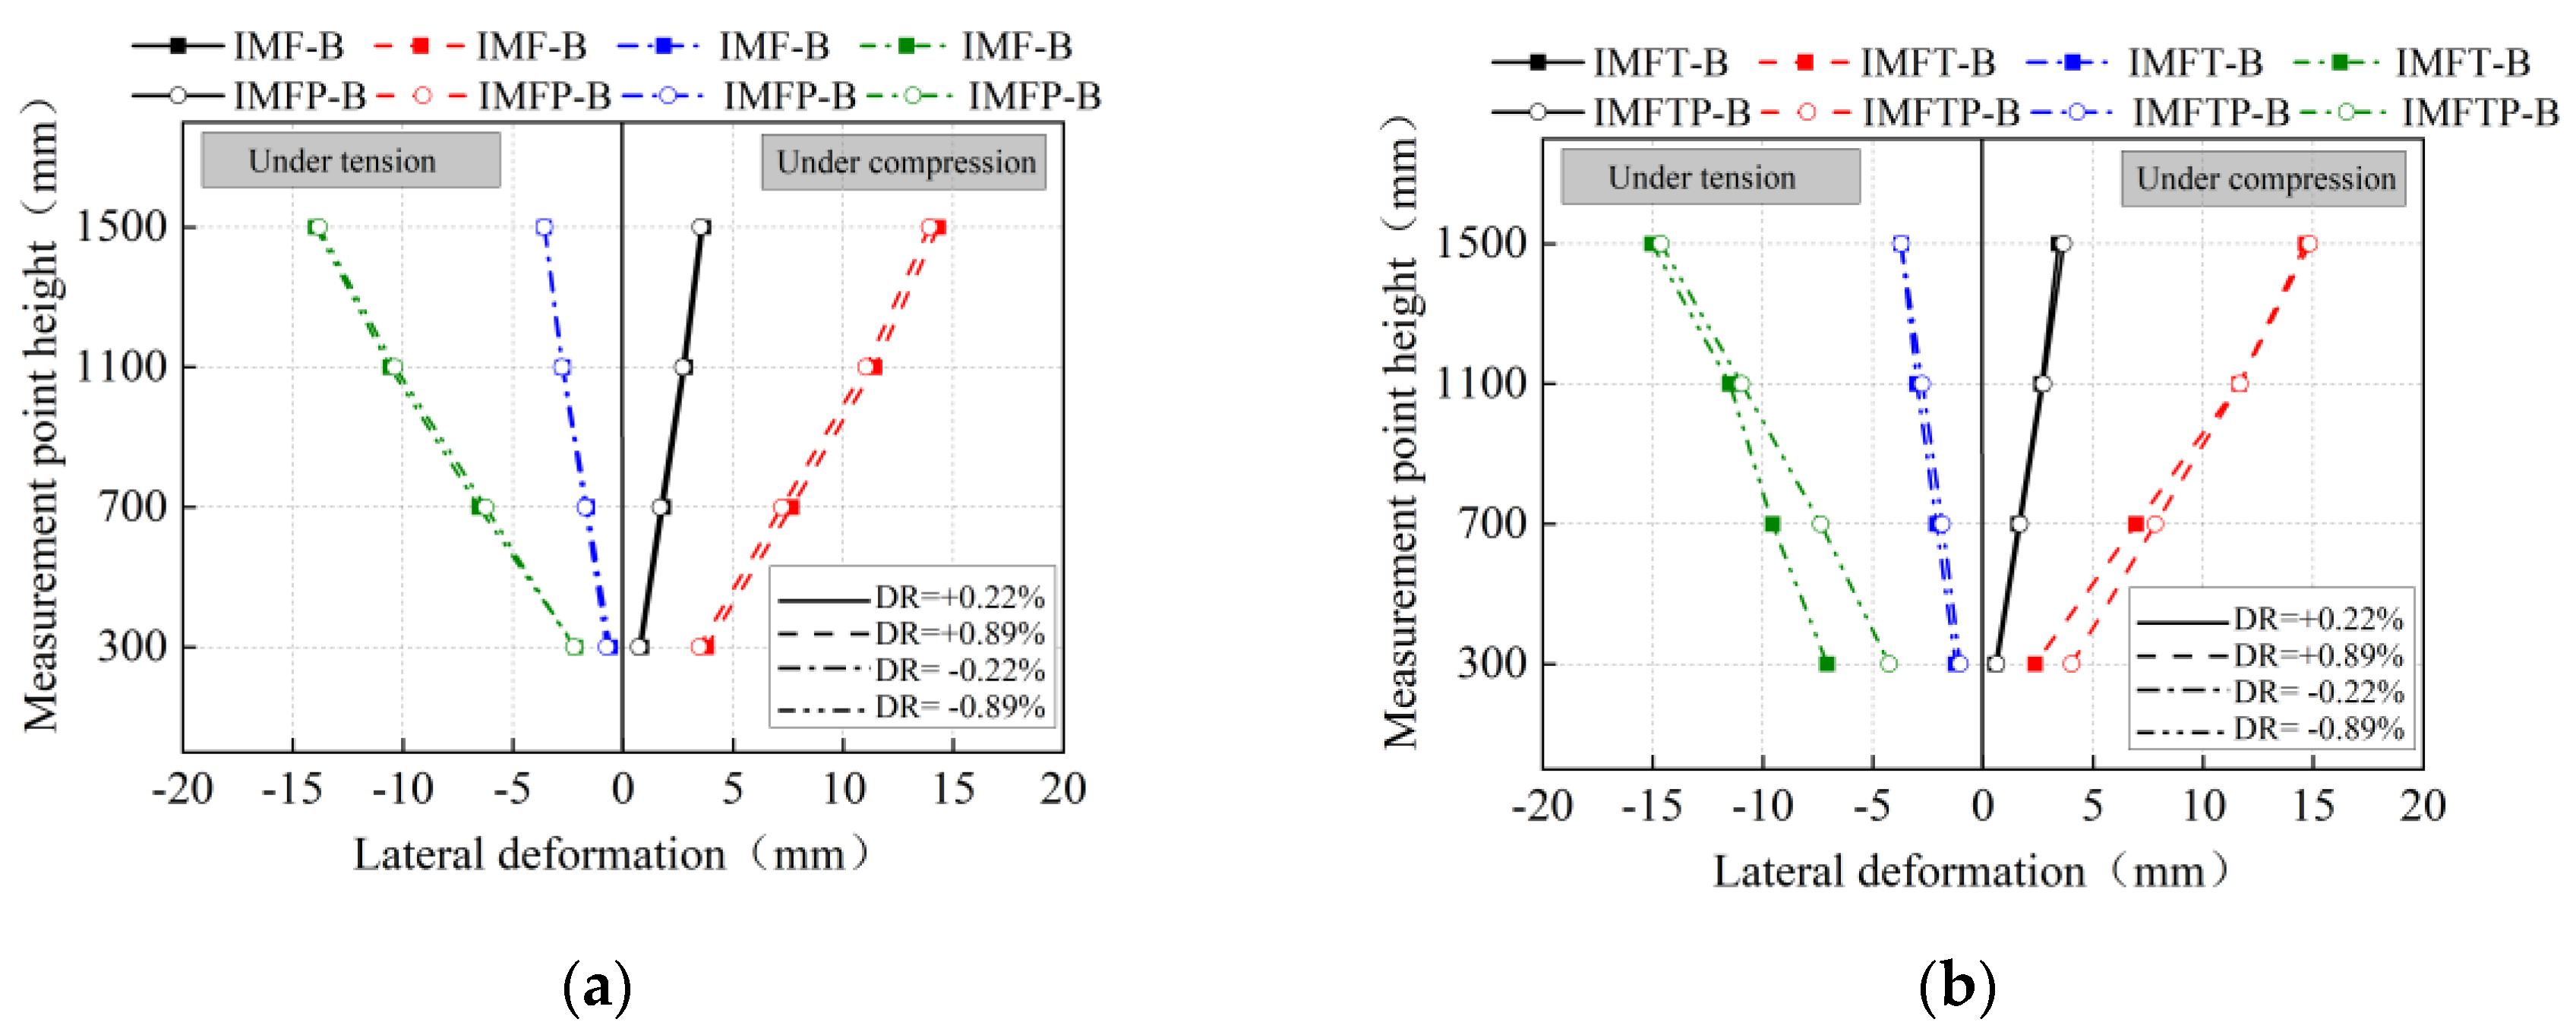
- Cracks were initially observed at the mortar layers around the weak planes of the specimens and subsequently in the load-bearing component. The gap between the load-bearing component and in-fill component appeared with an increase in the drift ratio, which protected the in-fill component at a larger drift ratio. At last, the specimen with a rectangular section was observed to be in the flexural failure mode, while the specimen with a T-shaped section was observed to be in the shear failure mode, respectively. The prestressing technology had a positive influence on the crack propagation and deformation of the specimen before it reached lateral resistance; however, it is necessary to conduct additional research on the relationship between the deformation of specimens with prestressing technology under a larger drift ratio and different failure patterns.
- (2)
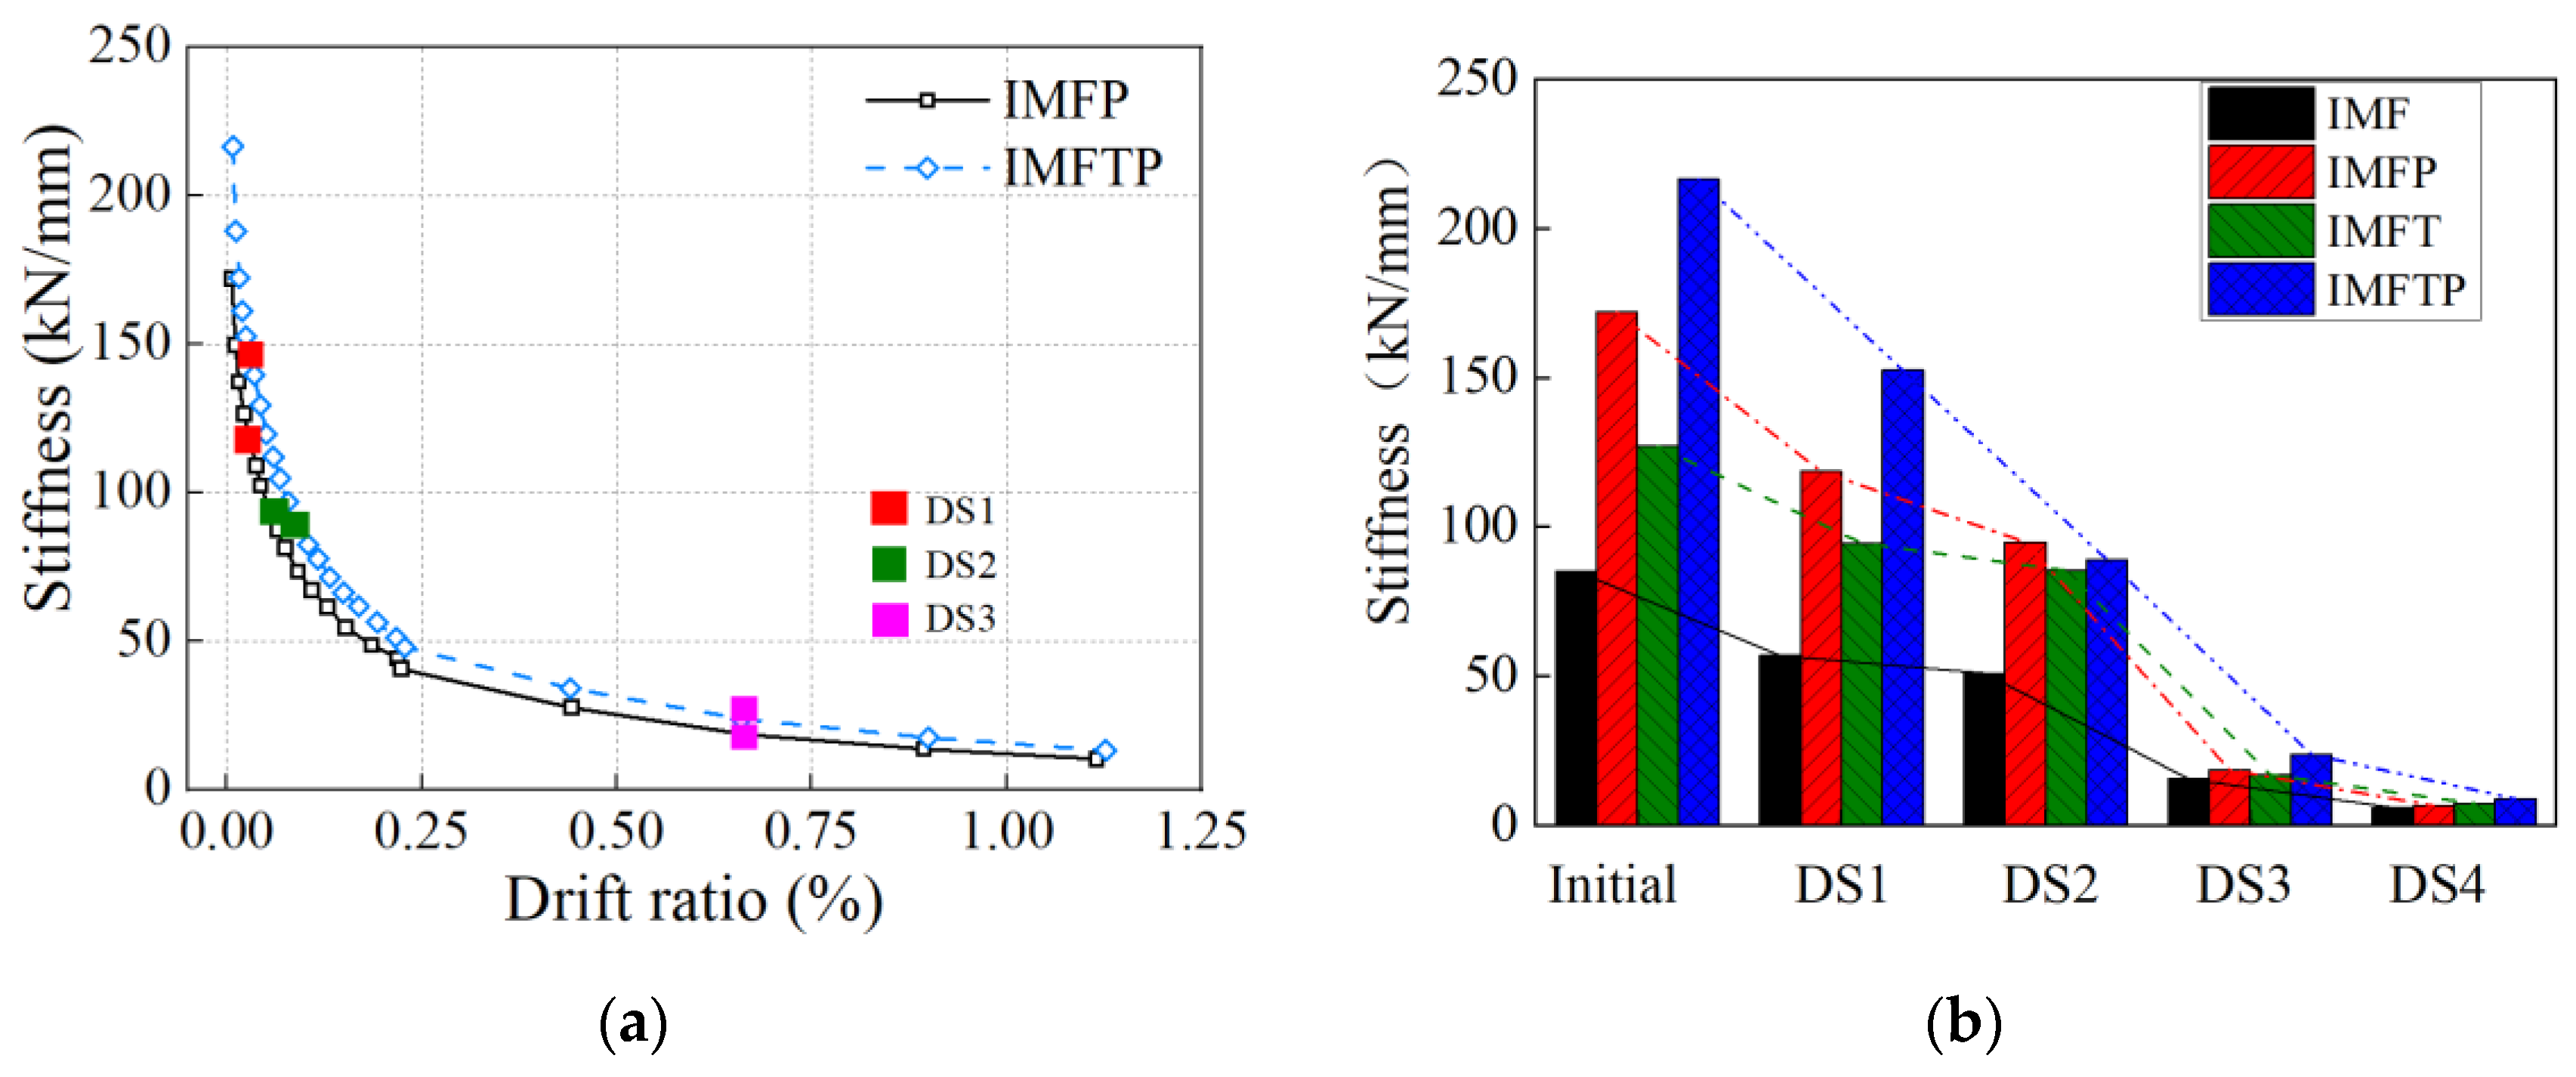
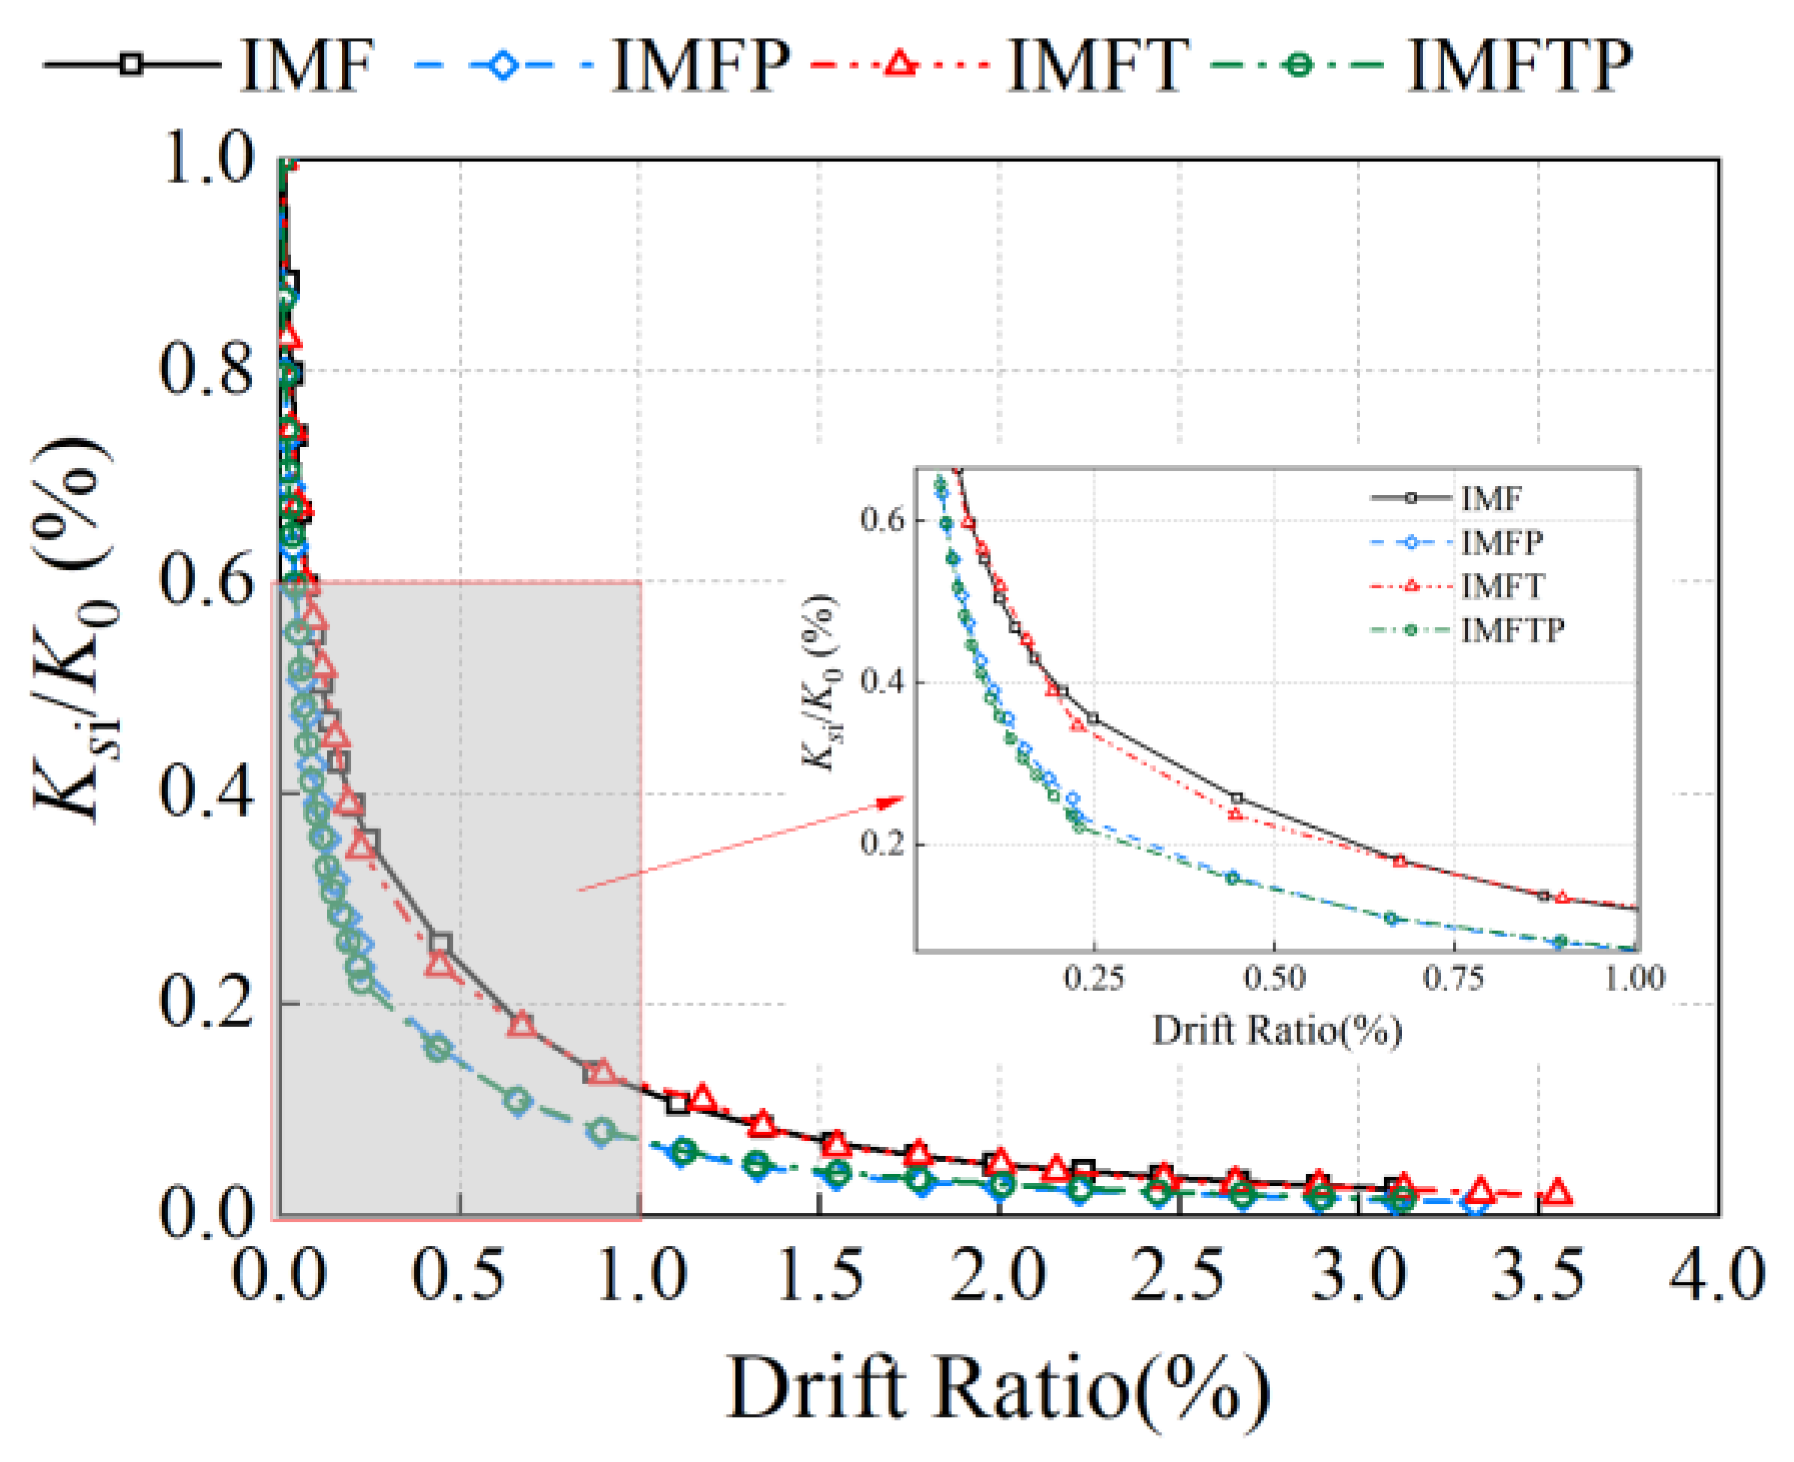
- The existence of flanges and the prestressing technology improved the initial stiffness of the specimen, while the degradation rate of the specimen with the prestressing technology was higher than that of the specimen without. The influence of the prestressing technology on the stiffness of the specimen was gradually weakened with an increase in the drift ratio. The displacement ductility coefficients of specimens IMFP and IMFTP were 4.63 and 4.66, respectively. Although the prestressing technology advanced the yield displacement of the specimen, the ductility of specimens IMFP and IMFTP increased by 6 and 16% in comparison with that of the reference specimens in previous research, which indicated that the prestressing technology had a positive influence on the displacement ductility of the specimen.
- (3)
- The energy dissipation of the two specimens increased rapidly after a DR of 2.0% was achieved, while that of specimen IMFTP tended to remain constant after a DR of 2.0% was obtained. The equivalent viscous damping initially decreased, followed by a slight increase, and then a constant value was reached after a DR of 1.5% was achieved. Specimen IMFP finally converged at 8%, while specimen IMFTP finally converged at 14%. The influence of the prestressing technology on the energy dissipation and equivalent viscous damping of the specimens decreased with an increase in the drift ratio. However, the equivalent viscous damping of the specimen with the prestressing technology was lower than that of the specimen without before a drift ratio of 0.25% was achieved, which indicates that the equivalent viscous damping of specimens with prestressing technology needs to be especially considered in structural design.
Author Contributions
Funding
Data Availability Statement
Acknowledgments
Conflicts of Interest
References
- Zhao, B.; Taucer, F.; Rossetto, T. Field investigation on the performance of building structures during the 12 May 2008 Wenchuan earthquake in China. Eng. Struct. 2009, 31, 1707–1723. [Google Scholar]
- Yön, B. Identification of failure mechanisms in existing unreinforced masonry buildings in rural areas after April 4, 2019 earthquake in Turkey. J. Build. Eng. 2021, 43, 102586. [Google Scholar]
- Deng, M.; Zhang, W.; Li, N. In-plane cyclic loading tests of concrete hollow block masonry walls retrofitted with high ductile fiber-reinforced concrete. Constr. Build. Mater. 2020, 238, 117758. [Google Scholar]
- EI-Dakhakhni, W.; Ashour, A. Seismic response of reinforced-concrete masonry shear-wall components and systems: State of the art. J. Struct. Eng. 2017, 43, 03117001. [Google Scholar] [CrossRef]
- Mohamad, G.; Lourenço, P.B.; Roman, H.R. Mechanics of hollow concrete block masonry prisms under compression: Review and prospects. Cem. Concr. Compos. 2007, 29, 181–192. [Google Scholar] [CrossRef]
- Janaraj, T.; Dhanasekar, M. Effectiveness of two forms of grouted reinforced confinement methods to hollow concrete masonry panels. J. Mater. Civ. Eng. 2015, 27, 04015038. [Google Scholar] [CrossRef]
- Dhanasekar, M.; Shrive, N.G. Strength and deformation of confined and unconfined grouted concrete masonry. ACI Struct. J. 2002, 99, 819–826. [Google Scholar]
- Bolhassani, M.; Hamid, A.A.; Johnson, C.; Moon, F.L.; Schultz, A.E. New design detail to enhance the seismic performance of ordinary reinforced partially grouted masonry structure. J. Struct. Eng. 2016, 142, 04016142. [Google Scholar] [CrossRef]
- Ramírez, P.; Sandoval, C.; Almazán, J.L. Experimental study on in-plane cyclic response of partially grouted reinforced concrete masonry shear walls. Eng. Struct. 2016, 126, 598–617. [Google Scholar] [CrossRef]
- Zhang, Z.; Murcia-Delso, J.; Sandoval, C.; Araya-Letelier, G.; Wang, F. In-plane shear strength and damage fragility functions for partially-grouted reinforced masonry walls with bond-beam reinforcement. Eng. Struct. 2021, 242, 112569. [Google Scholar]
- Shedid, M.T.; El-Dakhakhni, W.W.; Drysdale, R.G. Seismic performance parameters of reinforced concrete-block shear wall construction. J. Perform. Constr. Facil. 2010, 24, 4–18. [Google Scholar]
- Voon, K.C.; Ingham, J.M. Experimental in-plane shear strength investigation of reinforced concrete masonry walls. J. Struct. Eng. 2006, 132, 400–408. [Google Scholar]
- Zhang, Z.; Wang, F.; Chi, B. Seismic performance of shear-critical prefabricated reinforced masonry shear walls with innovative vertical joint connections. Eng. Struct. 2020, 219, 110958. [Google Scholar]
- ElDin, H.M.S.; Galal, K. Effect of reinforcement anchorage end detail and spacing on seismic performance of masonry shear walls. Eng. Struct. 2018, 157, 268–279. [Google Scholar] [CrossRef]
- ElDin, H.M.S.; Ashour, A.; Galal, K. Seismic performance parameters of fully grouted reinforced masonry squat shear walls. Eng. Struct. 2019, 187, 518–527. [Google Scholar] [CrossRef]
- Silva, L.M.; Vasconcelos, G.; Lourenço, P.B. Innovative systems for earthquake-resistant masonry infill walls: Characterization of materials and masonry assemblages. J. Build. Eng. 2021, 39, 102195. [Google Scholar] [CrossRef]
- Kasapgil, S.M.; Binici, B.; Canbay, E. Seismic behavior of AAC infill walls insulated with cementitious lightweight panels in reinforced concrete frames. Eng. Struct. 2021, 248, 113215. [Google Scholar]
- Chi, B.; Yang, X.; Wang, F.; Zhang, Z.; Quan, Y. Experimental investigation of effect of section configuration on seismic performance of an innovative integrated concrete masonry wall system. Eng. Struct. 2020, 206, 110163. [Google Scholar]
- Markulak, D.; Dokšanović, T.; Radić, I.; Miličević, I. Structurally and environmentally favorable masonry units for infilled frames. Eng. Struct. 2018, 175, 753–764. [Google Scholar]
- Torres, B.; Ivorra, S.; Baeza, F.J.; Estevan, L.; Varona, B. Textile reinforced mortars (TRM) for repairing and retrofitting masonry walls subjected to in-plane cyclic loads. An experimental approach. Eng. Struct. 2021, 231, 111742. [Google Scholar] [CrossRef]
- Gao, Q.; Xiao, J.; Shen, J.; Hou, Y.; Guo, J. Properties of super-thin layer mortar with recycled brick fines for sintered perforated block masonry. Case Stud. Constr. Mater. 2023, 18, e02015. [Google Scholar]
- Hasnat, A.; Das, T.; Ahsan, R.; Alam, A.T.; Ahmed, H. In-plane cyclic response of unreinforced masonry walls retrofitted with ferrocement. Case Stud. Constr. Mater. 2022, 17, e01630. [Google Scholar]
- Qiao, Q.; Ding, R.; Liu, W.; Cao, W. Experimental study on seismic behavior of masonry walls retrofitted with steel-member and high-performance polymer mortar. J. Build. Eng. 2023, 75, 106940. [Google Scholar]
- Xin, R.; Ma, P. Experimental investigation on the in-plane seismic performance of damaged masonry walls repaired with grout-injected ferrocement overlay. Constr. Build. Mater. 2021, 282, 122565. [Google Scholar] [CrossRef]
- Kohail, M.; Elshafie, H.; Rashad, A.; Okail, H. Behavior of post-tensioned dry-stack interlocking masonry shear walls under cyclic in-plane loading. Constr. Build. Mater. 2018, 196, 539–554. [Google Scholar] [CrossRef]
- Hassanli, R.; ElGawady, M.A.; Mills, J.E. Experimental investigation of in-plane cyclic response of unbonded posttensioned masonry walls. J. Struct. Eng. 2016, 142, 04015171-1. [Google Scholar] [CrossRef]
- Rosenboom, O.A.; Kowalsky, M.J. Reversed in-plane cyclic behavior of posttensioned clay brick masonry walls. J. Struct. Eng. 2004, 130, 787–798. [Google Scholar] [CrossRef]
- Wight, G.D.; Ingham, J.M.; Wilton, A.R. Innovative seismic design of a post-tensioned concrete masonry house. Can. J. Civ. Eng. 2007, 34, 1393–1402. [Google Scholar] [CrossRef]
- Hassanli, R. In-plane flexural response of self-centering masonry walls (SMWs). Arch. Civ. Mech. Eng. 2021, 21, 63. [Google Scholar]
- Kalliontzis, D.; Schultz, A.E. Characterizing the in-plane rocking response of masonry walls with unbonded posttensioning. J. Struct. Eng. 2017, 143, 04017110. [Google Scholar] [CrossRef]
- Laursen, P.T.; Ingham, J.M. Structural testing of single-storey post-tensioned concrete masonry walls. TMS J. 2001, 19, 69–82. [Google Scholar]
- Guo, Z.; Zheng, S.; Xu, Z.; Sun, W. Experimental study on seismic performance of ungrouted confined concrete masonry walls with unbonded tendons. Int. J. Civ. Eng. 2019, 17, 333–346. [Google Scholar]
- Yassin, A.; Wiebe, L.; Ezzeldin, M. Seismic design and performance evaluation of controlled rocking masonry shear walls without posttensioning. J. Struct. Eng. 2022, 148, 04022059. [Google Scholar] [CrossRef]
- Yassin, A.; Ezzeldin, M.; Wiebe, L. Experimental assessment of resilient controlled rocking masonry walls with replaceable energy dissipation. J. Struct. Eng. 2023, 149, 04022260. [Google Scholar] [CrossRef]
- East, M.; Yassin, A.; Ezzeldin, M.; Wiebe, L. Development of controlled rocking masonry walls with energy dissipation accessible in a steel base. J. Struct. Eng. 2023, 149, 04023032. [Google Scholar] [CrossRef]
- Kalliontzis, D.; Schultz, A.E.; Sritharan, S. Unbonded post-tensioned structural masonry wall with rubber interface for limited-damage systems. J. Struct. Eng. 2022, 148, 04021223. [Google Scholar] [CrossRef]
- GB 50003-2011; Code for Design of Masonry Structures. China Architecture and Building Press: Beijing, China, 2011. (In Chinese)
- GB 50010-2010; Code for Design of Concrete Structures. China Architecture and Building Press: Beijing, China, 2010. (In Chinese)
- GB/T 50129-2011; Standard for Test Method of Basic Mechanics Properties of Masonry. China Architecture and Building Press: Beijing, China, 2011. (In Chinese)
- GB/T 11969-2008; Test Methods of Autoclaved Aerated Concrete. China Quality Inspection Press: Beijing, China, 2008. (In Chinese)
- Chalarca, B.; Bedoya-Ruiz, D.; Herrera, J.P. Experimental behavior and seismic performance assessment of Unbonded Post-tensioned Precast Concrete Walls for low-rise buildings. Eng. Struct. 2023, 289, 116251. [Google Scholar] [CrossRef]
- Lopez, A.; Bazaez, R.; Leiva, G.; Loyola, R.; Gómez, M. Experimental study of in-plane flexural behavior of screen-grid insulated concrete form rectangular and T-shaped walls. Eng. Struct. 2021, 247, 113128. [Google Scholar]
- Zhou, Y.; Chen, Z.; Zhong, G. Investigation on the seismic performance of the masonry infill wall with damping layer joint. Eng. Struct. 2023, 285, 115979. [Google Scholar] [CrossRef]
- Haach, V.G.; Vasconcelos, G.; Lourenço, P.B. Experimental analysis of reinforced concrete block masonry walls subjected to in-plane cyclic loading. J. Struct. Eng. 2010, 136, 452–462. [Google Scholar] [CrossRef]
- Ke, X.-J.; Qin, Y.; Chen, S.-J.; Li, N. Seismic performance and shear lag effect of T-shaped steel plate reinforced concrete composite shear wall. Eng. Struct. 2023, 289, 116303. [Google Scholar] [CrossRef]
- Wang, L.; Tang, Z.-Y.; Li, Y.; Qian, K. Seismic behavior of masonry-infilled precast concrete frames considering effects of opening. Constr. Build. Mater. 2019, 211, 756–770. [Google Scholar] [CrossRef]
- El-Dakhakhni, W.W.; Banting, B.R.; Miller, S.C. Seismic performance parameter quantification of shear-critical reinforced concrete masonry squat walls. J. Struct. Eng. 2013, 139, 957–973. [Google Scholar] [CrossRef]


| Specimen | Load-Bearing | In-Fill | Reinforcement Configuration | Prestress (MPa) | |||||
|---|---|---|---|---|---|---|---|---|---|
| Length (mm) | Width (mm) | Height (mm) | Flange (mm) | Length (mm) | Vertical | Horizontal | Spiral | ||
| IMFP | 590 | 190 | 1600 | 0 | 600 | 6C16 | 2A6@400 | A6@70 | 0.453 |
| IMFTP | 590 | 190 | 1600 | 590 | 600 | 4C14 + 6C16 | 2A6@400 | A6@70 | 0.453 |
| Rectangular Section | T-Shaped Section | ||
|---|---|---|---|
| Prestress (MPa) | 0.453 | 0.453 | |
| Sectional area (m2) | 0.1121 | 0.1181 | |
| Tensile force (kN) | P1 | 25.4 | 29.8 |
| P2 | 25.4 | 25.5 | |
| P3 | – | 29.8 | |
| Tensile stress (MPa) | P1 | 126.4 | 193.7 |
| P2 | 126.4 | 126.9 | |
| P3 | – | 193.7 | |
| Material | Property | Testing Sample | Mean Value (MPa) | c.o.v |
|---|---|---|---|---|
| Concrete block prism | Compression strength |  | 18.4 | 0.02 |
| Concrete | Compression strength |  | 29.8 | 0.04 |
| Mortar | Compression strength |  | 11.8 | 0.04 |
| AAC block | Compression strength |  | 2.3 | 0.04 |
| Deformed bars | Yield strength |  | 458.4 | 0.01 |
| Ultimate strength | 648.2 | 0.01 | ||
| Plain bars | Yield strength |  | 226.5 | 0.07 |
| Ultimate strength | 255.4 | 0.09 |
| Specimen | Direction | DS1 | DS2 | DS3 | DS4 | ||||
|---|---|---|---|---|---|---|---|---|---|
| Q (kN) | DR (%) | Q (kN) | DR (%) | Q (kN) | DR (%) | Q (kN) | DR (%) | ||
| IMFP | + | +60 | +0.03 | +90 | +0.06 | +232 | +0.67 | +197 | +1.39 |
| − | −70 | −0.04 | −130 | −0.11 | −214 | −0.44 | −182 | −1.22 | |
| IMFTP | + | +70 | +0.03 | +140 | +0.09 | +306 | +0.67 | +260 | +1.56 |
| − | −70 | −0.03 | −100 | −0.04 | −264 | −0.89 | −225 | −2.11 | |
| Specimen | DS1 | DS2 | DS3 | DS4 | ||||
|---|---|---|---|---|---|---|---|---|
| Q (kN) | DR (%) | Q (kN) | DR (%) | Q (kN) | DR (%) | Q (kN) | DR (%) | |
| IMFP | +60 | +0.03 | +90 | +0.06 | +232 | +0.67 | +197 | +1.39 |
| IMFTP | +70 | +0.03 | +140 | +0.09 | +306 | +0.67 | +260 | +1.56 |
| IMF [18] | +60 | +0.06 | +70 | +0.07 | +191 | +0.66 | +162 | +1.56 |
| IMFT [18] | +60 | +0.03 | +80 | +0.06 | +304 | +0.88 | +258 | +1.66 |
Disclaimer/Publisher’s Note: The statements, opinions and data contained in all publications are solely those of the individual author(s) and contributor(s) and not of MDPI and/or the editor(s). MDPI and/or the editor(s) disclaim responsibility for any injury to people or property resulting from any ideas, methods, instructions or products referred to in the content. |
© 2024 by the authors. Licensee MDPI, Basel, Switzerland. This article is an open access article distributed under the terms and conditions of the Creative Commons Attribution (CC BY) license (https://creativecommons.org/licenses/by/4.0/).
Share and Cite
Chi, B.; Quan, Y.; Wang, F.; Yang, X. An Investigative Study for the Seismic Performance of Composite-Reinforced Masonry Wall with Prestressing Technology. Buildings 2024, 14, 264. https://doi.org/10.3390/buildings14010264
Chi B, Quan Y, Wang F, Yang X. An Investigative Study for the Seismic Performance of Composite-Reinforced Masonry Wall with Prestressing Technology. Buildings. 2024; 14(1):264. https://doi.org/10.3390/buildings14010264
Chicago/Turabian StyleChi, Bin, Yuhu Quan, Fenglai Wang, and Xu Yang. 2024. "An Investigative Study for the Seismic Performance of Composite-Reinforced Masonry Wall with Prestressing Technology" Buildings 14, no. 1: 264. https://doi.org/10.3390/buildings14010264