
Assessment of Soft-First-Floor Structures Reinforced by Rocking Frame Based on Seismic Resilience

Abstract
:1. Introduction
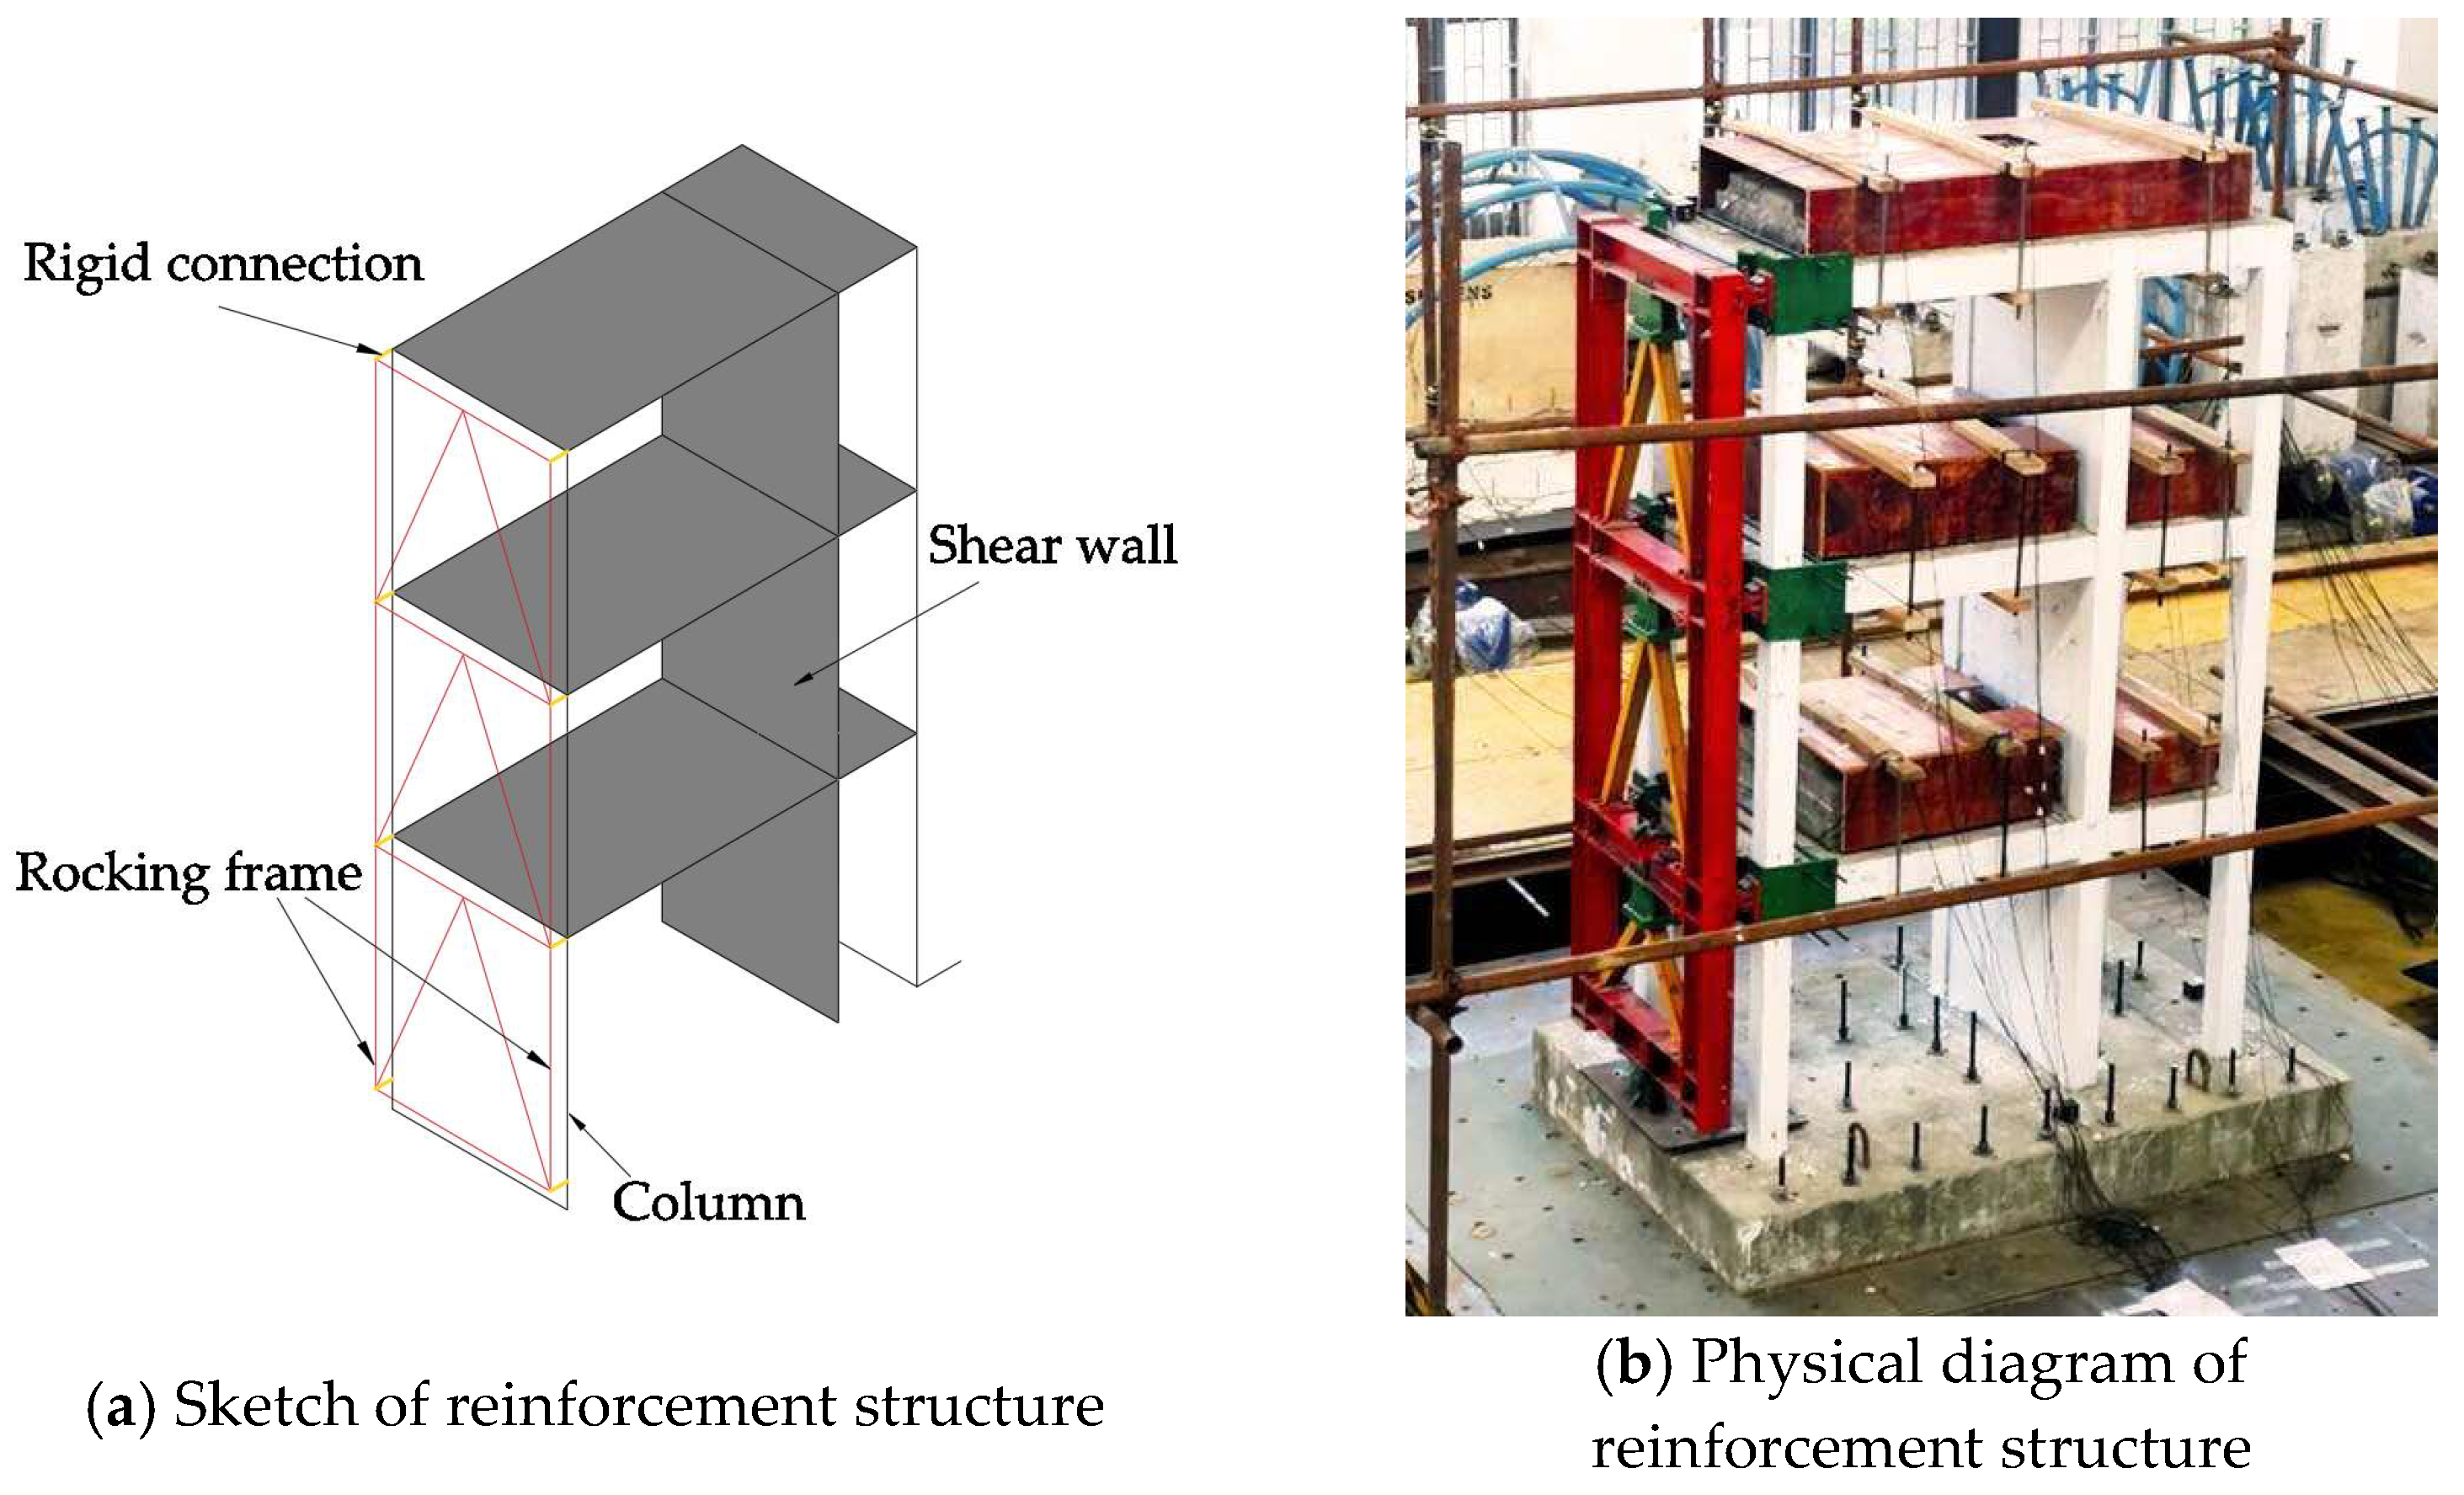
2. Rocking Frame Reinforcement
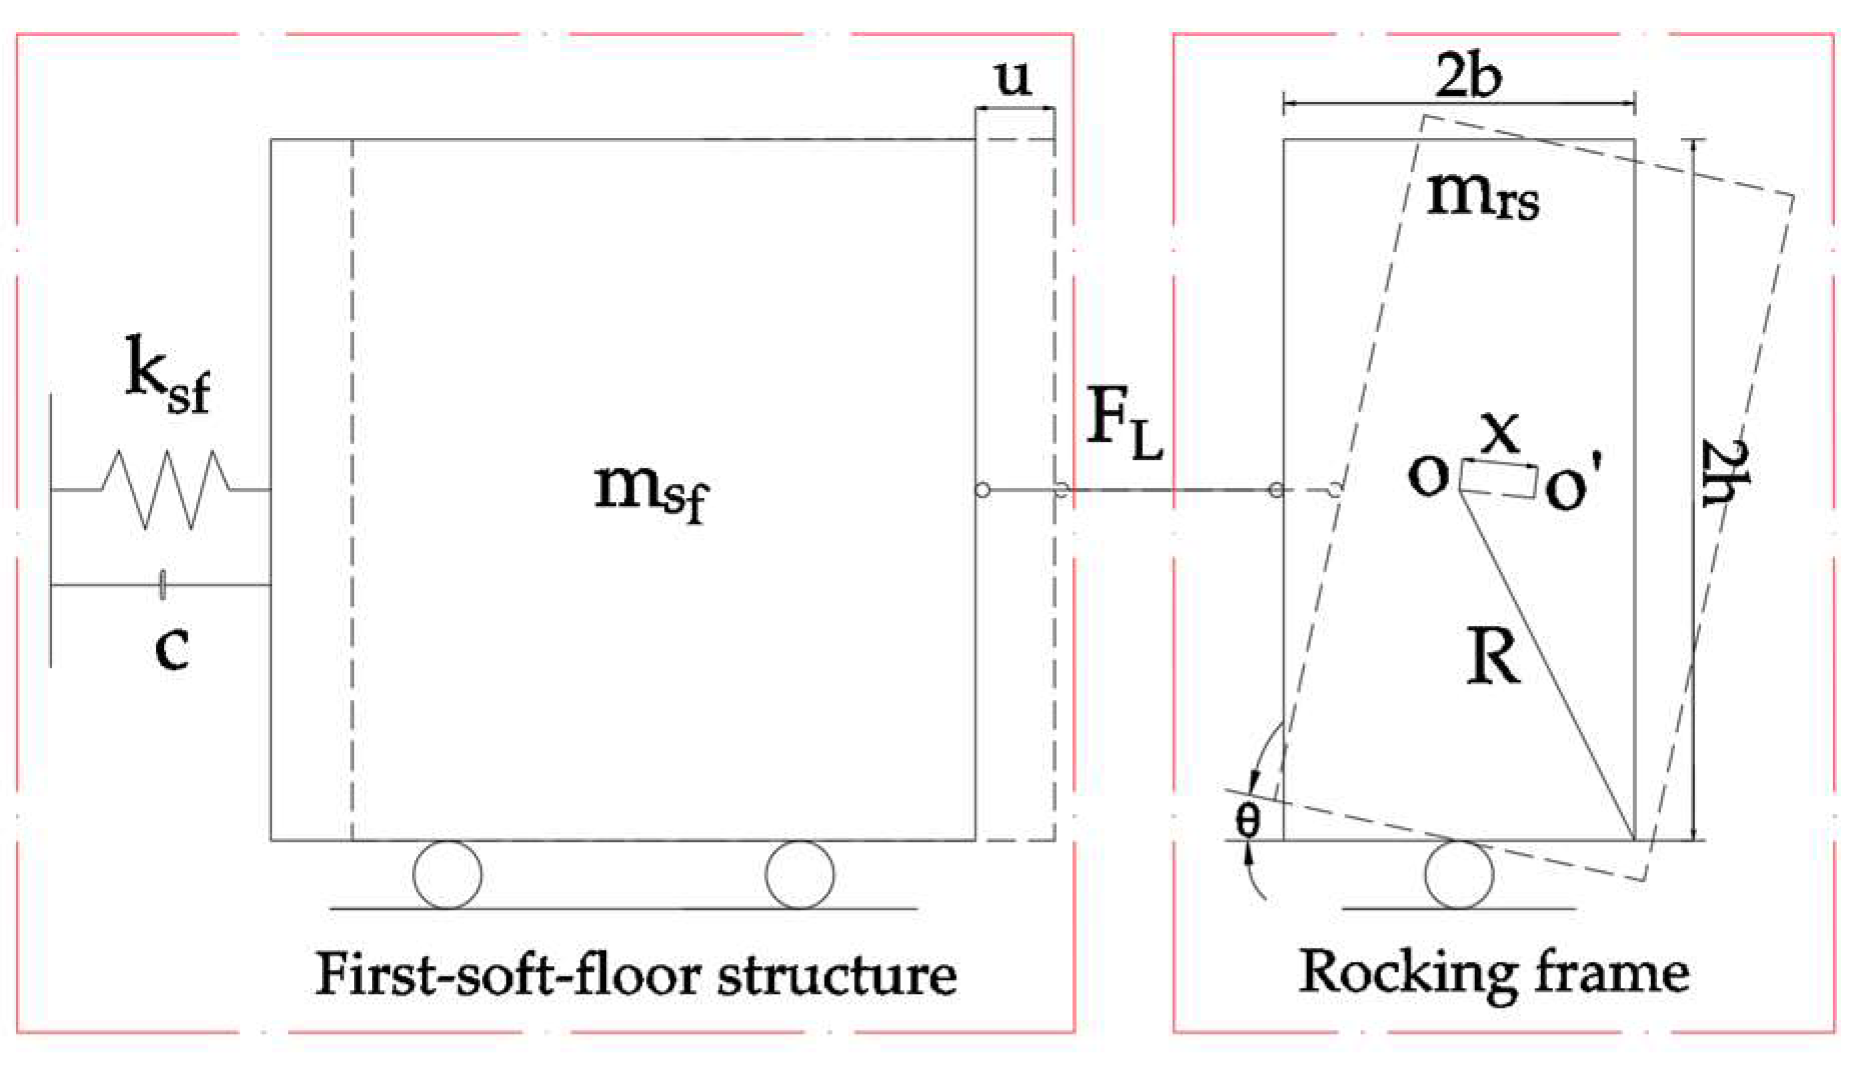
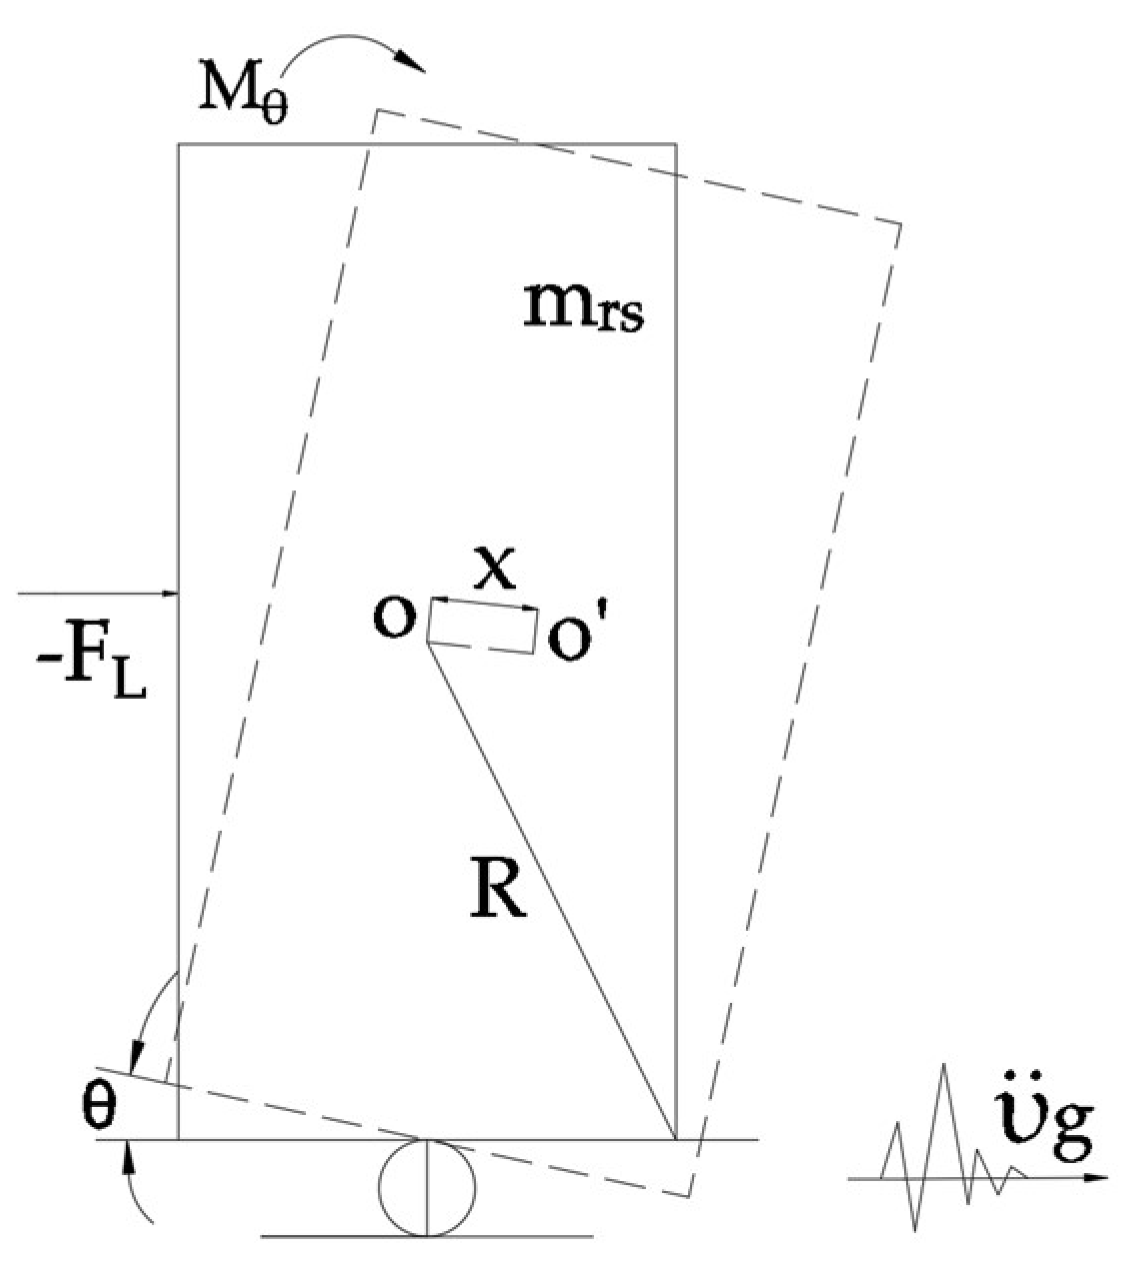
2.1. Control Mechanism of Rocking Frame Deformation
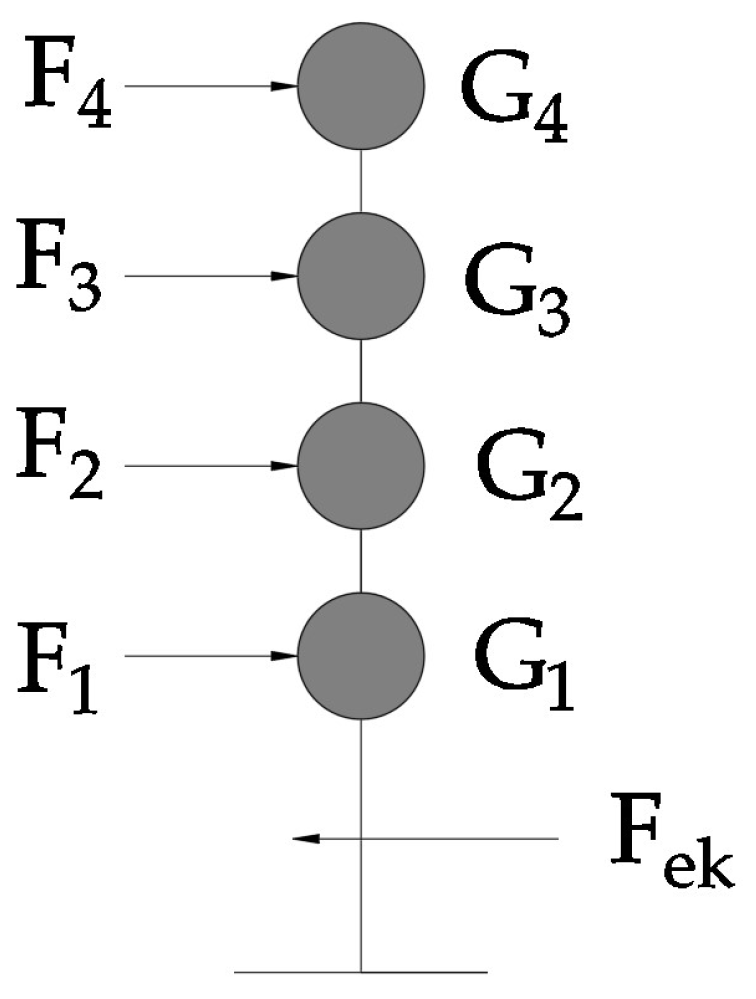
2.2. Rocking Frame Design Method
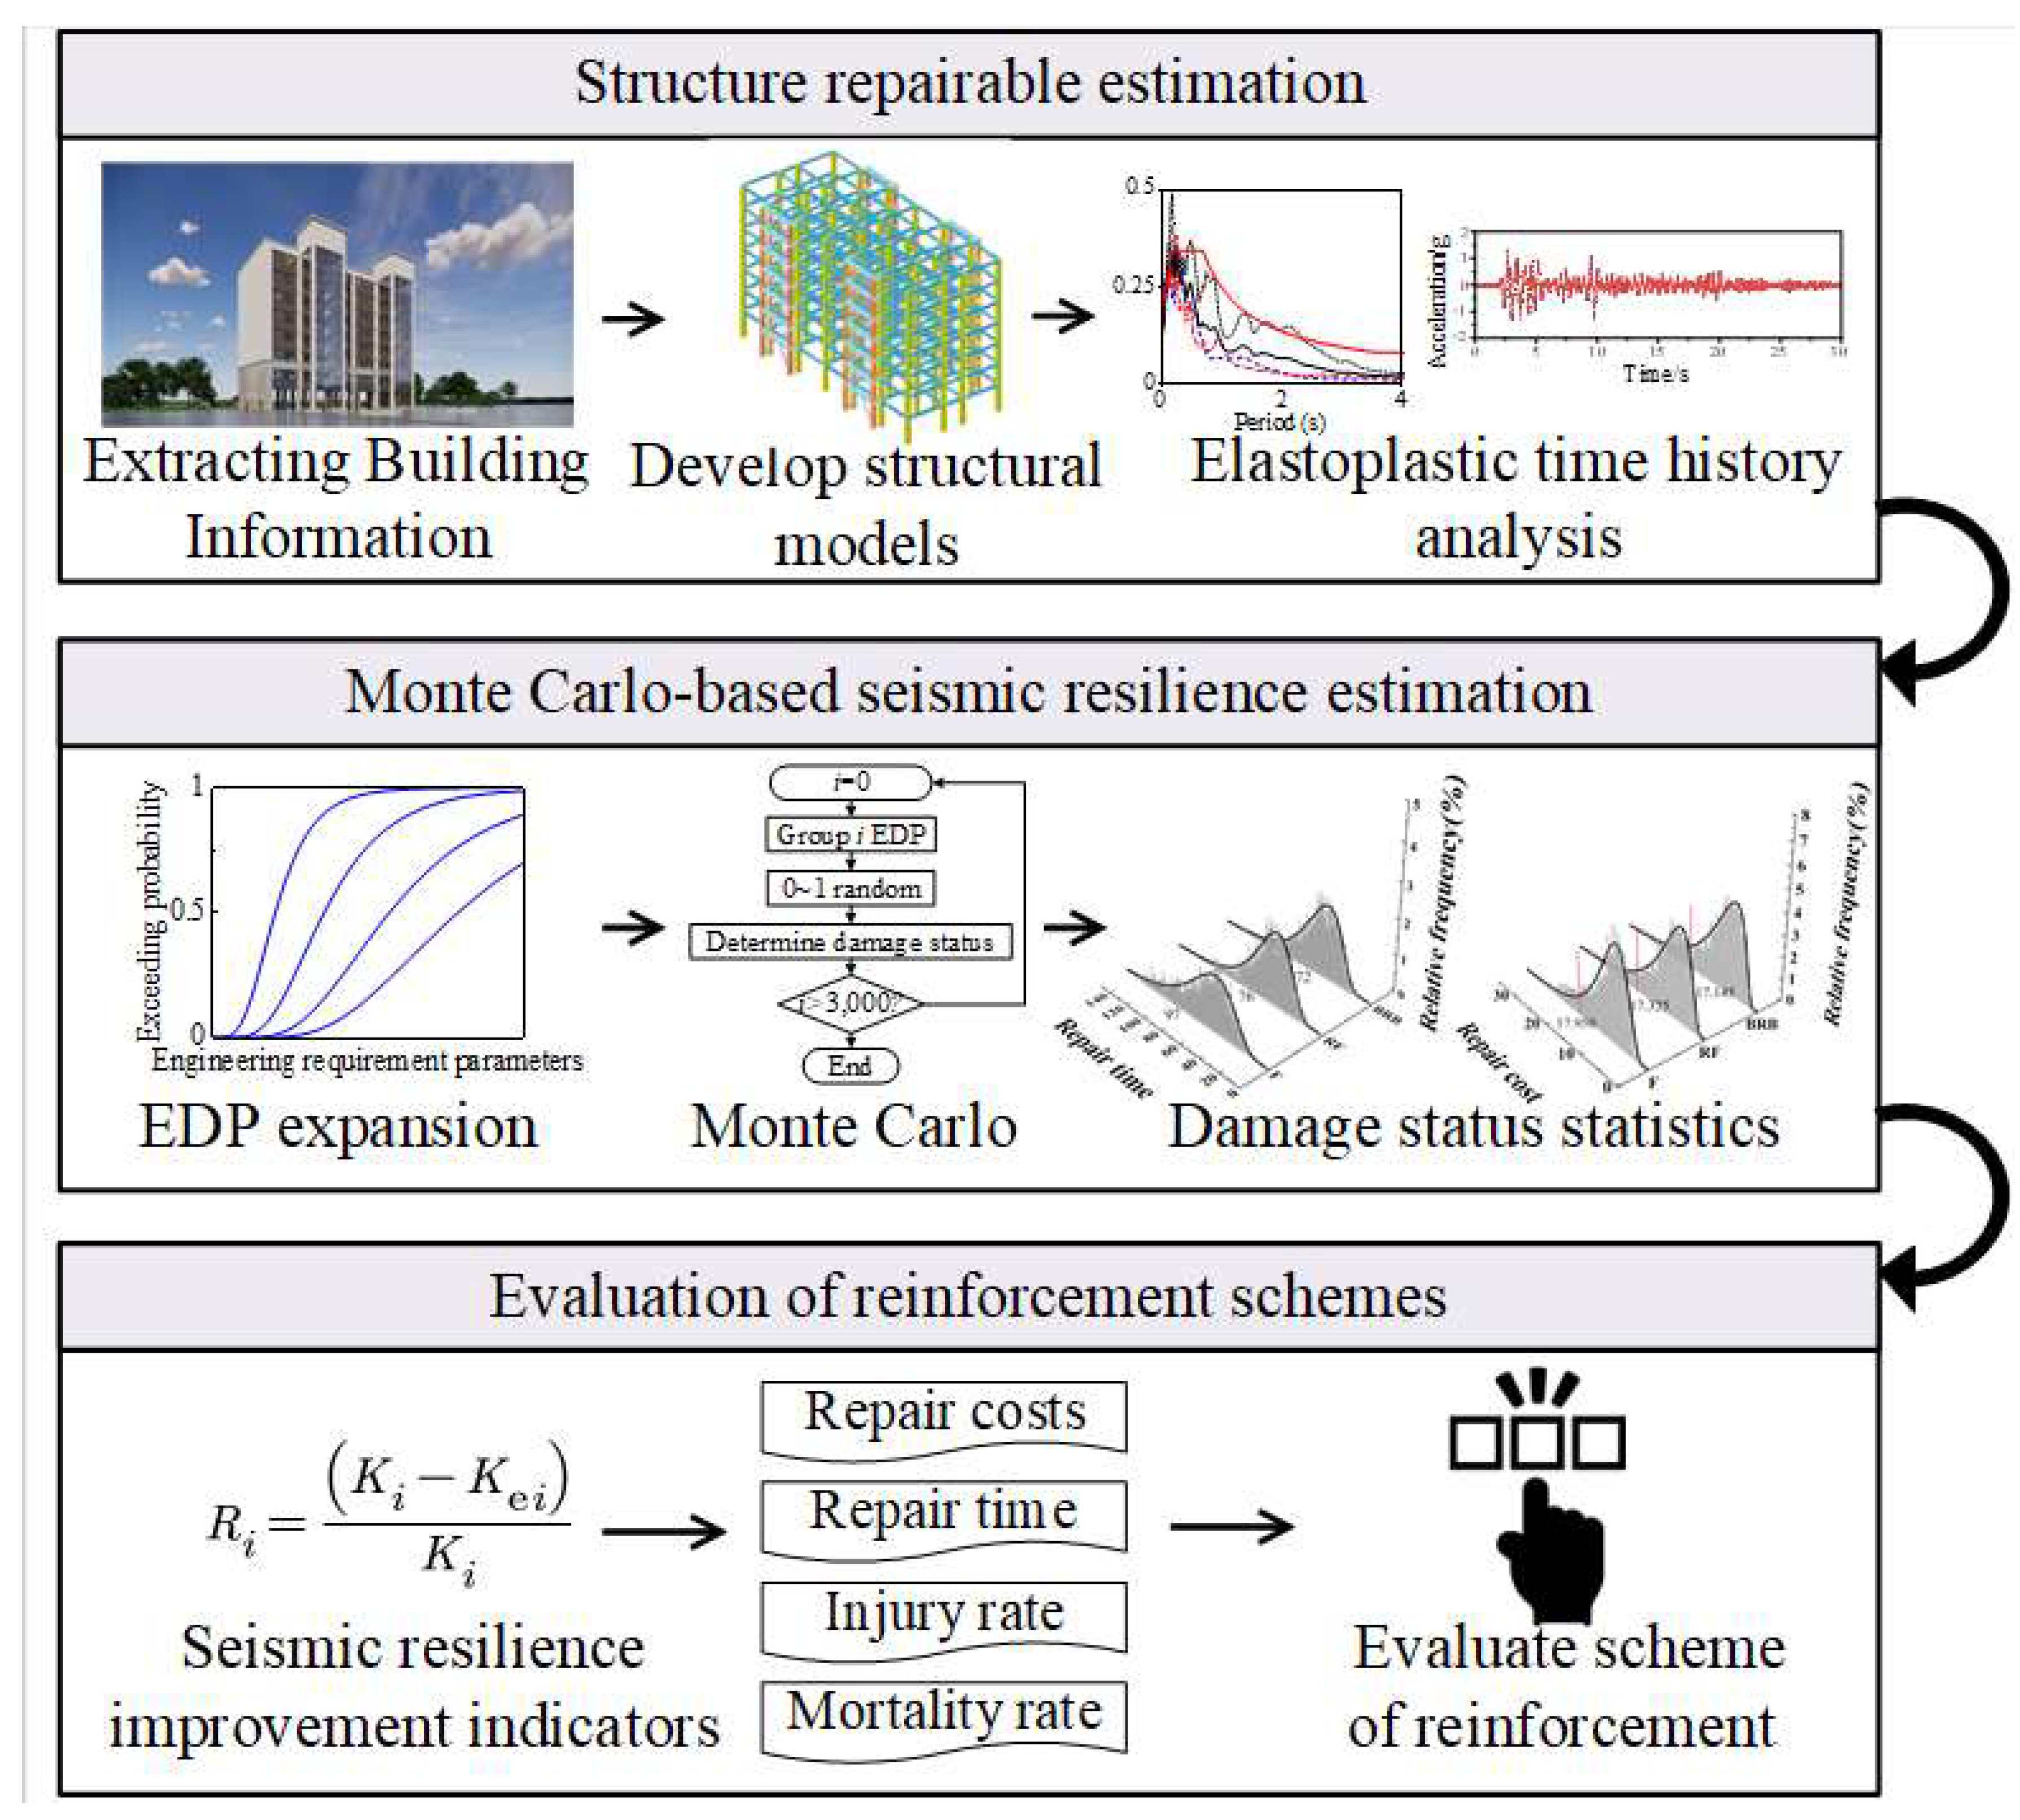
3. Evaluation Methodology of Reinforcement Scheme
3.1. Judgment of Structural Repairability
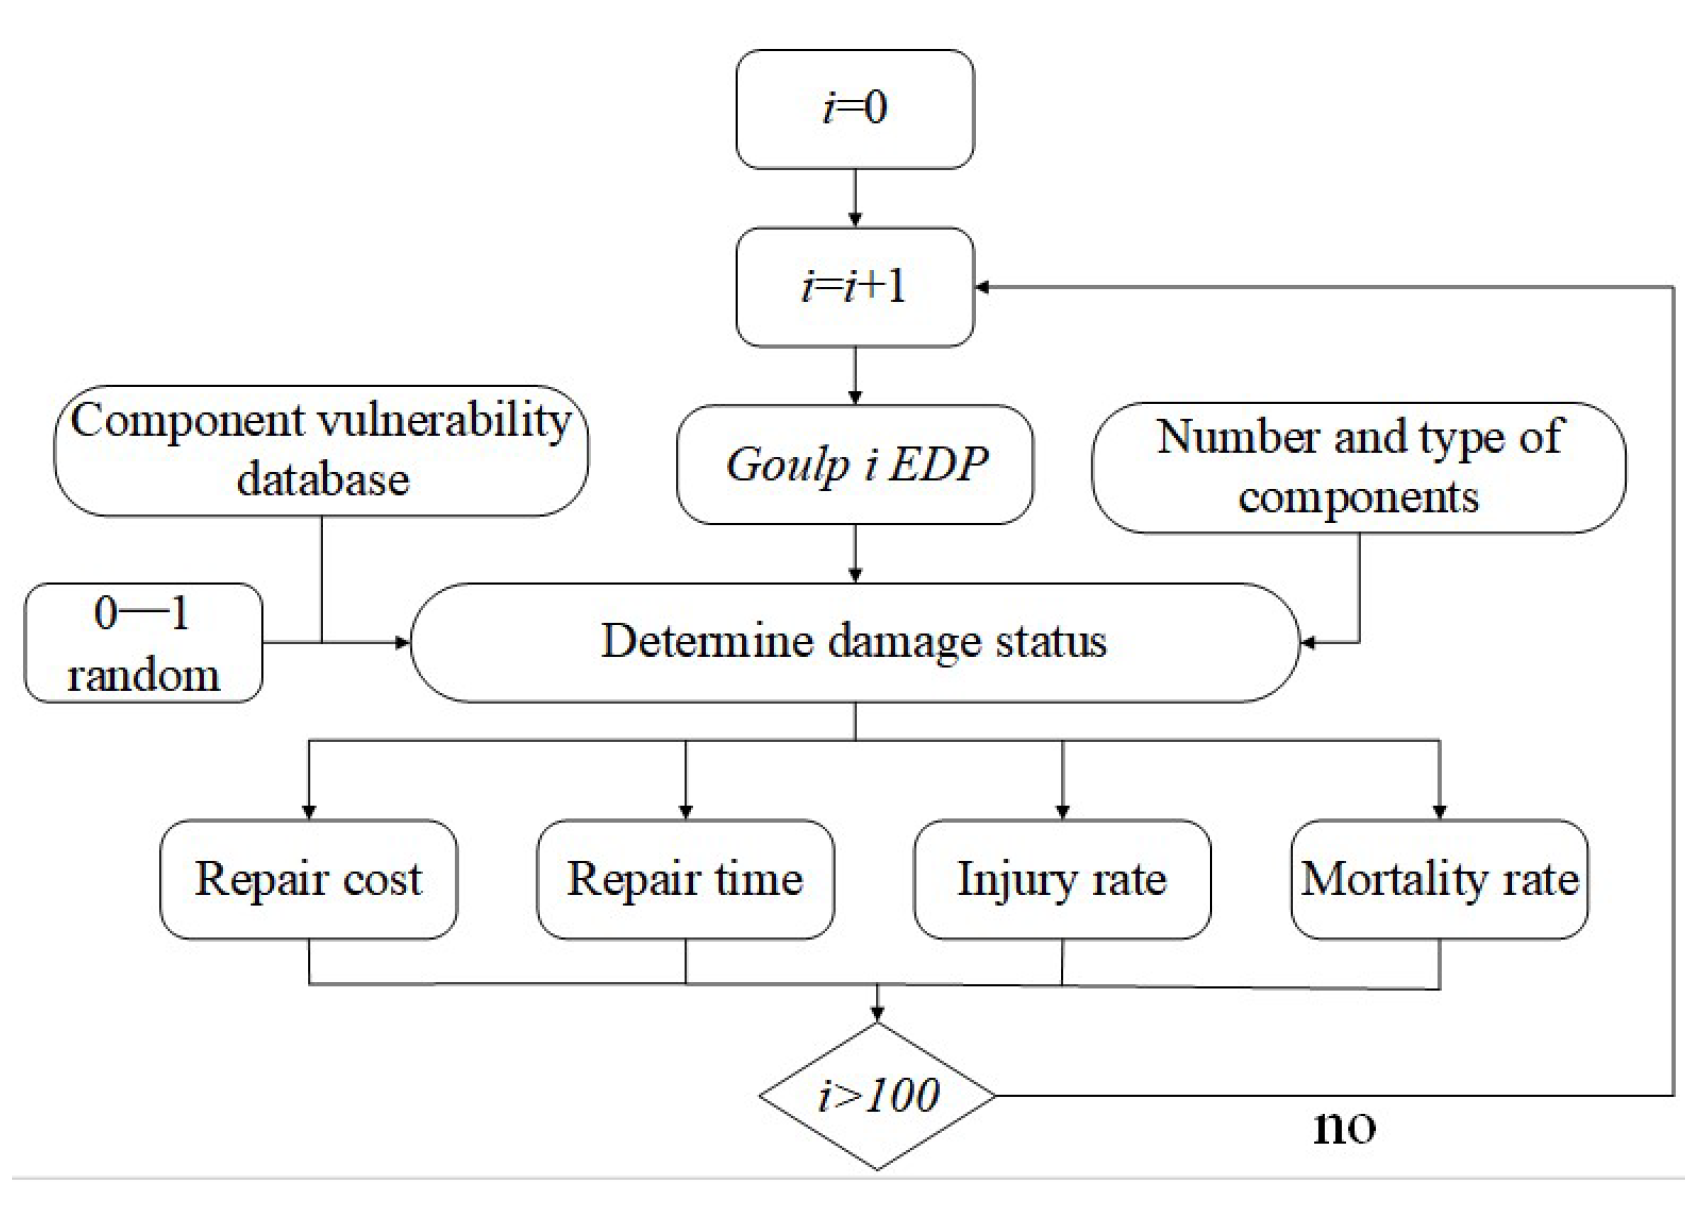
3.2. Calculation of Resilience Index
3.3. Evaluation of Reinforcement Scheme
4. Engineering Application
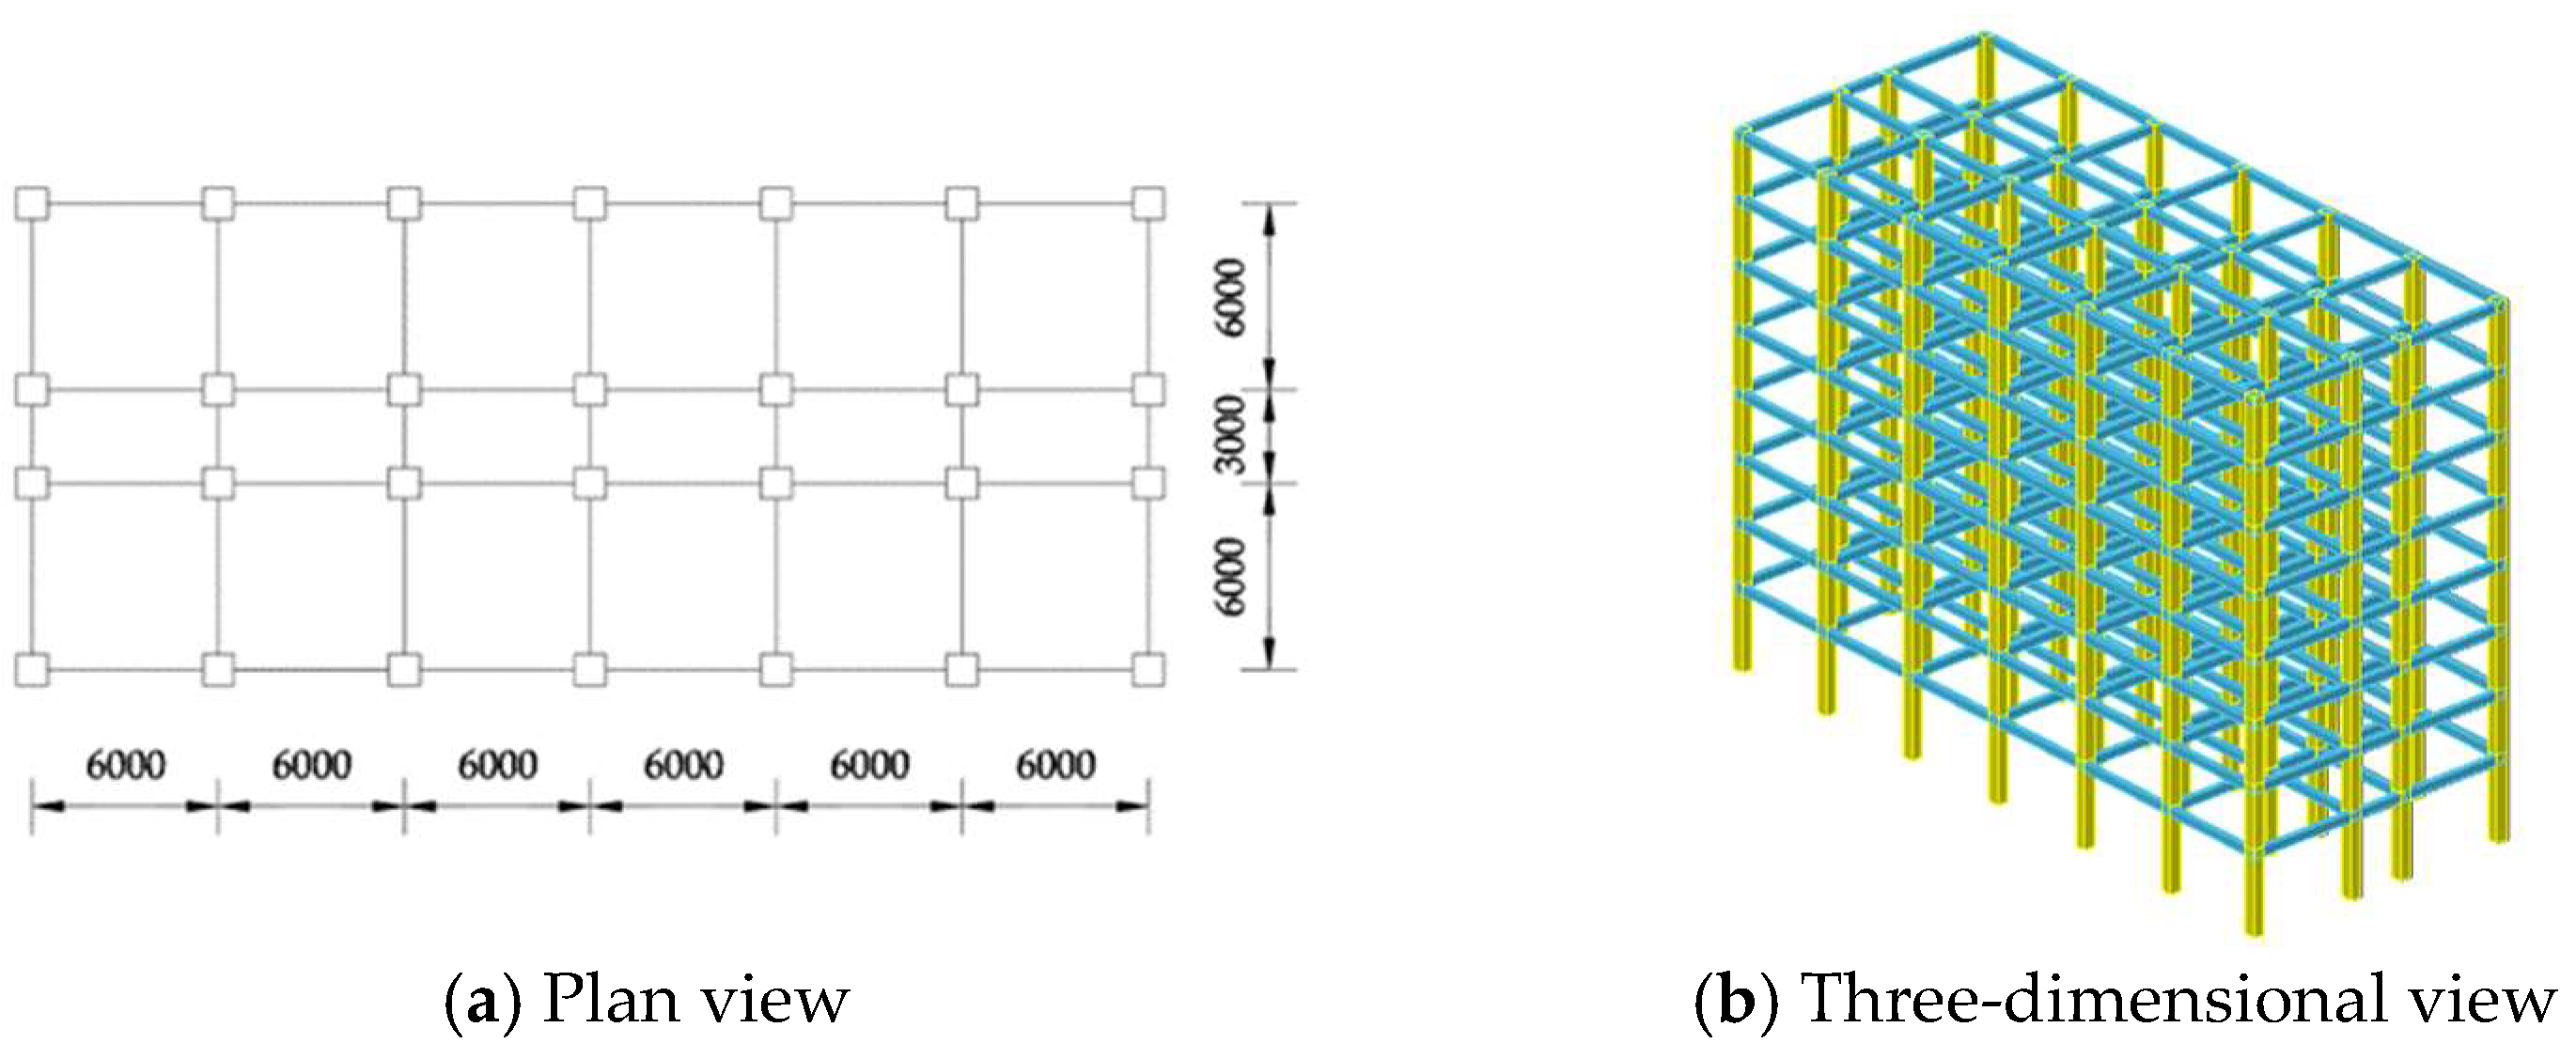
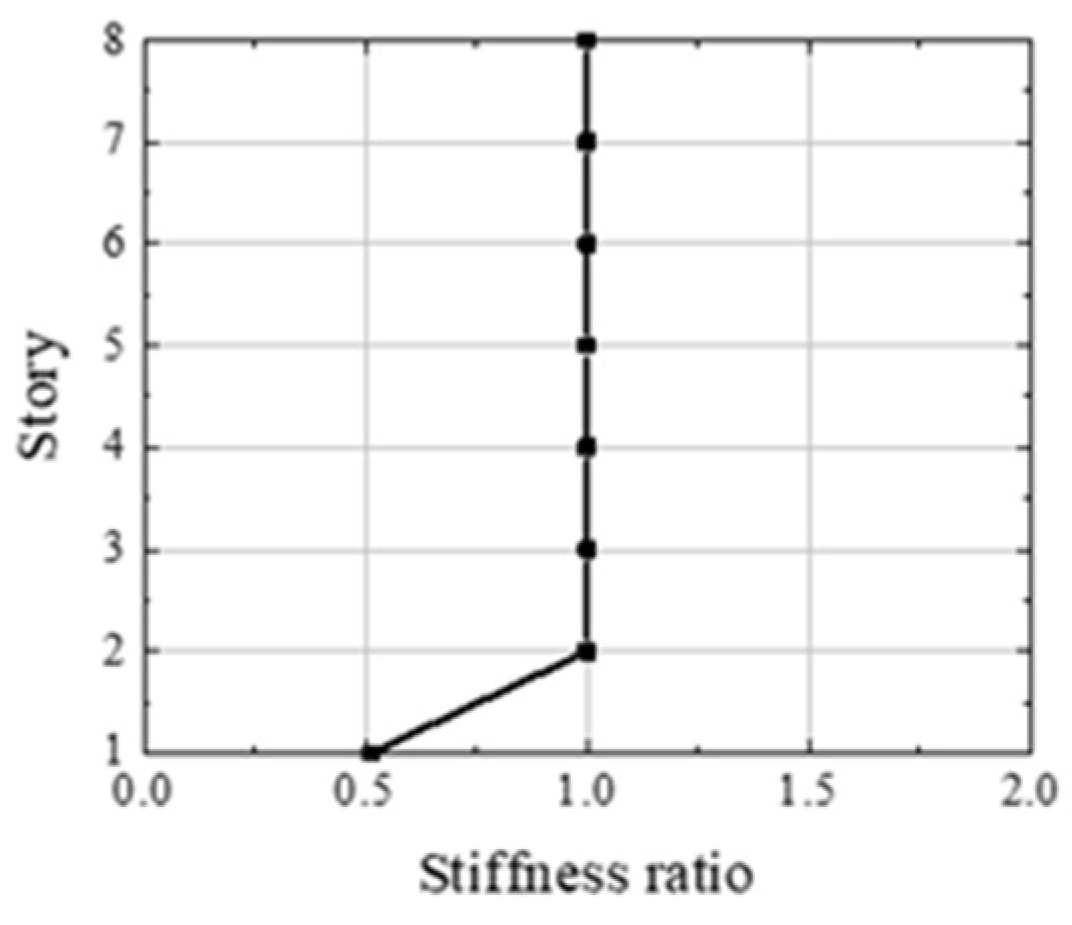
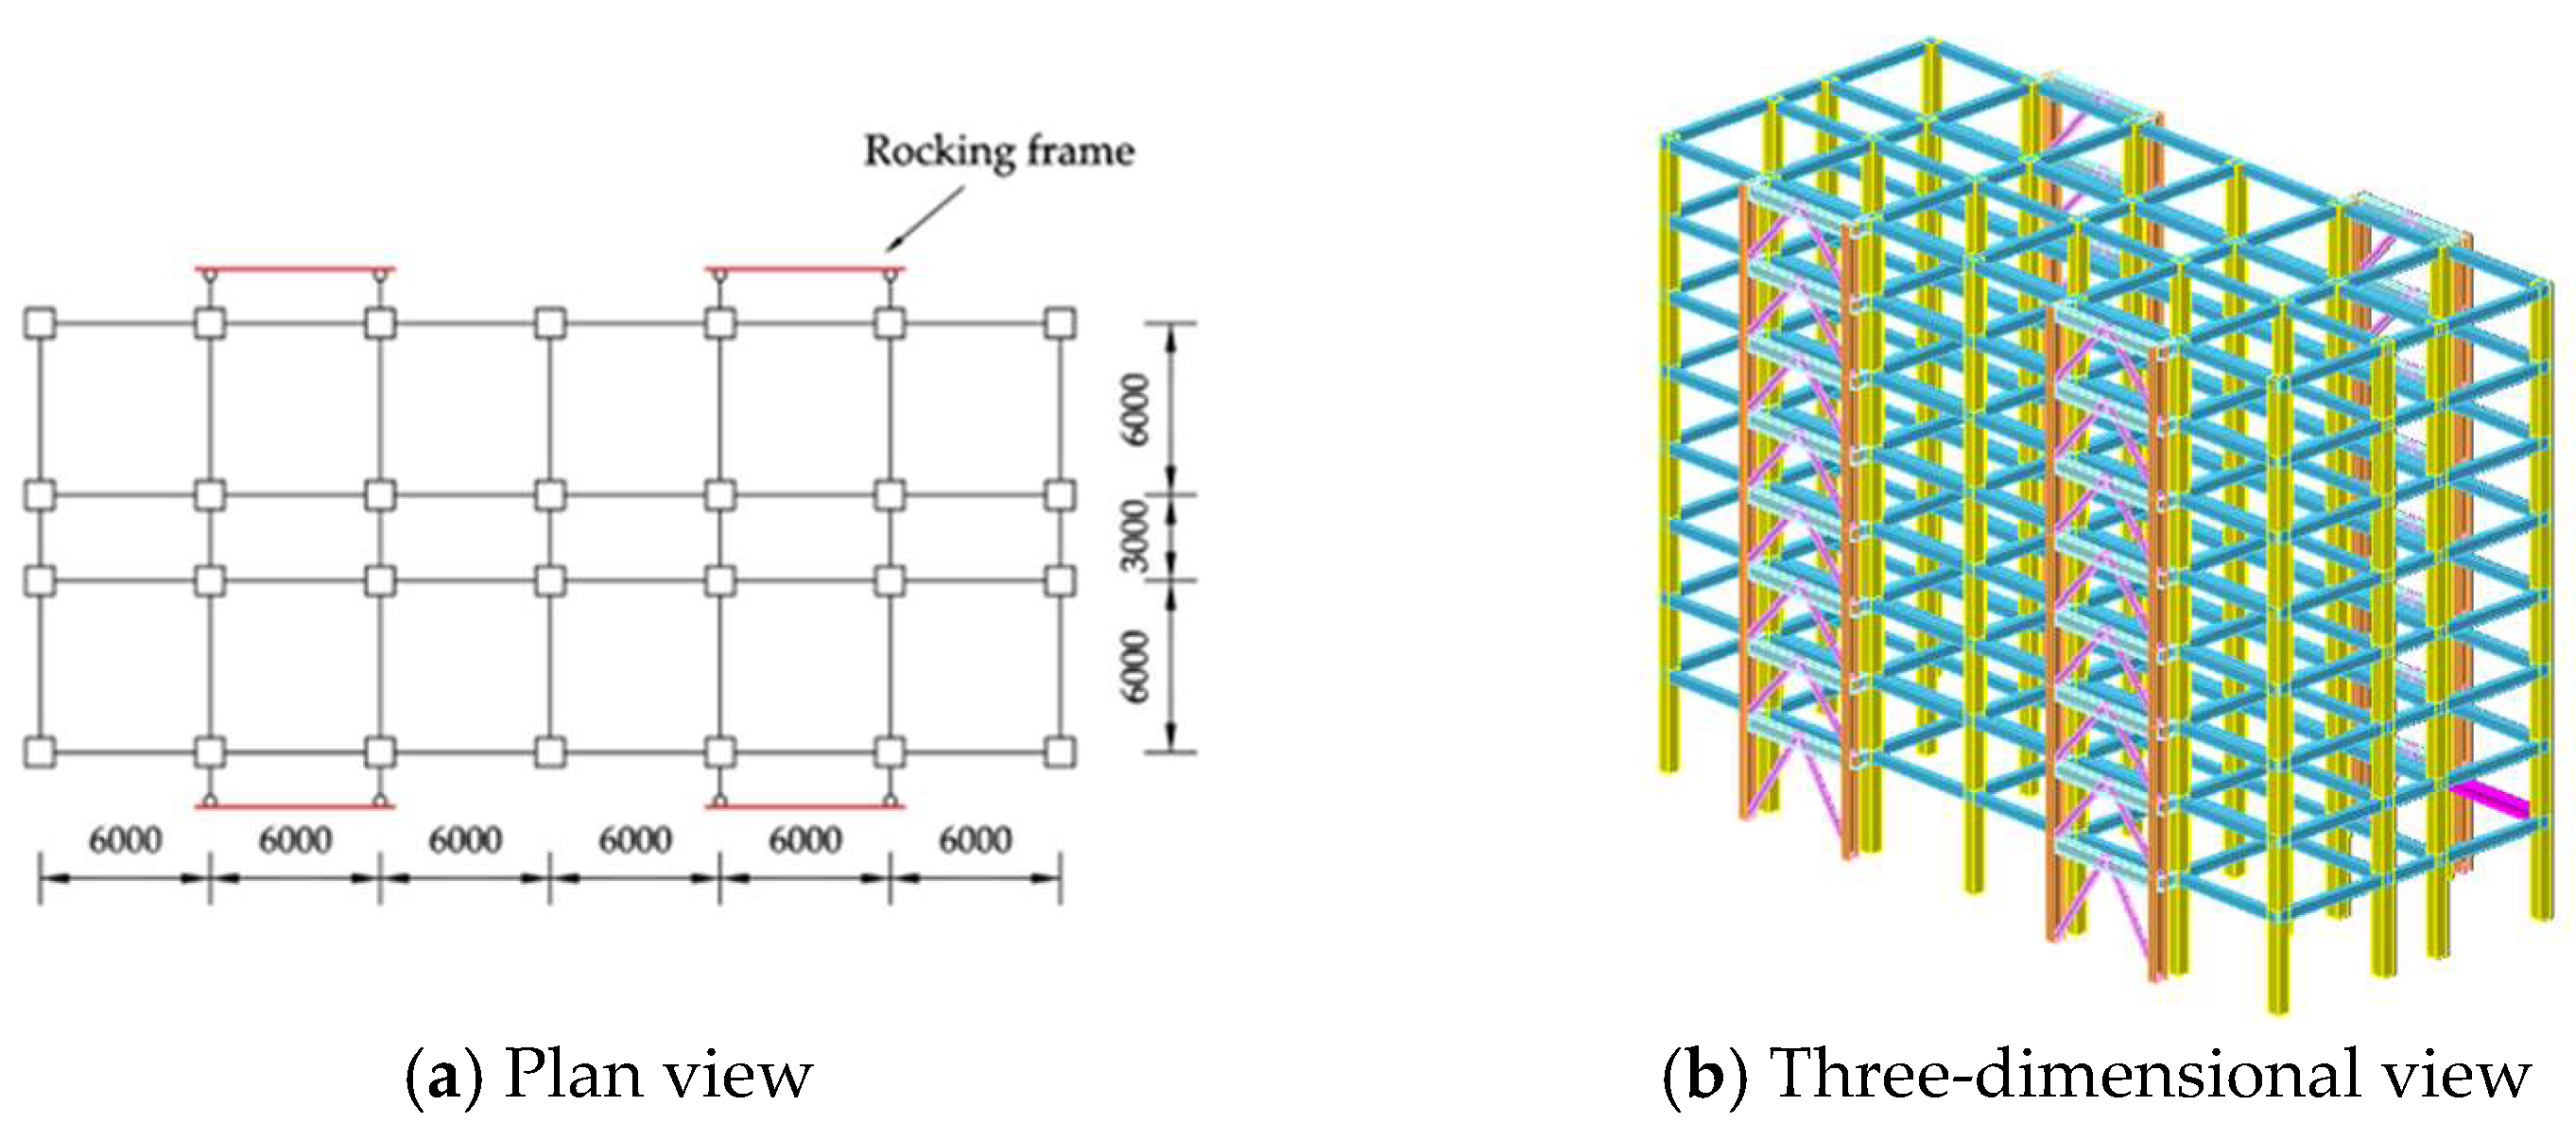
4.1. Introduction to Practical Engineering and Reinforcement Schemes
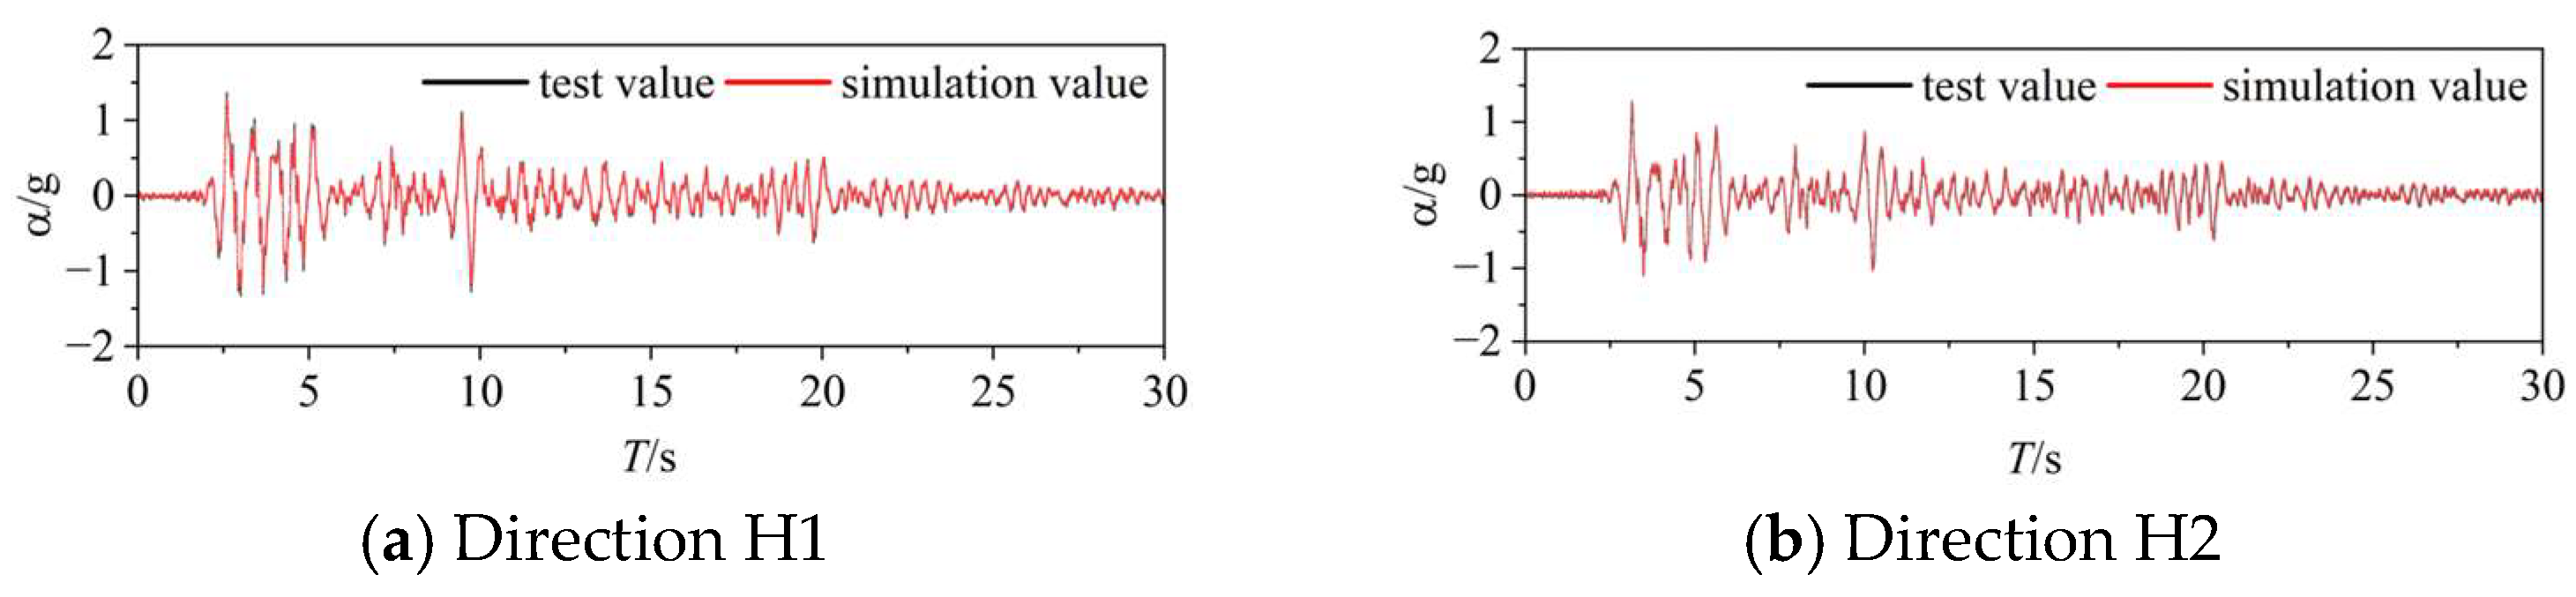
4.2. Model Buildup and Verification
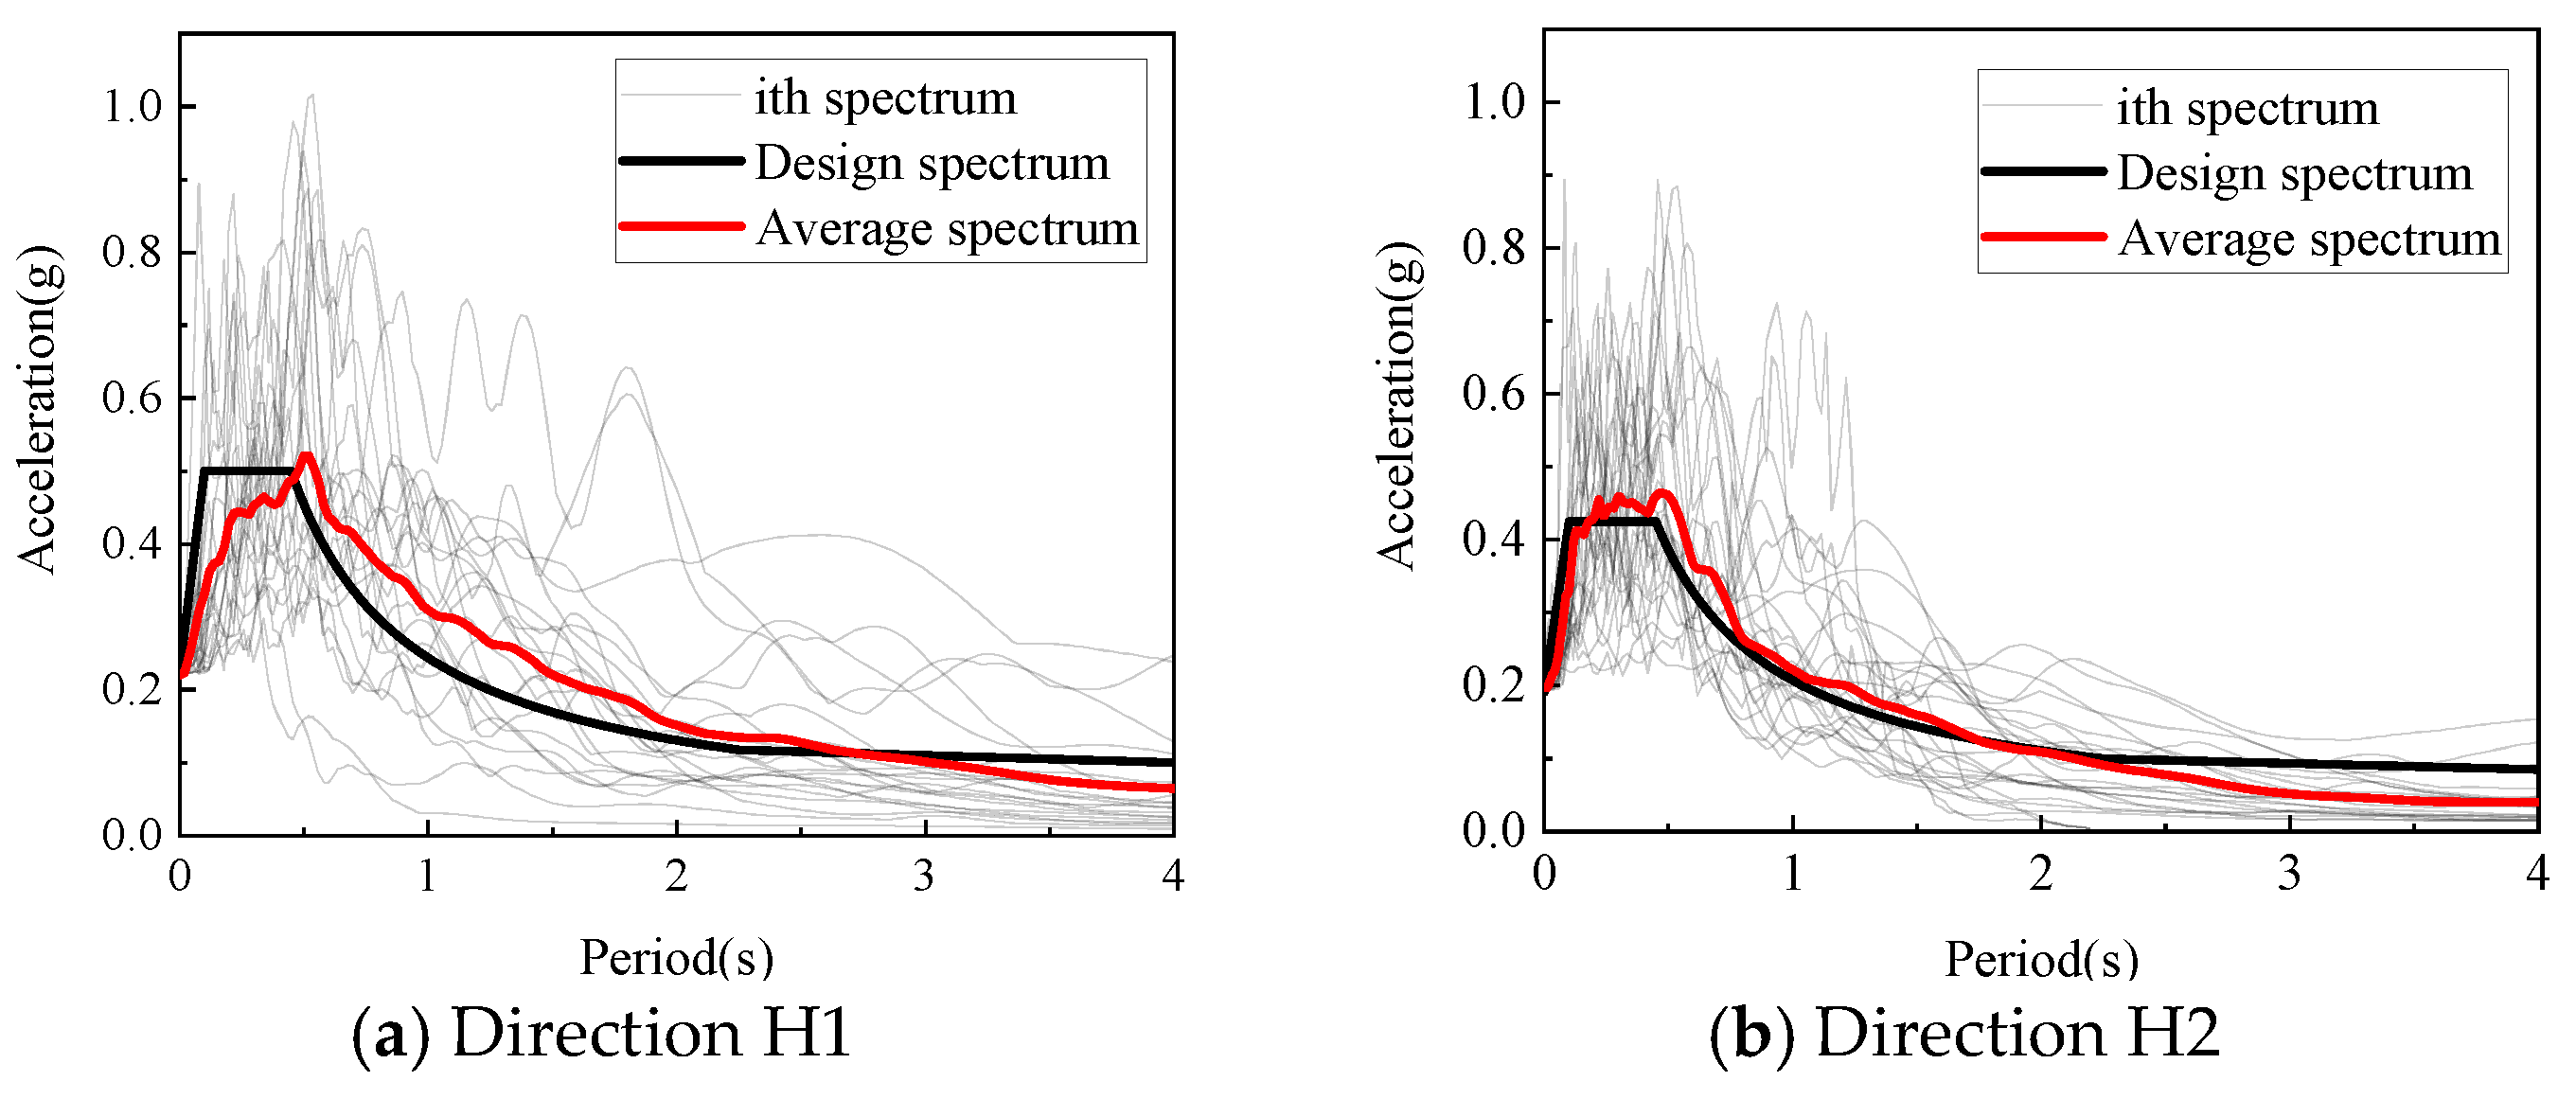
4.3. Selection of Seismic Waves
4.4. Evaluation of Reinforcement Scheme
4.4.1. Structural Repairability
4.4.2. Resilience Index
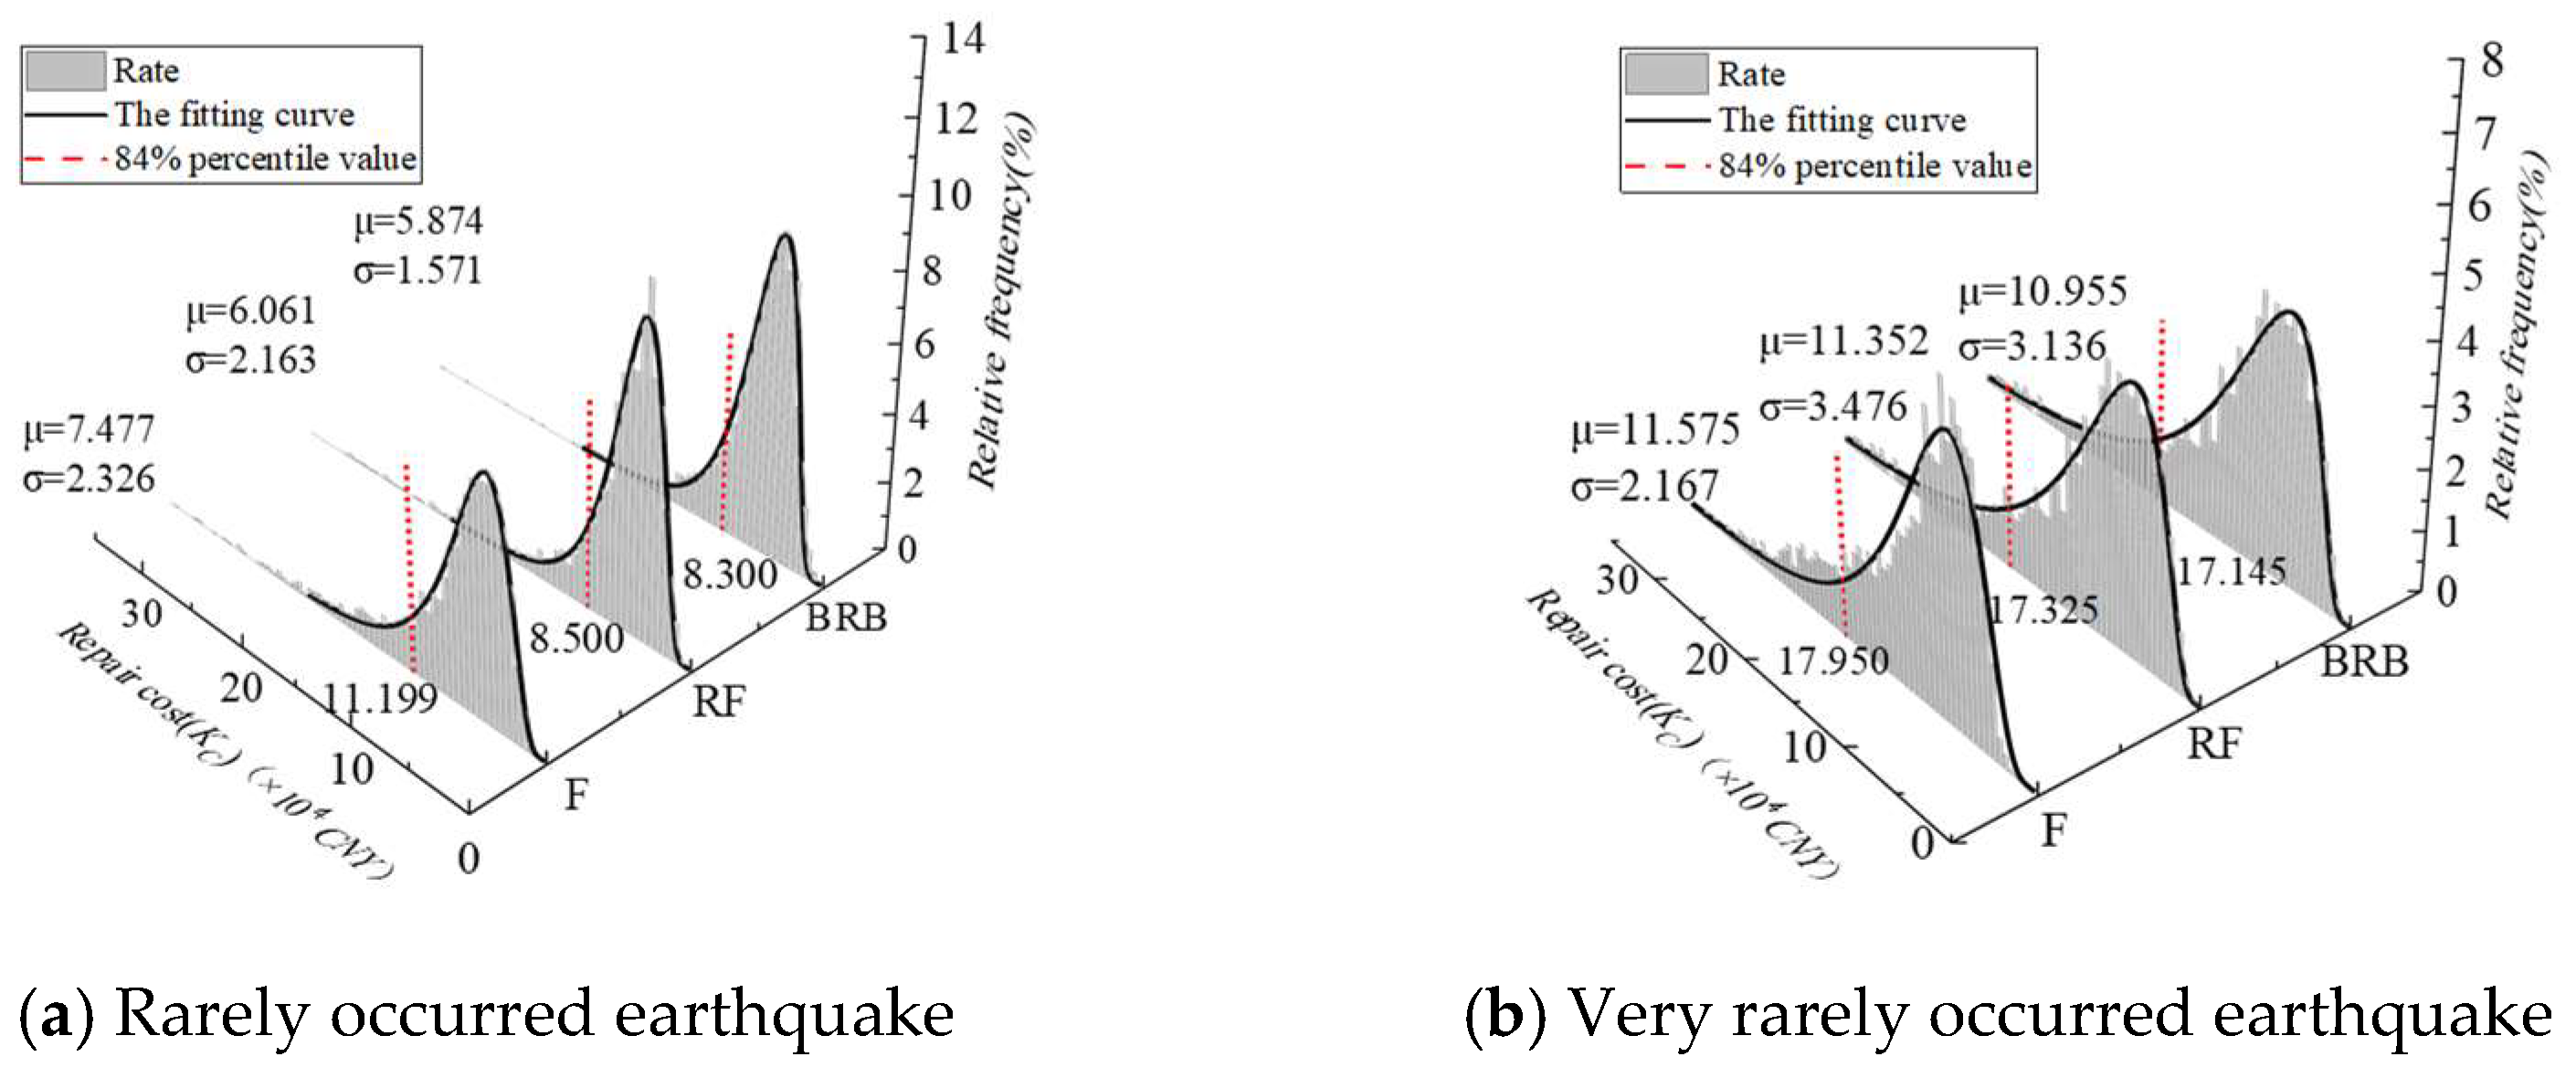
- (1)
- Repair costs
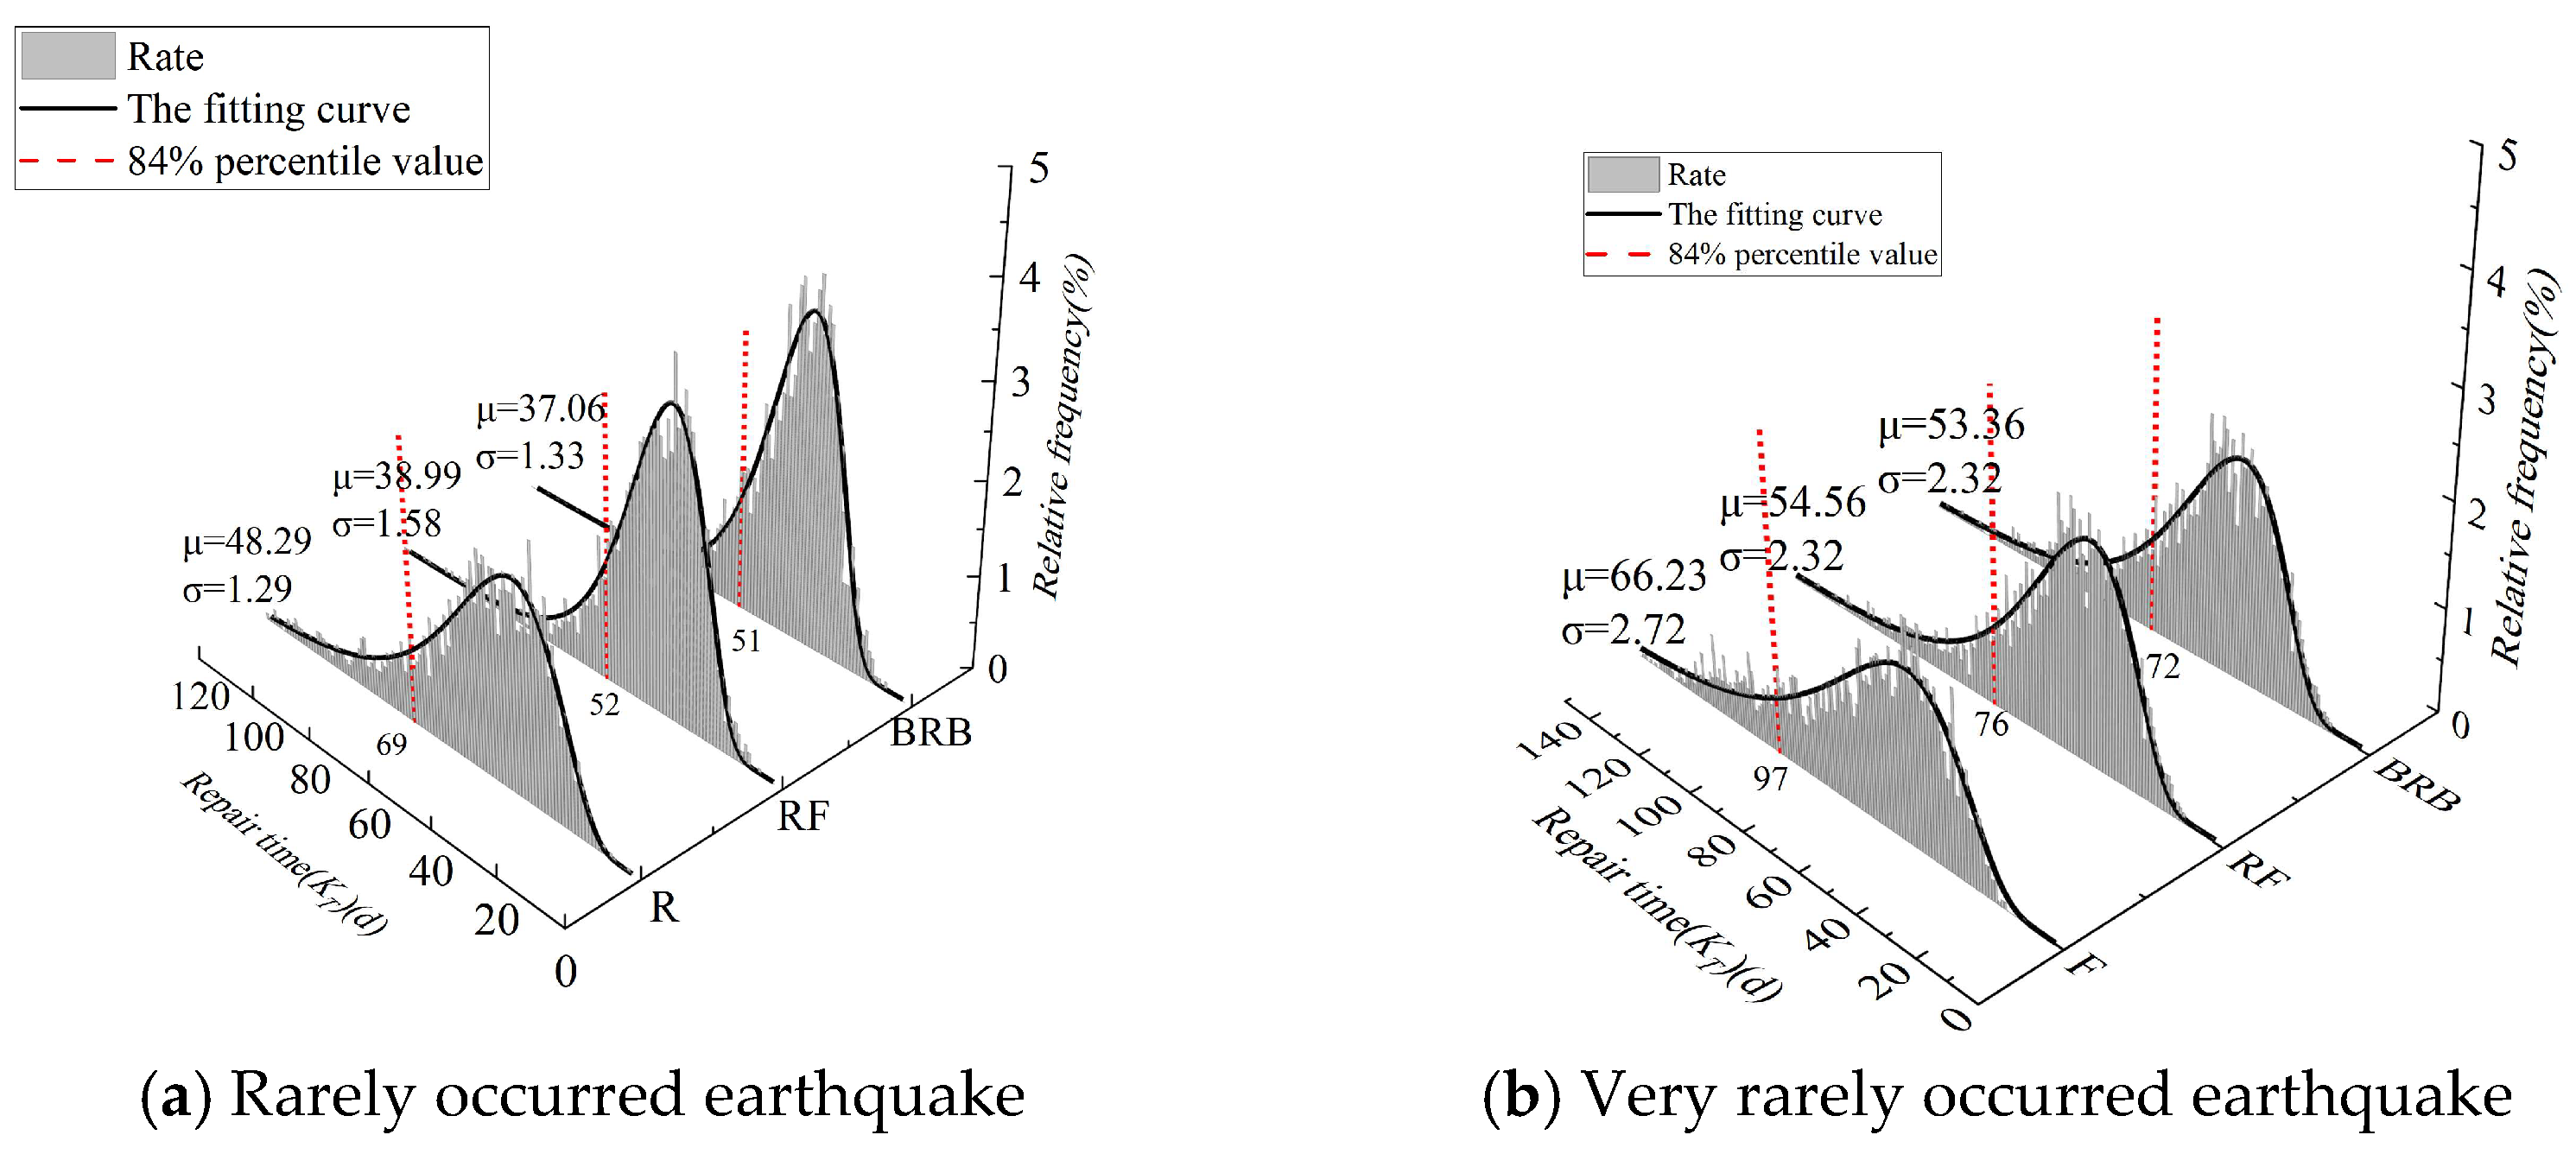
- (2)
- Repair time
- (3)
- Injury rate and mortality rate
4.4.3. Evaluation Result
4.5. Comparison and Discussion
4.5.1. Conventional Method
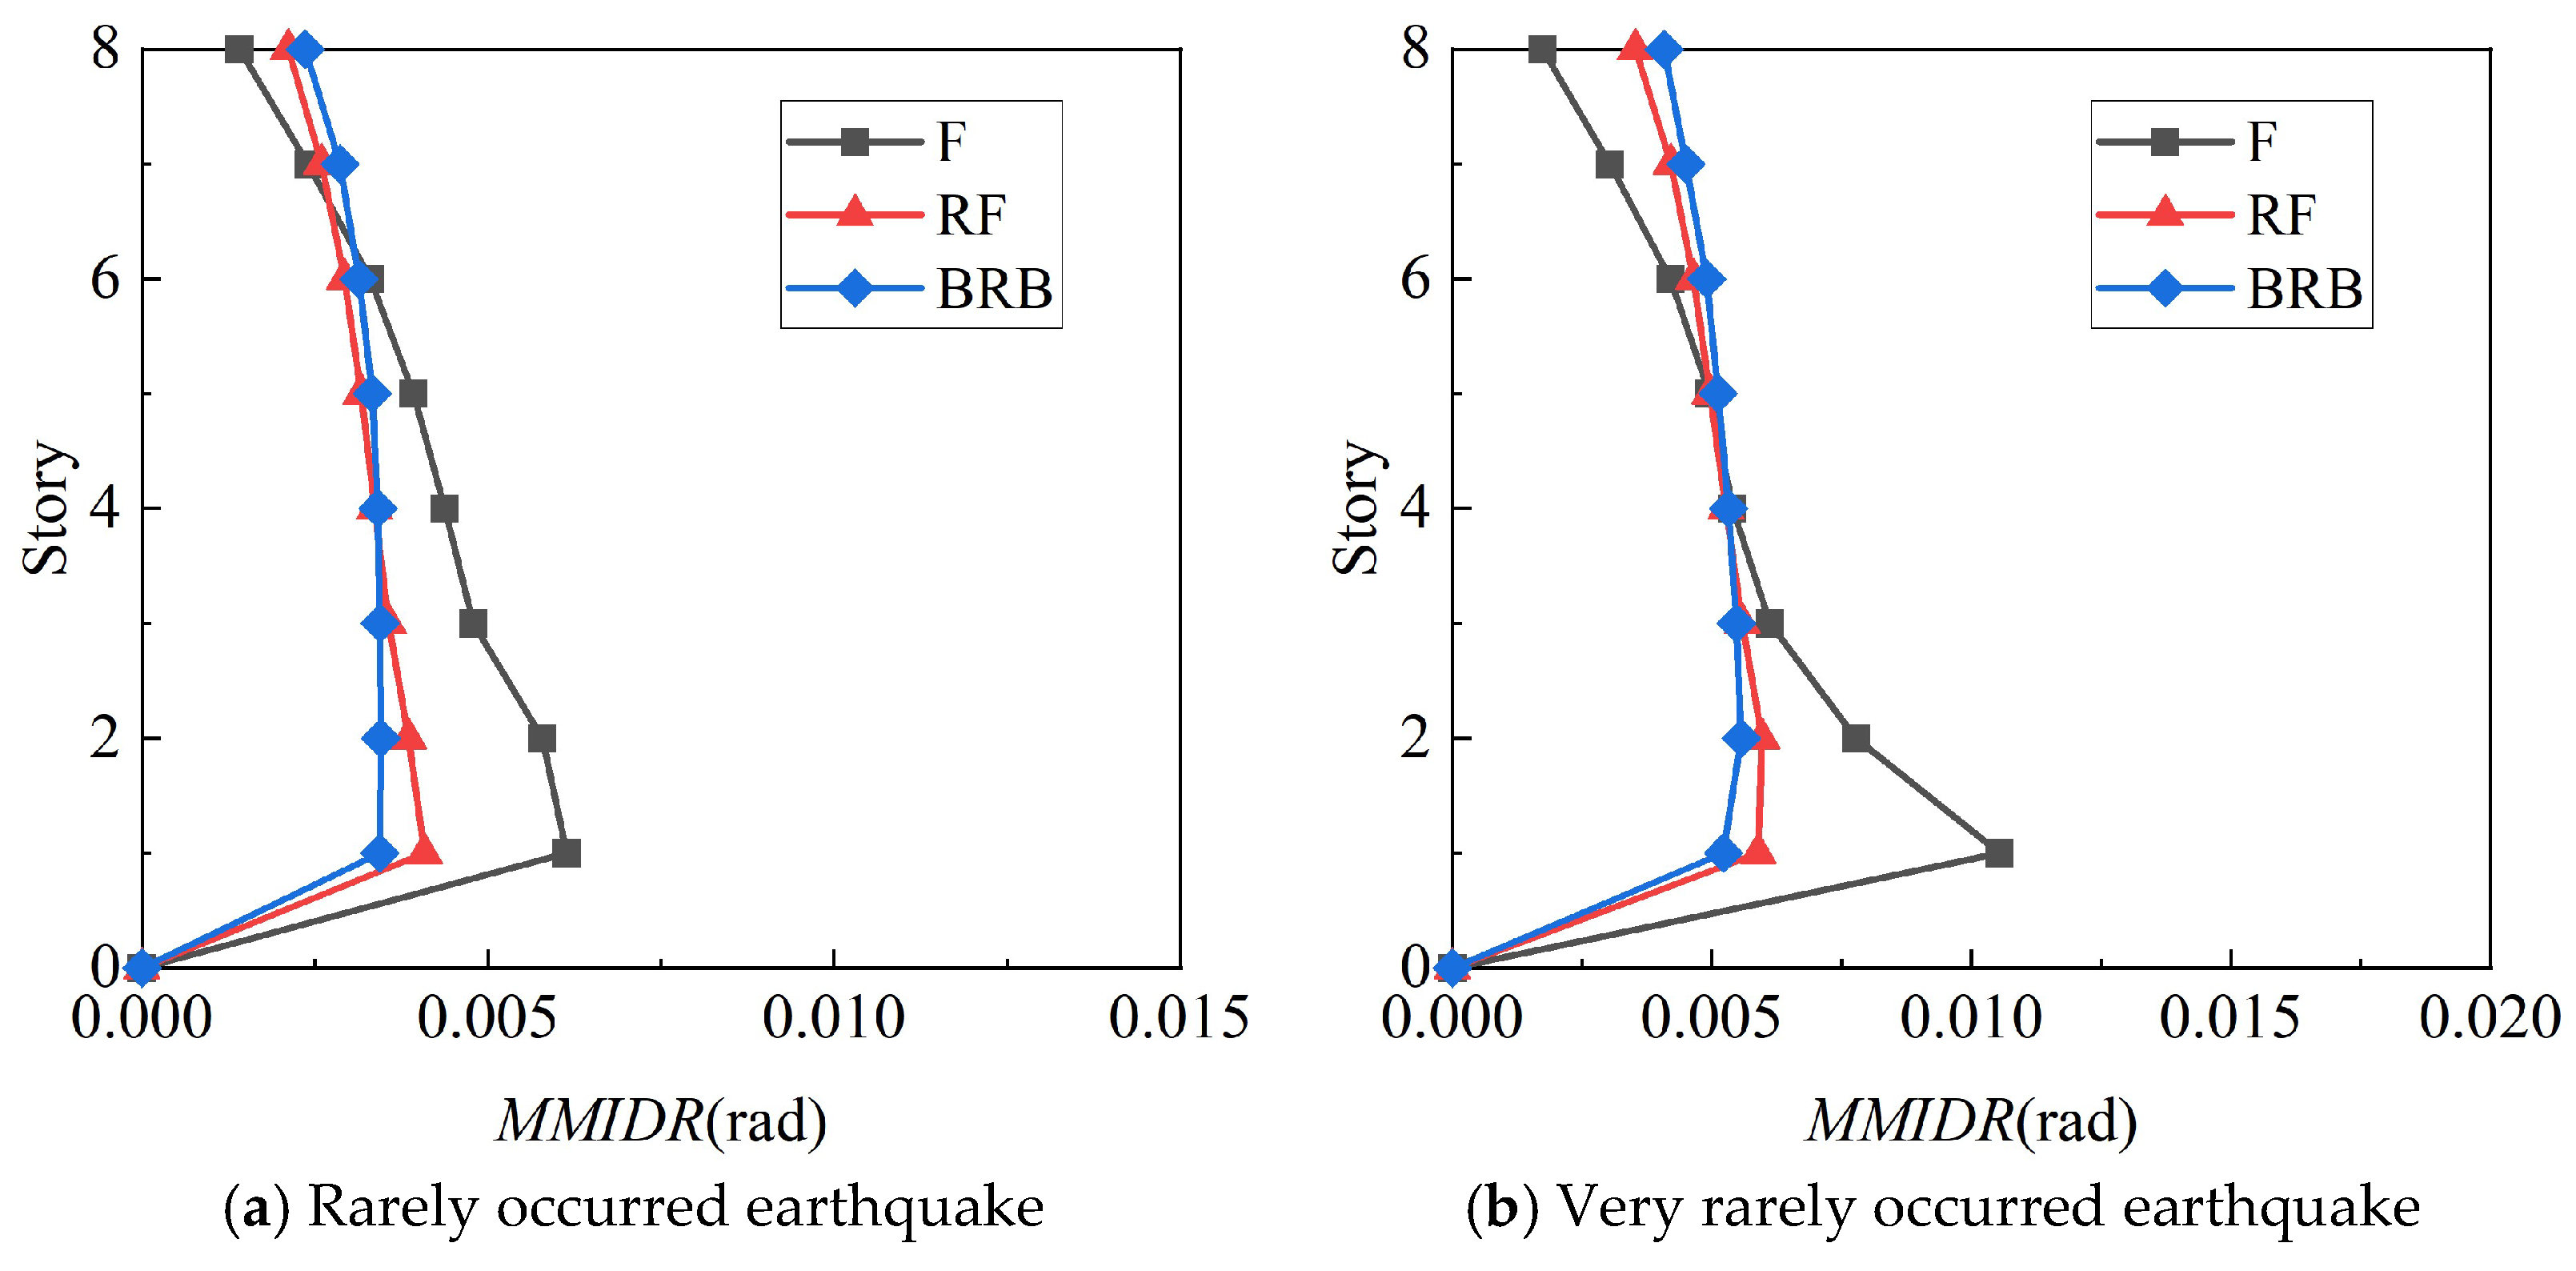
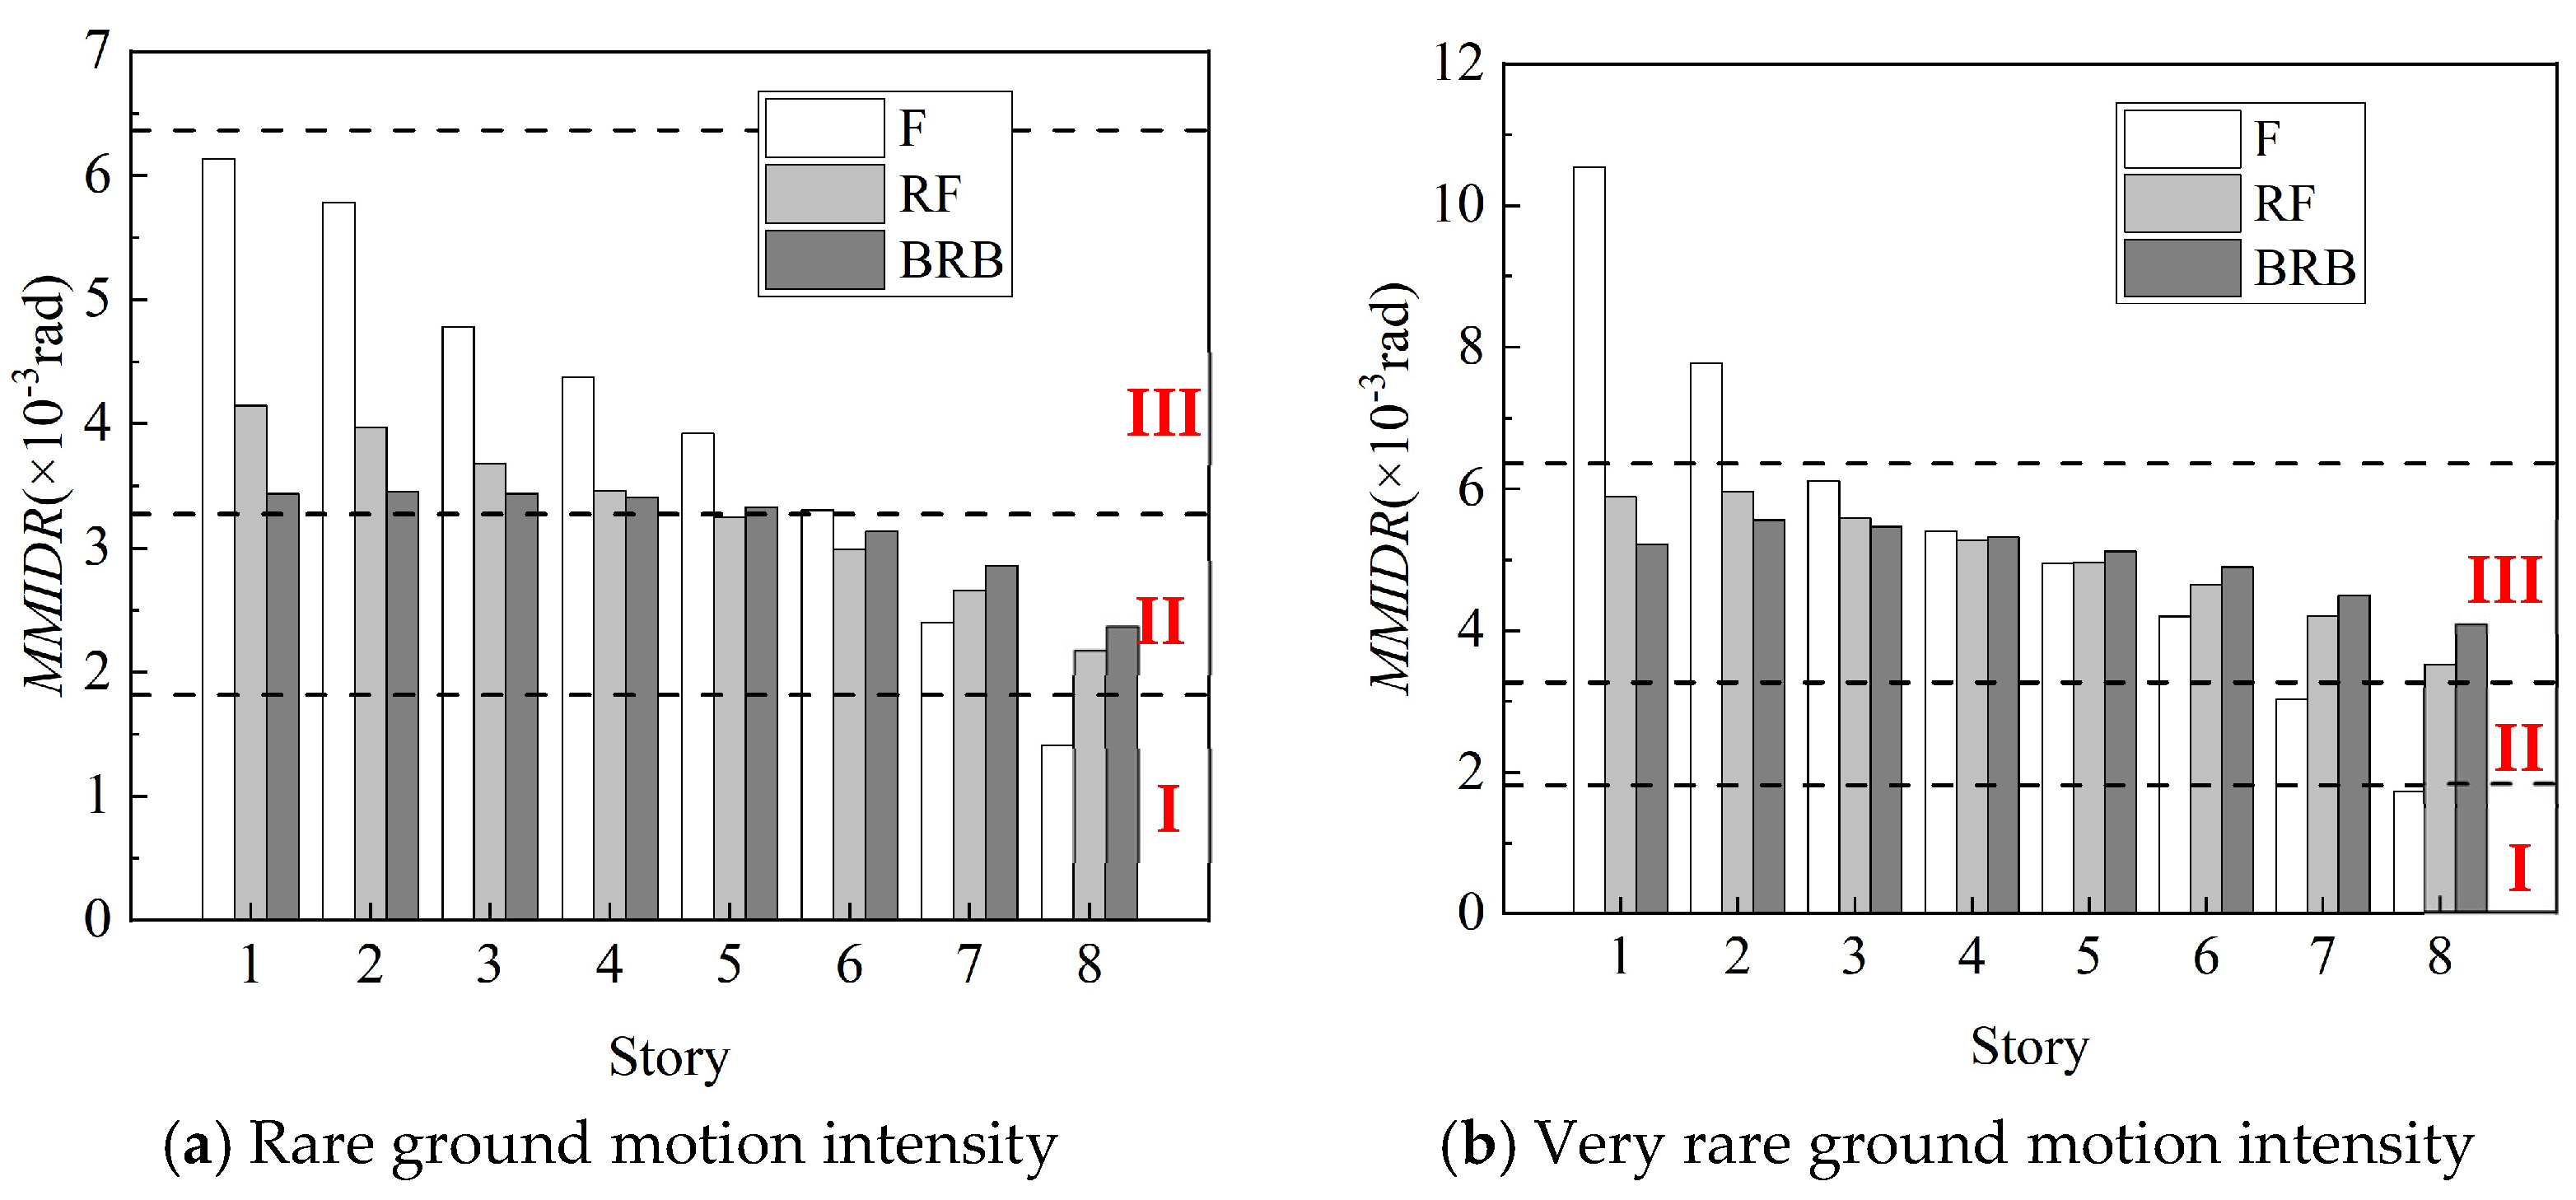
- (1)
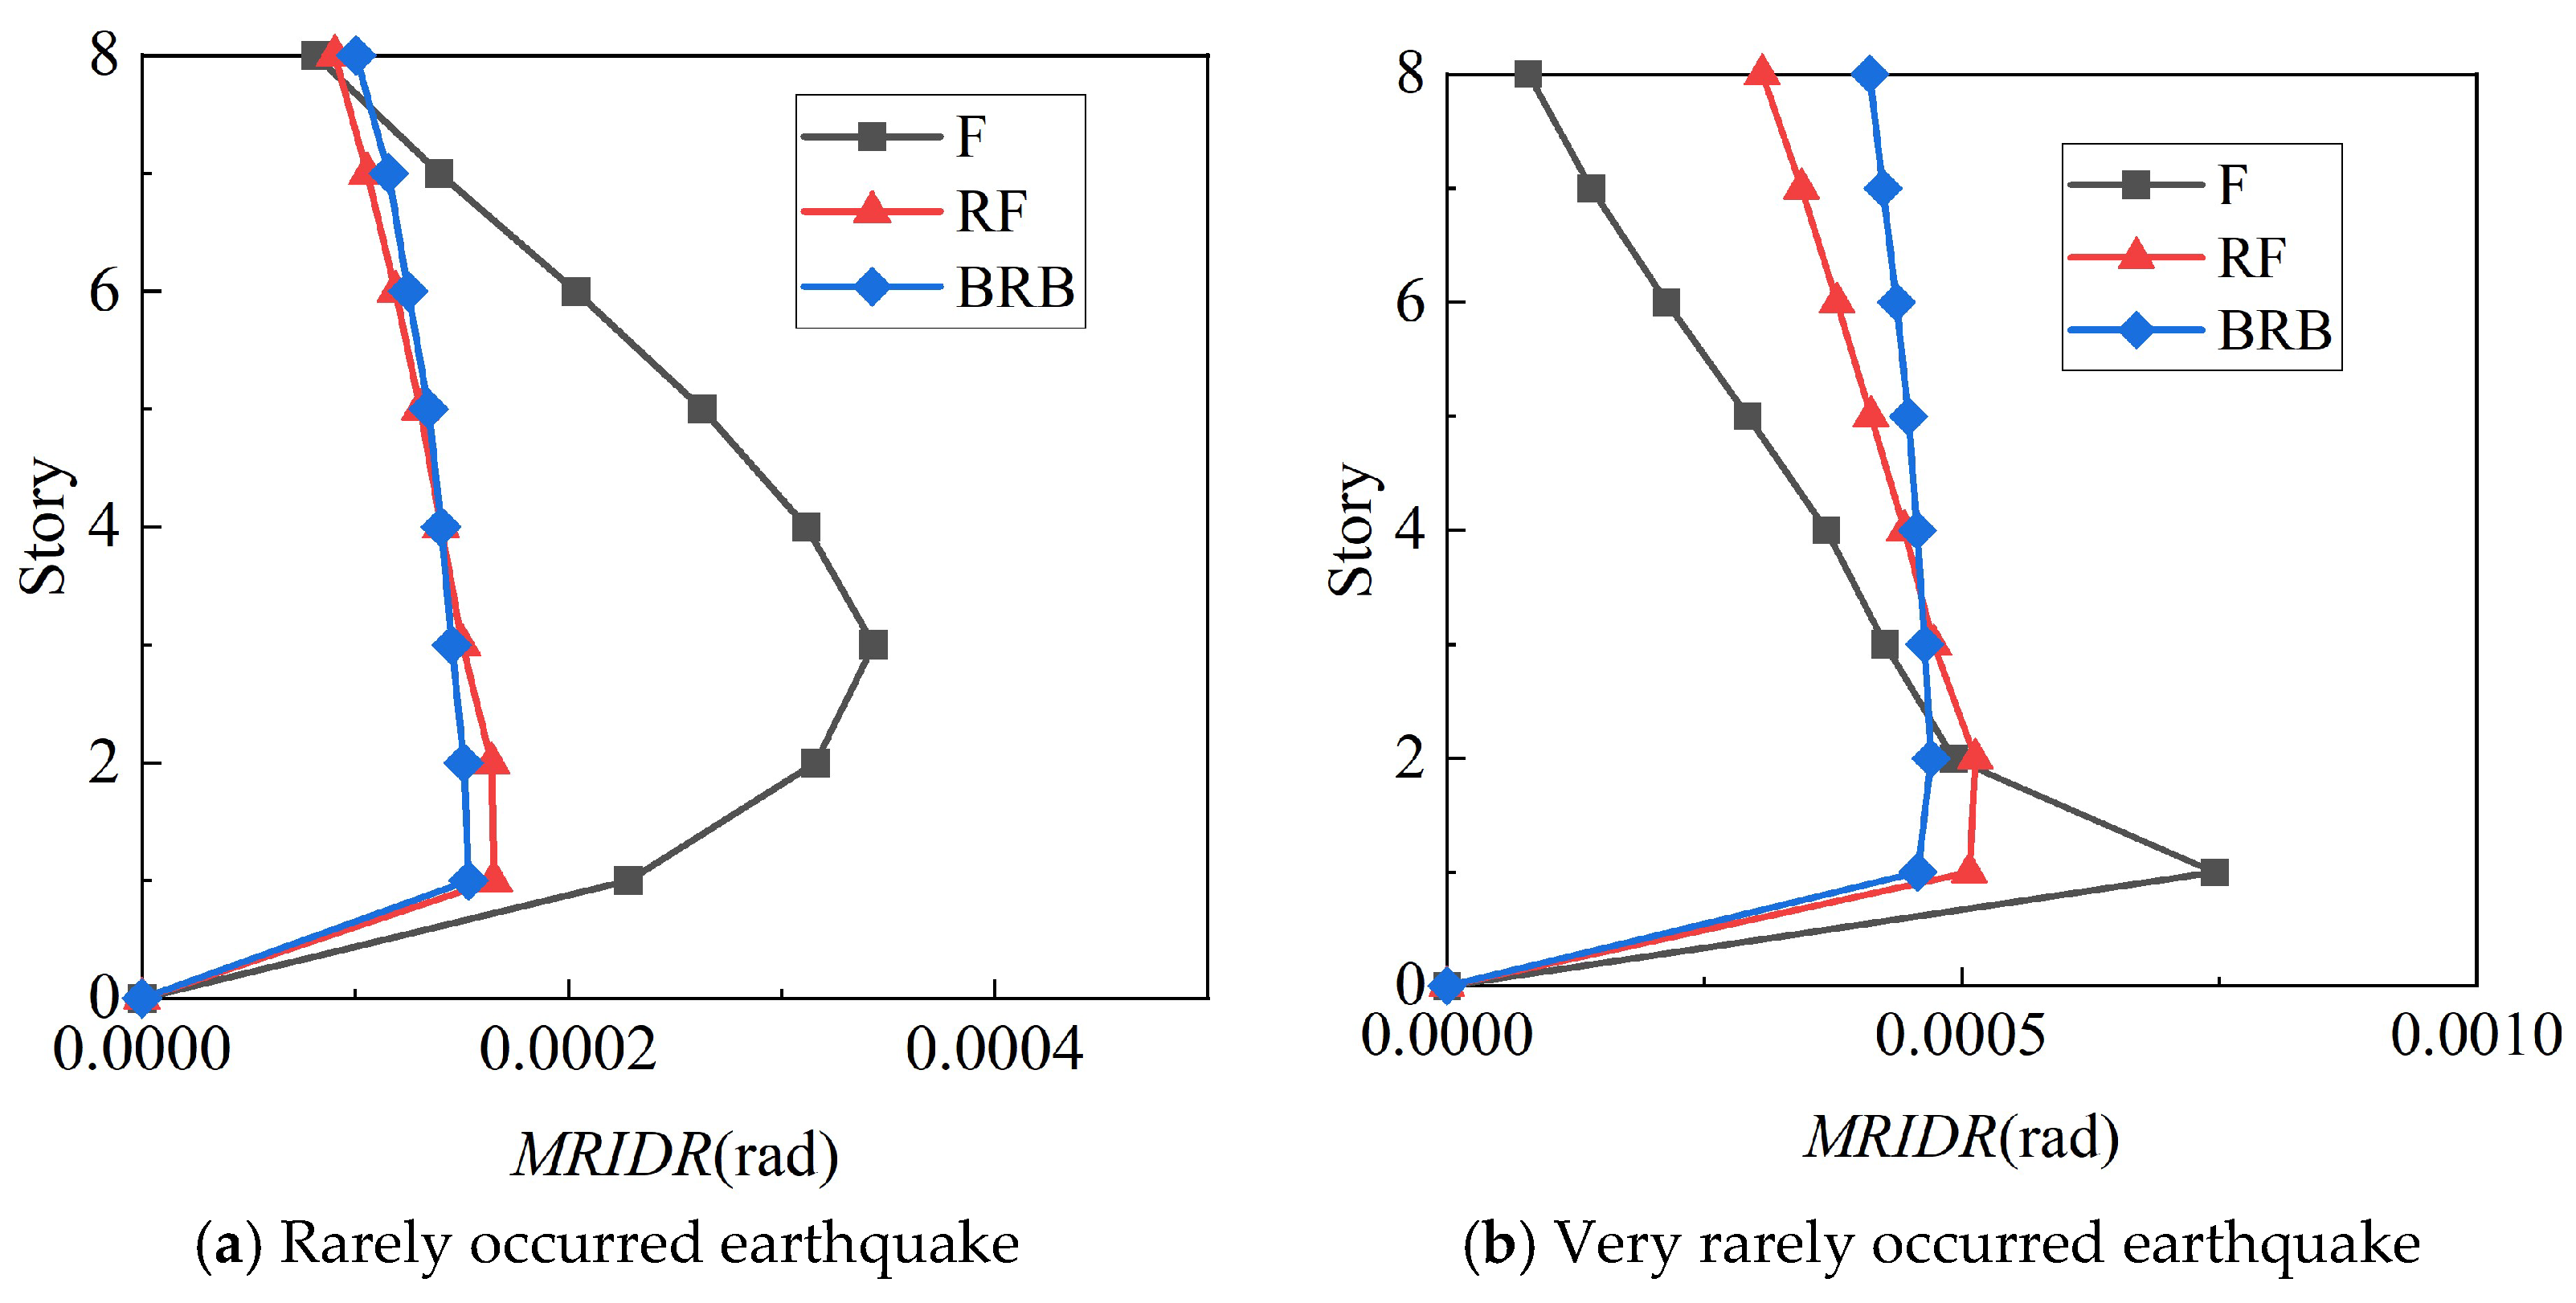
- Mean of maximum inter-story drift ratio
4.5.2. Comparison
- (1)
- Among them, the conventional evaluation method cannot give a quantitative index for the overall damage of the rocking frame-reinforced structure, and the result is obtained according to the damage to the structure. Correspondingly, the evaluation method based on seismic resilience in this paper can quantify the economic losses and casualties of the whole structure caused by structural damage. The results are more intuitive.
- (2)
- The repair cost and casualty rate of the structure are the sum of those for each story, and the repair time is the maximum of those for each story. Consequently, the seismic resilience indices can reflect the seismic performance of the whole structure and each story, which is more comprehensive.
5. Conclusions
- This paper presents the reinforcement design method that is applicable to soft-first-floor structures. Studies have shown that the rocking frame utilizes its own deformation to offset the inter-layer shear stress of the structure, reducing the damage to the structure under earthquake action.
- An evaluation methodology is proposed in this paper based on resilience, which is feasible for evaluating the seismic performance of reinforcement schemes. The engineering application indicates that the repair time and cost of the rocking frame scheme are close to those of the buckling-restrained brace scheme. In terms of injury and mortality rates, however, the rocking frame scheme improved by 55.6% and 63.0% compared to the buckling-restrained brace scheme.
- An improvement index of seismic resilience is presented in this study, which can visually assess the reinforcement effectiveness of different reinforcement schemes. The results show that the rocking frame has a better reinforcement effect than that of the buckling-restrained brace.
Author Contributions
Funding
Data Availability Statement
Acknowledgments
Conflicts of Interest
Nomenclature
| BRB | Buckling-restrained brace reinforced structure |
| RF | Rocking frame reinforced structure |
| F | Soft-first-floor frame structure |
| SRI | Seismic resilience index |
| SRII | Seismic resilience improvement index |
| As | Section area of the shear wall |
| Ars | Section area of the rocking frame diagonal bars |
| Am | Area of stories |
| Abi | Mean of EDP matrix before the expansion |
| Aai | Mean of EDP matrix after the expansion |
| CA | Relative error of the mean of EDP matrix before and after the expansion |
| CC | Relative error of covariance of EDP matrix before and after the expansion |
| Cbi | Covariance of EDP matrix before the expansion |
| Cai | Covariance of EDP matrix after the expansion |
| Es | Elastic modulus of the original structure |
| Ers | Elastic modulus of rocking frame steel |
| Total shear at bottom of structure | |
| Fl | Horizontal seismic actions of the lth floor of the structure |
| FL | Reaction force of the rocking frame |
| G | Shear modulus of the original structure |
| Weight of the lth floor of the structure | |
| Total gravity load of the original structure | |
| H | Total height of the structure |
| Is | Inertia moment of the column in origin structure |
| Irs | Inertia moment of the column in rocking frame |
| Layer lateral stiffness of the rocking frame | |
| KC | Repair cost of the unreinforced structure |
| KT | Repair time of the unreinforced structure |
| KIN | Injury rate of unreinforced structure |
| KM | Mortality of unreinforced structure |
| KeC | Repair cost of the reinforced structure |
| KeT | Repair time of the reinforced structure |
| KeIN | Injury rate of reinforced structure |
| KeM | Mortality of reinforced structure |
| Lrs | Length of the rocking frame |
| Rotational torque | |
| NDCF | Target value of the deformation |
| RC | Seismic resilience enhancement index of repair cost |
| RT | Seismic resilience enhancement index of repair time |
| RIN | Seismic resilience enhancement index of injury rate |
| RM | Seismic resilience enhancement index of mortality |
| Tl | Repair time of each story |
| Wrs | Span of the rocking frame |
| Damping coefficient of the original structure | |
| g | Gravitational acceleration |
| h | Height of rocking frame |
| Height of the lth floor of the structure | |
| System stiffness of the original structure | |
| krs | Lateral stiffness of the rocking frame |
| ksf | Lateral stiffness of the original structure |
| l | Sequential number of structural stories |
| msf | Mass of the original structure |
| mrs | Mass of the rocking frame |
| n | Total of structural stories |
| ns | Number of frame columns per floor |
| rhr | Nominal injury rate |
| rdr | Nominal mortality rate |
| ut | Inter-story displacement of the structure |
| u | Displacement of the original structure |
| Velocity of the original structure | |
| Acceleration of the original structure | |
| Ground acceleration | |
| x | Displacement of the center of mass |
| Rotation angle of the rocking frame | |
| Angular acceleration of the rocking frame | |
| The maximum drift ratio of the rocking frame | |
| Seismic impact coefficient | |
| λC(l) | Influence coefficient of height of each story |
| ζm | Indoor personnel density |
References
- Zhou, J.; Luo, G.; Fang, X. Fragility analysis of vertical irregular reinforced concrete frame structures subjected to pulse like ground motion. J. Build. Struct. 2011, 32, 134–142. [Google Scholar] [CrossRef]
- Beigi, H.A.; Christopoulos, C.; Sullivan, T.; Calvi, G.M. Gapped-Inclined Braces for Seismic Retrofit of Soft-Story. Build. J. Struct. Eng. 2014, 140, 04014080. [Google Scholar] [CrossRef]
- Zhou, B. Damage and lessons from the Hanshin earthquake in Japan. Earthq. Resist. Eng. 1996, 1, 39–42. [Google Scholar] [CrossRef]
- Xie, L. Lessons learnt from the great Sichuan Wenchuan Earthquake. Strateg. Study CAE 2009, 11, 28–35, 88. (In Chinese) [Google Scholar]
- Beigi, H.A.; Christopoulos, C.; Sullivan, T.; Calvi, G.M. Seismic response of a case study soft story frame retrofitted using a GIB system. Earthq. Eng. Struct. Dyn. 2015, 44, 997–1014. [Google Scholar] [CrossRef]
- Zhang, W.; Li, G.; Sun, F. Seismic Behavior of Rocking-Truss-Frame with Dampers. J. Tongji Univ. 2019, 47, 1235–1243. (In Chinese) [Google Scholar]
- Dar, A.; Konstantinidis, D.; EI-Dakhakhni, W. Seismic response of rocking frames with top support eccentricity. Earthq. Eng. Struct. Dyn. 2018, 47, 2496–2518. [Google Scholar] [CrossRef]
- Maroofi, E.; Mansoori, M.; Moghadam, A.; Aziminejad, A. Introducing a new seismic resisting system with dual linked column frame and rocking motion. Structures 2023, 47, 2148–2161. [Google Scholar] [CrossRef]
- Massumi, A.; Piri, M.; Nematnezhad, M. Enhancing the Seismic Performance of Moment Frames Using a Dumbbell-Shaped Rocking Shear Wall with Energy-Dissipating Devices. Pract. Period. Struct. Des. Constr. 2023, 28, 23–37. [Google Scholar] [CrossRef]
- Kaltakci, M.Y.; Ozturk, M. An experimental study on the strengthening of non-ductile reinforced concrete frames via external shear wall. Eur. J. Environ. Civ. Eng. 2012, 16, 59–76. [Google Scholar] [CrossRef]
- Jung, J.S.; Lee, K.S. Pseudodynamic testing of buildings retrofitted with external steel reinforced concrete frames to increase lateral strength for earthquake damage prevention. Shock Vib. 2020, 2020, 3027094. [Google Scholar] [CrossRef]
- Hu, S.L.; Wang, W.; Alam, M.S. Performance-based seismic design method for retrofitting steel moment-resisting frames with self-centering energy-absorbing dual rocking core system. J. Constr. Steel Res. 2021, 188, 106986. [Google Scholar] [CrossRef]
- Hu, S.L.; Wang, W.; Qu, B.; Alam, M.S. Development and validation test of a novel Self-centering Energy-absorbing Dual Rocking Core (SEDRC) system for seismic resilience. Eng. Struct. 2020, 211, 110424. [Google Scholar] [CrossRef]
- Bruneau, M.; Chang, S.E.; Eguchi, R.T.; Lee, G.C.; O’Rourke, T.D.; Reinhorn, A.M.; Shinozuka, M.; Tierney, K.; Wallace, W.A.; Von Winterfeldt, D. A Framework to Quantitatively Assess and Enhance the Seismic Resilience of Communities. Earthq. Spectra 2003, 19, 733–752. [Google Scholar] [CrossRef]
- Federal Emergency Management Agency; Hamburger, R.; Bachman, R.; Heintz, J.; Hooper, J.; Whittaker, A. Seismic Performance Assessment of Buildings Volume 1-Methodolody; Technical Report FEMA P-58 for Federal Emergency Management Agency: Washington, DC, USA, 2012. [Google Scholar]
- Moretti, S.; Trozzo, A.; Terzic, V.; Cimellaro, G.P.; Mahin, S. Utilizing Base-isolation Systems to Increase Earthquake Resiliency of Healthcare and School Buildings. Procedia Econ. Financ. 2014, 18, 969–976. [Google Scholar] [CrossRef]
- Du, K.; Yan, D.; Gao, J.; Sun, J. Seismic Performance Assessment of RC frame structures with Energy dissipation and Isolated devices Based on FEMA P-58. Eng. Mech. 2020, 37, 134–147. [Google Scholar] [CrossRef]
- GB/T 38591-2020; Standard for Seismic Resilience Assessment of Buildings. Standards Press of China: Beijing, China, 2020.
- Shi, S.; Du, D.; Wang, S.; Li, W. Assessment of reinforcement scheme for a high-rise steel structure based on seismic resilience and reinforcement benefit ratio. China Civ. Eng. J. 2020, 53, 71–82. [Google Scholar] [CrossRef]
- Zhang, Z.; Jiang, S.; Dai, L. Study on deformation control mechanism of RC frame-prefabricated shear wall structure strengthened with external rocking frame. J. Harbin Inst. Technol. 2021, 53, 120–128. [Google Scholar]
- Makris, N.; Aghagholizadeh, M. The dynamics of an elastic and structure coupled with a rocking wall. Earthq. Eng. Struct. Dyn. 2017, 46, 948. [Google Scholar] [CrossRef]
- Jiang, Q.; Wang, H.; Feng, Y. Seismic design and performance of hinged truss frame structures. Eng. Mech. 2019, 36, 105–113. [Google Scholar]
- Xiao, Y.; Zhou, Y.; Wu, H.; Pan, P.; Wang, T. Comparative study on GB/T 38591–2020 “Standard for seismic resilience assessment of buildings” and relevant international standards. J. Build. Struct. 2021, 42, 194–202. [Google Scholar] [CrossRef]
- Saeed, A.; Najm, H.M.; Hassan, A.; Qaidi, S.; Sabri, M.M.S.; Mashaan, N.S.A. Comprehensive Study on the Effect of Regular and Staggered Openings on the Seismic Performance of Shear Walls. Buildings 2022, 12, 1293. [Google Scholar] [CrossRef]
- Jiang, S.; Dai, L.; Zhang, Z. Structural seismic performance of self-centering energy dissipative rocking frame for strengthening soft-first-story RC frames. J. Fuzhou Univ. 2021, 49, 225–232. [Google Scholar]
- Liu, Z.; Cao, Y.; Chen, D.; Zhou, Z. Analysis model selection and parameter setting of a high-rise building based on YJK software. Build. Struct. 2014, 44, 83–86, 97. [Google Scholar]
- GB 50011-2010; Code for Seismic Design of Buildings. China Architecture and Building Press: Beijing, China, 2016.
- Salmon, J.; Beigi, H.A.; Christopoulos, C. Full-scale tests of gapped-inclined bracing system: Seismic retrofit for soft-story buildings. J. Struct. Eng. 2019, 145, 4019095. [Google Scholar] [CrossRef]
- Javidan, M.M.; Kim, J. Seismic Retrofit of Soft-First-Story Structures Using Rotational Friction Dampers. J. Struct. Eng. 2019, 145, 4019162. [Google Scholar] [CrossRef]
- Xie, Q.; Zhao, L. Research on buckling-restrained brace and its applications to structural seismic retrofitting. Earthq. Eng. Eng. Dyn. 2006, 26, 100–103. [Google Scholar] [CrossRef]
- Kim, J.; Choi, H.; Chung, L. Energy-based seismic design of structures with buckling-restrained braces. Steel Compos. Struct 2004, 4, 437–452. [Google Scholar] [CrossRef]
- Mohammadi, M.; Kafi, M.A.; Kheyroddin, A.; Ronagh, H. Performance of innovative composite buckling restrained fuse for concentrically braced frames under cyclic loading. Steel Compos. Struct. 2020, 36, 163–177. [Google Scholar] [CrossRef]
- Yin, B.; Cheng, S.; Ji, F.; Du, Y.; Lei, C.; Hong, X.; China Academy of Building Research; Chongqing University. Experimental study on seismic performance of frame structure strengthened with weak attached steel braces. Earthq. Resist. Eng. Retrofit. 2019, 41, 110. [Google Scholar] [CrossRef]
- Michael, A.; Seungho, C.; Jinkoo, K. Seismic retrofit of framed structures using a steel frame assembly. Steel Compos. Struct. 2023, 46, 857–865. [Google Scholar] [CrossRef]
- Shi, W.; Zhu, P.; Chen, W.; Ma, J. Implementation methods and numerical simulation of double-stage yield buckling restrained brace. Earthq. Eng. Eng. Dyn. 2023, 43, 140–150. [Google Scholar] [CrossRef]
- Du, Y.; Wu, D. Performance analysis of light energy dissipative rocking frame designed on the basis of stiffness demand. China Civ. Eng. J. 2014, 47, 24–35. [Google Scholar] [CrossRef]
- Yu, B.; Qin, C.; Tao, B.; Li, B. Probabilistic calibration of stress-strain models for confined normal-strength concrete. J. Struct. Eng. 2021, 147, 04021117. [Google Scholar] [CrossRef]


| Type | |||||
|---|---|---|---|---|---|
| Unconstrained concrete | 26.8 | 0.0015 | 10 | 0.0033 | 3.22 |
| Concrete in the column core area | 30 | 0.0022 | 20 | 0.013 | 3.41 |
| Concrete in the core area of the beam | 28 | 0.0021 | 17 | 0.0076 | 3.29 |
| 360 | 2 | 0.001 | 18 | 0.925 | 0.15 |
| Mode | Period (s) | ||
|---|---|---|---|
| F | RF | BRB | |
| 1 | 1.2462 | 1.1960 | 1.2433 |
| 2 | 1.2385 | 0.9070 | 0.9626 |
| 3 | 1.1251 | 0.8577 | 0.9533 |
| Earthquake Intensity | Relative Error | F | BRB | RF | |||
|---|---|---|---|---|---|---|---|
| Beam | Column | Beam | Column | Beam | Column | ||
| Rarely occurred earthquake | CA | 0.9951 | 1.0044 | 1.0011 | 1.0008 | 0.9993 | 1.0022 |
| CC | 0.9506 | 1.0164 | 1.0478 | 1.0097 | 0.9763 | 1.0159 | |
| Very rarely occurred earthquake | CA | 1.0006 | 1.0002 | 0.9985 | 0.9976 | 0.9990 | 0.9992 |
| CC | 0.9730 | 1.0420 | 1.1129 | 1.0614 | 0.9966 | 0.9979 | |
| Component (b × h × l) | Column | Beam | ||
|---|---|---|---|---|
| 0.6 × 0.6 × 4.5 | 0.6 × 0.6 × 3.6 | 0.3 × 0.6 × 6 | 0.3 × 0.65 × 3 | |
| Cost (CNY/per) | 1275 | 1022 | 502 | 267 |
| Earthquake Intensity | Structure Types | Injury Rate (%) | Mortality Rates (%) |
|---|---|---|---|
| Rarely occurred earthquake | F | 0.27 | 0.0473 |
| RF | 0.1 | 0.0167 | |
| BRB | 0.25 | 0.0465 | |
| Very rarely occurred earthquake | F | 0.35 | 0.0614 |
| RF | 0.27 | 0.0465 | |
| BRB | 0.32 | 0.0601 |
| Earthquake Intensity | Structure Types | Repair Cost (×104 CNY) | Repair Time (d) | Injury Rate(%) | Mortality Rates (%) |
|---|---|---|---|---|---|
| Rarely occurred earthquake | F | 11.199 | 69 | 0.27 | 0.0473 |
| RF | 8.500 | 52 | 0.1 | 0.0167 | |
| BRB | 8.300 | 51 | 0.25 | 0.0465 | |
| Very rarely occurred earthquake | F | 17.950 | 97 | 0.35 | 0.0614 |
| RF | 17.325 | 76 | 0.27 | 0.0465 | |
| BRB | 17.145 | 72 | 0.32 | 0.0601 |
| Earthquake Intensity | Structure Types | RC (%) | RT (%) | RIN (%) | RM (%) |
|---|---|---|---|---|---|
| Rarely occurred earthquake | RF | 24.1 | 24.6 | 63.0 | 64.7 |
| BRB | 25.9 | 26.1 | 7.4 | 1.7 | |
| Very rarely occurred earthquake | RF | 3.5 | 21.6 | 22.8 | 24.3 |
| BRB | 4.5 | 25.7 | 8.6 | 2.1 |
| Damage Level | Description of State | Deformation Division |
|---|---|---|
| I: Basic intact | Basically intact, individual non-load-bearing members with minor damage | θs < θe |
| II: Minor damage | Individual load-bearing members with micro cracks | θs < 1.8θe |
| III: Moderate damage | Cracks occurred in most load-bearing members | θs < 3.5θe |
| IV: Severe damage | Significant cracks and deformations for most members | θs < 0.9θp |
| V: Collapse | Collapse occurred in load-bearing members | θs < θp |
Disclaimer/Publisher’s Note: The statements, opinions and data contained in all publications are solely those of the individual author(s) and contributor(s) and not of MDPI and/or the editor(s). MDPI and/or the editor(s) disclaim responsibility for any injury to people or property resulting from any ideas, methods, instructions or products referred to in the content. |
© 2024 by the authors. Licensee MDPI, Basel, Switzerland. This article is an open access article distributed under the terms and conditions of the Creative Commons Attribution (CC BY) license (https://creativecommons.org/licenses/by/4.0/).
Share and Cite
Jiang, S.; Chen, Q.; Li, C.; Song, H.; Lin, E.; Fu, C. Assessment of Soft-First-Floor Structures Reinforced by Rocking Frame Based on Seismic Resilience. Buildings 2024, 14, 197. https://doi.org/10.3390/buildings14010197
Jiang S, Chen Q, Li C, Song H, Lin E, Fu C. Assessment of Soft-First-Floor Structures Reinforced by Rocking Frame Based on Seismic Resilience. Buildings. 2024; 14(1):197. https://doi.org/10.3390/buildings14010197
Chicago/Turabian StyleJiang, Shaofei, Qihan Chen, Chenyang Li, Hualin Song, En Lin, and Chong Fu. 2024. "Assessment of Soft-First-Floor Structures Reinforced by Rocking Frame Based on Seismic Resilience" Buildings 14, no. 1: 197. https://doi.org/10.3390/buildings14010197