Article

Numerical Simulation Analysis of the Full-Section Immersed Tube with the Post-Pouring Belt under Hydration Reaction

1
CCCC Fourth Harbor Engineering Institute Co., Ltd., Guangzhou 510230, China
2
The Second Engineering Company of CCCC Fourth Harbor Engineering Co., Ltd., Guangzhou 510220, China
*
Author to whom correspondence should be addressed.
Buildings 2023, 13(9), 2377; https://doi.org/10.3390/buildings13092377
Submission received: 30 August 2023 / Revised: 12 September 2023 / Accepted: 15 September 2023 / Published: 19 September 2023

Abstract

:
To study the force and deformation characteristics of a full-section immersed tube with post-pouring belt under the action of hydration reaction, the numerical model of full-section immersed tube with post-pouring belt was established by using MIDAS FEA (V2013) finite element analysis software, and the stress, cracking and deformation of the segment of the post-pouring belt were analyzed. The results show that under the action of hydration reaction, the concrete reaches the highest temperature at about 36 h, which appears at the roof of the tube gallery in the immersed tube, and the bottom steel plate expands rapidly initially, and subsequently shrinks gradually. The outer surface of the post-pouring segment concrete is stretched, and the internal region is under pressure, and as the internal temperature of the concrete cools down, the bottom plate starts to contract. The steel bar connection between the post-pouring belt and the surrounding immersed tube segment will increase the risk of cracking in the bottom plate of the full-section immersed tube. When only the steel bars in the bottom plate are connected, the maximum tensile stress of the immersed tube bottom plate will increase by 16.0% compared to the no connection case. If the steel bars of the immersed tube’s web and roof are also connected, the maximum tensile stress will increase by over 20%. By connecting the steel bars, the peripheral tube section plays a certain role in limiting the transverse deformation of the post-pouring belt and constraining the reinforcement of the bottom plate and web (and roof) can reduce the transverse deformation of the immersed tube to a great extent, reducing the proportion by over 10%.

1. Introduction

Immersed tube tunnel originates in the 19th century, it is made of precast concrete segments of immersed tubes under water. Due to its advantages, such as easy construction quality assurance, good seismic performance, and adaptability to poor foundations, it has become an important choice in traffic infrastructure construction and is widely used in underwater tunnel engineering [1,2,3,4,5]. Based on the pouring method of precast concrete in the cross-sectional direction of the tunnel, the immersed tube tunnel can be divided into the layered immersed tube and the full-section immersed tube, as shown in Figure 1 (different colored blocks 1 and 2 represent the sequence of concrete pouring, and block 2 is poured after block 1). In the prefabrication of the full-section immersed tube segment, the integral poured concrete is adopted, the post-pouring belt is set in the axial direction of the immersed tube, and the connection between the segments is achieved using the steel bars of the post-pouring belt. The full-section immersed tube avoids the problem of cracking in the new concrete caused by the constraint of old concrete during layered pouring and is gradually being increasingly applied in engineering.
The underwater application environment puts forward higher requirements for the waterproof and impermeability performance of the immersed tube tunnel, and the immersed tube segment, as a mass concrete, has some problems, such as high heat of hydration, significant drying shrinkage, significant uneven shrinkage and so on. This weakens the overall waterproof and impermeability performance of the immersed tube tunnel to a certain extent. Therefore, it is necessary to study the temperature stress, the risk of cracking and the deformation of immersed tube under the action of concrete hydration reaction, in order to design the post-pouring belt section of the immersed tube more reasonably.
Research on the engineering application of the full-section immersed tube tunnel has been reported in the literature. In reference [6], starting from the two major factors affecting the cracking of the immersed tube concrete structure, this paper introduces some measures, such as optimizing raw materials, preparing low-heat and low-shrinkage concrete, controlling the temperature of concrete raw materials, mixing concrete with crushed ice and cooling water, setting up an automatic maintenance system, and so on. The occurrence of harmful cracks in the immersed tube structure during construction is effectively controlled. In reference [7], the influence of belt-conveying and pump-conveying technology on concrete construction performance is studied through a full-scale model and compared with technology, site, construction control, follow-up construction, and so on. In this case, a mixing truck combined with a ground pump was used to transport concrete in order to carry out the full-section pouring construction of immersed concrete. In Reference [8], the integral binding and forming of a steel cage with a full-section immersed tube was realized through the inflatable airbag lifting process, and the overall stiffness of the steel cage was improved and the key processes such as the transformation of the whole system and the installation of internal mold were completed. In reference [9], which took the hydraulic internal model of a full-section immersed tube as the research object, a linear elastic numerical analysis model was established by using the finite element program to analyze the influence of panel thickness, transverse rib spacing, and member section size on the deformation of the internal model. In addition, reference [10] also studied and designed the matching of a dry dock system suitable for full-section pouring and puts forward a reusable dry dock system with formwork support system, traffic system, drainage system and lifting system. Reference [11] proposed a formulation to current meshes dealing with finite shell elements to solve the problem of stress analysis of curved pipes subjected to in-plane bending forces. However, in the existing literature, there is little analysis on the post-pouring belt section of full-section immersed tubes.
The setting of the post-pouring belt has an influence on the thermodynamic performance of mass concrete. A number of research papers have carried out thermal analysis of mass concrete by using finite element technology [12,13,14,15,16]. In this paper, the finite element software MIDAS FEA (V2013) is used to carry out the numerical simulation analysis of the hydration reaction of full-section immersed tube with post-pouring belt, and to explore the influence of different connection forms of steel bar of post-pouring belt on the force of immersed tube. By testing the temperature, strain, and deformation of the immersed tube concrete in the construction site, the force, deformation, and connection form of post-pouring belts under the action of the hydration reaction are revealed, so as to provide guidance for the pouring construction of full-section immersed tube segments.

2. Numerical Model

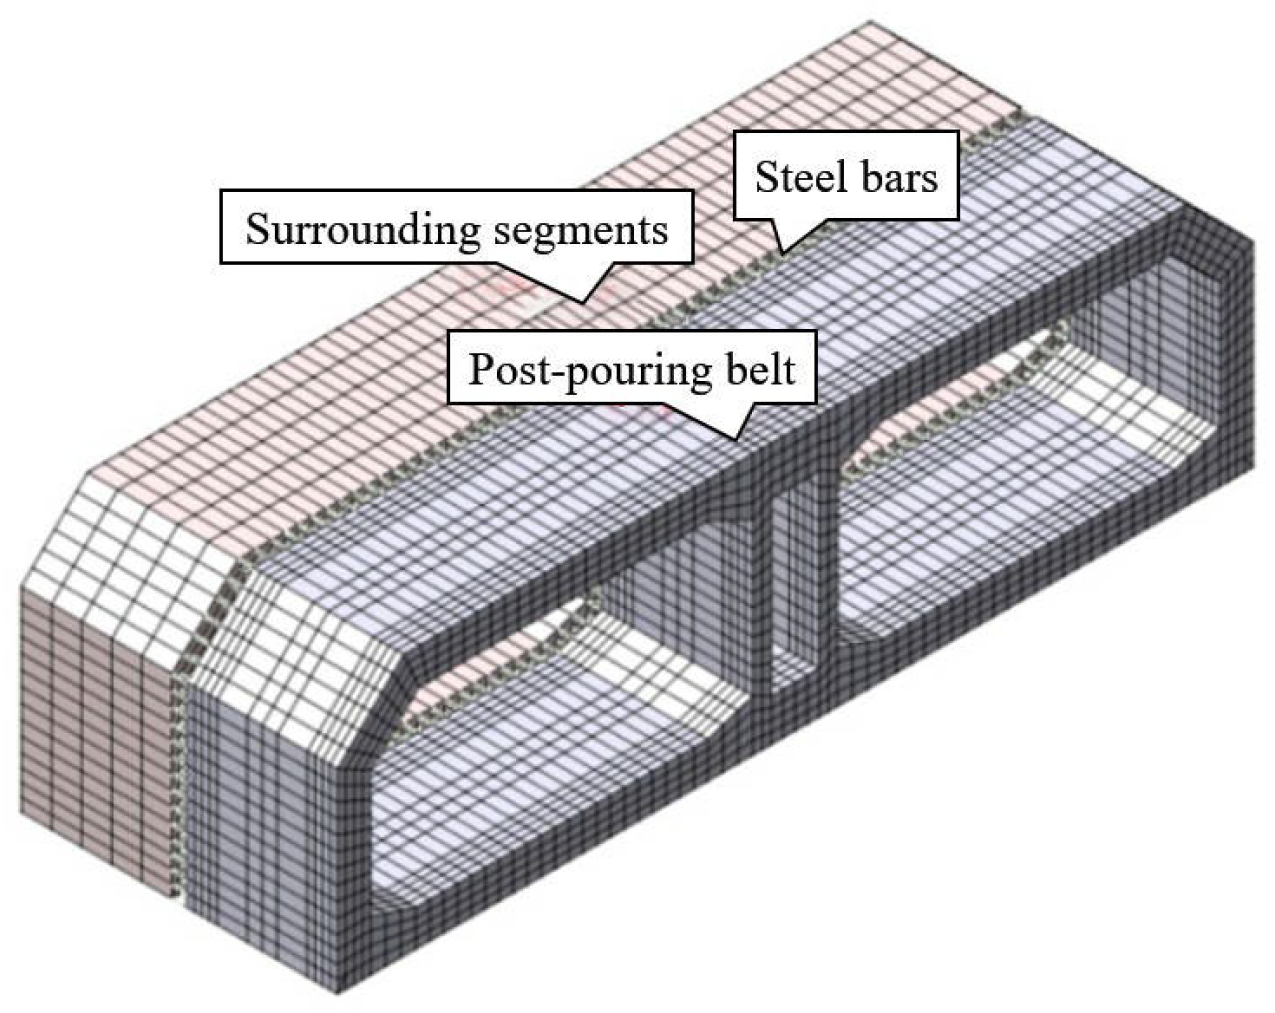
2.1. Model Developing

As shown in Figure 2, the full-section numerical model of the immersed tube is established by using the finite element program, MIDAS. The post-pouring belt is connected with the surrounding immersed tube segments by the steel bars. The concrete of the main body of the immersed tube is simulated by the three-dimensional solid element, which has eight-nodes with a one-point Gauss integration. The steel plate at the bottom of the immersed tube is simulated by the two-dimensional plate element, which has four-nodes with a one-point Gauss integration, and the thickness is 6 mm. The main size of the elements is about 0.2 m to 0.4 m in the axial direction, and 0.2 m in thick direction.
Concrete material parameters are given as follows according to the literature [17]. The cube compressive strength is 52.5 MPa, the elastic modulus is 35 GPa, the bulk density is 2500 kg/m3, the specific heat capacity is 0.973 kJ/(kg·°C), the thermal conductivity is 9.54 kJ/(m·h·°C), the thermal expansion coefficient is 1.2 × 10⁻⁵. Considering the continuous growth of concrete strength during the setting period, the change in concrete compressive strength is shown in Figure 3, based on Formula (1).
f t = t eq f 28 / a + b t eq
in which, f28 is the compressive strength in 28d; the parameter a is 4.5, and the parameter b is 0.95.
The steel material parameters are simulated by the elastic-plastic model, and the yield strength is determined according to the steel strength of the immersed tube structure. The elastic modulus is 210 GPa, the bulk density is 7850 kg/m3, the specific heat capacity is 0.46 kJ/(kg·°C), the thermal conductivity is 180 kJ/(m·h·°C), and the thermal expansion coefficient is 1.0 × 10⁻⁵, according to the literature [18].
The connection between the main concrete and the bottom steel plate is considered, and the sliding friction between the bottom steel plate and the ground where the immersed tube is located is considered, and the friction coefficient is 0.3.
In the process of analysis, the hydration reaction of mass concrete under adiabatic conditions, the temperature K(t) increases with time t can be expressed as below
K t = K 1 e a t
in which, a is the parameter of the rising curve, t is the time, and the unit is day (d); K is the maximum adiabatic rising temperature, and the unit is °C, which can be expressed by Formula (3).
K = Q 0 W + k F c ρ
in which, Q0 is the final hydration heat of cement, W is the cement dosage of unit volume concrete, k is the reduction coefficient of hydration heat of admixture, F is the amount of admixture per unit volume concrete, c is the specific heat capacity of concrete, and ρ is the density of concrete.

2.2. Verification

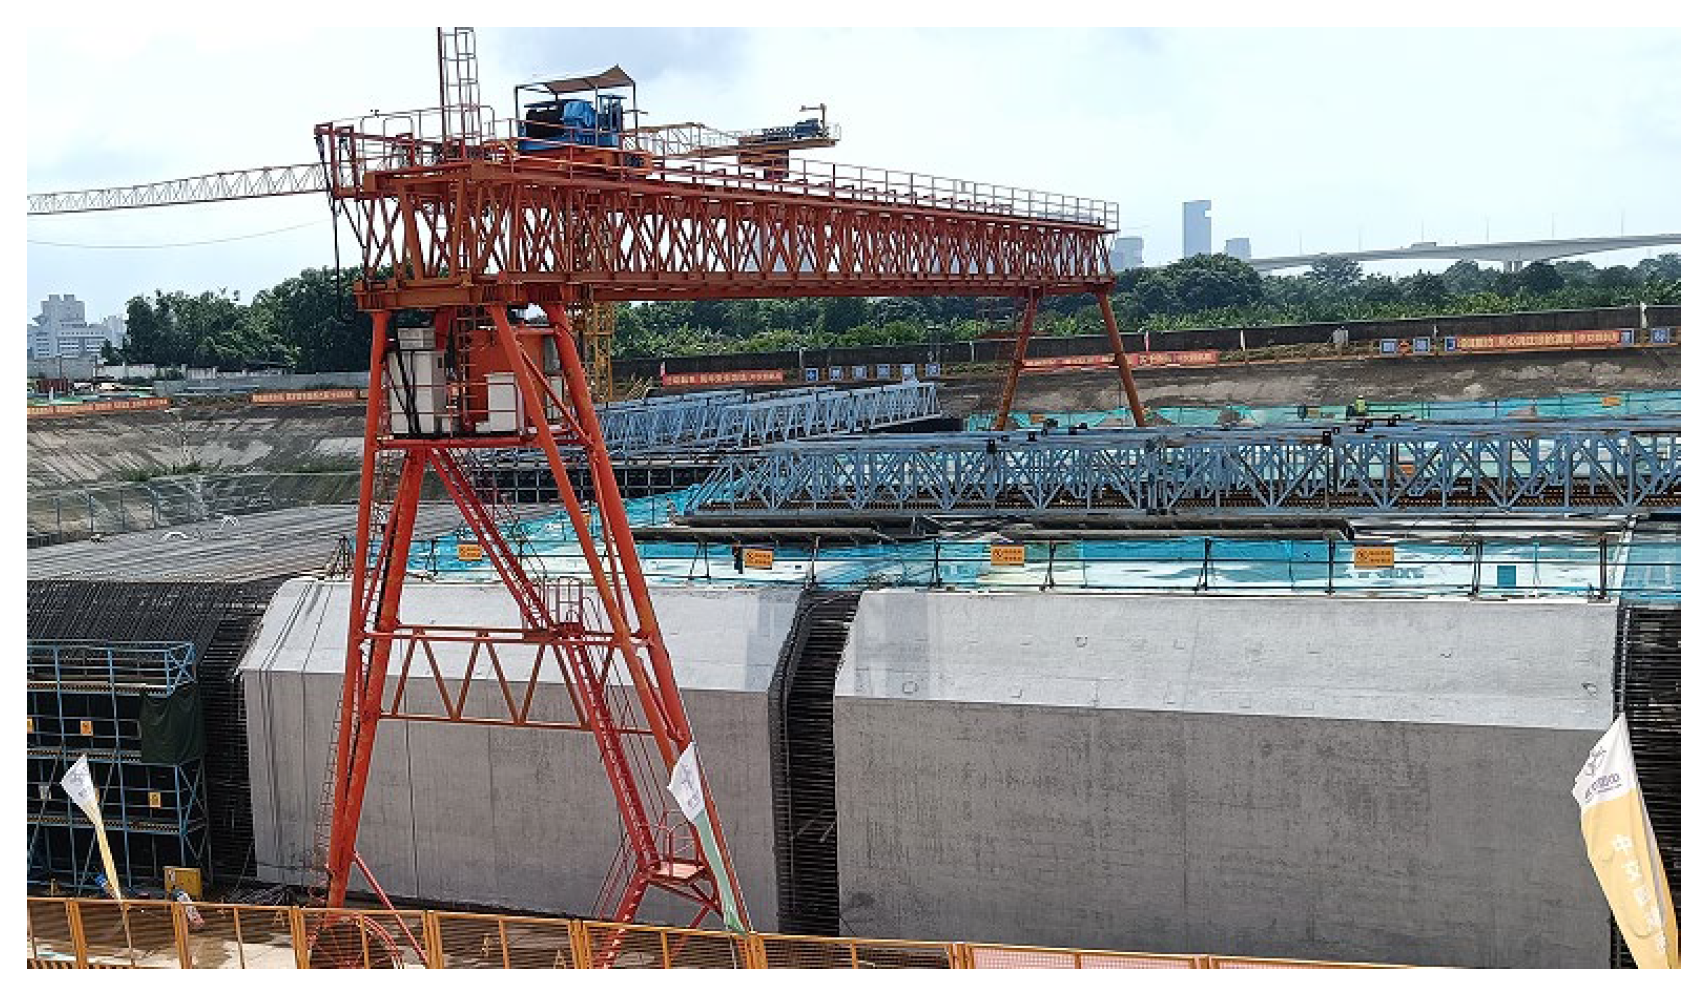
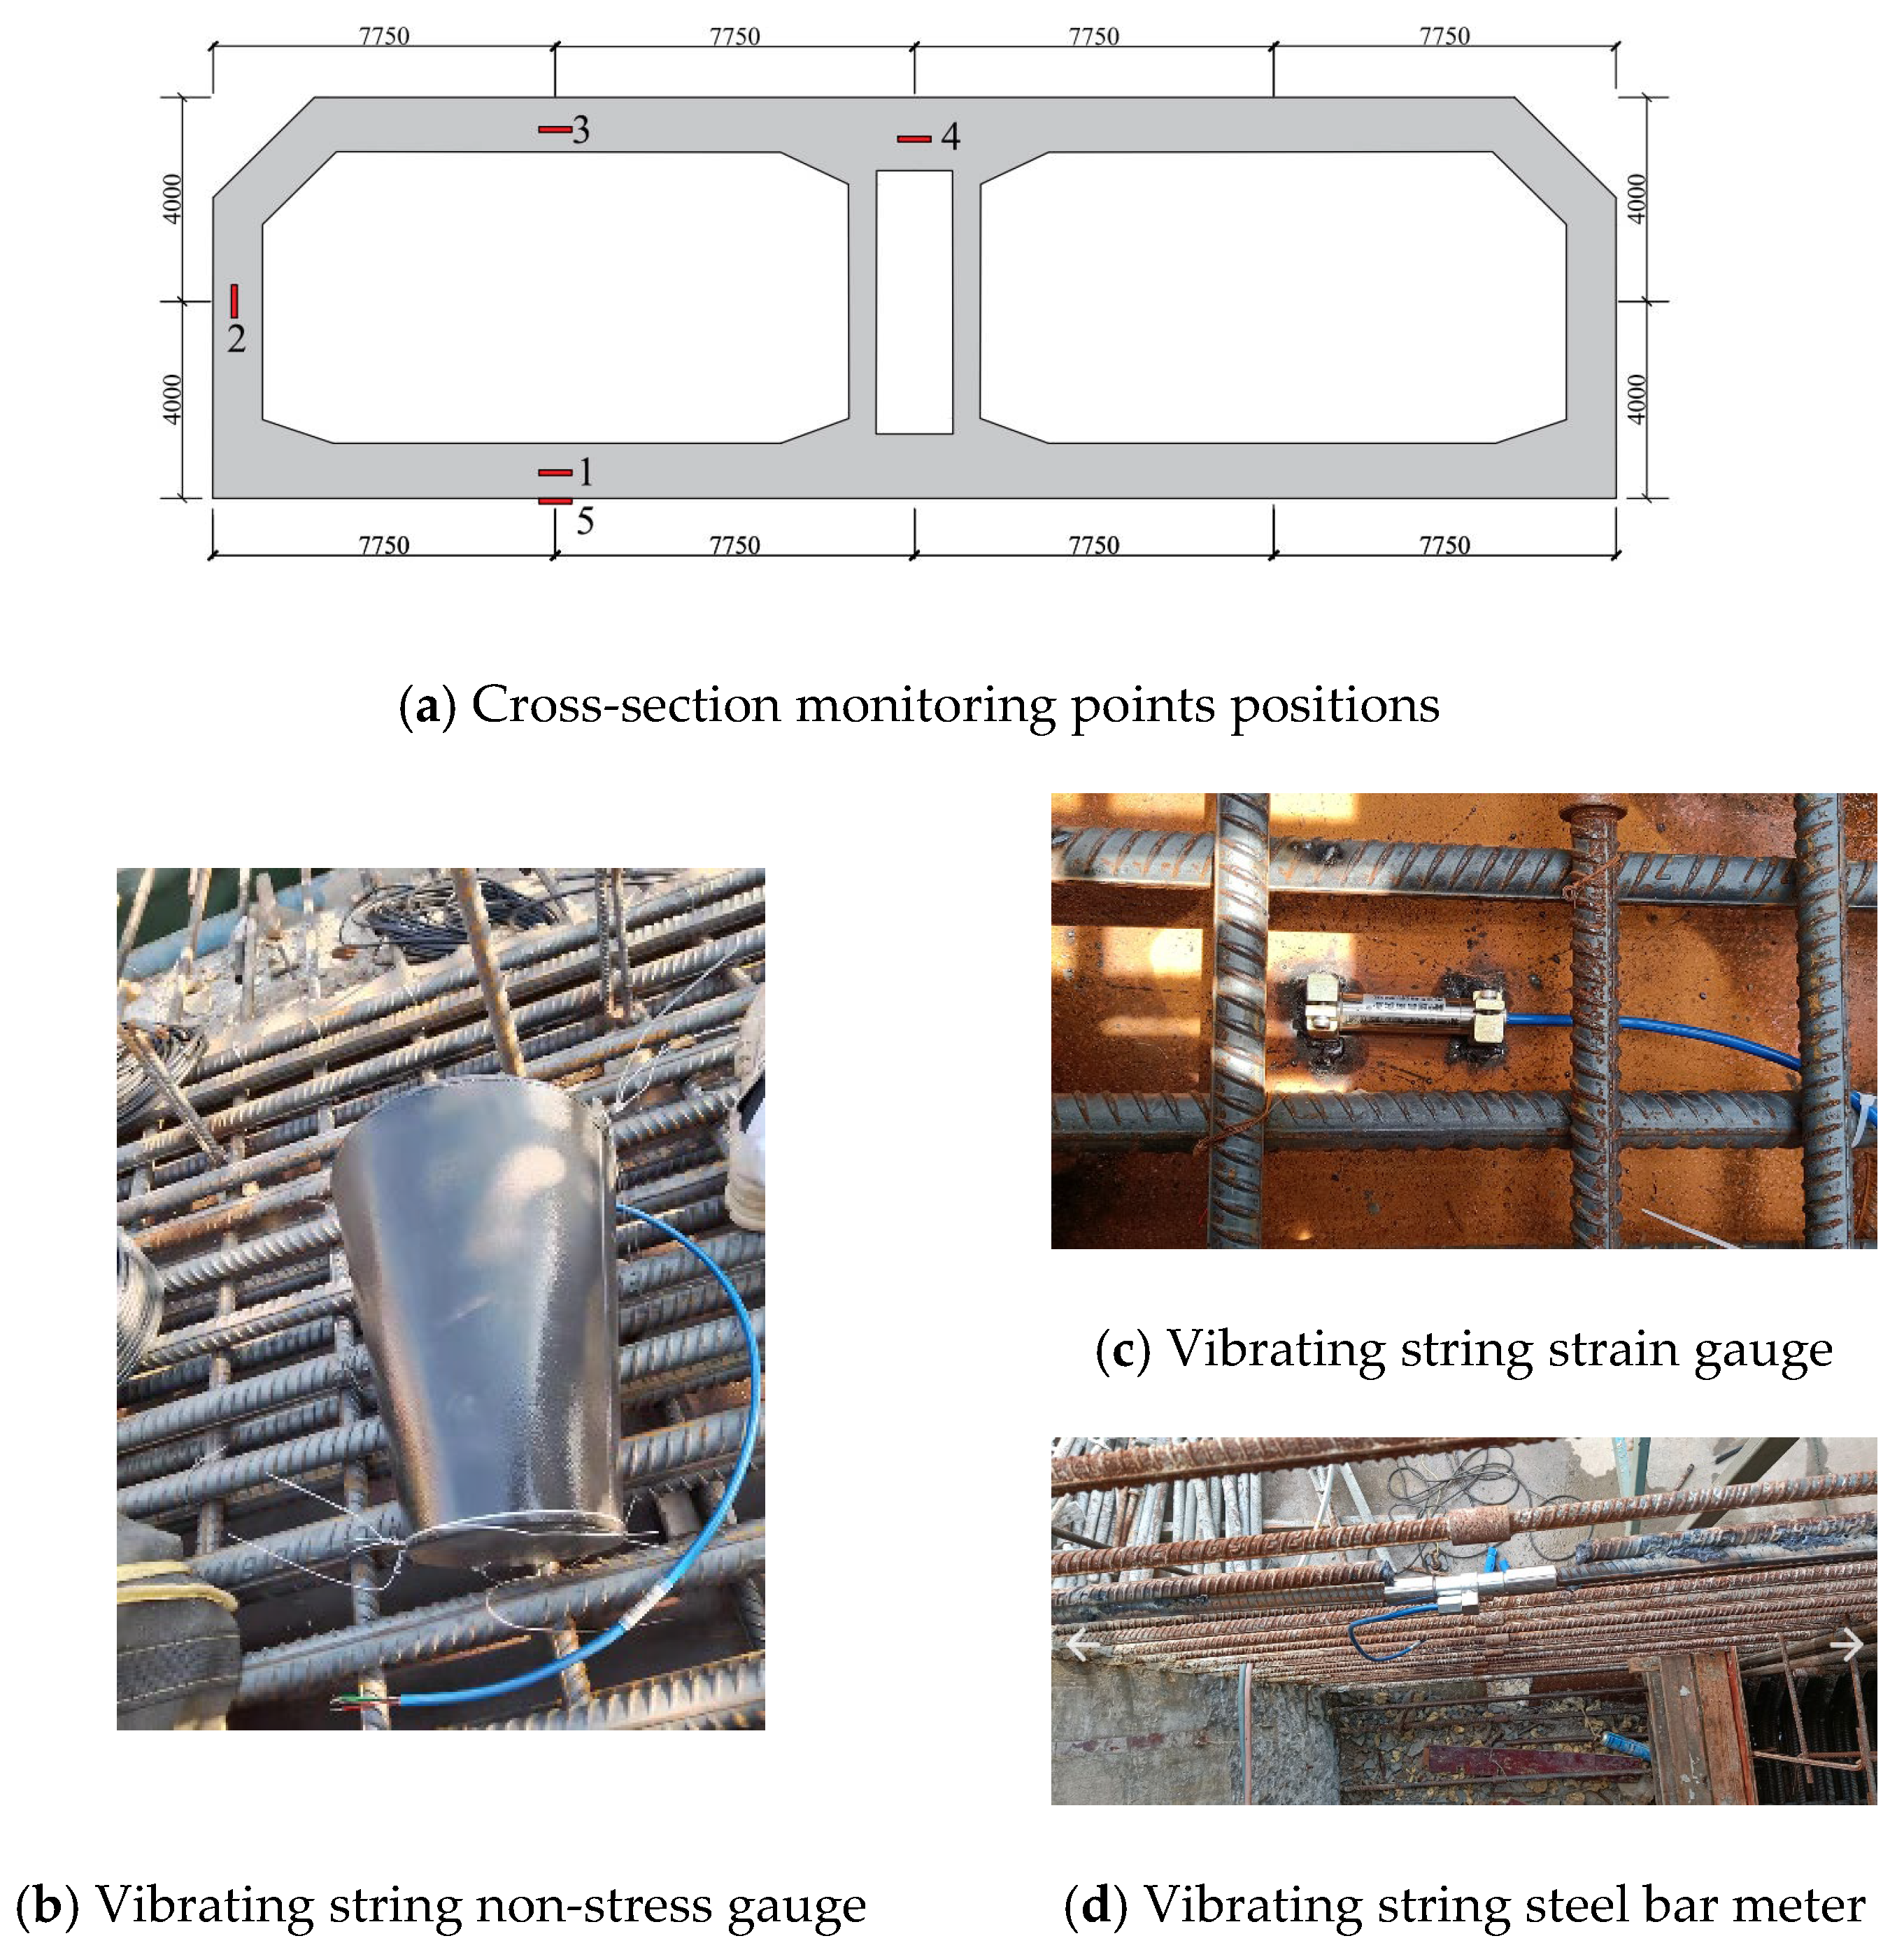
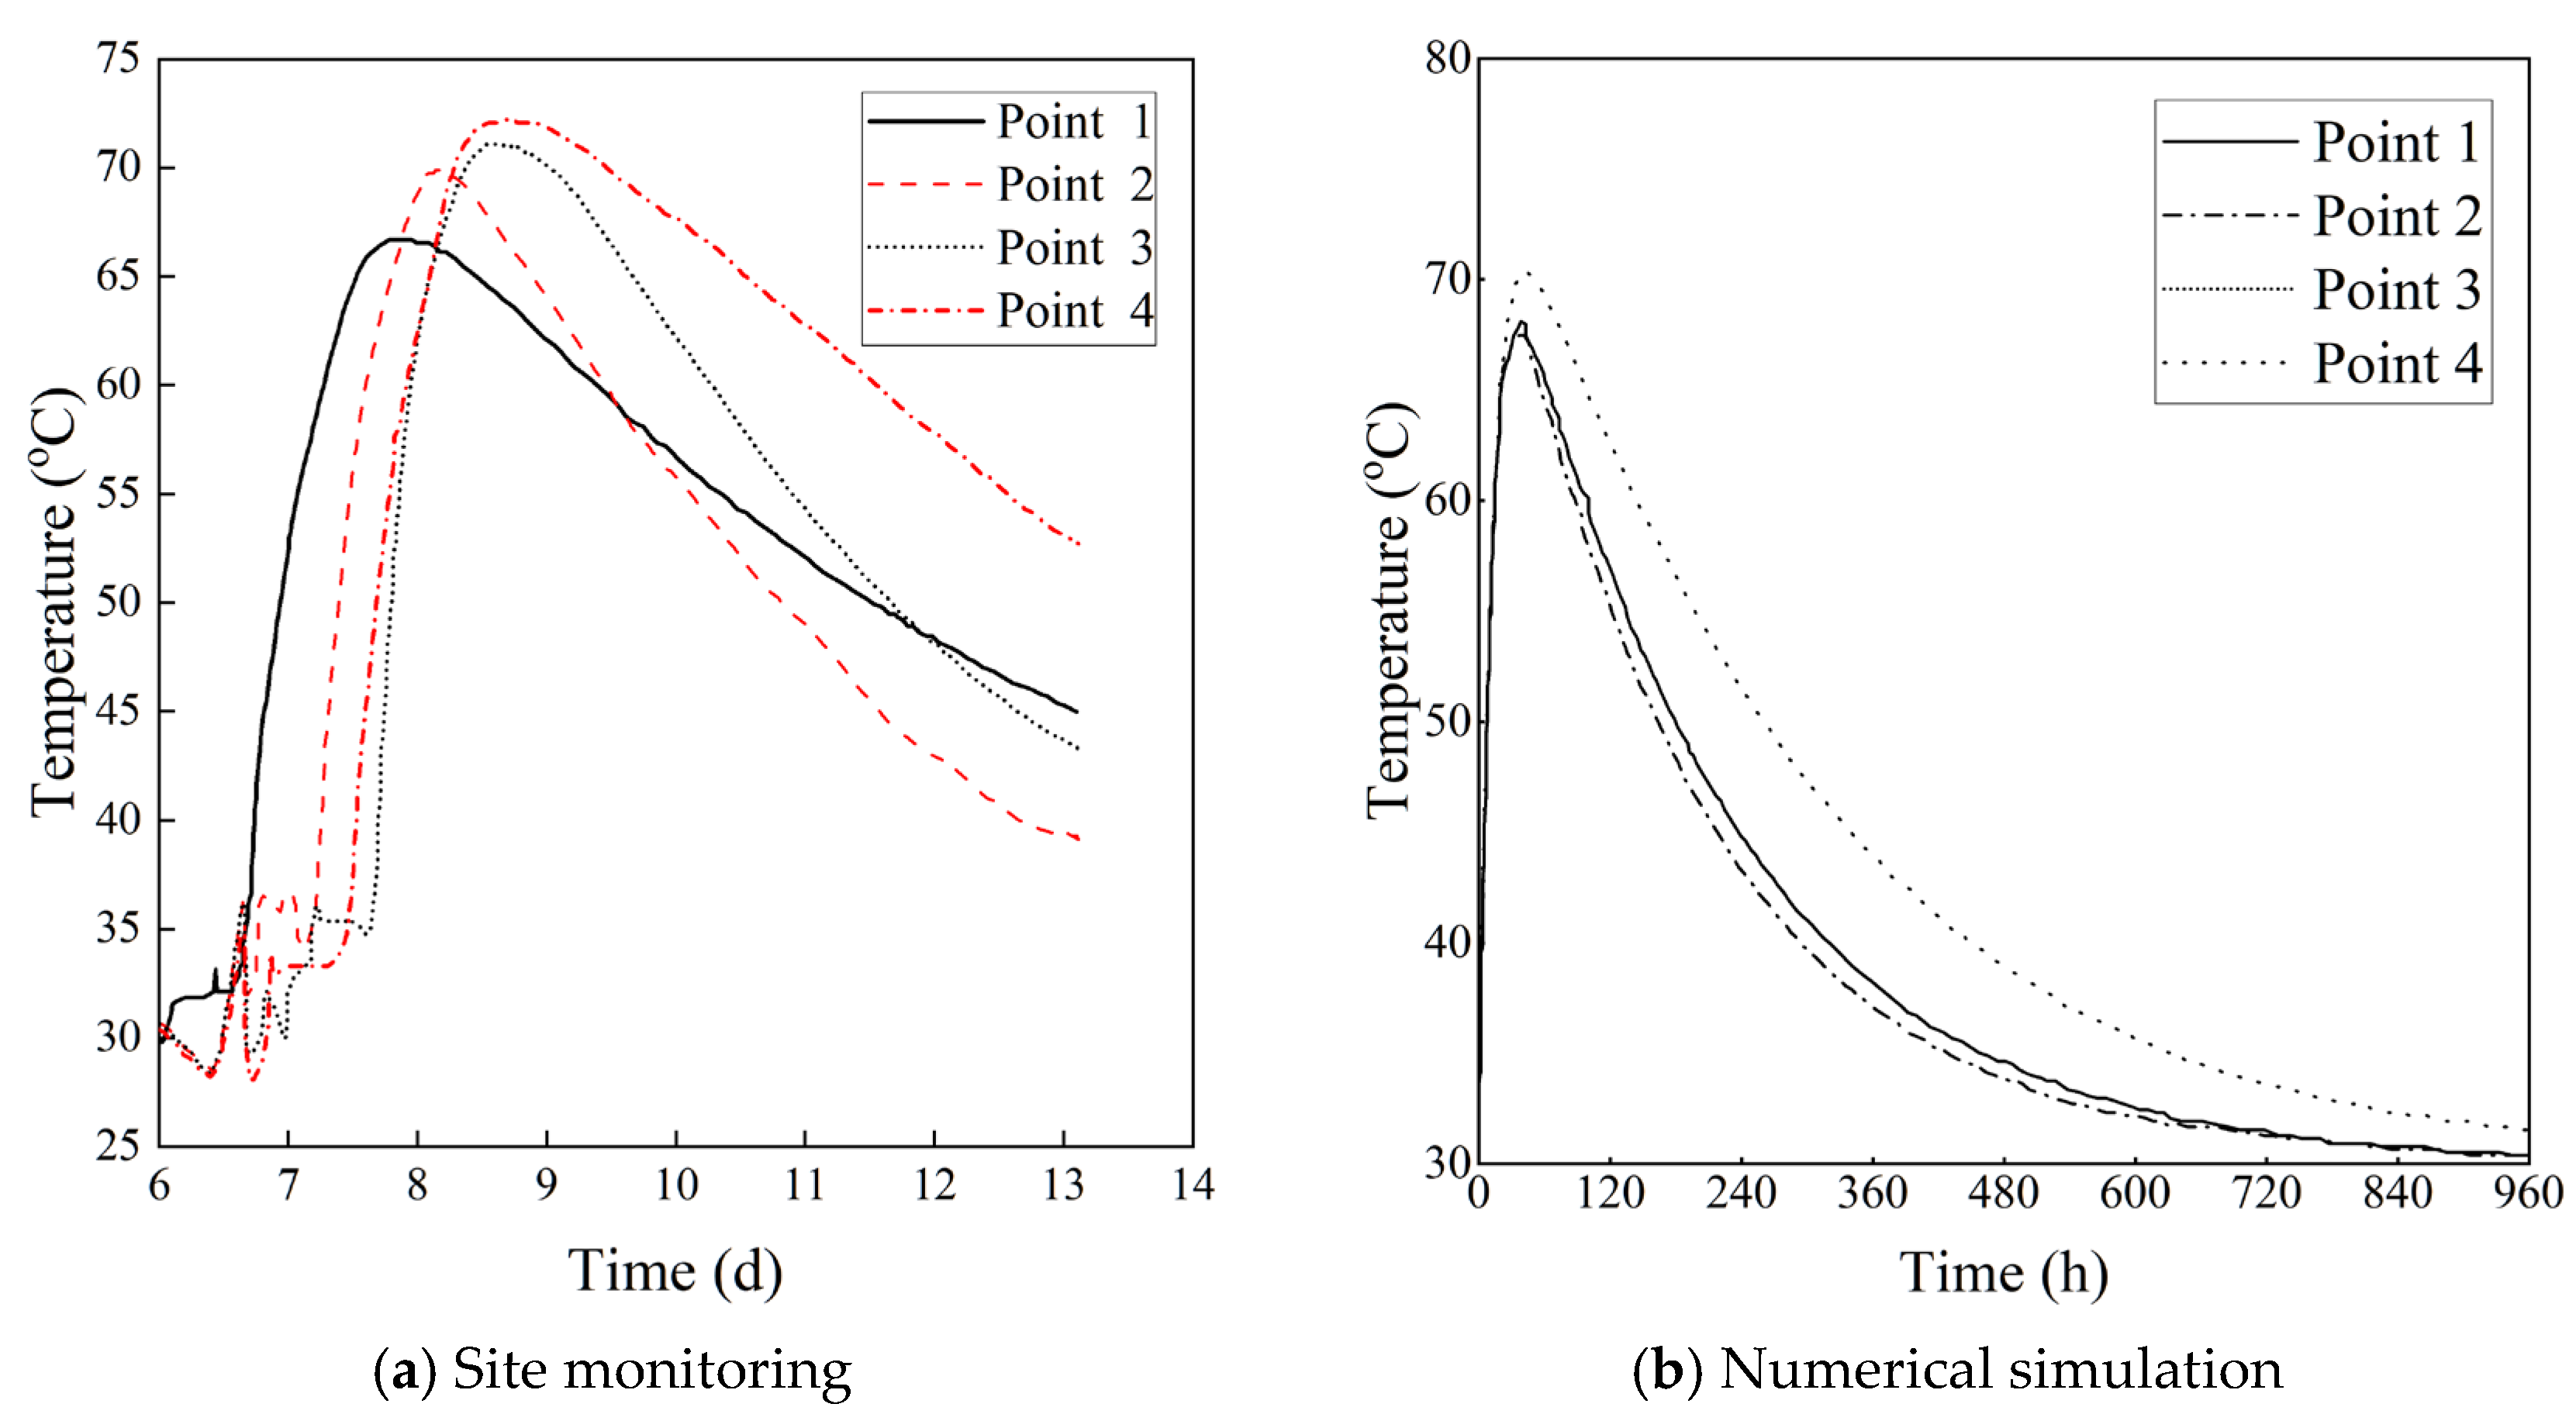
2.2.1. Site Monitoring
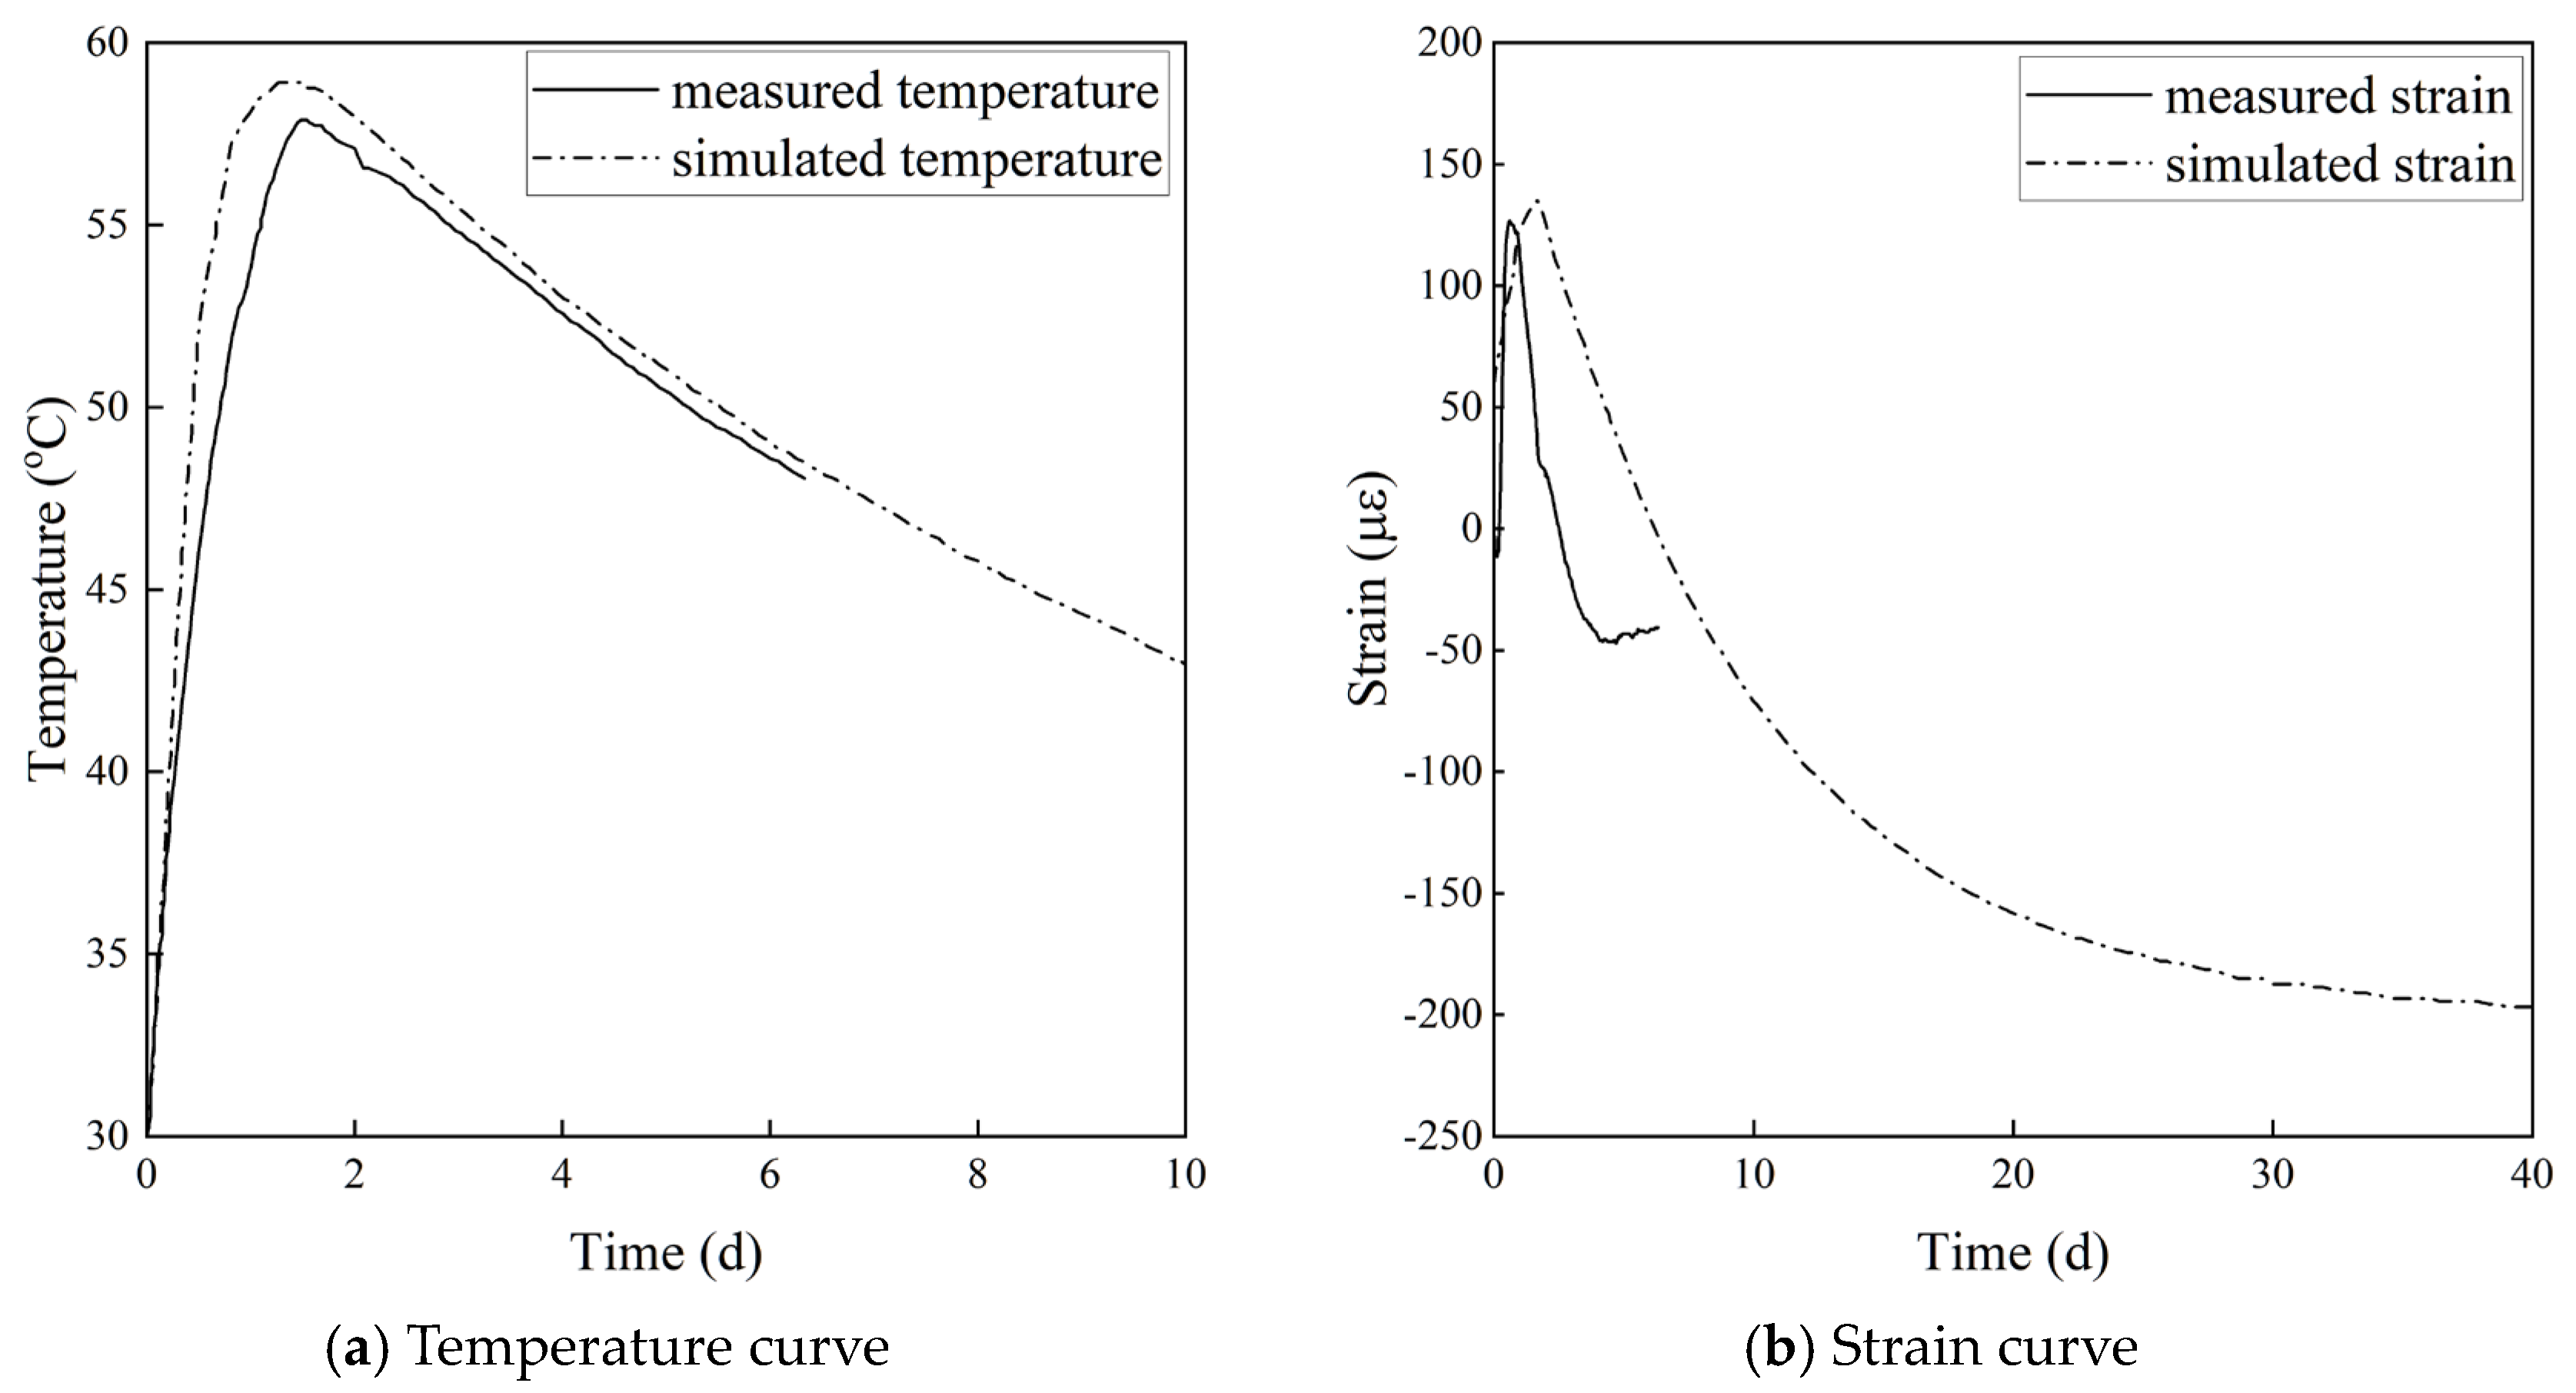
In order to verify the rationality of the full-section immersed tube model developed above, this paper uses the hydration reaction data monitored by a full-section immersed tube tunnel project in the field to verify the model. The site pouring is shown in Figure 4, and a 1.6 m wide post-pouring belt is arranged between the two concrete immersed tube segments.
A monitoring section is arranged on the post-pouring belt, which is 0.4 m away from the end, and five monitoring points are arranged on the monitoring section, as shown in Figure 5a. Among them, monitoring points 1–4 are equipped with vibrating string non-stress gauges (as shown in Figure 5b) to measure the strain and temperature caused by the change of concrete volume at the measuring point in real time, and vibrating string strain gauges are arranged in monitoring point 5 (as shown in Figure 5c) to measure the strain and temperature of the bottom steel plate. In order to analyze the stress of the post-pouring belt connection steel bar in the process of concrete pouring, a vibrating string steel bar meter is arranged on the steel bar (as shown in Figure 5d). When the stress of the steel bar inside the tested structure changes, the steel bar meter will be subjected to tensile or compression deformation, and the deformation will be transferred to the vibrating string to transform into the change of vibrating string stress, so as to realize the real-time test of steel bar stress.
During the pouring process, the entire section was poured only once, and the pouring process lasted 31 h.

2.2.2. Comparison

Under the action of the hydration reaction during the site pouring, the temperature variation curve of the concrete at each monitoring point on the post-pouring belt section is shown in Figure 6a. It can be seen from the figure that the temperature of concrete increases rapidly in the early stage, reaching the highest temperature at about 36 h, and the maximum measured temperature is 72.8 °C, which appears at the roof of the middle tube corridor at monitoring point 4, where the plate thickness is the largest. The subsequent temperature gradually decreases with the passage of time. After 7 days of concrete pouring, the temperature at the roof of the middle tube corridor was 56.0 °C, and the temperature at the bottom of the roadway and the middle position of the roof at monitoring points 1 and 3 decreased to about 47.0 °C.
The time variation curve of concrete temperature at each monitoring point simulated by the numerical model is shown in Figure 6b. This figure shows that the temperature of the concrete increases rapidly in the early stage, and reaches the maximum at each monitoring point at 34 h to 38 h, and the maximum simulated temperature at the middle span of the middle tube corridor roof is 71.9 °C. The subsequent temperature gradually decreases with time. After 7 days of concrete pouring, the simulated temperature at the middle span of the middle tube corridor roof is 56.8 °C, and the temperature at the bottom of the roadway and the roof at monitoring points 1 and 3 basically drops to about 47.4 °C.
Comparing the measured concrete temperature obtained by on-site monitoring with the simulated temperature obtained by the numerical model, as shown in Table 1, at several critical moments, the maximum error of simulated temperature is only 1.43%, and the trend of the two sets of curves is relatively consistent. However, there is an obvious platform development section in the site pouring monitoring curve (Figure 6a) at the initial stage of development, while the numerical model simulation curve rises rapidly at the beginning of the reaction, because the on-site pouring is completed in a certain period of time. The whole pouring process takes 31 h, so the temperature increase in each monitoring point is not significant during this period.
On the other hand, measuring point 5 was arranged on the bottom steel plate because the pouring of a large amount of concrete at the bottom is completed in a short time at the initial stage of pouring; the time-consuming effect of the pouring process on the measuring point 5 is relatively small. Comparing the measured temperature and the simulated temperature on the bottom steel plate at measuring point 5, as shown in Figure 7a, it can be seen that the two curves fit well in terms of the highest temperature, the occurrence time of the highest temperature, and the development law of the curve.
Compare the measured strain with the simulated strain on the bottom steel plate at point 5, as shown in Figure 7b. The bottom steel plate expands and shrinks correspondingly with the temperature rise and drop caused by the heat of hydration of concrete. In the early stage of concrete pouring, the bottom steel plate expands rapidly, and the maximum strain measured on site is 128 με. The maximum strain is calculated by numerical simulation and is 120 με. Subsequently, with the decrease in temperature, the bottom steel plate gradually shrank, and finally the bottom steel plate showed overall shrinkage.
Thus, it can be seen that the numerical model developed in this paper can effectively simulate the temperature and deformation of a full-section immersed tube under hydration reaction. The model can be used for further analysis to explore the influence of different connection forms of steel bars on the force of the immersed tube.

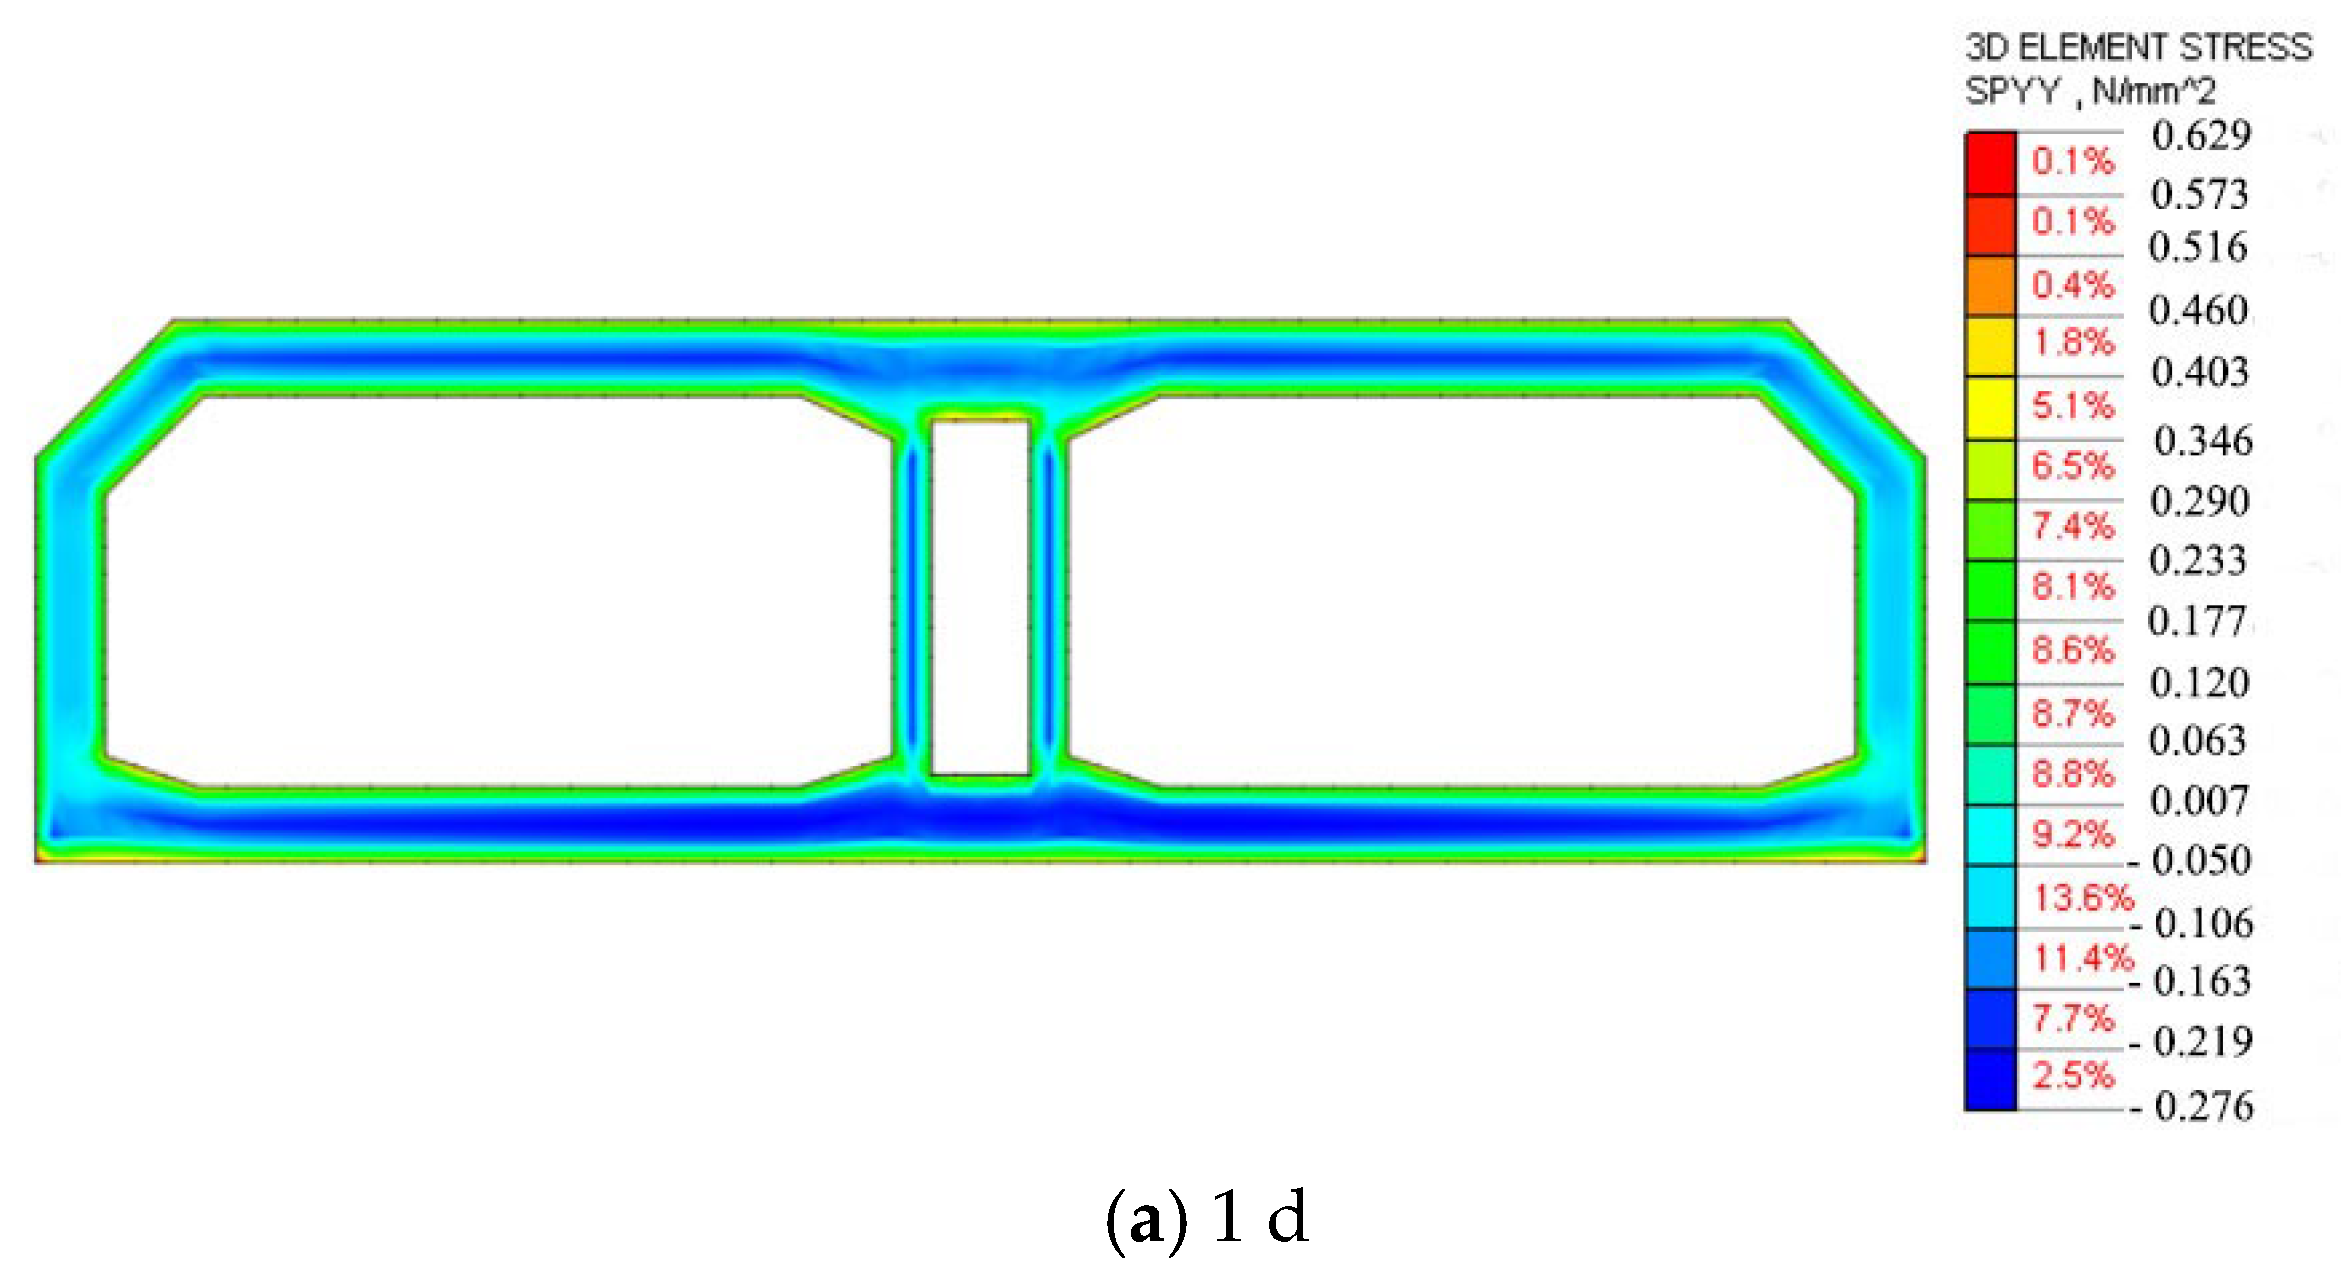
3. Cracking Analysis of Concrete

In the process of the segment pouring of immersed tube tunnel, the stress of the post-pouring belt section at the slice of the monitoring section is shown in Figure 8. It can be seen that the outer surface of the concrete is obviously stretched after being poured for 1 day, which is due to the significant temperature difference between the inside and outside of the concrete, which makes the surface position of the post-pouring segment stretched and the internal position compressed (the maximum compressive stress is 0.28 MPa). With the internal cooling of concrete, the bottom slab begins to be pulled and the tensile stress increases gradually, which is mainly caused by the restraint of the bottom steel plate. The bottom slab produces 1.56 MPa tensile stress when it is poured for 30 days.
As shown in Figure 9a, the concrete measuring points on the cross-section of the post-pouring belt are further selected, and the stress changes of concrete at each point are analyzed, in which the concrete tensile strength curve is calculated according to the Chinese “Standard for construction of mass concrete (GB50496-2018)” code [19]. As can be seen from Figure 9b, the concrete stress on the surface of the immersed tube (A and B) is first subjected to tension, and then compression. The stress in the internal position of the concrete (C and D) is first compressed and then stretched, and during the 0–3 d period in the early stage of concrete pouring, the tensile stresses at point A and point B are closer to the standard tensile strength, which are mainly caused by the internal and external temperature difference of concrete. So, in order to reduce the risk of cracking in the early stage of pouring, the temperature difference between the inside and outside of the tube section should be strictly controlled within 12 °C according to the technical parameters of the site pouring process.
The tensile strength of the concrete in Figure 9b is subtracted from the tensile stress of point A and point B, and the tensile reserve of concrete is obtained. The tensile stress of the immersed tube produced at point B under the action of dead weight is compared (as shown in Figure 9c). It can be seen that during the 0–3 days period in the early stage of pouring, the tensile stress in the middle span of the immersed tube roof caused by self-weight is greater than its tensile reserve, and if the mold is removed at this time, it is likely to cause cracking in the middle span of the immersed tube roof. Therefore, in order to reduce the cracking risk of post-pouring segment, the demolding time should be controlled after three days of pouring.
Figure 9d shows that the stress at the bottom of the middle tube corridor and carriageway changes over time. In the early stage of pouring, the temperature difference between the inside and outside of the concrete plays a significant role, and the surface of immersed tube concrete experiences tension (E and F) and internal pressure (G and H). With the hydration reaction, the bottom steel plate constraint starts to play a significant role, so that there is tensile stress in the bottom plate of the immersed tube. The interior of the bottom plate (G and H) is restrained by the temperature drop and the bottom steel plate, thus the tensile stress increases gradually. However, in the whole pouring process, the tensile stress of the bottom slab does not exceed the tensile strength of concrete. Compared with the immersed tube roof, the tensile stress caused by the weight of the bottom plate can be ignored due to the support of the tube bottom foundation, so the cracking risk of the bottom plate is lower than that of the roof.

4. Influence of Connection Form of Post-Pouring Steel Bar

In the above numerical analysis and site pouring process, the steel bars between the post-pouring belt and the surrounding immersed tube segment are not connected. Due to the different forms of disconnection of the reserved steel bar, it can be divided into five forms as follows, all of the connections of the steel bar post-pouring, the steel bar connection between the bottom plate and web only, the steel bar connection between the bottom plate and the outer wall web only, and the connection between the bottom plate and no connection only. In these forms, the post-pouring belt is connected with the surrounding immersed tube through steel bars, and the effects of different connection forms on the cracking, force and deformation of the immersed tube are explored.
All the steel bars in the axial direction of the post-pouring steel bars and the reserved steel bars of the surrounding immersed tube segments are connected by welding. To simulate this connection form, an elastic connection element is used to represent the connected steel bar. The elastic connection stiffness represents the axial stiffness of the post-pouring steel cage.
When all the post-pouring steel bars are connected, the stress of the post-pouring belt section at the slice of the monitoring section under the action of hydration reaction is shown in Figure 10. It can be seen that the outer surface of the concrete is obviously stretched during the first day of pouring, which is due to the significant temperature difference between the inside and outside of the concrete, which causes tension on the surface of the post-pouring segment and compression on the internal position (maximum compressive stress 0.30 MPa). With the internal cooling of the concrete, the bottom slab begins to be pulled and the tensile stress increases gradually, which is mainly caused by the restraint of the surrounding immersed tube segment by connecting the steel bar, and the floor produces a tensile stress of 1.89 MPa after being poured for 30 days. Comparing Figure 8 and Figure 10, it can be seen that the overall stress distribution of Figure 8 and Figure 10 is similar, but the maximum stress of Figure 10 is larger than that of Figure 8. It can be seen that by connecting the steel bar of the post-pouring belt with the surrounding immersed tube segment, the restraining effect of the surrounding immersed tube on the post-poured belt section will be increased, and the cracking risk of the post-poured belt will be increased.
Similarly, the hydration reaction of the immersed tube with only the steel bar connection between the bottom plate and the web, the steel bar connection between the bottom plate and the outer wall web, and the steel bar connection between the bottom plate are also analyzed together with the cases where all the post-pouring steel bars are connected and not connected, the maximum compressive stress on the post-pouring belt and maximum tensile stress on the bottom plate during 30 days of pouring are shown in Table 2.
Table 2 shows that the connection of bottom plate steel bars increases the maximum tensile stress in the full-section immersed tube post-pouring belt segment during the hydration reaction. This is because the connection of bottom plate steel bars enhances the interaction between the surrounding immersed tube and the post-pouring belt section, and in the later stage of hydration reaction, when the concrete starts to cool down, it shrinks along the axial direction, but the steel bar does not shrink significantly due to the restraint of the surrounding immersed tube. Therefore, the concrete floor is subjected to a certain tensile stress. When only the reinforcement of the bottom plate is connected, the maximum tensile stress increases by 16.0% compared to the no connection case, and if the steel bars of the immersed tube web and roof are also connected, the restraining effect of the surrounding immersed tube on the post-pouring belt becomes more pronounced. The maximum tensile stress is more than 20% higher than in the no connection case. The connection of steel bars between the post-pouring belt and the surrounding immersed tube segment will increase the risk of cracking in the full-section immersed tube floor.
The transverse deformation of the post-pouring belt section of the full-section immersed tube under the action of hydration reaction is analyzed. Figure 11a shows the transverse deformation diagram of the cross-section of the post-pouring belt at the slice of the monitoring section where none of the post-pouring steel bars are connected to the surrounding immersed tube segments, from which it can be seen that the immersed tube experiences some lateral expansion under the action of hydration reaction. Due to the restraint of the steel plate beneath the bottom plate and the friction constraint of the ground, the expansion deformation of the bottom plate is smaller while the roof deformation is larger. The maximum deformation occurs on both sides of the near outer wall of the roof, with a maximum deformation of 0.96 mm. Figure 11b shows the transverse deformation diagram of the cross-section of the post-pouring belt at the slice of the monitoring section where all the post-pouring steel bars are connected to the surrounding immersed tube segments. Compared to Figure 11a, we can see that the two deformation patterns are essentially the same, but the maximum deformation is 0.80 mm. By connecting the steel bar, the surrounding tube section plays a certain role in limiting the transverse deformation of the post-pouring belt.
Similarly, the transverse deformations of the section of the immersed tube with only the steel bar connection between the bottom plate and the web, the steel bar connection between the bottom plate and the outer wall web, and the steel bar connection between the bottom plate and the bottom plate are simulated under the action of hydration reaction, and the results are shown in Table 3. It can be seen from Table 3 that as the steel bar connection between the post-pouring belt and the surrounding immersed tube gradually strengthens, the transverse deformation of the section of the immersed tube gradually decreases, and the axial constraint can also limit the transverse deformation of the immersed tube to some extent, especially considering the short length of the post-pouring belt. In addition, connecting only the bottom plate reduces the transverse deformation by only 3.1%, which is relatively limited, while constraining the bottom plate and web (and roof) at the same time can significantly reduce the transverse deformation by more than 10%. This is because when the sidewall is constrained, the lateral deformation of the roof will also be limited.
In addition, measures to reduce the heat of hydration like using low-heat cement, fiber reinforced concrete should be the effective way to the hydration reaction effect of the full-section immersed tube.

5. Conclusions

By developing the numerical model of full-section immersed tube with a post-pouring belt, and analyzing the force, cracking and deformation of the segment of post-pouring belt section under the action of hydration reaction, the following main conclusions can be obtained.
(1)
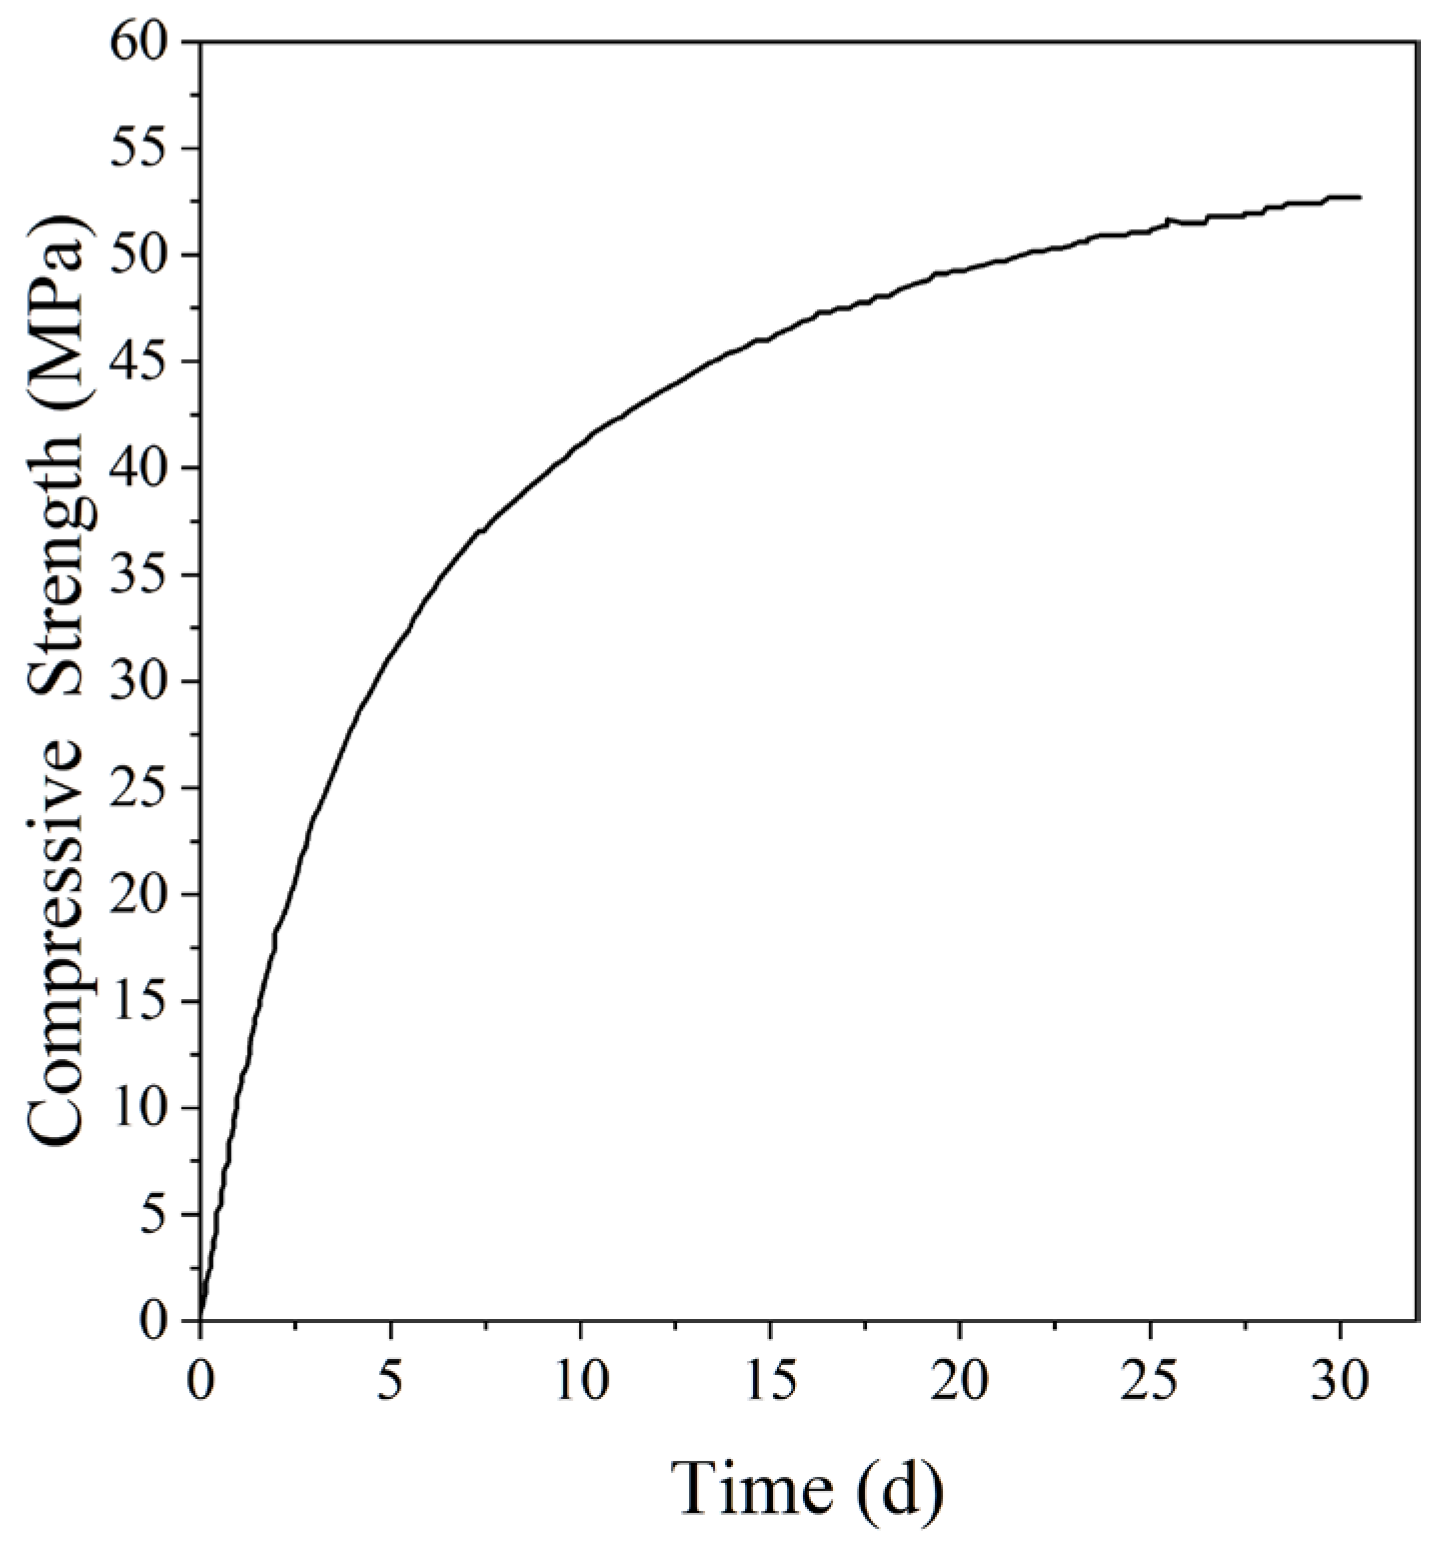
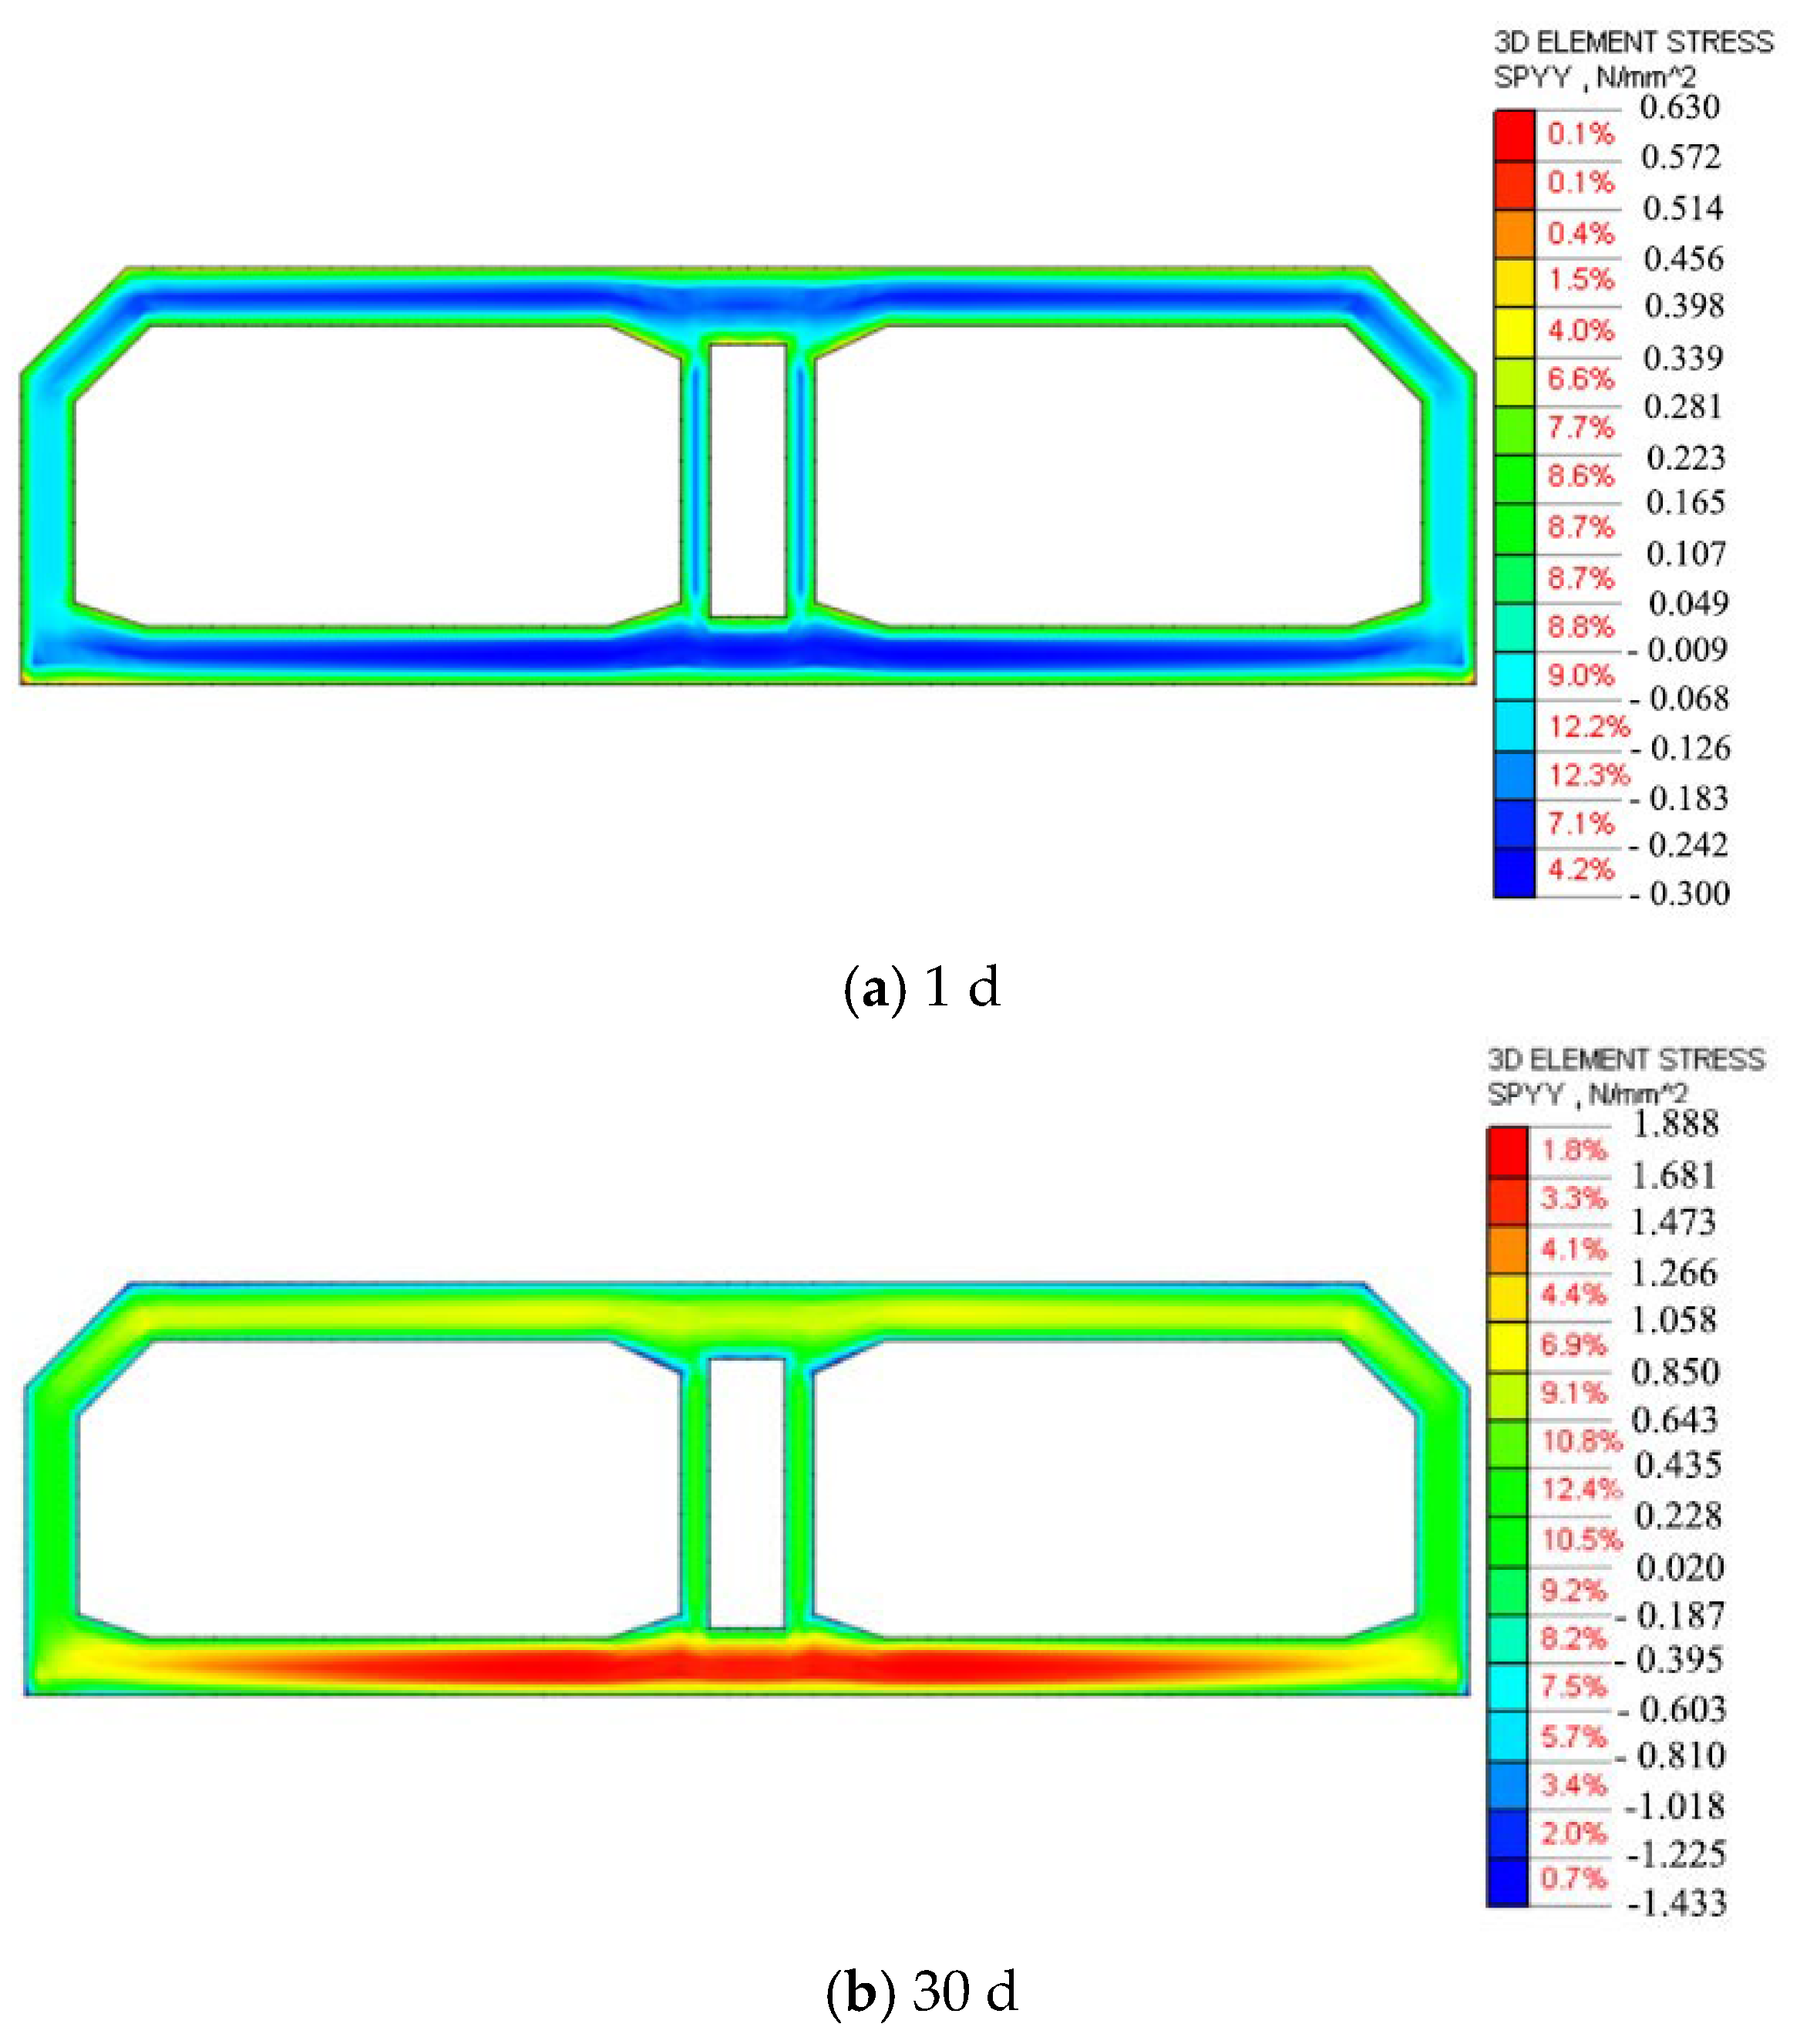
During the hydration reaction, the temperature of concrete increases rapidly in the early stage and reaches its highest temperature at about 36 h, which occurs at the roof of the tube gallery with the largest thickness. It then gradually decreases with time, and the bottom steel plate expands and shrinks with the hydration of concrete. It expands rapidly in the early stage of concrete pouring and then gradually shrinks with the decrease in temperature. Finally, the bottom steel plate as a whole shows shrinkage.
(2)
To reduce the risk of cracking in the early stage of pouring, the temperature difference between the inside and outside of the tube section should be strictly controlled within 12 °C, and the demolding time should be set to 3 days after pouring. As the concrete cools down, the bottom plate starts to expand.
(3)
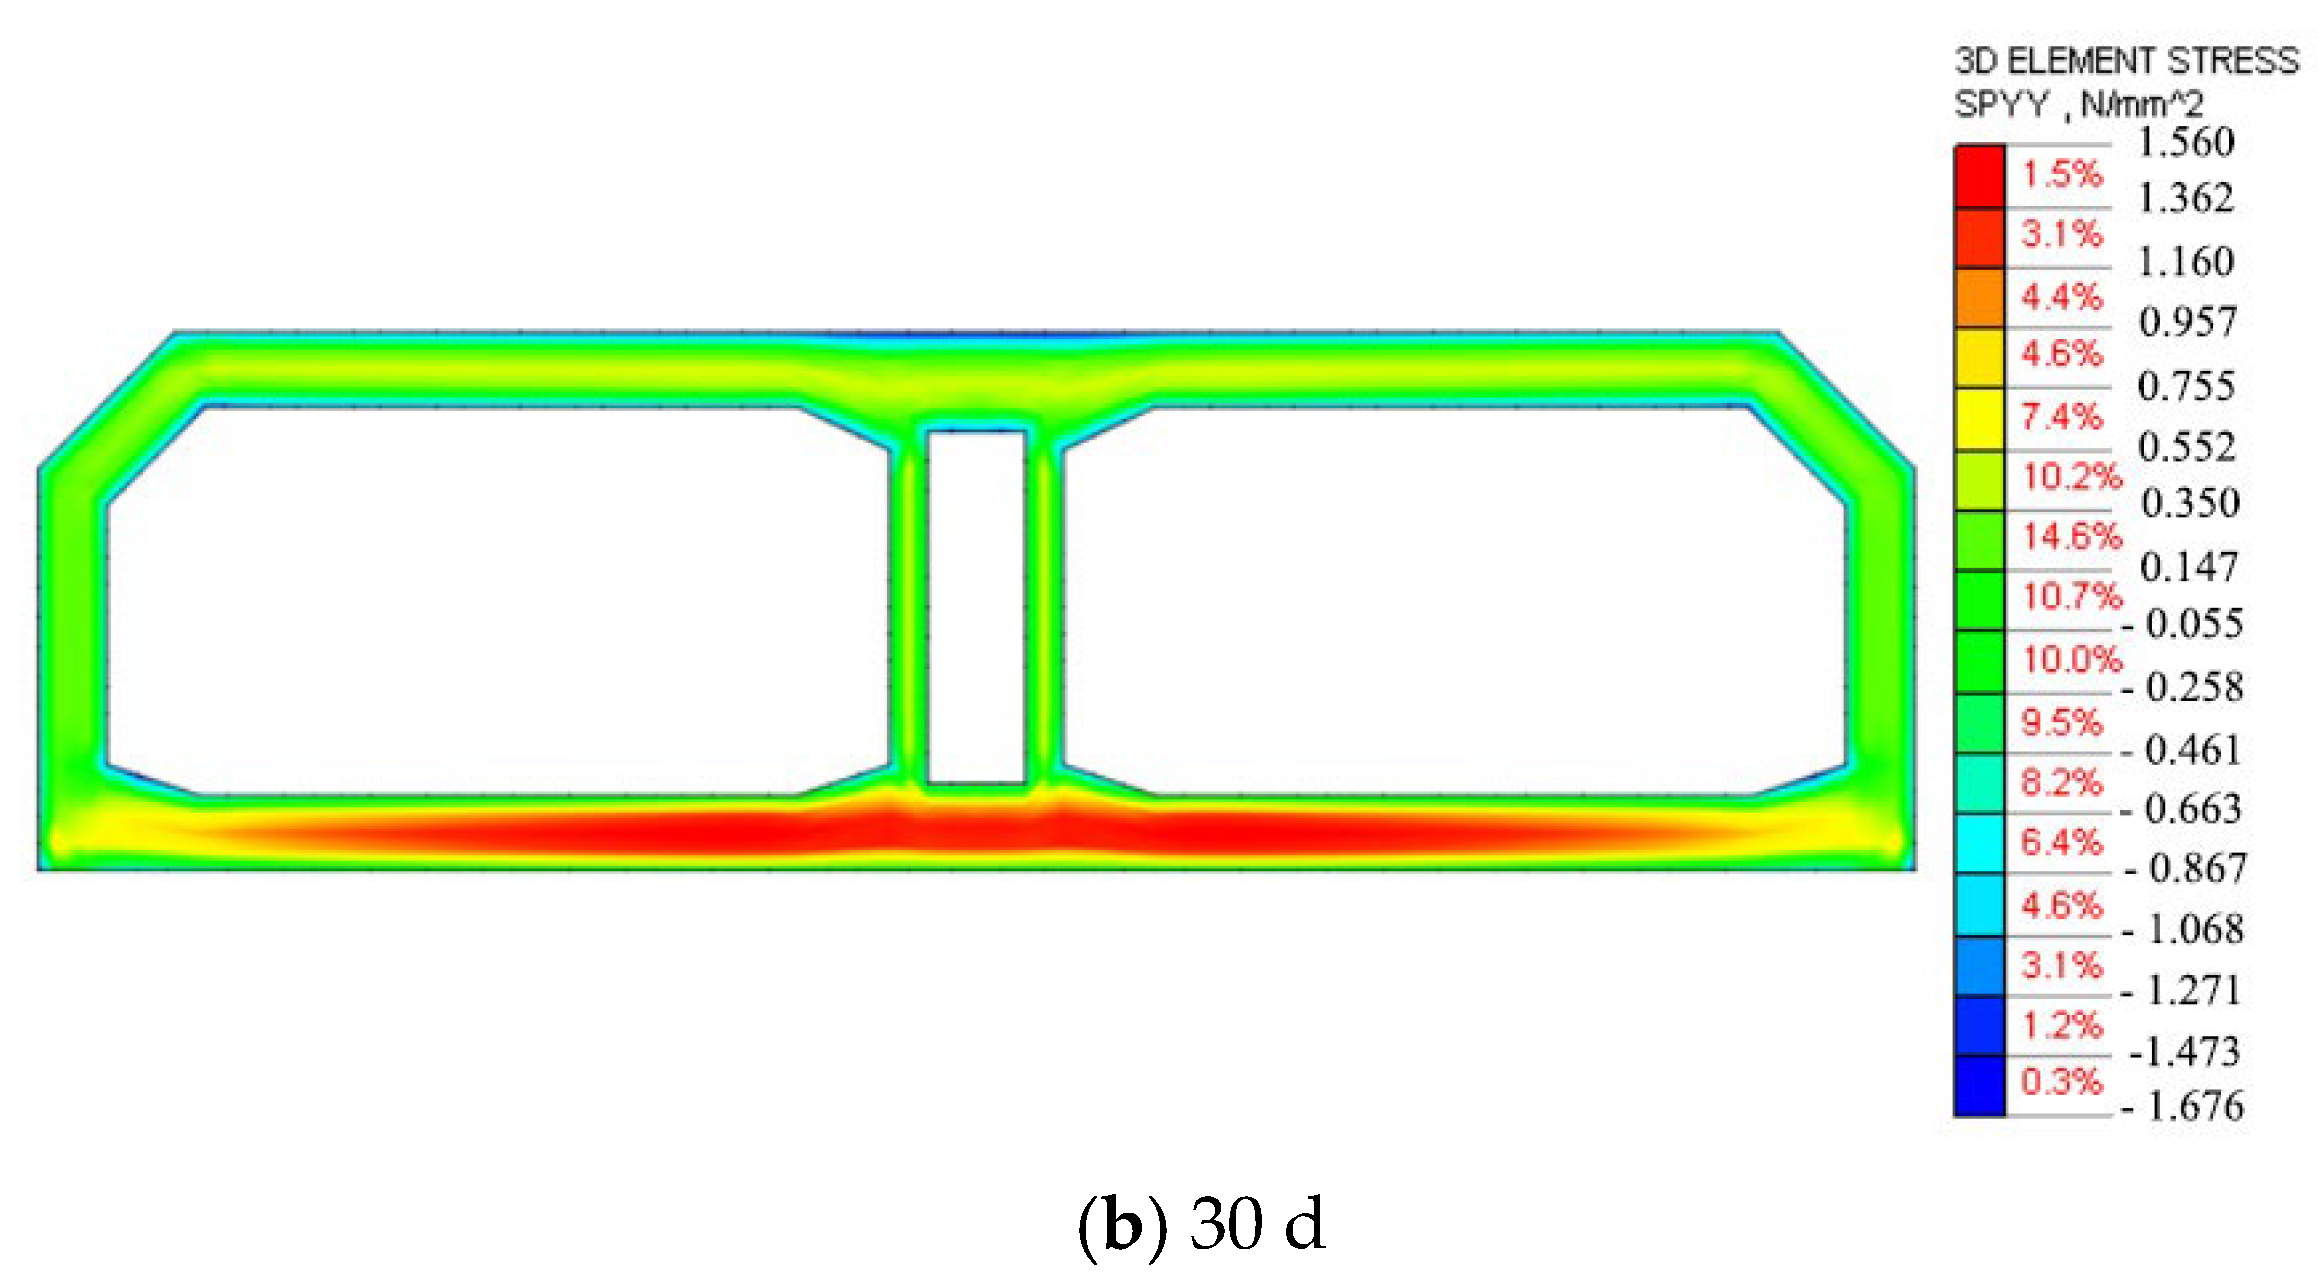
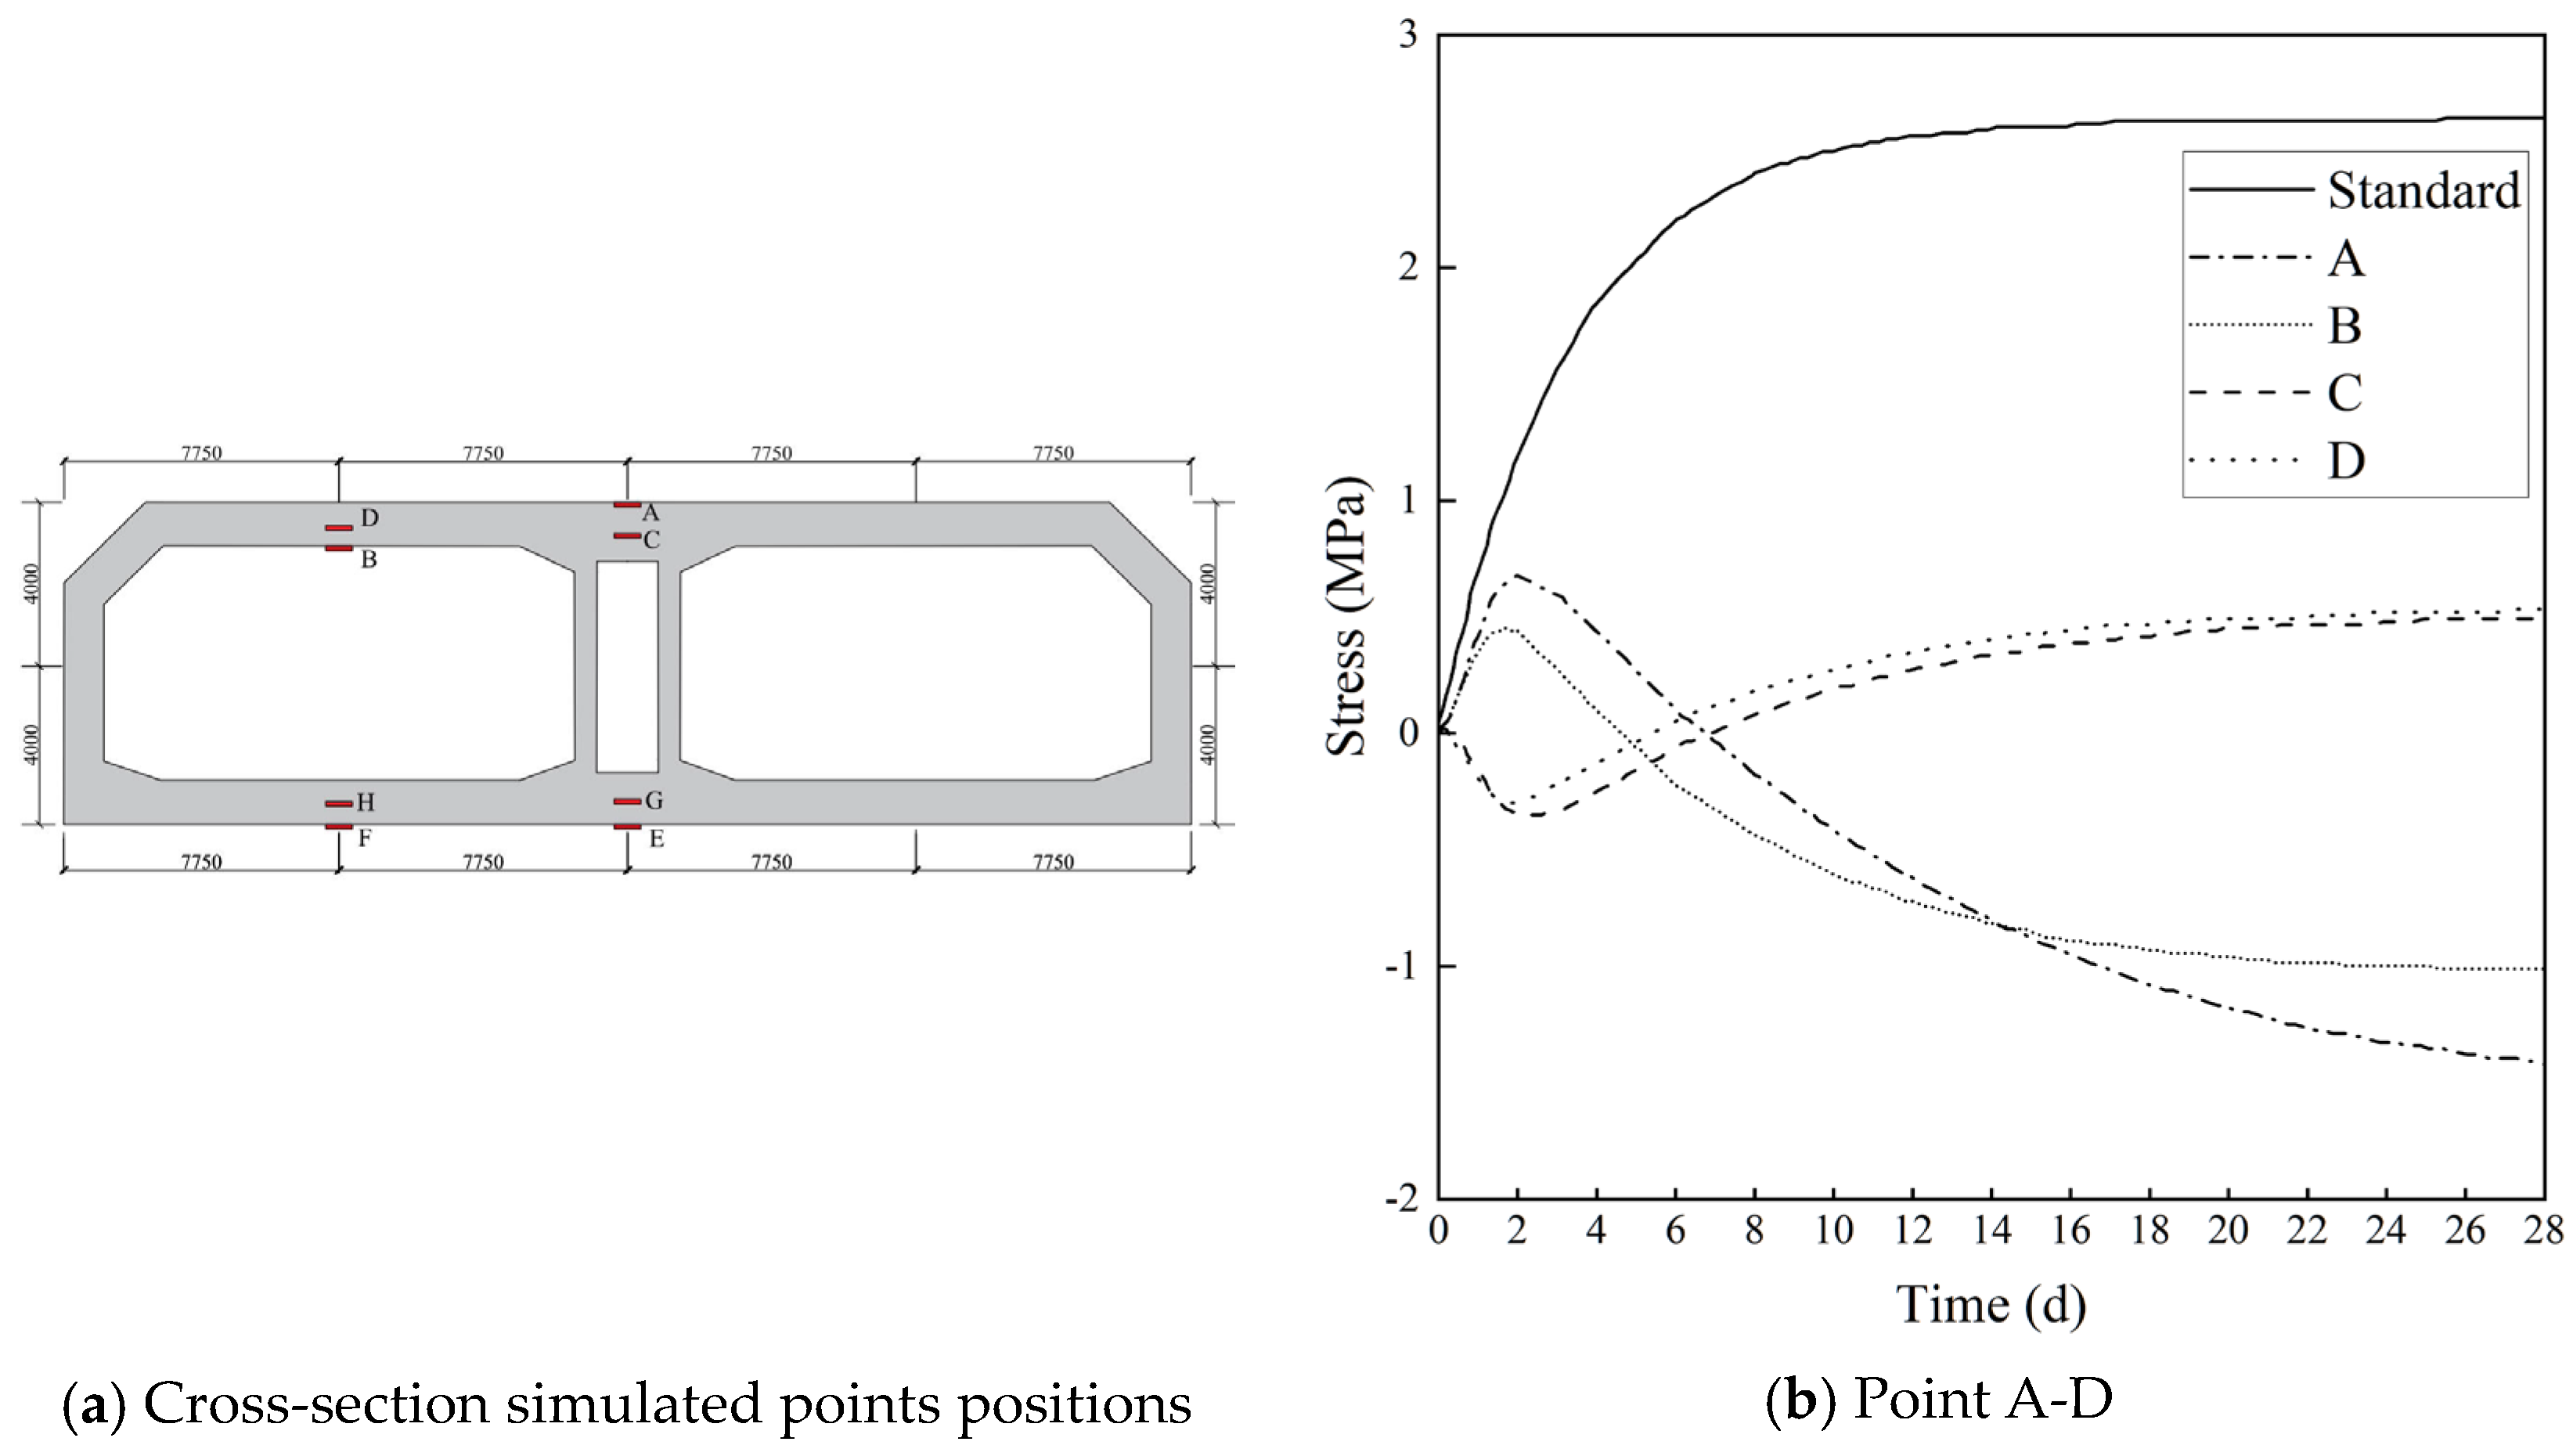
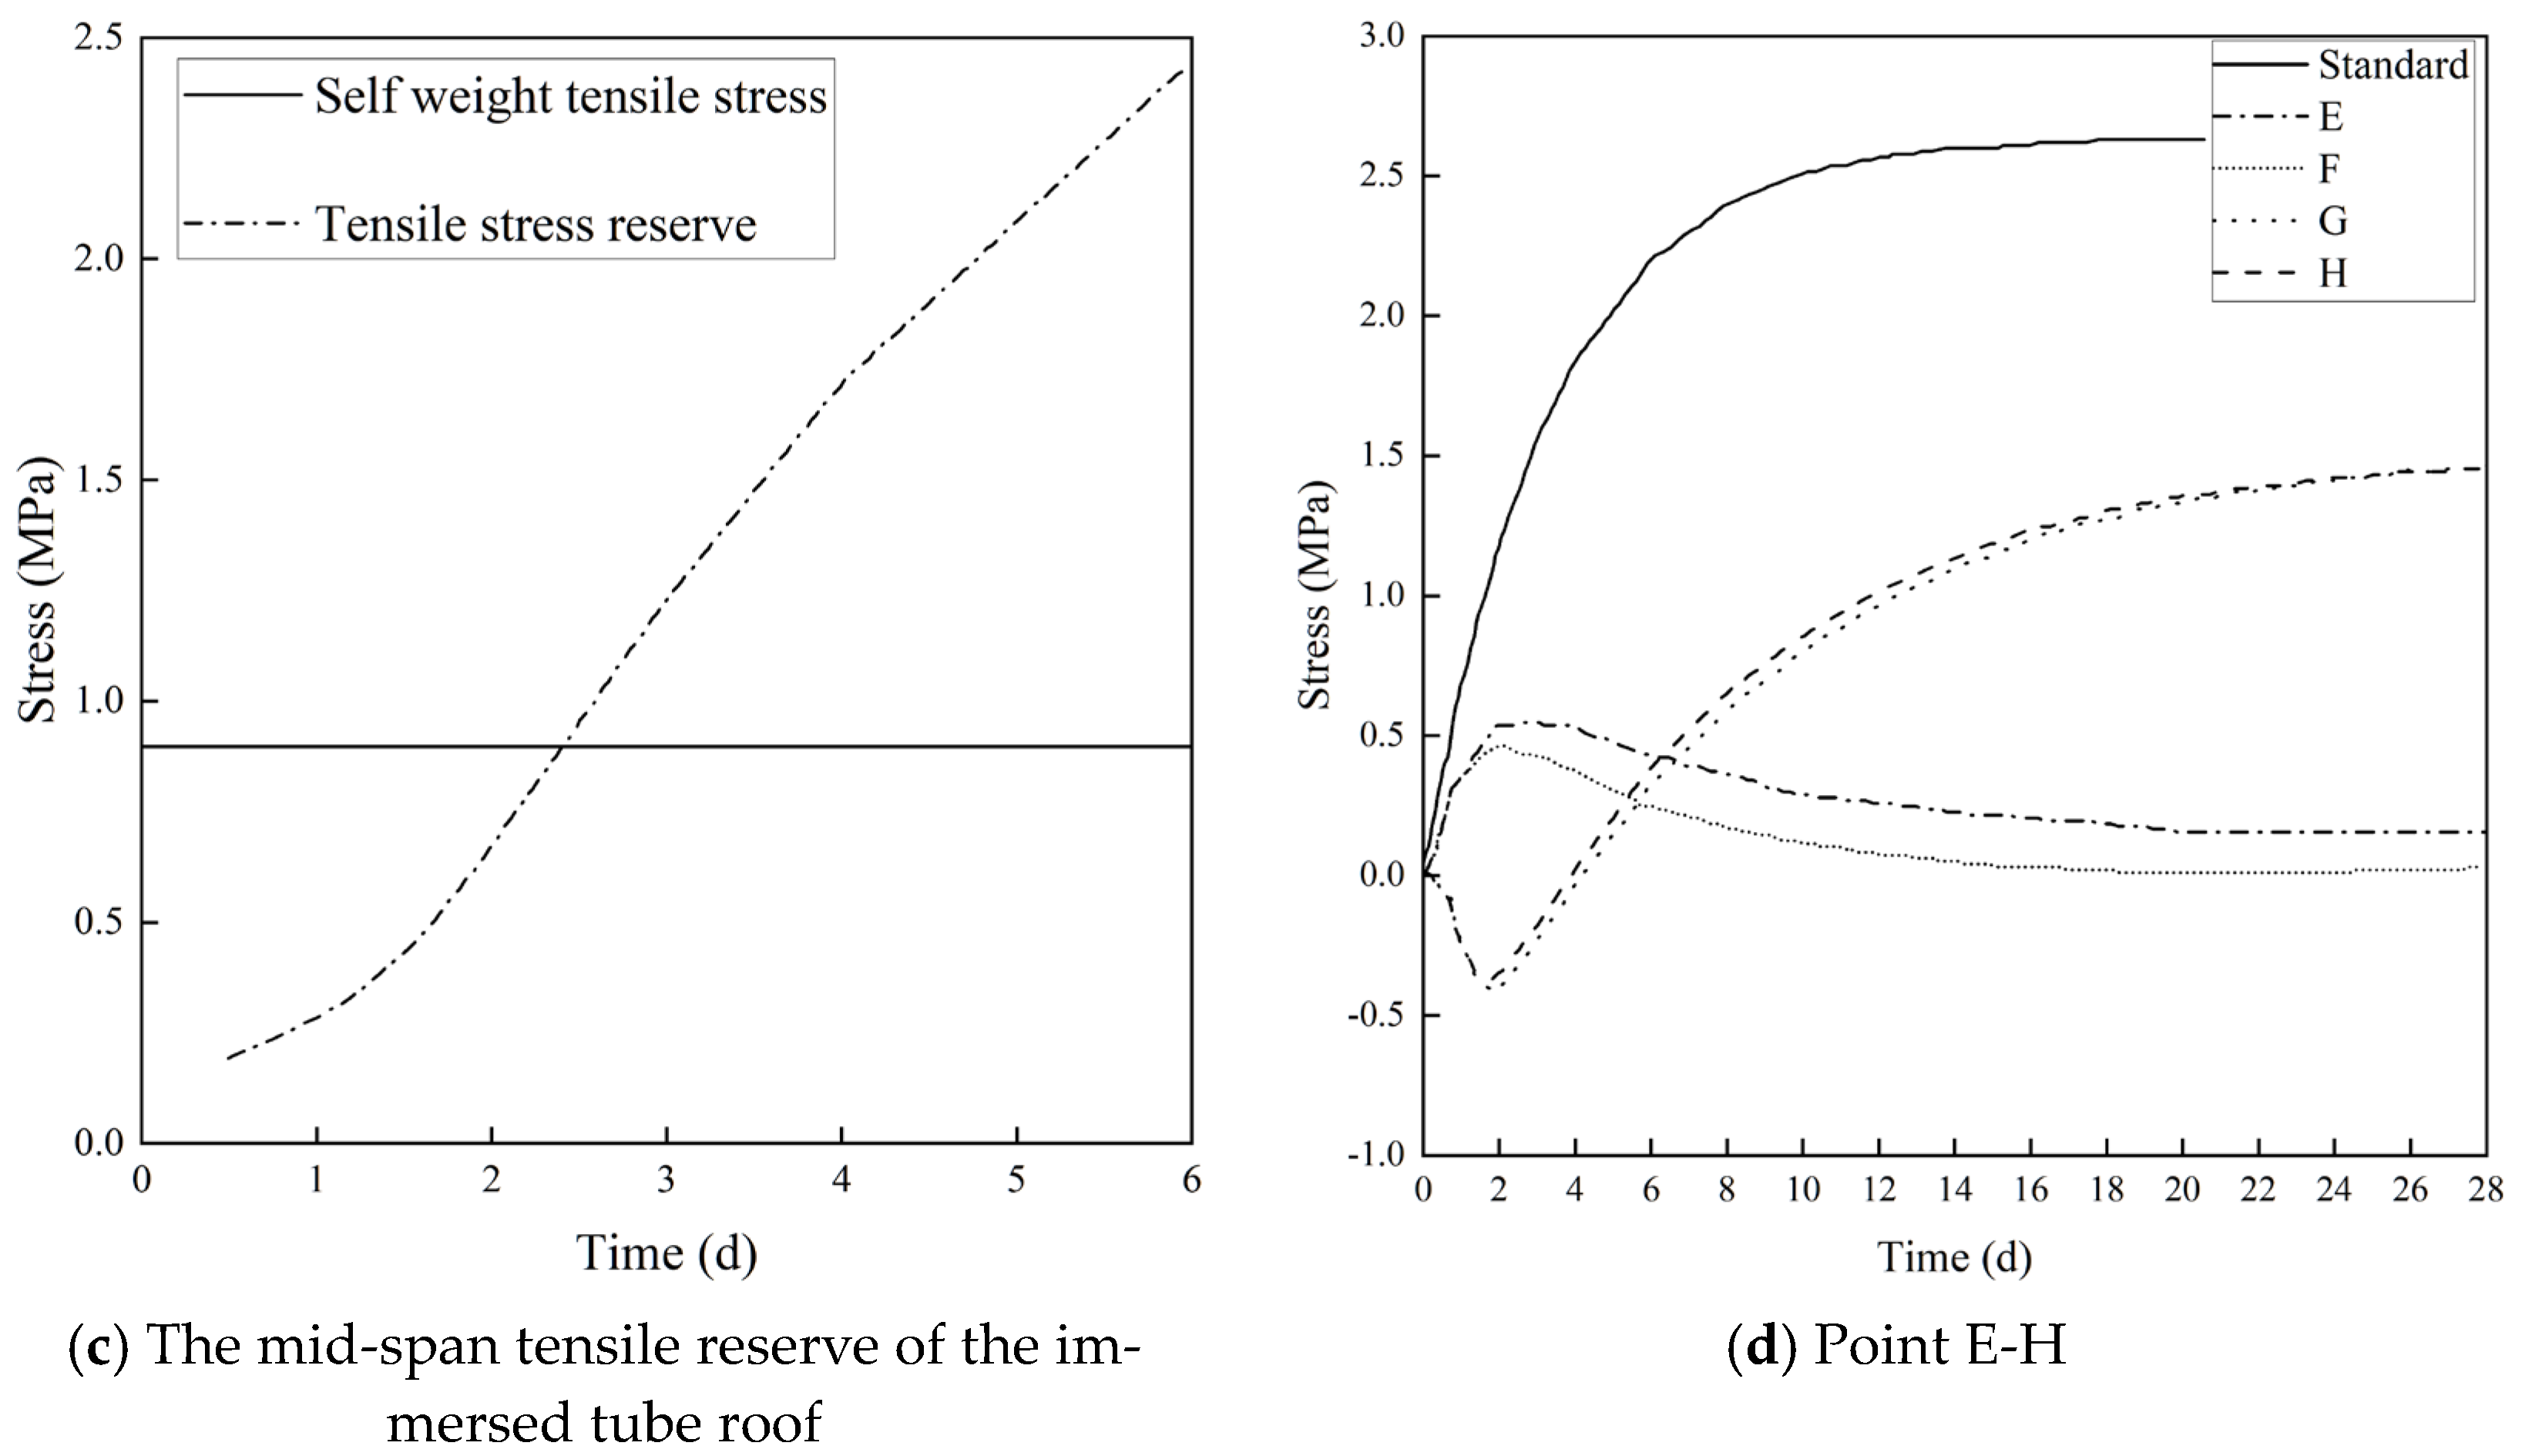
The steel bar connection between the post-pouring belt and the surrounding immersed tube segment increases the risk of cracking in the full-section of the immersed tube bottom plate; when only the bottom plate steel bar is connected, the maximum tensile stress of the immersed tube bottom plate is 16.0% higher than that in the no connection case. If the steel bars of the immersed tube web and roof are also connected, the restraint effect of the surrounding immersed tube on the post-pouring belt section becomes more apparent, and the maximum tensile stress is more than 20% higher than that in the no connection case.
(4)
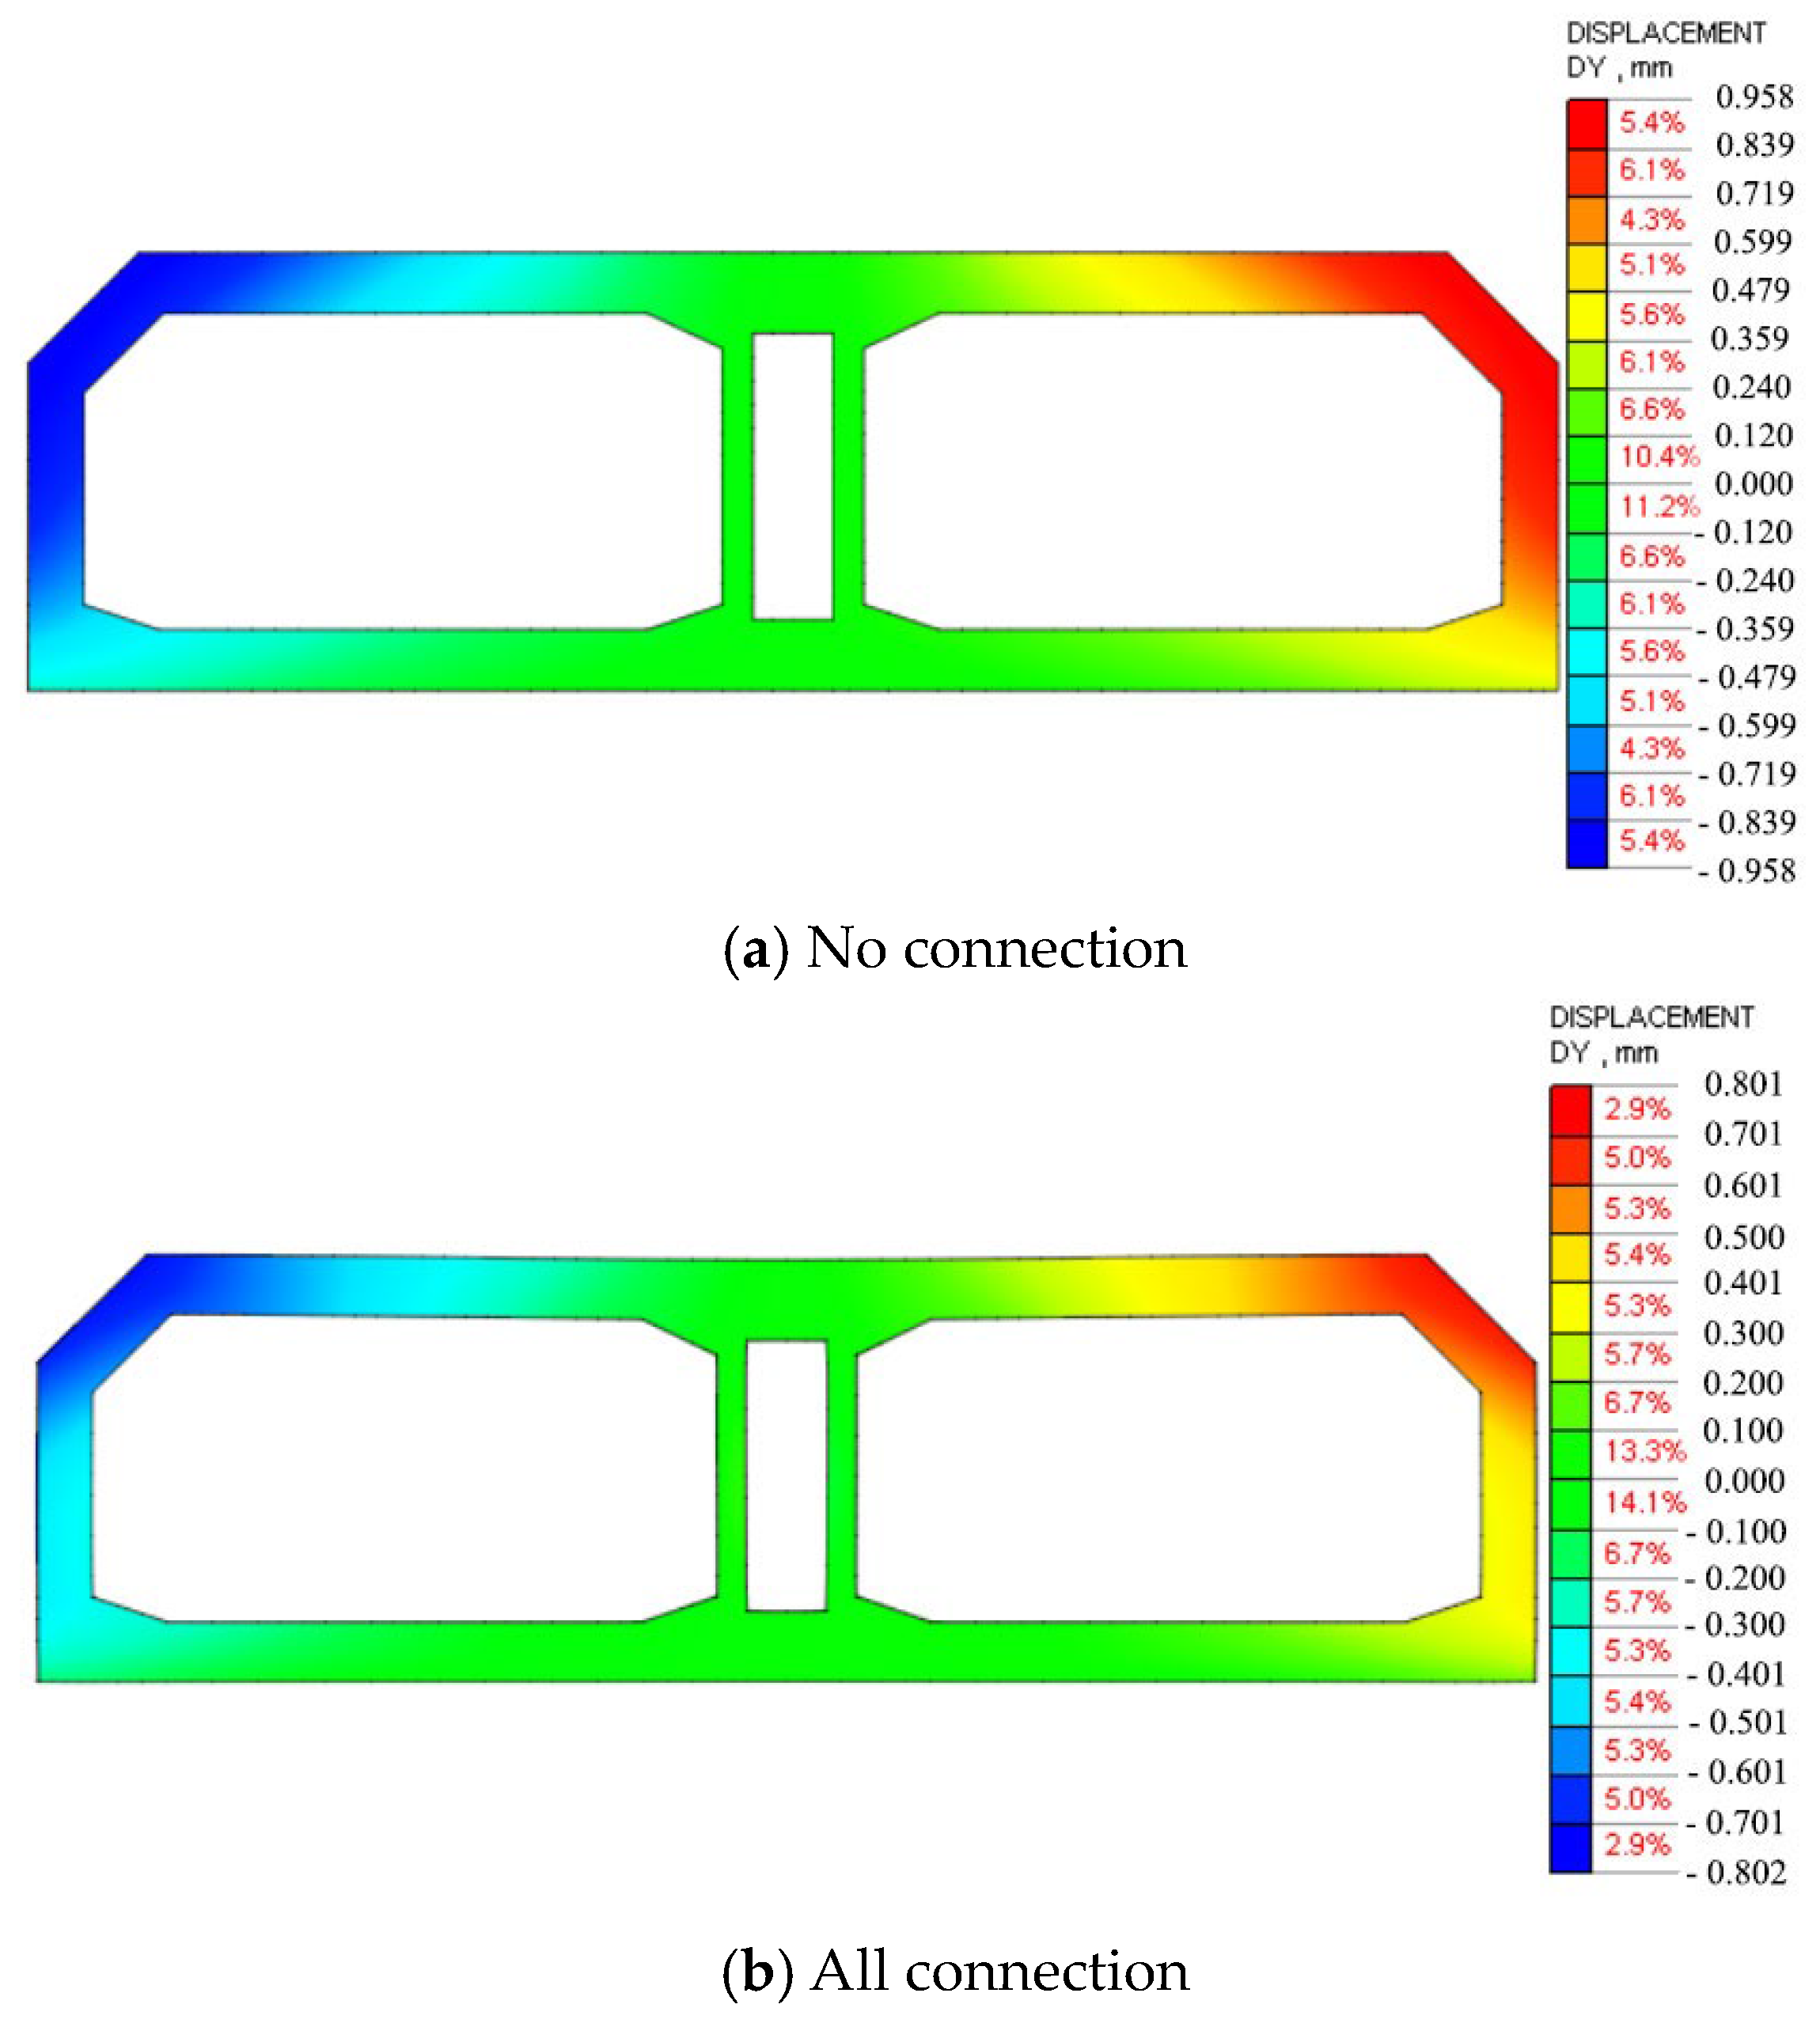
By connecting the steel bar, the peripheral tube section plays a certain role in limiting the transverse deformation of the post-pouring belt. Gradually strengthening the steel bar connection between the post-pouring belt and the surrounding immersed tube will gradually reduce the transverse deformation of the immersed tube section. Only connecting the bottom plate reduces the transverse deformation by only 3.1%, while constraining the bottom plate and web (and roof) can significantly reduce the transverse deformation by more than 10%.

Author Contributions

Conceptualization, P.-J.L.; methodology, M.-J.C.; software, M.-J.C.; validation, M.-J.C. and W.-H.S.; investigation, W.-H.S.; resources, P.-J.L.; data curation, P.-J.L. and M.-J.C.; writing—original draft preparation, P.-J.L. and M.-J.C.; writing—review and editing, M.-J.C. All authors have read and agreed to the published version of the manuscript.

Funding

This research received no external funding.

Data Availability Statement

The data presented in this study are available on request from the corresponding author.

Acknowledgments

The authors are grateful to CCCC Fourth Harbor Engineering Institute Co., Ltd. for the financial grant.

Conflicts of Interest

The authors declare no conflict of interest.

References

  1. Zhao, J.; Gan, C.J.; Li, W.J. Seismic analysis of the south bank section and wind tower structures of Dalian Bay subsea immersed tube tunnel. J. Earthq. Eng. 2023, 45, 772–779+791. [Google Scholar]
  2. Deng, B.; Huang, Q.F.; Jin, W.L. Rationally Constructed of Immersed Push-out Final Joint in Water of Shen-Zhong Link (J/OL). Tunn. Constr. 2023. Available online: http://kns.cnki.net/kcms/detail/44.1745.u.20230626.1920.004.html (accessed on 29 August 2023).
  3. Xu, Y.; Liu, M.H.; Xu, G.P. Key Technologies for Land Closure Joint Stopping of Xiangyang Yuliangzhou Hanjiang Immersed Tunnel (J/OL). Tunn. Constr. 2023. Available online: http://kns.cnki.net/kcms/detail/44.1745.U.20230711.1355.004.html (accessed on 29 August 2023).
  4. Zeng, B.C.; Pan, C.Z.; Ren, Y.P. Study on Scheme Selection of Supporting Structure Design for Deep FoundationExcavation of Dry Dock on Immersed Tunnel Axis. Constr. Technol. 2023, 52, 42–48. [Google Scholar]
  5. Xu, Y.; Xu, G.P.; Chen, W.L. Suitable Layout of the DCM Composite Foundation of Shen-Zhong Link Immersed Tunnel (J/OL). Tunn. Constr. 2023. Available online: http://kns.cnki.net/kcms/detail/44.1745.U.20230808.1354.006.html (accessed on 29 August 2023).
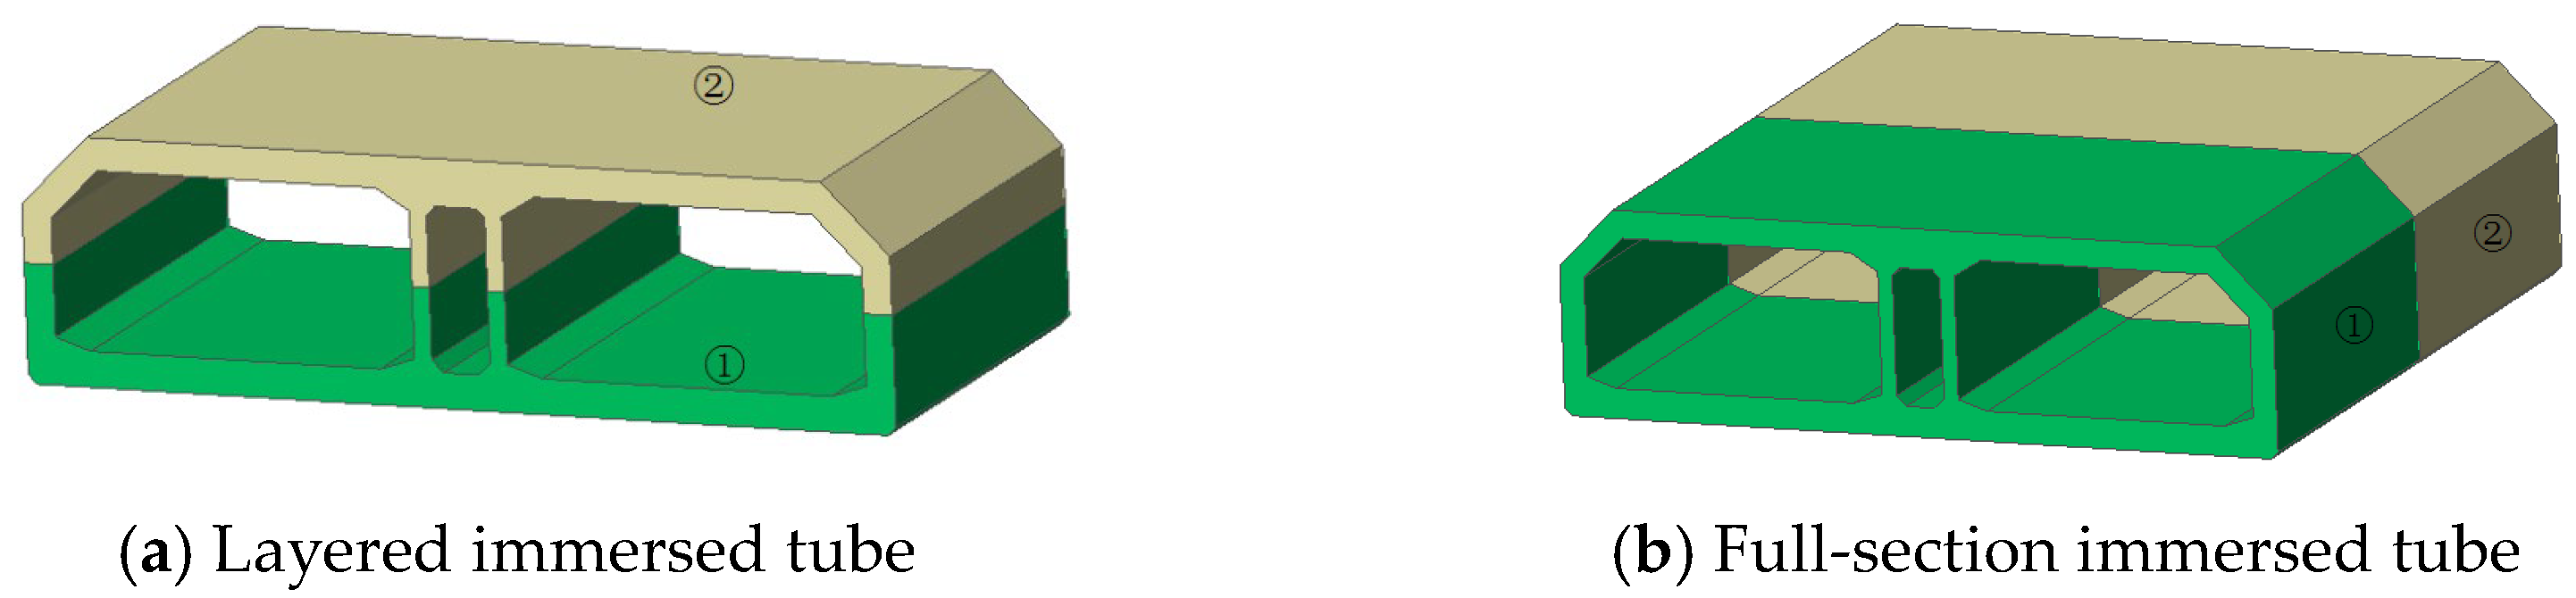
  6. Li, C.; Wang, S.N.; Wang, Y.F. Crack-control Technology for Full-face Pouring Precast Immersed Tube of Hong Kong-Zhuhai-Macao Bridge. Constr. Technol. 2012, 41, 5–8+18. [Google Scholar]
  7. Wang, Y.F.; Li, C.; Zhang, B.L. Study on Construction Performance of Immersed Tube Full Section Concrete Grouting in Full-scale Model Test. Constr. Technol. 2014, 43, 6–9+15. [Google Scholar]
  8. Dong, Z.; Huang, W.H. Integral replacement technique for reinforcing cages full-section of immersed tube. China Harb. Eng. 2015, 35, 92–95. [Google Scholar]
  9. Wang, X.D.; Dong, H.J. Analysis on influencing factors of full-section hydraulic internal mould deformation in immersed tube prefabrication. China Harb. Eng. 2019, 39, 15–19+30. [Google Scholar]
  10. Zhang, T.; Zhu, C.; Chen, J.B. Supporting dry dock system and arrangement method for immersed tube full- section pouring. China Harb. Eng. 2022, 42, 44–47. [Google Scholar]
  11. Fonseca, E.; Melo, F. Numerical solution of curved pipes submitted to in-plane loading conditions. Thin Walled Struct. 2010, 48, 103–109. [Google Scholar] [CrossRef]
  12. Sun, J.H.; Chen, R.Y.; Yuan, J. Experimental Study and Numerical Simulation on Hydration Heat of Large-volume Iron Tailings Concrete. J. Shandong Agric. Univ. 2023, 54, 440–446. [Google Scholar]
  13. Zou, H.Q.; Bai, H.T.; Li, M. Measurement and Simulation Analysis of Hydration Heat of Layered Pouring Concrete Box Girder. China Concr. Cem. Prod. 2022, 06, 77–81. [Google Scholar]
  14. Wu, Z.J.; Ma, Q.J.; Zhu, Y. Numerical Simulation Study on Thermal Damage of Concrete. Numer. Simul. Study Therm. Damage Concr. 2023, 8, 114–117. [Google Scholar]
  15. Liu, J.; Sun, C.; Zhao, S. Simulation of thermal performance of composite insulated blocks with recycled aggregate concrete. Concrete 2022, 8, 119–124. [Google Scholar]
  16. Li, W.C.; Hu, L.M.; Zeng, Y. Numerical Simulation Analysis of Onshore Wind Turbine Foundation and Reinforcement Body Hydration Heat Based on ABAQUS. Water Resour. Power 2021, 39, 192–195+200. [Google Scholar]
  17. GB50010-2010; Code for Design of Architecture & Concrete Structures. China Architecture & Building Press: Beijing, China, 2010. (In Chinese)
  18. Dong, F.Q.; Huang, G.S. Simulation Analysis and Temperature Control Research on Hydration Heat of Mass Concrete in Pile Caps Based on MIDAS/FEA. Pet. Chem. Constr. 2021, 43, 131–133. [Google Scholar]
  19. GB50496-2018; Standard for Construction of Mass Concrete. China Architecture & Building Press: Beijing, China, 2018. (In Chinese)
Figure 1. Immersed tunnel.
Buildings 13 02377 g001
Figure 2. Numerical model of full-section immersed tube.
Buildings 13 02377 g002
Figure 3. Curve of concrete compressive strength.
Buildings 13 02377 g003
Figure 4. Site pouring.
Buildings 13 02377 g004
Figure 5. Monitoring Layout.
Buildings 13 02377 g005
Figure 6. The temperature change curve at the concrete monitoring points 1–4 on cross-section.
Buildings 13 02377 g006
Figure 7. Comparisons of the temperature and strain at monitoring point 5.
Buildings 13 02377 g007
Figure 8. Stress diagram of the post-pouring belt section (no connection).
Buildings 13 02377 g008aBuildings 13 02377 g008b
Figure 9. Stress curve of post-pouring concrete.
Buildings 13 02377 g009aBuildings 13 02377 g009b
Figure 10. Stress diagram of the post-pouring belt section (all connection).
Buildings 13 02377 g010
Figure 11. Lateral deformation diagram of the cross-section of the post-pouring belt.
Buildings 13 02377 g011
Table 1. Comparison of temperature.
PositionTimeMeasured
Temperature/°C
Simulated
Temperature/°C
Error/%
Point 4the maximum moment72.871.9−1.24
Point 47 d56.056.81.43
Points 1 and 37 d47.047.40.85
Table 2. Concrete stress under hydration reaction.
Connection FormMaximum Compressive Stress/MPaIncrease Proportion/%Maximum Tensile Stress/MPaIncrease Proportion/%
No connection0.2801.560
Only connection between bottom plate0.293.61.8116.0
Only connection between bottom plate and outer wall web0.307.11.9122.4
Only connection between bottom plate and web0.307.11.9223.1
All connection0.307.11.8921.2
Table 3. Lateral deformation of cross-section under hydration reaction.
Connection FormMaximum Deformation/mmReduce Proportion/%
No connection0.960
Only connection between bottom plate0.933.1
Only connection between bottom plate and outer wall web0.8610.4
Only connection between bottom plate and web0.8313.5
All connection0.8016.7
Disclaimer/Publisher’s Note: The statements, opinions and data contained in all publications are solely those of the individual author(s) and contributor(s) and not of MDPI and/or the editor(s). MDPI and/or the editor(s) disclaim responsibility for any injury to people or property resulting from any ideas, methods, instructions or products referred to in the content.

