Article

Early Age Performance of OPC-GGBFS-Concretes Containing Belite-CSA Cement Cured at Sub-Zero Temperatures

Building Materials Group, Department of Civil, Environmental and Natural Resources Engineering, University of Technology, 97187 Luleå, Sweden
*
Author to whom correspondence should be addressed.
Buildings 2023, 13(9), 2374; https://doi.org/10.3390/buildings13092374
Submission received: 27 August 2023 / Revised: 16 September 2023 / Accepted: 17 September 2023 / Published: 18 September 2023
(This article belongs to the Special Issue Cement and Concrete Research)

Abstract

:
This study determined how replacing sodium nitrate-based antifreeze admixture (AF) with belite-calcium sulfoaluminate (belite-CSA) cement affects the early age properties of ecological concretes based on ordinary Portland cement (OPC) and ground granulated blast-furnace slag (GGBFS). Concrete specimens were cured at −15 °C and treated in various ways before testing, i.e., no treatment, stored at 20 °C for 12 and 24 h. Generally, the addition of belite-CSA cement shortened the setting time due to the rapid formation of ettringite. The incorporation of 25 wt% of antifreeze admixture (AF) to the OPC-GGBFS concrete cured at −15 °C partially inhibited ice formation and enabled the continuation of hydration processes. This trend was observed for all samples, independent of the applied AF after freezing curing. On the contrary, the addition of 20 wt% of CSA failed to inhibit the ice formation and increased the risk of frost damage for concretes despite the treatment after freezing. These concrete specimens had lower hydration, lower strength, and a more porous binder matrix. The microstructure of the binder matrix was significantly affected by the amount of CSA and extreme negative curing, followed by no notable recovery post-curing at room temperature. Therefore, pre-curing at room temperature for at least 6 h has the potential to avoid frost damage. Concrete containing 25 wt% AF combined with 12 h and 24 h of curing at 20 °C after removal from freezing and prior to testing could enhance the compressive strengths of all concretes. The renewed hydration was indicated as the main influencing factor.

1. Introduction

Winter construction is a very arduous process, particularly in areas where the temperature remains below 5 °C for many months. The three most frequently faced problems are the delay in formwork removal, slower strength development, and freezing of mixing and pore water. At lower temperatures, the hydration rate of the cement is significantly delayed with prolonged setting time and a 20–40% decrease in strength [1,2,3]. When the temperature drops to −4 °C or lower during freezing, approximately 92% of the fresh water in the concrete’s binder matrix is converted to ice, followed by hydrostatic pore pressure [4]. Consequently, a 9% increase in concrete volume, as well as internal and surface microcracks are observed [5,6,7,8]. Moreover, pore size and cooling rates are crucial in determining the phase transition of pore water. Larger pore size and slower cooling rates result in faster freezing due to the sufficient time for the ice front to spread and to the low pore vapor pressure [9,10,11,12,13]. A compressive strength of 3.5 MPa developing at an early age considerably limits frost damage. Nevertheless, to overcome such situations, a number of precautionary measures are recommended when the air temperature falls below 5 °C or is below 10 °C for at least 12 h throughout the day [14,15,16,17]. These include heating the mixing water or aggregates, covering concrete with isolative blankets, or adding heating systems to the formworks [18]. Moreover, these prototypes not only increase the total cost of production but also account to add in total CO2 emissions. The most effective and economical alternative is to use accelerating and/or antifreeze chemical admixtures, which accelerate hydration and increase the early strength, thus preventing the mixing water from freezing and reducing the internal pressure of expanding ice [11,19,20,21,22,23]. Antifreeze agents commonly react with calcium hydroxide to form hydroxy salts, which change the pH and ionic strength. Yet, because of the fusion of the interacting components and chemicals, estimating the eutectic temperature for concrete is relatively complex [24,25,26].
As commonly known, for every ton of manufactured OPC, between 0.5 and 0.8 tons of CO2 are emitted, which account for 6–7% of the world’s carbon footprint [27,28]. To reduce the negative impact caused by the cement industry and promote sustainable construction, supplementary cementitious materials (SCMs) such as ground granulated blast furnace slag (GGBFS), fly ash (FA), and silica fume (SF) are partially or entirely replacing the OPC. SCMs can delay or accelerate the hydration of OPC, preferably observed at either ambient or accelerated curing temperatures. At freezing temperatures, hydration is further significantly delayed or even inhibited, causing permanent damage to the binder matrix [23,29]. In these circumstances, in OPC-GGBFS systems, the usage of chemical antifreeze agents is advantageous and can considerably delay the formation of pore ice [26]. The ions present in the antifreeze agent often establish an aqueous path within the binder matrix and limit the hydrostatic pore pressure forming during the formation of ice [30,31].
Another potential alternative to accelerate hydration processes at low temperatures is the use of calcium sulfoaluminate (CSA) cement. These cements are known for their rapid setting, favorable antifreeze properties, and excellent anti-permeability [11,32,33,34]. Additionally, CSA required roughly 60% less limestone for its production in comparison with OPC. The clinkering temperatures are lower, ranging from 1250 °C to 1350 °C, with the ability to be lowered to 1100 °C [35,36]. Thus, it exhibits relatively lower density and needs lower grinding energy followed by lower CO2 emissions [34,37,38,39]. The CSA is mainly composed of ye’elimite, also called Klein’s salt (C4A3Ŝ), ranging up to 70 wt%, calcium sulfate (anhydrite) (CŜ) 0–25 wt% and belite (C2S) up to 25 wt% [40]. Calcium monosulfate aluminate (AFm) (C4ASH12) and gibbsite (AH3) are the main hydration phases in the reaction of ye’elimite with water. Yet, the presence of anhydrite causes the production of ettringite (AFt) (C63H32) and gibbsite, resulting in high early strength, rapid drying, and non-expansive large ettringite crystals [32,41,42], while the presence of lime attributes expansive, self-stressing and shrinkage resistance binders [43]. Moreover, the later age strength is often pronounced on optimized anhydrite usage because of slower dissolution kinetics instead of gypsum’s faster dissolution [44,45]. Nevertheless, despite the positive impact of the CSAs, it is limited to partial replacements as the main binder from the cost perspective and limited manufactures.
Extensive research on OPC partially replaced by CSA has been studied, resulting in pronounced setting time and strength development as a fast synthesis of AFt and amorphous hydrates [43,46]. The formed hexagonal-shaped thin ettringite plates filled the pore system, consumed excess pore moisture, prevented the large-size ice crystals, minimized the risk of frost damage, and further densified the binder matrix [11,47]. Furthermore, instead of C-S-H and portlandite, the presence of gibbsite in OPC-CSA systems promoted the synthesis of strätlingite (C2ASH8) and portlandite via its interaction with alite (C3S) [48,49]. On the contrary, the belite-rich CSA as the sole binder promoted only the strätlingite (C2ASH8), characterized as slow strength development on reaction with belite (C2S) and gibbsite (AH3) [50]. The optimized dosage of CSAs and pre and/or no-standard curing for cold weather pronounced the strength of concrete by 300% placed at −5 °C [11]. Conversely, a 65% reduction in strength was reported for CSA-based specimens cured at −5° for a period of 28 days in comparison to the standard cured concrete, despite the faster hydration and strength development of the CSA [51]. The maximum replacement amount has been up to 20 wt% [11]. The presence of CSA in the OPC system does not change the hydration process of C3S but rather modulates aluminate dissolution [52,53]. When compared with a pure OPC system, blended OPC-CSA hydrates faster with a 2.5× larger first heat-peak flow [11,47,54]. The primary factors were faster wetting, dissolution, and partial hydration. Additionally, sulfates and free lime concentrations were found to be higher in OPC-CSA systems, which resulted in a higher heat release [52]. Gypsum (CŜH2) from OPC accelerated the dissolution of anhydrite (CŜ) and enhanced the hydration kinetics of ye’elimite [39]. Ettringite crystals were the only reaction products generated on the hydration of ye’elimite in the presence of calcium hydroxide, calcium sulfate, and water. After the complete consumption of calcium sulfates and depletion of calcium hydroxide, the main reactions include the formation of calcium monosulfate aluminate (AFm) (C4ASH12) and gibbsite (AH3) as the principal hydration phases on interaction of ye’elimite with water [55].
The tertiary OPC:GGBFS:CSA concrete is yet another approach to minimize the environmental impact. The main hydration phases were the ettringite, monosulfate, gibbsite, and strätlingite found to be comparable to pure CSA-based concrete [36,43,56]. The CSA-based systems showed a lower risk of alkali-silica reaction (ASR) and increased resistance to sulfate attack [43,57]. However, numerous studies found that the dilution effect and limited reactivity of GGBFS in binary GGBFS-CSA mixtures resulted in an overall decline in mechanical properties and durability [36,58,59]. Furthermore, its behavior is unknown when exposed to sub-zero curing conditions. The present study compares the phase transition of the OPC-GGBFS concrete system blended with belite-CSA mineral accelerator cured at −15 °C to that of a similar concrete system blended with chemical antifreeze admixtures. The primary aim was to assess the ice formation and its influence on the microstructure of the binder matrix. Low-temperature differential scanning calorimetry (LT-DSC), ultrasonic pulse velocity (UPV), Scanning Electron Microscopy (SEM), and additional testing on the physical and mechanical properties were performed.

2. Materials and Methods

Rapid hardening Portland cement type CEM I 52.5R identified as Snabbhårdnande cement (SH) from Cementa (Malmoe, Sweden), Merox AB-Sweden (Oxelösund, Sweden) ground granulated blast furnace slag (GGBFS), and commercially available belite-based CSA cement identified as Calumex BeliCem (CSA) from Caltra Nederland B.V. (Mijdrecht, The Netherlands) were used. The used CSA cement contained about 25 wt% of belite (C2S), Ye’elimite (C4A3Ŝ) content over 60 wt% and calcium sulfate (CŜ) at 10 wt%. Table 1 and Table 2 show the physical properties and chemical compositions of the used binders and fillers. Jehander Heidelberg Cement Group supplied natural granite aggregates with sizes of 0–4 mm and 4–8 mm. A fine quartz filler Norquartz-45 from Sibelco Nordic (Lillesand, Norway) and fine sand with a maximum particle size of 150 µm were provided by Baskarpsand AB (Habo, Sweden). BASF (Rosersberg, Germany) polycarboxylate ether-based superplasticizer “MasterGlenium ACE 30” (SP) was used, and the water to binder (w/b) ratio was 0.42 for all concrete mixes and 0.31 for pastes.
The replacement of OPC and/or GGBFS by CSA cement was limited to 20 wt%. Sodium nitrate-based antifreeze admixture “MasterSet AC 220” (AF), accelerator “Master X-Seed 130” (ACC), and air entraining “MasterAir 105” (AE) admixtures from BASF (Rosersberg, Germany) were used [26]. SP, AE, AF, and ACC dosages were held constant at 0.75 wt%, 0.1 wt%, 25 wt%, and 10 wt% of the binder weight, respectively [26]. The amount of water in the chemical admixtures was deducted from the added water.
Table 3 and Table 4 show the paste and concrete compositions that were studied. Seven paste mixes and seven concrete mixes were produced. Based on the early age performances of the mixes (fresh and hardened properties), two concrete mixes were subsequently cast and cured at a constant temperature of −15 °C, as indicated in Table 4 (shaded in grey).
Initial and final setting times were determined on the paste samples (Table 3) in accordance with the ASTM C191-19 [60]. The heat development due to the hydration reaction (Table 3) was examined using an in-house semi-adiabatic calorimeter. The calorimeter was made of Styrofoam, having a wall thickness of 60 mm, as shown in Figure 1. The PicoLog6 TC-08 instrument with a K-type thermocouple was adopted to record data for 7 days. Temperature was measured by placing the thermocouple into a freshly prepared paste sample with dimensions of 60 mm × 60 mm × 60 mm. The phase transition was studied using a low-temperature differential scanning calorimetry (LT-DSC) type Q100 TA instrument, see Figure 2. Immediately after mixing, paste samples weighing 10 to 12 mg were loaded and sealed in an aluminum crucible, which was placed in the DSC chamber along with an empty reference crucible. For both the freezing and thawing stages, the temperature change rate was 1 °C/min. Applied temperatures ranged from +10 °C to −30 °C. The behaviors of pastes in response to temperature changes were examined using either endothermic or exothermic heat flow. The freezing, melting, and glass transition points have all been determined [26].
Concretes were produced using a pan mixer type Zyklos, with 2 min of dry mixing followed by the addition of water blended with superplasticizer and another 2 min of mixing. Workability and compressive strength development were determined using the standards SS-EN 12350-2:2019 and SS-EN 12390-3:2019, respectively [61,62]. The test concrete cubes had dimensions of 100 mm × 100 mm × 100 mm. For the preliminary studies, freshly casted cubes covered with plastic foil were placed and cured at an ambient room temperature of approximately 20 °C, while for the main studies, the cubes were placed immediately after casting into the refrigerator and exposed to a constant temperature of −15 °C. The compressive strengths were measured at 1, 3, 7, 14, and 28 days. The loading rate was set to 10 kN/s. Furthermore, to study the impact of the formed pore ice—for each curing period, concrete samples were taken out of the refrigerator at 0 h before testing (instant), 12 h before testing (12 h/bf), 24 h before testing (24 h/bf), and held at room temperature during waiting period [26].
The standard SS-EN 12504-4:2004 following the ultrasonic pulse velocity (UPV) was used to detect the ice formation in the concrete cubes cured at a constant −15 °C [63]. Pundit Lab ultrasonic instrument (Proceq, Zurich, Switzerland) with exponential transducers at 54 kHz was used. The measuring path length was 100 mm. The tests were performed on the 1-day and 28-day-old concrete samples. The test measurements were registered at different time intervals, i.e., immediately after being taken out of the refrigerator (instant), 6 h after (6 h/af), 12 h after (12 h/af), 18 h after (18 h/af) and 24 h after (24 h/af). The concrete samples were stored at room temperature prior to testing.
To examine the microstructure, a scanning electron microscope (SEM)—JSM-IT100 (JEOL Ltd., Tokyo, Japan) was used. The tests were carried out on the 3-day and 28-day-old concrete samples. Cubes were removed from the refrigerator and held at room temperature for 0 h (instant), 12 h (12 h/bf), and 24 h (24 h/bf) before being prepared for the SEM examination. For analysis, concrete samples were extracted and placed in isopropanol for 24 h and another 24 h of drying in a low-vacuum chamber. Samples were impregnated under vacuum with a low-viscosity epoxy resin. After hardening, all samples were polished using grinding plates and three sets of diamond spray with a maximum particle size of 9 μm, 3 μm, and 1 μm. The lamp oil was used as a lubricating and cooling agent [64]. SEM images were obtained using the backscattered electron (BSE) mode detector at 500× magnifications. The images were segmented to separate the porosities based on greyscale histograms [65,66].

3. Test Results and Discussion

3.1. Setting Time

Initial and final setting times are shown in Figure 3. Generally, mixes based on CSA cement showed shorter setting times than those based on OPC cement. Similarly, the mixes blended with CSA cement set faster than the reference OPC. The reference OPC mix had the initial and final setting times of 80 min and 530 min, respectively, see Figure 3. The binary and tertiary mix OPC:GGBFS:CSA—80:0:20 and OPC:GGBFS:CSA—40:40:20 had initial setting times of 9 and 7 min, respectively. This can be related to the fast hydration rate of CSA and the corresponding enhanced ettringite formation and early-age moisture loss [54]. Additionally, gypsum and calcium hydroxide from OPC could accelerate the hydration rate of CSA, as seen by others [41,53]. The initial setting time of the studied CSA cement was 31 min, which could be related to the slow reaction of β-C2S belite at early ages forming strätlingite. The final setting time of 605 min was in line with the highly reactive α-C2S as seen by others at later reaction periods [67,68,69,70].
The partial replacement of GGBFS by 20 wt% CSA showed the initial setting time of 70 min. Despite the slow reaction of GGBFS, the CSA stimulated the hydration reaction. Similar amounts of ettringite, monosulfate, and Al(OH)3 were formed but with a slightly more strätlingite [36]. On the contrary, the final setting time was delayed to 1227 min for a mix containing 80 wt% of GGBFS and 20 wt% of CSA. It was related to the reactivity of slag and a limited amount of formed AFt phases [36,59]. The OPC-GGBFS concrete with no chemical admixtures showed delayed initial and final setting times compared with similar mixes with chemical admixtures. This could be inferred from the reduced hydration heat release of GGBFS, correspondingly decelerated the hydration heat evolution intensity and delayed initial setting. However, the co-existence of calcium hydroxide from OPC hydration considerably reacted with slag to produce more C-S-H at later ages. Additionally, chemical admixtures incorporated a mix containing C-S-H seeds, boosted the hydration rate at early ages, and shortened the induction period and more C-S-H nuclei sites [71,72].

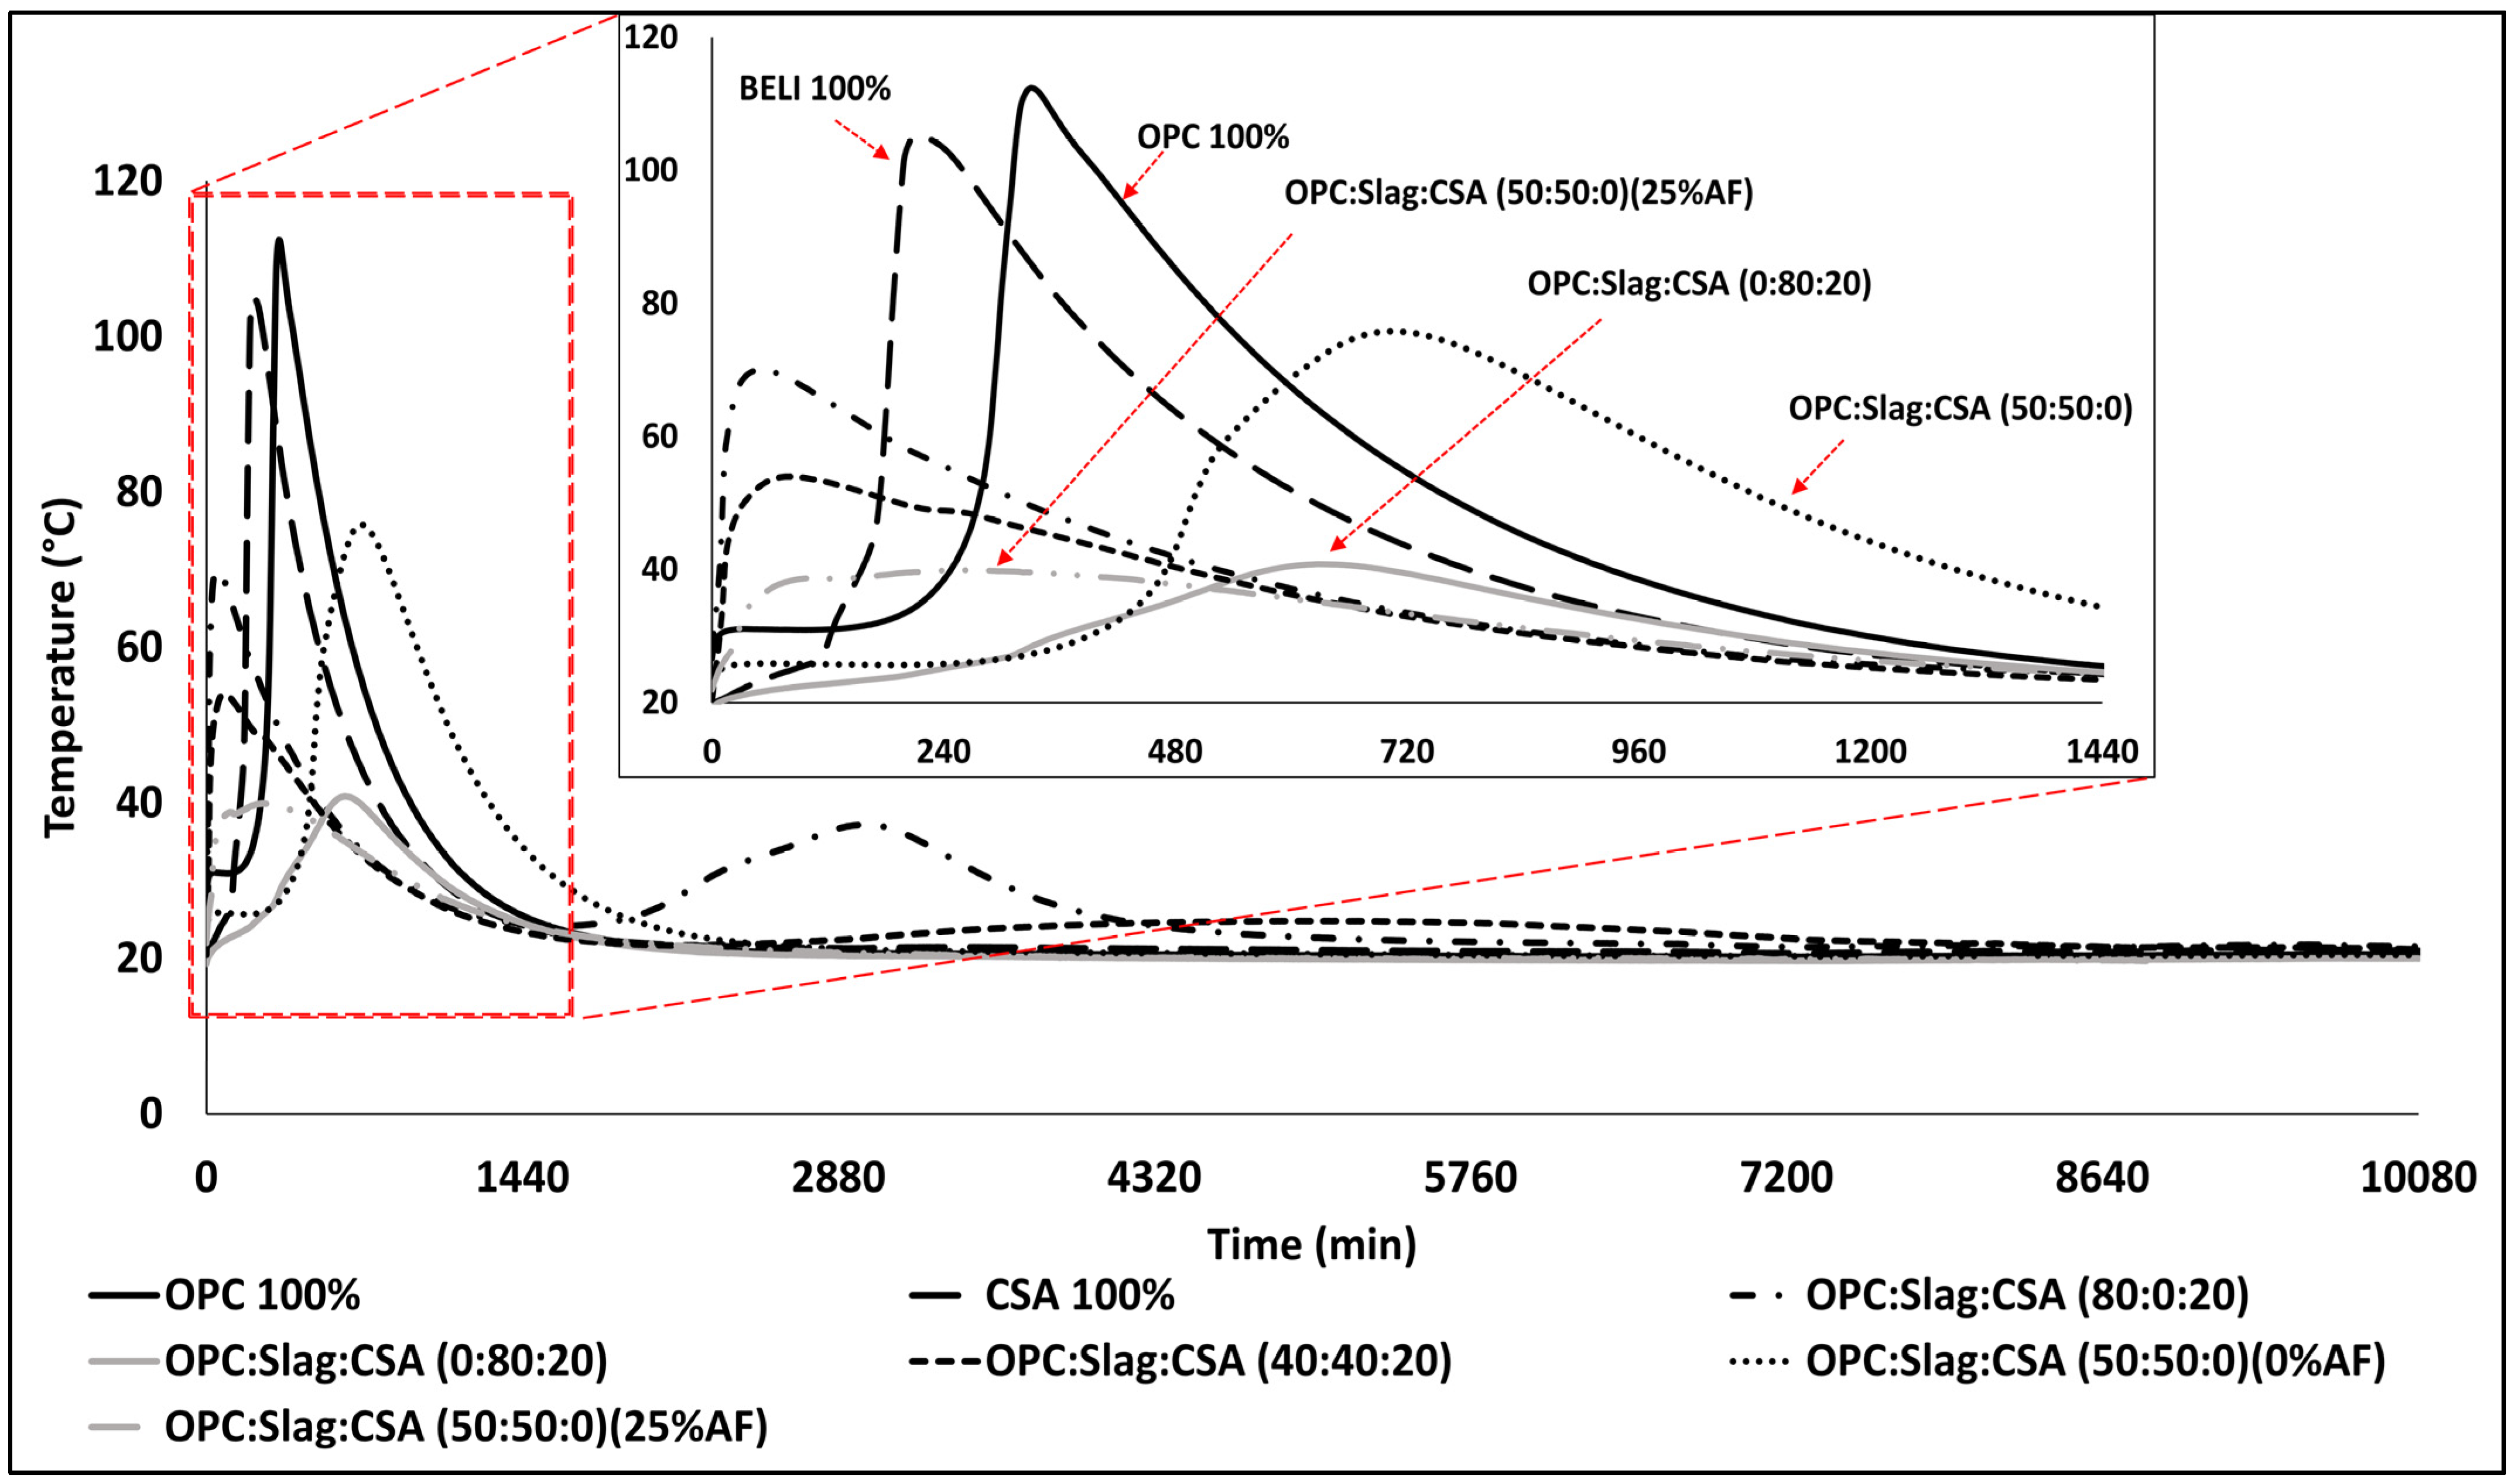
3.2. Hydration Heat Development

Figure 4 shows the hydration heat development of pastes in the first 7 days. All the mixes showed exothermic heat releases immediately after mixing with water and a shoulder formation before the main peak. Mixes containing CSA cement had shorter induction periods, see Figure 4 which equaled 140 min, 9 min, 8 min, and 25 min, respectively, for the pastes CSA (100%), OPC:GGBFS:CSA (80:0:20), OPC:GGBFS:CSA (40:40:20), and OPC:GGBFS:CSA (50:50:0) (25%AF). These trends corresponded to the measured setting times shown in Figure 3. This could be related to the faster dissolution and partial hydration of gypsum and ye’elimite forming ettringite and amorphous AH3 [52,73]. The sulfates and calcium hydroxide originating from OPC are yet other factors enhancing the hydration of the OPC-CSA system [52]. As a result of the binding of gypsum sulfates to C3A, a shallow peak equivalent to AFm was also found in the OPC-CSA mix pastes at a later age [74]. The longer induction period for the mix containing 100 wt% of the CSA could be related to the cement’s chemical composition, especially the composition including 25 wt% of belite. This phase is known for its slow hydration, which presumably delayed the early-age reactions. The following ultimate peak temperature corresponded to the formation of more ettringite and strätlingite [70].
As shown in Figure 4, the paste OPC:GGBFS:CSA (0:80:20) had a very low ultimate hydration peak despite the presence of the CSA cement. This could be related to the ye’elimite being replaced by slag [36]. Earlier research showed that decreased amounts of AFt, AFm, and AH3 phases in systems containing higher amounts of GGBFS (>30 wt%) were linked to the dilution effect and low reactivity [36,58,59]. The paste OPC:GGBFS:CSA—50:50:0 mixes with no chemical admixtures showed a delayed hydration peak compared with other tested paste samples. A similar mix containing 25 wt% AF [OPC:GGBFS:CSA—50:50:0] showed a main but shallow peak much earlier after 60–65 min. The delay corresponded to the slow reactivity of slag.

3.3. Fresh and Hardened Concrete Properties (Early Age)

Mixes containing OPC:GGBFS (50:50 wt%) and 25 wt% of the AF showed a maximum slump of 20 cm, while the reference OPC concrete showed a minimum of 3 cm, see Figure 5 and Figure 6. The workability was affected by the binder’s fineness and incorporated chemical admixtures [49]. Fine binder, in conjunction with chemical admixtures, adheres more to the binder particles to pronounce the admixture effect and consequently shows higher workability. The formation of ettringite crystals at an early age could reduce it. The OPC:GGBFS:CSA (40:40:20) mix showed a higher slump of 13 cm compared with the mix containing OPC:CSA (80:20), which reached only 5 cm. Despite similar CSA dosages, the presence of slag was favorable due to its coarser particles and lower reactivity, while the mutual hydration reaction of OPC:CSA, the calcium sulfate, and calcium hydroxide originating from OPC accelerated the hydration of CSA at a very early age, resulting in the formation of ettringite crystals which caused a moisture loss [52,57].
Pure OPC (100%), CSA (100%), and binary mix with OPC:CSA (80:20) concretes achieved a maximum 1-day compressive strength of 42 MPa, see Figure 6. The used belite-CSA cement contained 25 wt% of belite (C2S), Ye’elimite (C4A3Ŝ) content over 60 wt%, and calcium sulfate (CŜ) at 10 wt%. Consequently, the strength gain could be attributed to the formation of more C-S-H/C2ASH8 and Portlandite but a limited formation of AFt phases [40,49]. Furthermore, relative to the CSA (100%) concrete, the binary blend OPC:CSA (80:20) showed lower strength at all ages except at 1 day. The differences in the strengths were 12.84% at 3 days and 10% at 7 days. The high early age strength was related to the rapid dissolution and accelerated hydration rate due to the co-existence of two types of cement and, consequently, the rapid formation of ettringite crystals [54]. However, these overlapping ettringite deposits on the C-S-H particles over time caused an adverse effect on the microstructure by the occurrence of microcracks [49,54].
The binary mix GGBFS:CSA (80:20) achieved the lowest compressive strengths between 6–7 MPa at all ages, which complies with earlier results [36,75,76]. Some connected the trend to the degradation of physiochemical properties of the CSA cement due to the presence of GGBFS [77]. Furthermore, the decreased strength development was also linked with the high GGBFS contents over 30 wt%, which could limit the formation of ettringite, strätlingite phase, and also an increased porosity [29,59,78]. Other researchers have shown that mixes containing less than 30 wt% of GGBFS could reach comparable strengths as pure CSA-based concrete [36]. Ettringite, monosulfate, strätlingite, and AH3 were observed as the principal hydration products when the amount of slag added to CSA based binder system was optimal, consequently inhibiting the porosity growth and promoting densification of the concrete microstructure [36].
Similar strength values were measured at all ages for the concretes based on OPC:GGBFS (50:50) with 25 wt% AF and OPC:GGBFS:CSA (40:40:20). In both cases, the used AF admixture and CSA cement were the key elements for synergistic hydration reaction and increased strength. GGBFS, as a partial replacement of OPC, underwent a pozzolanic reaction with Ca(OH)2 to produce more C-S-H gel corresponding to the later age strength. Additionally, the synthetic C-S-H seeds contained in the added chemical admixtures accelerated the hydration and early age strength. On the other hand, the presence of the CSA cement supported the formation of ettringite crystals and other phases (C-S-H/strätlingite, monosulfate, and AH3) during the hydration reaction of ye’elimite, alite, and belite. This considerably amplified the early age strength. Other researchers observed that increasing dosages of CSA in combination with OPC and GGBFS enhanced the strength and durability properties [76]. Additionally, the usage of GGBFS promoted the cohesiveness of the matrix and densified the microstructure [43].

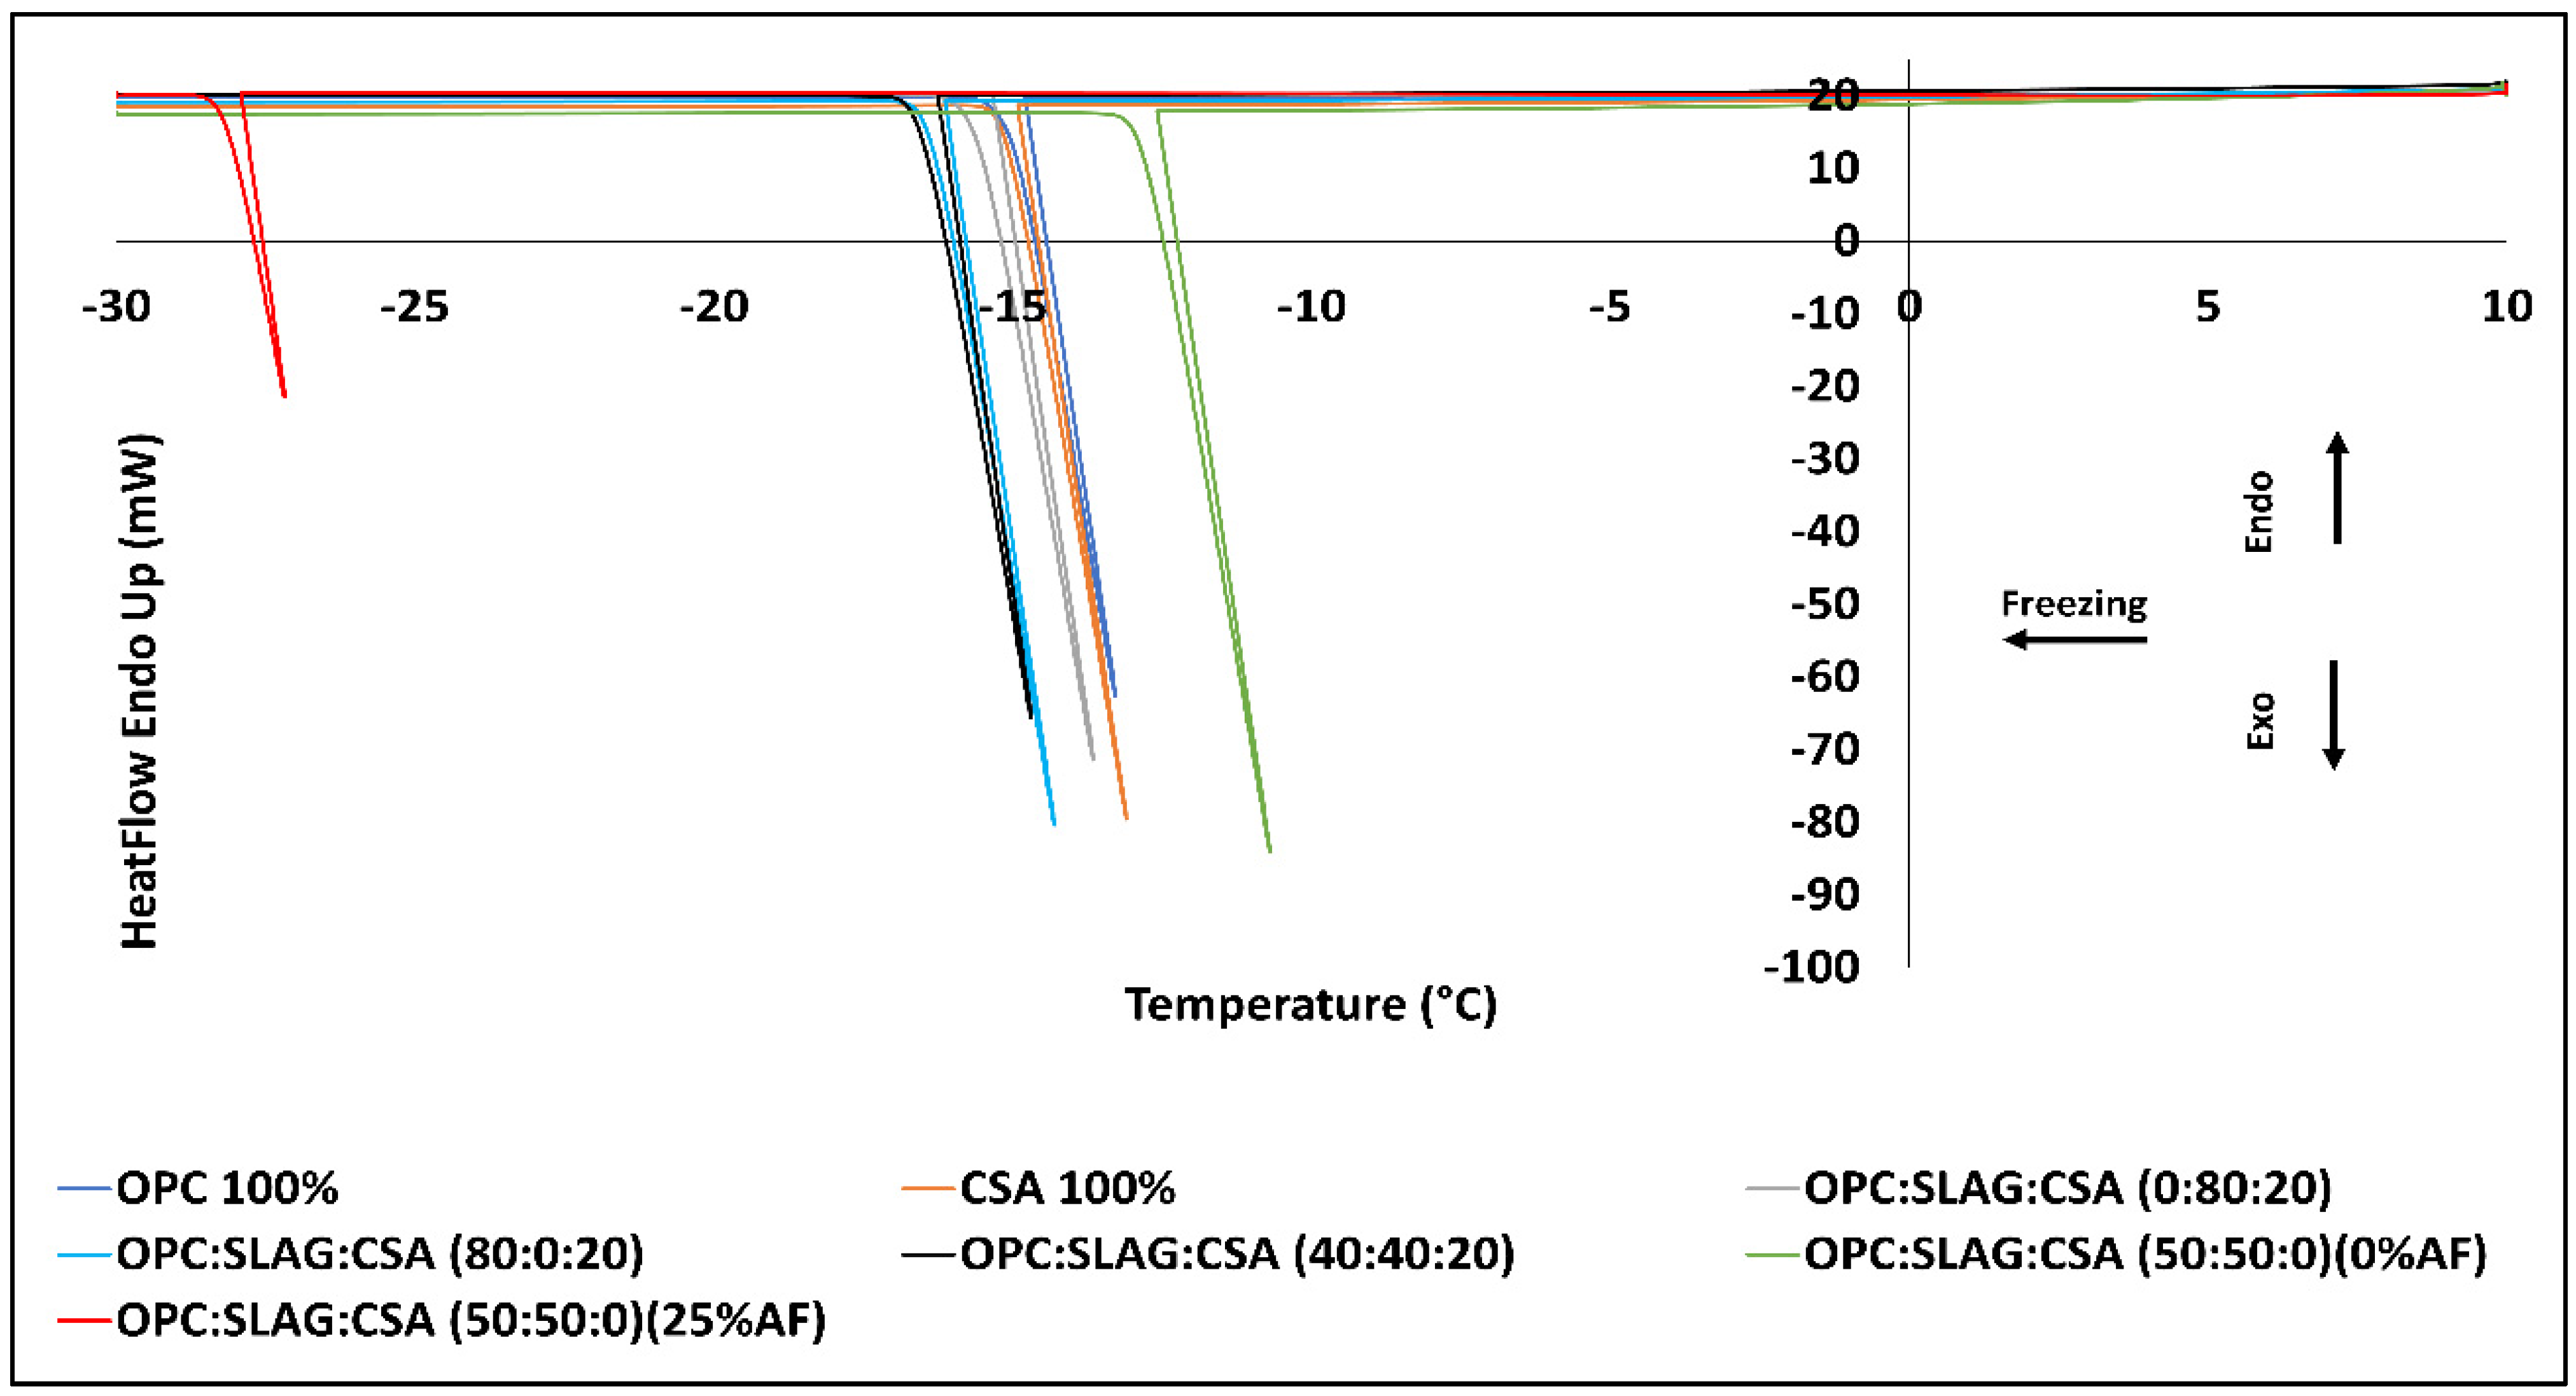
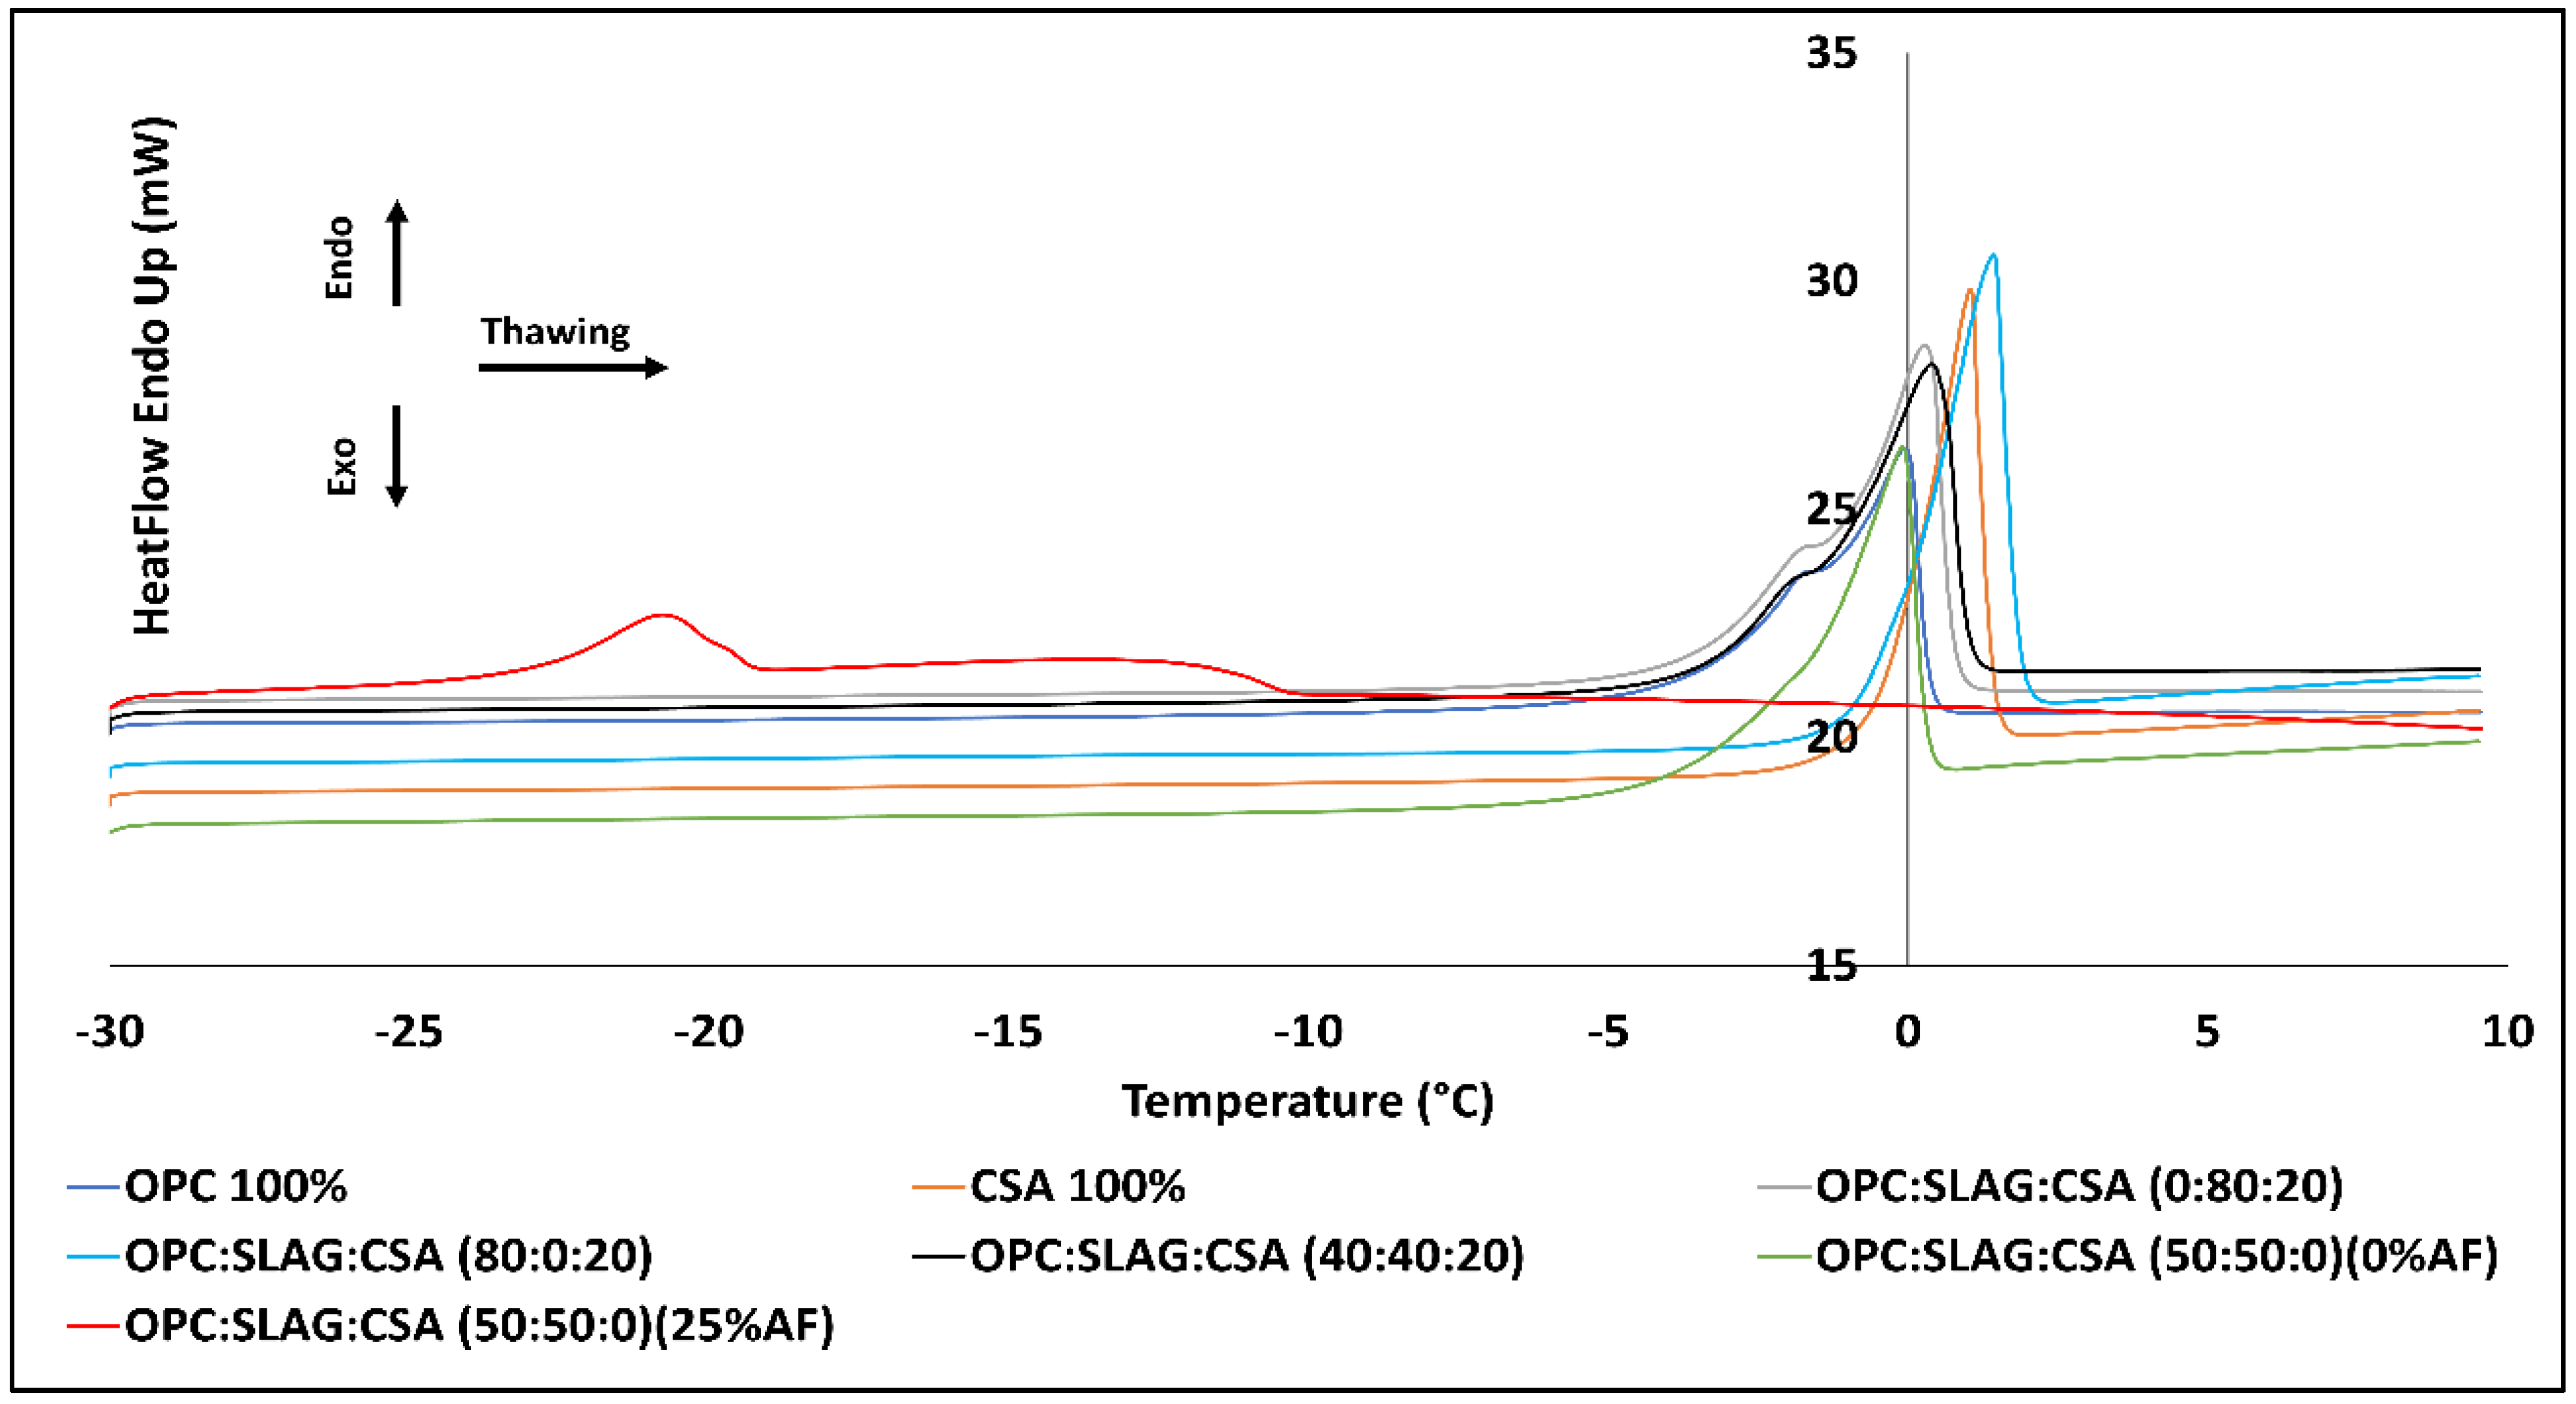
3.4. Differential Scanning Calorimetry (DSC)

The phase transitioning was determined using differential scanning calorimetry (DSC). Two events were observed, i.e., exothermic peak during freezing and endothermic peak during thawing, Figure 7 and Figure 8, respectively. In general, based on the eutectic point of the used chemicals and/or mineral accelerators, the freezing point of an aqueous solution can be determined [24,26]. However, due to the fusion of interacting components and chemicals, estimating the eutectic temperature for concrete is complicated.
For both freezing and thawing procedures, a single dominant peak was observed [13]. The OPC:GGBFS (50:50) mix with no chemical admixture showed the earliest freezing point of all mixes at around −12 °C. While the similar mix but with 25 wt% of AF admixture, the freezing point was lowered to around −29 °C. Reference mixes, OPC (100%) and CSA (100%) showed the freezing point at −14 °C. While the mixes with the presence of 20 wt% of CSA cement further decreased this point to around −16 °C. The depressed freezing temperature, in all cases, could be associated with the dissolved ionic concentration in the pore solution. The latter “concentration effect” results in a decreased pore size and enhanced network structure, according to Raoult’s law and Clausius–Clapeyron relation [11]. Pore solution present in larger pores freezes faster, whereas in smaller pores, the vapor pressure is increased, which depresses the freezing point [9,10]. The presence of CSA cement resulted in the formation of a higher amount of ettringite crystals in the first few minutes. Consequently, more water was absorbed, leading to an increase in the ionic concentration, followed by a decrease in the pore size, due to the formation of ettringite, and limited the ice formation [11,79]. Several studies showed an adverse effect for lower replacements of OPC with CSA cement, ≤10 wt%, on the hydration process and exposure to freezing temperature [11].
Similarly, upon thawing endothermic peak related to the energy absorption in pores where ice has melted can be seen in Figure 8. The OPC:GGBFS (50:50) paste without admixtures showed a well-defined peak at around 0 °C [30,80]. While all pastes containing CSA cement showed a dominant endothermic peak immediately after 0 °C and a shoulder before it. The OPC:GGBFS (50:50) mix containing 25 wt% of AF showed two peaks forming at different temperatures. This could be related to the geometry of the pore system and the concentration of the dissolved ions [7,13]. The early peak generated during melting could be related to the melting of ice located in finer pores, while the later peak to the ice formed in larger pores [13,81,82]. Melting of ice is a continuous process, but at extreme freezing temperatures, it is limited [5,83].

3.5. Compressive Strength Development—Concrete Cured at −15 °C

Further study focused only on two mixes, i.e., mix OPC:GGBFS:CSA—(40:40:20) and OPC:GGBFS:CSA—(50:50:0) (25%AF). The choice was based on various factors, including fresh and hardened properties, carbon footprint, and cost-effectiveness.
Figure 9, Figure 10 and Figure 11 show the strength development of concrete cubes cured at constant −15 °C, measured at different intervals. In general, for all variants, the concrete mix OPC:GGBFS:CSA—(50:50:0) containing 25 wt% of AF had higher strength values in comparison with the concrete containing 20 wt% of CSA and no AF. The maximum ultimate 28 days compressive strength of 35 MPa was achieved for samples containing AF and exposed to 20 °C for 24 h before testing (24 h/bf), see Figure 11. Irrespective of the age and test intervals, the concrete samples with AF showed a continued strength increase for the entire measured 28-day period. This could be related to the use of high concentric AF admixture, which limited the pore ice formation and correspondingly supported the hydration process. The difference in the measured strength values between samples that were tested immediately after their removal from the freezer and samples that were held for 12 h at 20 °C tended to decrease with age in the case of concretes containing 25% AF, see Figure 9 and Figure 10. This may be related to advancing hydration and, consequently weaker effect of the false strength due to the ice formation. The observed strength results for both mixes followed the trends observed in the differential scanning calorimetry test.
In general, the exposure to higher temperatures caused the pore ice to melt and consequently accelerated the hydration process, leading to higher strength values. On the contrary, no strength increase was observed for samples containing 20 wt% of the CSA cement. The measured values were between 10 MPa to 15 MPa, irrespective of age, Figure 9, Figure 10 and Figure 11. The observed strength could be partially related to the initial hydration of CSA cement and larger amounts of formed ice [11]. Furthermore, concrete samples with 20 wt% of the CSA cement, subjected to 20 °C for 24 h prior to testing, showed a significant decline in compressive strength development with age, see Figure 11. This trend could be related to the formation of ettringite crystals that eventually resulted in more porous and microcracked microstructure, as seen by others [54]. Additionally, at a constant freezing temperature, the concentration and strength of the ice lenses have been observed to increase exponentially [84]. Consequently, the internal pressure created by the developed pore ice could result in microcracking of the already-formed binder matrix [85,86,87]. Alzaza et al. reported that concretes with 40 wt% of OPC with CSA cement where no pre-curing was applied showed a limited strength development for concrete cured at −5 °C [79]. Similar investigations demonstrated that pre-curing for at least 6 h at room temperature could mitigate the harmful effects of the negative temperature [11,54].
In comparison, the early age strength of concrete tested immediately after their removal from the freezer (1-day instant) and containing 20 wt% of the CSA cement was over 10 MPa versus 0 MPa for the concrete OPC:GGBFS concrete with 25 wt% of the AF. This clearly indicates that a portion of the strength was derived from formed ice as well as ettringite formation [11]. The presence of formed ice was later confirmed by the UPV measurements shown in Figure 12 and Figure 13.

3.6. Ultrasonic Pulse Velocity (UPV)

To identify and validate the ice formation within the binder matrix, UPV measurements were performed on the 1-day and 28-day-old concrete samples kept at ambient temperature for varying periods after being taken out from the freezer, as shown in Figure 12 and Figure 13. In the present study, a denser concrete microstructure and a higher pulse velocity (m/s) were related to either pore ice + binder matrix or binder matrix alone. In contrast, lower observed velocity (m/s) may indicate a less compact microstructure due to either the presence of empty pores and/or due to the presence of microcracks. Other researchers have measured the pulse velocities of 3828 m/s in solid ice and 1485 m/s in water [30,88]. Immediately after being removed from the freezer, the concrete samples containing 20 wt% of the CSA cement showed UPV values of 4768 m/s and 4510 m/s for the ages of 1 day and 28 days, respectively. These values decreased significantly over time on exposure to 20 °C, see Figure 12 and Figure 13. These trends are related to the melting of formed ice [88]. Moreover, during longer freezing periods, ice nucleation can cause irreversible damage to the binder matrix [19,89]. Despite thawing for 12 h or longer, the concrete containing 20 wt% of the CSA cement showed the lowest increase in the UPV, a relatively negligible percentage growth compared with the concrete containing 25 wt% AF. After a thawing period of 24 h, the 1-day and 28-day-old samples incorporating 20 wt% of the CSA cement had an UPV of 4000 m/s. This could indicate that the water released from the melted ice promoted hydration of Portland cement, which products partially fill the pores. These results, in combination with the measured compressive strength values, further confirm that the incorporation of 20 wt% of the CSA cement did not prevent the formation of ice in pores.
The UPVs for the 1-day and 28-day-old concrete samples containing 25 wt% of the AF were considerably lower at 3367 m/s and 4464 m/s when measured immediately after being taken out of the freezer, see Figure 12 and Figure 13. Exposure to ambient conditions increased the UPV, unlike observed for the concrete samples containing 20 wt% of the CSA cement. This could be directly related to the depression of the freezing point of water and, thus, to the limited ice growth [71,90]. The application of a thawing period of 24 h resulted in the maximum UPVs of 4587 m/s and 4695 m/s for the 1-day and 28-day-old concrete samples, respectively. The thawing accelerated the hydration process, which resulted in the formation of a dense binder matrix.

3.7. Scanning Electron Microscope (SEM)

Figure 14 and Figure 15 show the SEM images of the concrete samples OPC:GGBFS:CSA—40:40:20 and OPC:GGBFS:CSA—50:50:0 (25 wt.% of AF), which were cured at −15 °C for 3 and 28 days, respectively. The samples containing 20 wt% of the CSA cement contained more unhydrated particles regardless of the thawing periods, see Figure 14a–c and Figure 15a–c. Due to the rapid dissolution of the CSA cement, the areas filled with ettringite were often surrounded by empty voids in all studied samples. In Figure 14 and Figure 15, red color boxes indicate the areas with detected ettringite crystals, and yellow boxes indicate the unhydrated CSA cement. As described earlier, this could be linked to the significant amount of water consumed by forming ettringite, leading to moisture loss at the early stages of hydration [54]. The low reactivity of GGBFS could cause a disruption in the CSA cement physicochemical properties, leading to higher porosity and reducing strength, see Figure 16, Figure 17 and Figure 18 [59]. Earlier results concluded similar trends. SEM images of concrete samples containing 25% of the AF showed significant recovery in the binder matrix on exposure to room temperature are shown in Figure 14d–f and Figure 15d–f. Ettringite was observed in the 3-day-old concrete samples, but it disappeared later. In comparison, the 25% AF incorporated samples showed a pronounced hydration rate, followed by dense microstructure and compact morphology.
The porosity of the studied concretes was separated from SEM images using greyscale histograms and ImageJ win-64 software, see Figure 16 and Figure 17. High porosity was found in the samples containing 20 wt% of the CSA cement and significantly lower porosity in the 25% AF using concrete. For 3-day and 28-day-old concrete samples containing 20 wt% of the CSA cement, the porosity varied from 9% to 11% and from 6% to 9%, respectively, while the porosity for the 25 wt% AF concrete ranged from 3% to 4% regardless of the used curing methods, see Figure 18a,b. The high porosity of the 20 wt% CSA concrete could be related to the formation of ettringite, as described earlier [54]. Over time, the porosities of these concretes dropped slightly, which could be related to the continuous hydration of all present binders, including CSA, OPC, and GGBFS. However, it could be assumed that the formation of C-S-H from OPC was limited to some extent due to the presence of CSA cement and higher content of Al ions in the pore solutions [91]. Replacement of binder by 20 wt% of CSA cement in the samples impacted the nucleation of ice in pores, see Figure 7. Other researchers showed that an excessive amount of CSA (≥20 wt%) and extreme curing (>−5 °C) decelerated the hydration rate and strength development if no pre-curing was adopted [79]. On the contrary, lower porosity in the 25% AF was a result of well-controlled hydration of OPC and pozzolanic activity of GGBFS, which was not hindered by low temperatures due to the application of AF admixture. The SEM observations and the earlier test results from the present study are in line and confirm that pore ice formation in the samples containing 20 wt% CSA and partially inhibited with the samples using 25 wt% AF chemical admixture.

4. Conclusions

This study aimed to determine if belite-CSA cement could be used as a partial replacement of OPC and/or GGBFS in concretes cast at subfreezing temperatures. The following conclusions can be drawn.
  • The partial replacement of either OPC or GGBFS with 20 wt% of the belite-CSA cement shortened the initial setting time. This was attributed to the faster hydration of the CSA cement and the related ettringite formation.
  • OPC:GGBFS mixes containing either 20 wt% CSA or 25 wt% AF showed similar strength developments when cured at 20 °C.
  • An optimum dosage of sodium nitrate-based antifreeze (AF) considerably reduced the freezable water and promoted hydration.
  • CSA cement appeared to induce some microcracks within the binder matrix, presumably due to the ettringite formation, which supported the formation of ice and the development of false strength.
  • Pre-curing concrete mixes containing 20 wt% CSA for at least 6 h at room temperature before their exposure to −15 °C could mitigate some of the negative effects.
  • OPC-GGBFS concrete containing 25 wt% of the AF admixture cured at −15 °C showed densification of the binder matrix after the application of extended post-curing at room temperature. On the contrary, no densification was observed for the concrete with 20 wt% of the CSA cement.
  • Hydration tended to resume with the formation of C-S-H and ettringite crystals for mixes containing 25 wt% AF when the extended post-curing at room temperature was applied.
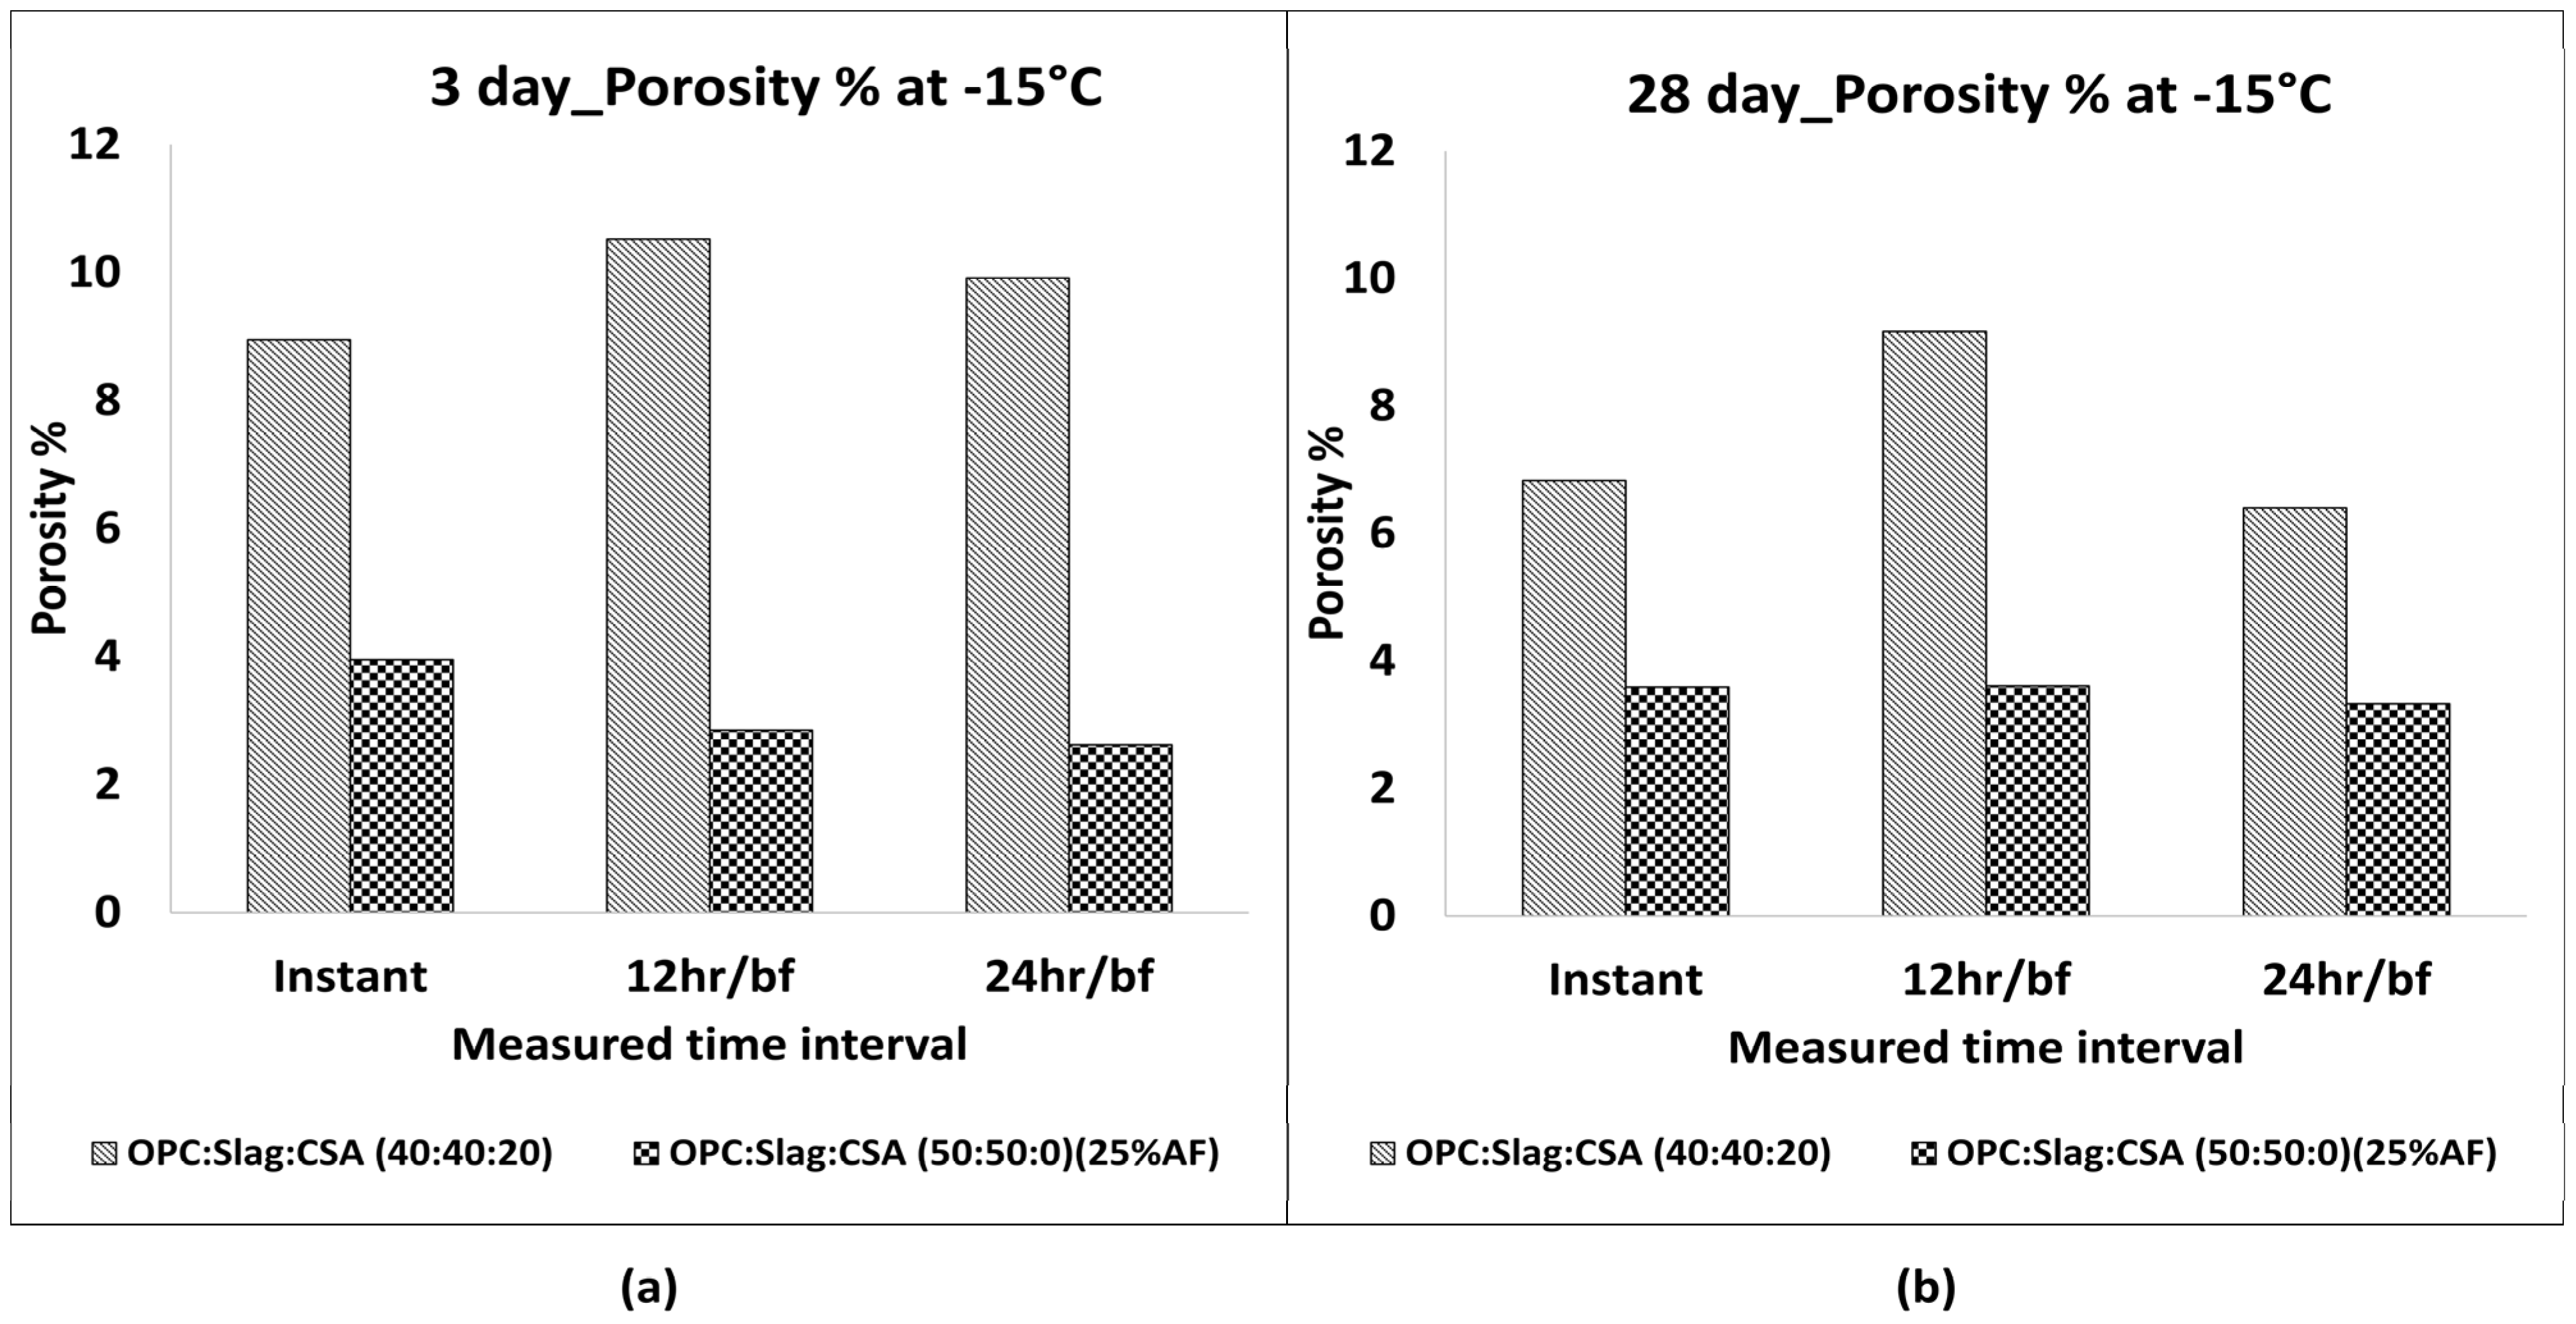
  • Prolonged curing at −15 °C increased the porosity of concrete containing 20 wt% of CSA cement, which resulted in a lower strength gain due to the increased formation of ice.

Author Contributions

Conceptualization, A.C. and A.K.; formal analysis, A.K.; investigation, A.K. and T.B.; data curation, A.K.; writing—original draft preparation, A.K.; writing—review and editing, A.C.; visualization, A.K. and T.B.; supervision, A.C.; funding acquisition, A.C. All authors have read and agreed to the published version of the manuscript.

Funding

This research was funded by the Development Fund of the Swedish Construction Industry—SBUF and BeFo—Rock Engineering Research Foundation.

Data Availability Statement

Available upon request.

Conflicts of Interest

The authors declare no conflict of interest and have no known competing financial interests or personal relationships that could have appeared to influence the work reported in this paper.

References

  1. Korhonen, C.J. Antifreeze Admixtures for Cold Regions Concreting: A Literature Review; U.S. Army Corps of Engineers, Cold Regions Research and Engineering Laboratory: Hanover, NH, USA, 1990. [Google Scholar]
  2. Polat, R. The effect of antifreeze additives on fresh concrete subjected to freezing and thawing cycles. Cold Reg. Sci. Technol. 2016, 127, 10–17. [Google Scholar] [CrossRef]
  3. Liu, J.; Li, Y.; Yang, Y.; Cui, Y. Effect of low temperature on hydration performance of the complex binder of silica fume-portland cement. J. Wuhan Univ. Technol. Mater. Sci. Ed. 2014, 29, 75–81. [Google Scholar] [CrossRef]
  4. Karagöl, F.; Demirboga, R.; Khushefati, W.H. Behavior of fresh and hardened concretes with antifreeze admixtures in deep-freeze low temperatures and exterior winter conditions. Constr. Build. Mater. 2015, 76, 388–395. [Google Scholar] [CrossRef]
  5. Wu, M.; Johannesson, B.; Geiker, M. Determination of ice content in hardened concrete by low-temperature calorimetry: Influence of baseline calculation and heat of fusion of confined water. J. Therm. Anal. Calorim. 2014, 115, 1335–1351. [Google Scholar] [CrossRef]
  6. Diamond, S. Aspects of concrete porosity revisited. Cem. Concr. Res. 1999, 29, 1181–1188. [Google Scholar] [CrossRef]
  7. Farnam, Y.; Villani, C.; Washington, T.; Spence, M.; Jain, J.; Jason Weiss, W. Performance of carbonated calcium silicate based cement pastes and mortars exposed to NaCl and MgCl2 deicing salt. Constr. Build. Mater. 2016, 111, 63–71. [Google Scholar] [CrossRef]
  8. Jacobsen, S.; Sellevold, E.J.; Matala, S. Frost durability of high strength concrete: Effect of internal cracking on ice formation. Cem. Concr. Res. 1996, 26, 919–931. [Google Scholar] [CrossRef]
  9. Dong, S.; Feng, D.; Jiang, S.; Zhu, W. Effect of freezing temperature on the microstructure of negative temperature concrete. Proc. Adv. Mater. Res. 2013, 663, 343–348. [Google Scholar] [CrossRef]
  10. Pigeon, M. Durability of Concrete in Cold Climates; CRC Press: Boca Raton, FL, USA, 2014. [Google Scholar] [CrossRef]
  11. Zhang, G.; Yang, Y.; Yang, H.; Li, H. Calcium sulphoaluminate cement used as mineral accelerator to improve the property of Portland cement at sub-zero temperature. Cem. Concr. Compos. 2020, 106, 103452. [Google Scholar] [CrossRef]
  12. Powers, T.C. A Working hypothesis for further studies of frost resistance of concrete. ACI J. Proc. 1945, 41, 245–272. [Google Scholar] [CrossRef]
  13. Koniorczyk, M.; Konca, P. Kinetics of water freezing in mesopores determined by differential scanning calorimetry. Int. J. Therm. Sci. 2017, 122, 124–132. [Google Scholar] [CrossRef]
  14. Nmai, C.K. Cold weather concreting admixtures. Cem. Concr. Compos. 1998, 20, 121–128. [Google Scholar] [CrossRef]
  15. Barna, L.A.; Korhonen, C.J. Extending the Season for Concrete Construction and Repair, Phase III―Guidance for Optimizing Admixture Dosage Rates Cold Regions Research and Engineering Laboratory; U.S. Army Engineering Research and Development Center, Cold Regions Research and Engineering Laboratory: Hanover, NH, USA, 2014. [Google Scholar]
  16. Farrington, S.A.; Christensen, B.J. The use of chemical admixtures to facilitate placement of concrete at freezing temperatures. ACI Spec. Publ. 2003, 217, 71–86. [Google Scholar]
  17. ACI. ACI Committee 306R-10 Guide to Cold Weather Concreting; American Concrete Institute: Farmington Hills, MI, USA, 2010. [Google Scholar]
  18. Demirboǧa, R.; Karagöl, F.; Polat, R.; Kaygusuz, M.A. The effects of urea on strength gaining of fresh concrete under the cold weather conditions. Constr. Build. Mater. 2014, 64, 114–120. [Google Scholar] [CrossRef]
  19. Korhonen, C.J.; Cortez, E.R. Antifreeze admixtures for cold weather concreting. Concr. Int. 1991, 13, 38–41. [Google Scholar]
  20. Liu, Y.; Sun, F.; Yu, K.; Yang, Y. Experimental and numerical research on development of synthetic heat storage form incorporating phase change materials to protect concrete in cold weather. Renew. Energy 2020, 149, 1424–1433. [Google Scholar] [CrossRef]
  21. Zhang, G.; Yang, Y.; Li, H. Calcium-silicate-hydrate seeds as an accelerator for saving energy in cold weather concreting. Constr. Build. Mater. 2020, 264, 120191. [Google Scholar] [CrossRef]
  22. Ju, C.; Liu, Y.; Jia, M.; Yu, K.; Yu, Z.; Yang, Y. Effect of calcium oxide on mechanical properties and microstructure of alkali-activated slag composites at sub-zero temperature. J. Build. Eng. 2020, 32, 101561. [Google Scholar] [CrossRef]
  23. Zhang, G.; Yang, H.; Ju, C.; Yang, Y. Novel selection of environment-friendly cementitious materials for winter construction: Alkali-activated slag/Portland cement. J. Clean. Prod. 2020, 258, 120592. [Google Scholar] [CrossRef]
  24. Karagöl, F.; Demirboǧa, R.; Kaygusuz, M.A.; Yadollahi, M.M.; Polat, R. The influence of calcium nitrate as antifreeze admixture on the compressive strength of concrete exposed to low temperatures. Cold Reg. Sci. Technol. 2013, 89, 30–35. [Google Scholar] [CrossRef]
  25. Ramachandran, V.S. Concrete Admixtures Handbook: Properties, Science and Technology, 2nd ed.; William Andrew: Norwich, NY, USA, 1996; pp. 740–756. [Google Scholar]
  26. Kothari, A.; Hedlund, H.; Illikainen, M.; Cwirzen, A. Effects of sodium nitrate and OPC-GGBS concrete mix composition on phase transition of pore water at subzero temperatures. Constr. Build. Mater. 2022, 327, 126901. [Google Scholar] [CrossRef]
  27. Meyer, C. The greening of the concrete industry. Cem. Concr. Compos. 2009, 31, 601–605. [Google Scholar] [CrossRef]
  28. Di Summa, D.; Tenório Filho, J.R.; Snoeck, D.; Van den Heede, P.; Van Vlierberghe, S.; Ferrara, L.; De Belie, N. Environmental and economic sustainability of crack mitigation in reinforced concrete with SuperAbsorbent polymers (SAPs). J. Clean. Prod. 2022, 358, 131998. [Google Scholar] [CrossRef]
  29. Escalante, J.I.; Gómez, L.Y.; Johal, K.K.; Mendoza, G.; Mancha, H.; Méndez, J. Reactivity of blast-furnace slag in Portland cement blends hydrated under different conditions. Cem. Concr. Res. 2001, 31, 1403–1409. [Google Scholar] [CrossRef]
  30. Kaufmann, J.P. Experimental identification of ice formation in small concrete pores. Cem. Concr. Res. 2004, 34, 1421–1427. [Google Scholar] [CrossRef]
  31. Scherer, G.W. Crystallization in pores. Cem. Concr. Res. 1999, 29, 1347–1358. [Google Scholar] [CrossRef]
  32. Li, G.; Zhang, J.; Song, Z.; Shi, C.; Zhang, A. Improvement of workability and early strength of calcium sulphoaluminate cement at various temperature by chemical admixtures. Constr. Build. Mater. 2018, 160, 427–439. [Google Scholar] [CrossRef]
  33. Wang, P.; Li, N.; Xu, L. Hydration evolution and compressive strength of calcium sulphoaluminate cement constantly cured over the temperature range of 0 to 80 °C. Cem. Concr. Res. 2017, 100, 203–213. [Google Scholar] [CrossRef]
  34. Glasser, F.P.; Zhang, L. High-performance cement matrices based on calcium sulfoaluminate-belite compositions. Cem. Concr. Res. 2001, 31, 1881–1886. [Google Scholar] [CrossRef]
  35. Zhang, L.; Glasser, F.P. Investigation of the microstructure and carbonation of CSA-based concretes removed from service. Cem. Concr. Res. 2005, 35, 2252–2260. [Google Scholar] [CrossRef]
  36. Yoon, H.N.; Seo, J.; Kim, S.; Lee, H.K.; Park, S. Hydration of calcium sulfoaluminate cement blended with blast-furnace slag. Constr. Build. Mater. 2021, 268, 121214. [Google Scholar] [CrossRef]
  37. Andac, O.; Glasser, F.P. Microstructure and microchemistry of calcium sulfoaluminate cement. Mater. Res. Soc. Symp.-Proc. 1994, 370, 135–142. [Google Scholar] [CrossRef]
  38. Hargis, C.W. Advances in Sustainable Cements. Ph.D. Thesis, University of California, Berkeley, CA, USA, 2013. [Google Scholar]
  39. Winnefeld, F.; Martin, L.H.J.; Müller, C.J.; Lothenbach, B. Using gypsum to control hydration kinetics of CSA cements. Constr. Build. Mater. 2017, 155, 154–163. [Google Scholar] [CrossRef]
  40. Liang, Z. Microstructure and Performance of Calcium Sulfoaluminate Cements. Ph.D. Dissertation, University of Aberdeen, Aberdeen, UK, 2000. [Google Scholar]
  41. Pelletier, L.; Winnefeld, F.; Lothenbach, B. The ternary system Portland cement-calcium sulphoaluminate clinker-anhydrite: Hydration mechanism and mortar properties. Cem. Concr. Compos. 2010, 32, 497–507. [Google Scholar] [CrossRef]
  42. Won, J.P.; Hwang, U.J.; Kim, C.K.; Lee, S.J. Mechanical performance of shotcrete made with a high-strength cement-based mineral accelerator. Constr. Build. Mater. 2013, 49, 175–183. [Google Scholar] [CrossRef]
  43. Afroughsabet, V.; Biolzi, L.; Monteiro, P.J.M.; Gastaldi, M.M. Investigation of the mechanical and durability properties of sustainable high performance concrete based on calcium sulfoaluminate cement. J. Build. Eng. 2021, 43, 102656. [Google Scholar] [CrossRef]
  44. Péra, J.; Ambroise, J.; Holard, E.; Beauvent, G. Influence of the type of calcium sulfate on the properties of calcium sulfateluminate cement. In Proceedings of the 11th International Congress on the Chemistry of Cement, Durban, South Africa, 11–16 May 2003; pp. 1129–1135. [Google Scholar]
  45. Winnefeld, F.; Barlag, S. Calorimetric and thermogravimetric study on the influence of calcium sulfate on the hydration of ye’elimite. J. Therm. Anal. Calorim. 2010, 101, 949–957. [Google Scholar] [CrossRef]
  46. Pace, M.L.; Telesca, A.; Marroccoli, M.; Valenti, G.L. Use of industrial byproducts as alumina sources for the synthesis of calcium sulfoaluminate cements. Environ. Sci. Technol. 2011, 45, 6124–6128. [Google Scholar] [CrossRef]
  47. Li, P.; Gao, X.; Wang, K.; Tam, V.W.Y.; Li, W. Hydration mechanism and early frost resistance of calcium sulfoaluminate cement concrete. Constr. Build. Mater. 2020, 239, 117862. [Google Scholar] [CrossRef]
  48. Pacheco-Torgal, F.; Melchers, R.E.; Shi, X.; De Belie, N.; Van Tittelboom, K.; Sáez, A. Eco-Efficient Repair and Rehabilitation of Concrete Infrastructures; Woodhead Publishing: Sawston, UK, 2018; ISBN 9780081021811. [Google Scholar]
  49. Kothari, A.; Tole, I.; Hedlund, H.; Ellison, T.; Cwirzen, A. Partial replacement of OPC with CSA cements—Effects on hydration, fresh and hardened properties. Adv. Cem. Res. 2023, 35, 207–224. [Google Scholar] [CrossRef]
  50. Álvarez-Pinazo, G.; Santacruz, I.; León-Reina, L.; Aranda, M.A.G.; De La Torre, A.G. Hydration reactions and mechanical strength developments of iron-rich sulfobelite eco-cements. Ind. Eng. Chem. Res. 2013, 52, 16606–16614. [Google Scholar] [CrossRef]
  51. Huang, G.; Pudasainee, D.; Gupta, R.; Liu, W.V. Hydration reaction and strength development of calcium sulfoaluminate cement-based mortar cured at cold temperatures. Constr. Build. Mater. 2019, 224, 493–503. [Google Scholar] [CrossRef]
  52. Le Saoût, G.; Lothenbach, B.; Hori, A.; Higuchi, T.; Winnefeld, F. Hydration of Portland cement with additions of calcium sulfoaluminates. Cem. Concr. Res. 2013, 43, 81–94. [Google Scholar] [CrossRef]
  53. Trauchessec, R.; Mechling, J.M.; Lecomte, A.; Roux, A.; Le Rolland, B. Hydration of ordinary Portland cement and calcium sulfoaluminate cement blends. Cem. Concr. Compos. 2015, 56, 106–114. [Google Scholar] [CrossRef]
  54. Qin, L.; Gao, X.; Zhang, A. Potential application of Portland cement-calcium sulfoaluminate cement blends to avoid early age frost damage. Constr. Build. Mater. 2018, 190, 363–372. [Google Scholar] [CrossRef]
  55. Telesca, A.; Marroccoli, M.; Pace, M.L.; Tomasulo, M.; Valenti, G.L.; Monteiro, P.J.M. A hydration study of various calcium sulfoaluminate cements. Cem. Concr. Compos. 2014, 53, 224–232. [Google Scholar] [CrossRef]
  56. Michel, M.; Georgin, J.F.; Ambroise, J.; Péra, J. The influence of gypsum ratio on the mechanical performance of slag cement accelerated by calcium sulfoaluminate cement. Constr. Build. Mater. 2011, 25, 1298–1304. [Google Scholar] [CrossRef]
  57. Tang, S.W.; Zhu, H.G.; Li, Z.J.; Chen, E.; Shao, H.Y. Hydration stage identification and phase transformation of calcium sulfoaluminate cement at early age. Constr. Build. Mater. 2015, 75, 11–18. [Google Scholar] [CrossRef]
  58. Bertola, F.; Gastaldi, D.; Canonico, F.; Paul, G. CSA and slag: Towards CSA composite binders. Adv. Cem. Res. 2019, 31, 147–158. [Google Scholar] [CrossRef]
  59. Gao, D.; Meng, Y.; Yang, L.; Tang, J.; Lv, M. Effect of ground granulated blast furnace slag on the properties of calcium sulfoaluminate cement. Constr. Build. Mater. 2019, 227, 116665. [Google Scholar] [CrossRef]
  60. ASTM C191-19; Standard Test Methods for Time of Setting of Hydraulic Cement by Vicat Needle. ASTM International: West Conshohocken, PA, USA, 2019.
  61. BS EN 12350; Testing Fresh Concrete—Part 2: Slump Test. British Standards Institution: London, UK, 2009.
  62. BS EN 12390; British Standard Testing Hardened Concrete—Part 5 Flexural Strength of Test Specimens. British Standards Institution: London, UK, 2009.
  63. BS 1881; Testing Concrete—Part 203 Recommendations for Measurement of Velocity of Ultrasonic Pulses in Concrete. British Standards Institution: London, UK, 1986.
  64. Rossen, J.E.; Scrivener, K.L. Optimization of SEM-EDS to determine the C-A-S-H composition in matured cement paste samples. Mater. Charact. 2017, 123, 294–306. [Google Scholar] [CrossRef]
  65. Scrivener, K.L. Backscattered electron imaging of cementitious microstructures: Understanding and quantification. Cem. Concr. Compos. 2004, 26, 935–945. [Google Scholar] [CrossRef]
  66. Rueden, C.T.; Schindelin, J.; Hiner, M.C.; DeZonia, B.E.; Walter, A.E.; Arena, E.T.; Eliceiri, K.W. ImageJ2: ImageJ for the next generation of scientific image data. BMC Bioinform. 2017, 18, 529. [Google Scholar] [CrossRef] [PubMed]
  67. Kacimi, L.; Simon-Masseron, A.; Salem, S.; Ghomari, A.; Derriche, Z. Synthesis of belite cement clinker of high hydraulic reactivity. Cem. Concr. Res. 2009, 39, 559–565. [Google Scholar] [CrossRef]
  68. Guerrero, A.; Goñi, S.; Moragues, A.; Dolado, J.S. Microstructure and mechanical performance of belite cements from high calcium coal fly ash. J. Am. Ceram. Soc. 2005, 88, 1845–1853. [Google Scholar] [CrossRef]
  69. Gartner, E.M.; MacPhee, D.E. A physico-chemical basis for novel cementitious binders. Cem. Concr. Res. 2011, 41, 736–749. [Google Scholar] [CrossRef]
  70. Burris, L.E.; Kurtis, K.E. Water-to-cement ratio of calcium sulfoaluminate belite cements: Hydration, setting time, and strength development. Cement 2022, 8, 100032. [Google Scholar] [CrossRef]
  71. Alzaza, A.; Ohenoja, K.; Illikainen, M. Improved strength development and frost resistance of Portland cement ground-granulated blast furnace slag binary binder cured at 0 °C with the addition of calcium silicate hydrate seeds. J. Build. Eng. 2022, 48, 103904. [Google Scholar] [CrossRef]
  72. Wang, F.; Kong, X.; Wang, D.; Wang, Q. The effects of nano-C-S-H with different polymer stabilizers on early cement hydration. J. Am. Ceram. Soc. 2019, 102, 5103–5116. [Google Scholar] [CrossRef]
  73. Jansen, D.; Spies, A.; Neubauer, J.; Ectors, D.; Goetz-Neunhoeffer, F. Studies on the early hydration of two modifications of ye’elimite with gypsum. Cem. Concr. Res. 2017, 91, 106–116. [Google Scholar] [CrossRef]
  74. Nocuń-Wczelik, W.; Stok, A.; Konik, Z. Heat evolution in hydrating expansive cement systems. J. Therm. Anal. Calorim. 2010, 101, 527–532. [Google Scholar] [CrossRef]
  75. Živica, V. Properties of blended sulfoaluminate belite cement. Constr. Build. Mater. 2000, 14, 433–437. [Google Scholar] [CrossRef]
  76. Yeung, J.S.K.; Yam, M.C.H.; Wong, Y.L. 1-Year development trend of concrete compressive strength using Calcium Sulfoaluminate cement blended with OPC, PFA and GGBS. Constr. Build. Mater. 2019, 198, 527–536. [Google Scholar] [CrossRef]
  77. Coppola, L.; Coffetti, D.; Crotti, E. Use of tartaric acid for the production of sustainable Portland-free CSA-based mortars. Constr. Build. Mater. 2018, 171, 243–249. [Google Scholar] [CrossRef]
  78. Kolani, B.; Buffo-Lacarrière, L.; Sellier, A.; Escadeillas, G.; Boutillon, L.; Linger, L. Hydration of slag-blended cements. Cem. Concr. Compos. 2012, 34, 1009–1018. [Google Scholar] [CrossRef]
  79. Alzaza, A.; Ohenoja, K.; Isteri, V.; Hanein, T.; Geddes, D.; Poikelispää, M.; Illikainen, M. Blending eco-efficient calcium sulfoaluminate belite ferrite cement to enhance the physico–mechanical properties of Portland cement paste cured in refrigerated and natural winter conditions. Cem. Concr. Compos. 2022, 129, 104469. [Google Scholar] [CrossRef]
  80. Bager, D.H.; Sellevold, E.J. Ice formation in hardened cement paste, Part I—Room temperature cured pastes with variable moisture contents. Cem. Concr. Res. 1986, 16, 709–720. [Google Scholar] [CrossRef]
  81. Morishige, K.; Iwasaki, H. X-ray study of freezing and melting of water confined within SBA-15. Langmuir 2003, 19, 2808–2811. [Google Scholar] [CrossRef]
  82. Schreiber, A.; Ketelsen, I.; Findenegg, G.H. Melting and freezing of water in ordered mesoporous silica materials. Phys. Chem. Chem. Phys. 2001, 3, 1185–1195. [Google Scholar] [CrossRef]
  83. Sun, Z.; Scherer, G.W. Pore size and shape in mortar by thermoporometry. Cem. Concr. Res. 2010, 40, 740–751. [Google Scholar] [CrossRef]
  84. Klemm, A.J.; Klemm, P. Ice formation in pores in polymer modified concrete—I. The influence of the admixtures on the water to ice transition. Build. Environ. 1997, 32, 195–198. [Google Scholar] [CrossRef]
  85. Liu, Z.; Jiao, W.; Sha, A.; Gao, J.; Han, Z.; Xu, W. Portland cement hydration behavior at low temperatures: Views from calculation and experimental study. Adv. Mater. Sci. Eng. 2017, 2017, 3927106. [Google Scholar] [CrossRef]
  86. Ogurtsova, Y.N.; Zhernovsky, I.V.; Botsman, L.N. Efficiency of Composite Binders with Antifreezing Agents. In Proceedings of the IOP Conference Series: Materials Science and Engineering; Institute of Physics Publishing: Bristol, UK, 2017; Volume 262. [Google Scholar]
  87. Polat, R.; Demirboǧa, R.; Karakoç, M.B.; Türkmen, I. The influence of lightweight aggregate on the physico-mechanical properties of concrete exposed to freeze-thaw cycles. Cold Reg. Sci. Technol. 2010, 60, 51–56. [Google Scholar] [CrossRef]
  88. Kaufmann, J. Experimental Identification of Damage Mechanisms in Cementitious Porous Materials on Phase Transition of Pore Solution under Frost Deicing Salt Attack. Ph.D. Thesis, Swiss Federal Institut of Technology Lausanne(EPFL), Lausanne, Switzerland, 2000. [Google Scholar] [CrossRef]
  89. Pruppacher, H.R. On the growth of ice in aqueous solutions contained in capillaries. Z. Fur Naturforsch.-Sect. A J. Phys. Sci. 1967, 22, 895–901. [Google Scholar] [CrossRef]
  90. Barna, L.A.; Seman, P.M.; Korhonen, C.J. Energy-efficient approach to cold-weather concreting. J. Mater. Civ. Eng. 2011, 23, 1544–1551. [Google Scholar] [CrossRef]
  91. Haha, M.B.; Winnefeld, F.; Pisch, A. Advances in understanding ye’elimite-rich cements. Cem. Concr. Res. 2019, 123, 105778. [Google Scholar] [CrossRef]
Figure 1. In-house-built semi-adiabatic calorimeter box cross-section and test setup.
Buildings 13 02374 g001
Figure 2. Differential scanning calorimetry (DSC)—Q100 TA.
Buildings 13 02374 g002
Figure 3. Initial and final setting times of the pure and blended binders.
Buildings 13 02374 g003
Figure 4. Semi-adiabatic temperature developments of the pure OPC, CSA, and blended OPC:Slag:CSA pastes.
Buildings 13 02374 g004
Figure 5. Measured slumps immediately after mixing the concretes.
Buildings 13 02374 g005
Figure 6. Compressive strength developments of the concrete cubes cured at ambient temperature.
Buildings 13 02374 g006
Figure 7. Exothermic heat flow of the pure OPC, CSA, and blended OPC:GGBFS:CSA pastes at a freezing rate of 1°/min using DSC.
Buildings 13 02374 g007
Figure 8. Endothermic heat flow of the pure OPC, CSA, and blended OPC:GGBFS:CSA pastes at a thawing rate of 1°/min using DSC.
Buildings 13 02374 g008
Figure 9. Strength development of the “Instant” removed concrete samples cured at −15 °C.
Buildings 13 02374 g009
Figure 10. Strength development of the “12 h/bf” removed concrete samples cured at −15 °C.
Buildings 13 02374 g010
Figure 11. Strength development of the “24 h/bf” removed concrete samples cured at −15 °C.
Buildings 13 02374 g011
Figure 12. Average Ultrasonic Pulse velocities (UPVs) were measured on the 1-day-old concrete samples.
Buildings 13 02374 g012
Figure 13. Average Ultrasonic Pulse Velocities (UPVs) were measured on the 28-day-old concrete samples.
Buildings 13 02374 g013
Figure 14. SEM images of the 3-day-old concrete samples at distinct time intervals: (ac) OPC:GGBFS:CSA—40:40:20; (df) OPC:GGBFS:CSA—50:50:0 (25 wt.% of AF). (Note: Red color boxes indicate the areas with the detected ettringite crystals, and yellow boxes indicate the unhydrated CSA cement).
Buildings 13 02374 g014
Figure 15. SEM images of the 28-day-old concrete samples at distinct time intervals: (ac) OPC:GGBFS:CSA—40:40:20; (df) OPC:GGBFS:CSA—50:50:0 (25 wt.% of AF). (Note: Red color boxes indicate the areas with the detected ettringite crystals, and yellow boxes indicate the unhydrated CSA cement).
Buildings 13 02374 g015
Figure 16. Pore segmentations on the 3-day-old concrete samples at distinct time intervals: (ac) OPC:GGBFS:CSA—40:40:20; (df) OPC:GGBFS:CSA—50:50:0 (25 wt.% of AF). (Note: Black color indicates the pores).
Buildings 13 02374 g016
Figure 17. Pore segmentations on the 28-day-old concrete samples at distinct time intervals: (ac) OPC:GGBFS:CSA—40:40:20; (df) OPC:GGBFS:CSA—50:50:0 (25 wt.% of AF). (Note: Black color indicates the pores).
Buildings 13 02374 g017
Figure 18. Developments of pore % on the concrete samples at distinct age and time intervals: (a) 3-day-old samples; (b) 28-day-old samples.
Buildings 13 02374 g018
Table 1. Physical properties of the used binders.
BinderTypeProducerFineness cm2/gDensity g/cm3
OPCCEM I 52.5RCementa54003.2
SlagGGBFSMerox AB43502.9
CSABelite-CSACaltra Nederland B.V50002.9
Table 2. Chemical compositions of the used binders and fillers.
Chemical (%)OPCGGBFSCSAQuartz FillerFine Sand (B15)
CaO62.530.340–44--
SiO218.8346–1099.690.5
Al2O35.411.6>320.254.9
Fe2O33.20.3<2.20.020.5
MgO1.312.1<1.5--
Na2O0.140.5--1.2
K2O1.30.8--2
SO33.7-9–10--
Cl0.030.3---
LOI2.6−0.930.15-
Table 3. Mix compositions of the pastes.
MixSH CEM I 52.5R
(kg/m3)
GGBFS
(kg/m3)
CSA
(kg/m3)
w/bChemical Admixture
(wt%)
CSA (100%)004000.31SP—0.75
OPC (100%)400000.31SP—0.75
OPC:GGBFS:CSA (80:0:20)3200800.31SP—0.75
OPC:GGBFS:CSA (0:80:20)0320800.31SP—0.75
OPC:GGBFS:CSA (40:40:20)160160800.31SP—0.75
OPC:GGBFS:CSA (50:50:0) (0%AF)20020000.31SP—0.75
OPC:GGBFS:CSA (50:50:0) (25%AF)20020000.31SPAFACCAE
0.7525100.1
Table 4. Mix compositions of the concretes.
MixSH CEM I 52.5R (kg/m3)Slag
(kg/m3)
CSA (kg/m3)w/bChemical Admixture
(wt%)
Filler (kg/m3)Aggregate
(kg/m3)
QuartzB150–44–8
CSA (100%)004000.42SP—0.7590901075537
OPC (100%)400000.42SP—0.7590901075537
OPC:GGBFS:CSA (80:0:20)3200800.42SP—0.7590901075537
OPC:GGBFS:CSA (0:80:20)0320800.42SP—0.7590901075537
OPC:GGBFS:CSA (40:40:20)160160800.42SP—0.7590901075537
OPC:GGBFS:CSA (50:50:0) (0%AF)20020000.42SP—0.7590901075537
OPC:GGBFS:CSA (50:50:0) (25%AF)20020000.42SPAFACCAE90901075537
0.7525100.1
Disclaimer/Publisher’s Note: The statements, opinions and data contained in all publications are solely those of the individual author(s) and contributor(s) and not of MDPI and/or the editor(s). MDPI and/or the editor(s) disclaim responsibility for any injury to people or property resulting from any ideas, methods, instructions or products referred to in the content.

