Article

Simplified Multi-Life Cycle Assessment at the Urban Block Scale: GIS-Based Comparative Methodology for Evaluating Energy Efficiency Solutions

by
Carlo Costantino
*,
Anna Chiara Benedetti
and
Riccardo Gulli
Department of Architecture, University of Bologna, 40136 Bologna, Italy
*
Author to whom correspondence should be addressed.
Buildings 2023, 13(9), 2355; https://doi.org/10.3390/buildings13092355
Submission received: 8 August 2023 / Revised: 10 September 2023 / Accepted: 11 September 2023 / Published: 15 September 2023

Abstract

:
The Italian residential building stock consists of 12.2 million buildings, with 7.2 constructed post-World War II during the economic boom. These structures were designed without specific regulations for seismic safety, fire resistance, and energy efficiency, and today lies the current state of strong obsolescence. Therefore, energy refurbishment may not always be the best cost/benefit solution due to these intrinsic issues. Consequently, the transition to construction systems based on circular economy principles brings new opportunities and becomes key to proposing replacement interventions for this heritage. This paper presents a comparative GIS-based bottom-up approach to evaluate the lifecycle impact of residential building blocks, encompassing energy, environmental, and economic aspects. Two tools are introduced: one for measuring energy consumption and the other for quantifying the quantities of materials stored in buildings. This methodology permits comparing the new circular buildings and different refurbishment scenarios to identify the most suitable solution from an environmental impact and financial point of view. The application of a case study, a residential urban block in Bologna, built in 1945–1965, highlights how the demolition and reconstruction scenario based on circular economy principles presents the lowest environmental impacts and is economically competitive compared to standard deep renovation techniques.

1. Introduction

Adopting policies aimed at reducing the environmental impacts of the construction sector, particularly in residential areas, is a central aspect of the ecological transition towards a circular economy model and climate neutrality. Indeed, the construction sector plays a fundamental role at the productive level, energy level, and land level [1]. Energy consumption related to the construction sector remained unchanged in 2019 compared to 2018 worldwide. However, CO2 emissions reached the highest level ever recorded, with approximately 10 GtCO2, accounting for 28% of the total CO2 emissions, attributed to the construction sector (excluding the 10% related to the production of materials) [2]. In Europe as well, similar percentages can be observed in the environmental impacts associated with the construction sector, as it is collectively responsible for 40% of energy consumption [3], 36% of greenhouse gas emissions, 50% of raw material extractions, 40% of waste production, and 21% of water consumption [4]. Therefore, in order to achieve the climate neutrality goals set by the European Union for 2050, it is necessary to adopt strongly proactive policies such as the “FIT for 55%” package, which aims to reduce net greenhouse gas emissions by at least 55% by 2030 [5]. In recent months, the European Parliament has focused on how to intervene to stimulate the energy retrofitting of private and public buildings, aiming to reduce energy consumption and CO2 emissions related to the building stock of the 27 Member States. Consequently, guidelines and strategies are essential to address interventions on such a vast heritage. In Italy, over the past 20 years, incentive policies have led to increasing investments in existing buildings that have surpassed those related to new constructions [6]. Indeed, to achieve the objectives set by the European Union concerning the reduction of greenhouse gas emissions, significant interventions on extensive portions of the residential building stock are required. According to the latest ENEA report of 2021 and PNIEC 2020–2030 (Piano Nazionale Integrato per l’Energia e il Clima), the estimated theoretical retrofitting rate should range between 0.88%, 0.93% and 1.16% of the residential area, depending on the scenario [7]. However, despite the strict requirements of Italian regulations and massive tax incentives, estimated at EUR 110 billion of public expenditure by the end of 2023 [8], the actual impact on building stock has been limited, amounting to only 0.42% of the total residential area. Therefore, less than half of the intended objective has been achieved [6]. From this perspective, energy renovation could not be sufficient in achieving climate neutrality.
In order to assess the environmental impacts of the building’s life cycle, the calculation method described by the European standard EN 15978 from CEN TC 350 is employed. The Life Cycle Assessment (LCA) is divided into several modules specific to each life phase of the building [9]. Energy consumption in the use stage (B1-B7) accounts for the most significant environmental impacts in the building life cycle. According to the literature, this contribution varies within the 60 to 90% range, regardless of the climatic zone of reference [10]. However, we must not underestimate the importance of the environmental impacts of producing building materials (extractions, transport, and manufacturing), which reached an approximate value of 72 Gt in 2010, and projections indicate a further increase to 100 Gt by 2030. In particular, material consumption is primarily driven by the construction sector, representing 36% of the total [11]. In the case of new constructions, the LCA’s workflow describes the life of the building from the production of materials to waste disposal, while the application for existing buildings is not very clearly defined [12]. Indeed, when analysing an existing building, there are three potential scenarios: (i) building preservation; (ii) energy renovation; and (iii) demolition and reconstruction. In particular, even if the standard does not specifically address building preservation cases, it proposes two modes: including only the impacts from the remaining use stage and EoL or adding the incorporated effects that have already occurred from the production stage. Energy renovation and, more generally, refurbishment interventions can be accounted for in two ways: as a hypothetical scenario in module B5 (refurbishment) that considers the planned maintenance operations in future or as interventions evaluated in modules A1-A5, with their scheduled maintenance. The input materials allocated to stage A imply that existing building materials are not considered in the output within the framework. As a result, this approach evaluates only the impacts arising from the new materials used in the renovation without outlining the impacts of the building’s remaining life cycle [12]. Replacement scenarios are also not specifically addressed in EN 15978, whose purpose is to assess the impact of a single building and does not consider the possibility of evaluating multiple life cycles. Consequently, the demolition and new construction scenario would require two separate building assessments.
From these considerations, the analysis boundaries are the element that most significantly influences the final results, particularly regarding placing existing building burden in energy renovation scenarios [13]. Indeed, including the existing buildings’ end-of-life stage in evaluations of energy refurbishment interventions significantly penalises the assessment results, preventing a proper measurement [14]. These issues are also present for evaluation regarding the demolition and reconstruction process, especially when assessing design choices related to the circular economy affecting the subsequent life cycle [15]. In this perspective, to evaluate the environmental impacts associated with the two macro-categories of intervention, deep renovation and replacement, in this study, it has been decided to apply the LCA with multiple cycles. More specifically, the article examines several energy renovation strategies and compares them to an innovative urban regeneration model inspired by circular economy principles. In particular, the case study herein presented concerns the application of the “Reconstruction for Regeneration” (R4R) paradigm at one residential building block located in the outskirts of Bologna [16].
The circular economy (CE) concept recently reaches the general public and presents an alternative to the traditional linear economy model of “take-make-use-dispose.” [17,18,19]. CE aims to produce a “regenerative system” that focuses on minimising raw materials input and waste output, reducing emissions and energy leakage, and achieving a production close loop to facilitate economic growth and alleviate the pressure on the environment [20,21]. Therefore, this narrowing loop process involves reducing resource consumption and increasing overall efficiency, extending the utilisation of building components, parts, and materials by prolonging their lifespans, and enabling multiple use cycles. On the other hand, closing loops involves recycling materials from end of life back into the production process [22,23]. Consequently, the theme of how to strategically conduct the renovation wave between demolition and reconstruction or refurbishment of existing building stock should be approached by analysing multiple life cycles based on environmental impacts (LCA) and economic evaluation (LCCA) [24]. Many studies have recently examined these topics employing GIS-based methodologies. This approach was used in Esch-Sur-Alzette (Luxembourg) to create a thematic mapping of greenhouse gas emissions [25]. In Milan, a georeferenced database was created based on the development of conceptual building models [26,27]. In Helsinki, a three-dimensional predictional city model containing information on usage, materials, and energy consumption was elaborated to evaluate associated greenhouse gas emission reductions by 2050 [28,29].
However, all these urban-scale studies are based on analyses that combine data of a statistical nature, including census data or energy certification results. Equally diffuse are the urban block-scale investigations that address urban regeneration by reducing energy consumption and environmental impacts [30]. At the building scale, the differences in the assessment are from several different points of view: the type of functional unit, the dimensions of the analysis block, how inventory analysis is conducted, the source of data, and so forth. Generally, these analyses begin with in-depth studies of projects of recurring individual building (archetypes) before extending the outcomes to similar ones [31,32,33,34], although examples of research employing statistical data are not lacking [25,35,36]. A methodology that effectively bridges the two scales is lacking, using widely available archives and GIS data on urban building stock as inputs and systematically applying them to extensive areas through building analysis tools in an automated manner. The methodology proposed in this research aims to fill this gap, demonstrating how, starting from archived and georeferenced data, it is possible to generate simplified urban block analyses, thereby creating a decision support tool.

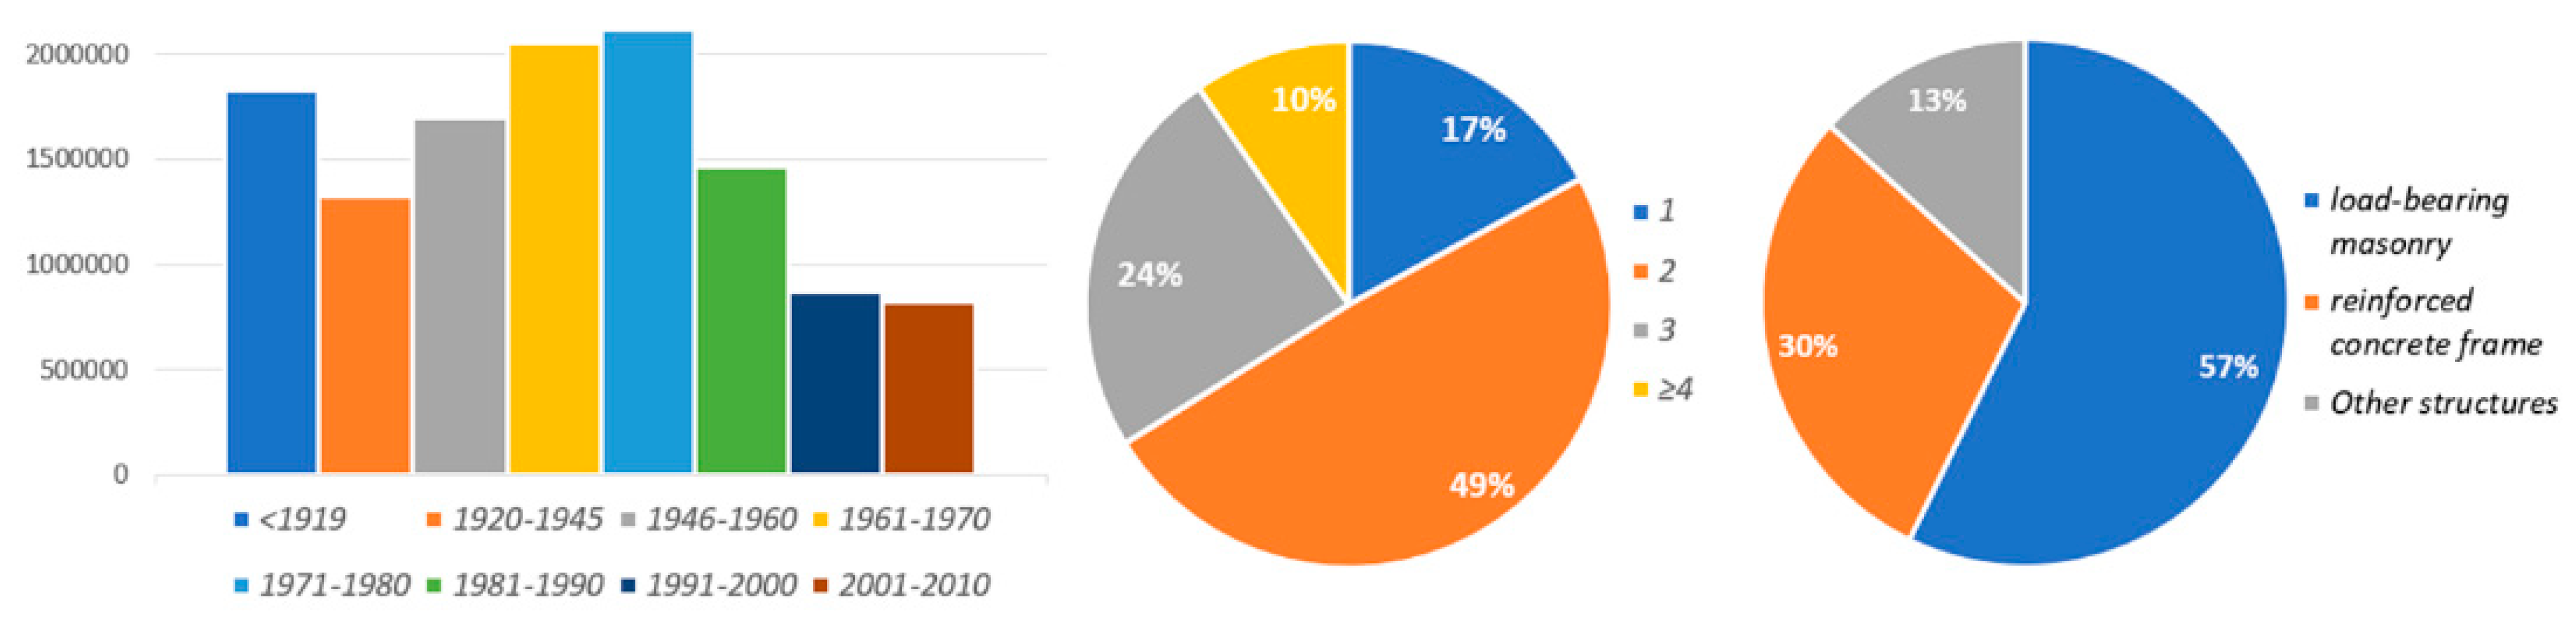
2. The Italian Residential Building Stock of the Second Half of the 20th Century

The history of Italian built heritage, from a typological and regulatory point of view, can be reconducted into four main periods [37] whose main construction and energy-related characteristics have been extensively investigated [38]:
(i)
Masonry building stock constructed up until the 19th century. It comprised the oldest Italian residential heritage primarily constructed with vertical load-bearing structures made of bricks or stone walls and horizontal structures consisting of wooden floors, steel beams, or vaults [39,40].
(ii)
Building stock erected within the first half of the 20th century. It includes buildings constructed during the transition period from load-bearing masonry construction to the introduction and spread of reinforced concrete frame structures [40,41].
(iii)
Buildings constructed in the second half until the definition of various regulatory frameworks concerning structural and seismic safety, fire safety, energy consumption containment, urban planning, accessibility, etc. Within this timeframe, the majority of Italian residential building stock was included, rapidly constructed to meet the post-war reconstruction needs and the significant demographic growth during the economic boom years [42]
(iv)
Contemporary building heritage realised in the last 25 years, i.e., since the aforementioned regulatory framework has consolidated in compliance with the national and European norms [38].
The age of Italian building stock (Figure 1) strongly depends on the regional context. In particular, between 1945 and 1965, a significant demographic increase occurred in large industrial cities, while, in the subsequent decades, in small municipalities. The 2011 ISTAT census indicates 1,700,836 (13.96%) of the buildings were constructed between 1946 and 1960 and 2,050,833 (16.83%) between 1961 and 1970. Overall, more than 60% of the building stock is made of load-bearing masonry, and approximately half of these structures have a height of at least four stories above ground [43]. The Italian regulatory framework concerning the construction sector has gradually evolved from 1960 to 2000 (Table 1). Specifically, at a structural level, the first comprehensive regulation on the use of reinforced concrete dates back to 1971, while the first law on seismic safety at the national level was enacted in 1974. Consequently, 9 of 12 million residential buildings have surpassed 60 years of service life and were constructed without specific regulations. Therefore, the construction year becomes one of the parameters for evaluating the quality and consistency of the residential building stock, dictated by the regulatory framework’s evolution [44]. This assumption becomes evident from an energy consumption savings perspective because over 85% of the building stock has been constructed with standards significantly divergent from those currently in force (Figure 1). Indeed, approximately 25% comprises historical buildings erected before 1945. Around 31% was constructed between 1945 and 1970, before the enactment of the first national energy regulations and with significantly lower construction quality compared to earlier periods. Approximately 29% was built between 1971 and 1990, with only 13.90% being constructed after 1990.
Analysing these data in combination with the distribution of Energy Performance Certificates (EPC) ratings (Figure 2) indicates that, before the first Italian Law 373/1976 concerning energy efficiency, there are no significant variations in energy consumption between historic buildings constructed before 1945 and those built between 1946 and 1972, despite substantial changes in construction techniques, transitioning from the prevalence of load-bearing masonry to reinforced concrete frame structures. During the period 1973–1991, there was a slight improvement, but only after the enforcement of Law 10/91 was there a clear reversal of the trend, with the number of rating-G buildings drastically decreasing from 32.5% to 15.3%. In 2006–2015, there was a progressive diffusion of highly energy-efficient buildings, with classes A and B rising from 4.9% to 29.4%. Finally, with the current Italian law in 2015 [45], there has been a significant energy consumption reduction and ratings from B to A4 cover 75.4% [46]. From a construction quality perspective, the historical context heavily influenced the buildings constructed in Italy between 1945 and 1965. Indeed, despite valuable architectural examples, most suburban buildings exhibit poor material quality and are surrounded by an anonymous and disorderly environment resulting from the need to reconstruct the damaged heritage [47], the dramatic demand for housing [48], and real estate speculation [49]. Therefore, almost all buildings constructed during this period are weak regarding seismic safety and energy efficiency.
This article will focus on the context of Bologna, similar to most medium and large Italian cities, characterised by residential linear block buildings, typically five or six stories high, with depths normally ranging from 9 to 12 m and reinforced concrete frames or load-bearing masonry structures. The floor plan configuration generally includes two to four apartments around a single stairwell for 20 or 30 total internal dwellings. This module type, often with single-faced apartments, was aggregated through lateral juxtaposition along the short side [50]. Considering what has been mentioned earlier, the presence of reinforced concrete frame structures can be regarded as one of the most critical factors of this heritage [37] that cannot be resolved externally or require several internal interventions not always technically feasible or economically justified. In addition, the recurring envelope structures present criticalities in terms of energy performance [38].

3. The Application of the Circular Economy Design Approach to the Demolition and Reconstruction of a Residential Urban Block

This section introduces a construction model inspired by the circular economy that will be the benchmark of this research’s demolition and reconstruction scenario. From the perspective of elaborate long-term strategies for the urban regeneration of suburbs, introducing construction systems inspired by the principles of circular economy is essential to overcome, in a future replacement scenario, the demolition and treatment of construction material impacts and the high quantities of material downcycling. Indeed, such construction systems maximise the opportunities and benefits from the reuse and recycling of construction materials, minimising waste production and reducing the environmental impacts associated with the replacement process. In this context, the scenario of demolition and reconstruction, which will be analysed in the following paragraphs, based on the “Reconstruction for Regeneration” (R4R) paradigm [16] and the Integrho (Integrated Housing System and Facility) construction system, aligns with circular economy principles applied to the building sector, combining them with a bioclimatic and functional adaptability approach [51]. This construction system (Figure 3) employs a design scheme to fit the urban site shape and morphology.
The functional and distributional organisation is articulated in two opposing housing units, divided into served spaces and servant spaces, as described by Louis Kahn. The structural frames comprise spans with fixed dimensions while others remain variable. This layout guarantees the building’s adaptability to the site’s morphology and orientation while preserving the bioclimatic principles governing the relationship between the construction and its environmental context.
The principles of the circular economy model in the built environment have been extensively discussed in the literature [52,53,54]. The primary applications consist of three complementary design strategies to reduce resource consumption and extend the lifespan of materials and components. These three principles can be seen as part of the same theory: building in layers [55], which conceptualises the building as composed of a series of independent layers; design for disassembly [56,57], a design approach focused on the employ of dry elements and connections to streamline maintenance operations, enhance the quantity of reused materials, and improve the quality of recycle from demolition operations; and design out waste, which consists of using resources as efficiently as possible to minimise the amount of waste disposal [58]. The proposed construction system follows these principles from the initial design phases, considering all the building’s environmental impacts cradle to grave. As a result, the design has focused on selecting healthy and certified recycled materials and using easily dismountable dry construction solutions to extend the lifespan of building elements, facilitate their reuse, and substantially enhance the quantity and quality of recyclable content. Consequently, the entire building is designed to be dismountable from its structure, made with steel frames and CLT timber slabs and a prefabricated timber wall with external insulation and internally equipped with heavy clay panels to suit the Mediterranean climate. Furthermore, these solutions allow the interior layout customisation to changes in the user’s needs over time. Fifteen design strategies, categorised into three groups, have been identified, leading to the creation of a closed-loop system inspired by the principles of the circular economy (Figure 3).

4. Materials and Methods

4.1. Methodology, Goal, and Application Field

Despite not showing signs of material degradation or structural instability, the building stock of the second post-war period conceals all the criticalities mentioned in the previous paragraphs concerning seismic, energy, occupancy, and quality aspects related to contemporary needs. Moreover, the extension of this building stock and the vast amount of required investments demand decision support tools and guidelines to address urban regeneration policies in the medium to long term, considering the environmental impacts, economic feasibility and practical obstacles (i.e., fragmented property ownership) and social implications (gentrification, demolitions, etc.) [49]. This research proposes a bottom-up methodological approach that employs georeferenced database information to assess the life cycle impact of existing building stock at the block scale, including energy consumption and environmental and economic effects (Figure 4). In particular, this methodology is designed as a decision support tool to drive the choice between the two main intervention categories: demolition with reconstruction and refurbishment, with the aim to define which option is more environmentally and economically favourable. This methodology is applied in the subsequent sections, referring to a case study: nine intervention scenarios for a residential urban block of Bologna built between 1945 and 1965, including demolition and reconstruction inspired by the circular economy principles to analyse the potential and challenges this solution can offer.
The first stage involves gathering building data through archival research on building permits issued between 1949 and 1965 and their implementation with georeferenced data from Bologna’s Municipality. The second phase foresees the creation of a georeferenced database for the building stock to be employed as a knowledge base and input data for the analysis tools. The instrumental stage comprises a workflow that allows the semi-automatic transformation of two-dimensional GIS polygons and their associated attributes into a three-dimensional, morphologically defined model, referred to as the “Conceptual Model” within the parametric software Grasshopper (1.0.0007) [59].
Subsequently, this simplified model is implemented using the Honeybee plugin, incorporating data related to material properties (density, thermal conductivity, etc.) to conduct a simplified energy consumption simulation and an analysis of the quantities of construction material stored inside buildings. Finally, the results obtained from these tools are used to perform simplified life cycle analyses in terms of environmental and economic impacts. This operation outcome (Figure 5) includes a series of predictive data useful to create a decision support tool for municipal administrations and designers that communicate the benefits and impacts arising from specific interventions, thereby guiding strategic choices regarding the building stock more consciously. Moreover, the tool enables the determination of material quantities stored within buildings, enhancing the potential for urban mining.

4.2. Archival Research and Creation of the Georeferenced Knowledge Base of the Residential Building Stock of Bologna

The first phase of the methodology aims to realise a solid knowledge base of the existing building stock, whose framework is at the core of the subsequent analyses and simulations. This structure has been carried out in distinct ways: (i) through the cataloguing and study of 8209 building permits for new construction or reconstruction of residential buildings, submitted between 1945 and 1965; (ii) the consultation and analysis of cartographies and orthophotos of Bologna during 1945–1965 [60]. This workflow has allowed the urban expansion of Bologna to be reconstructed through “photographs” of the urbanised area taken at sufficiently regular intervals ranging from 5 to 7 years. This way, sites built in those years and now suitable for transformation interventions were identified.
Successively, this documentation has been archived within a database, the “Cataloguing Matrix of Built Heritage”, a tool created to combine the georeferenced information from shapefiles by the Municipality of Bologna with the data from archival research. The process that led to the development of this knowledge base is described in Figure 6. This tool, in the form of a table, contains the main data related to each building, including its typological, constructive, and locational characteristics. In detail, the table is composed of six specific sections, each consisting of a certain number of columns (Figure 7) where the main data related to each building are inserted:
(i)
Information for GIS association.
(ii)
Metric/dimensional data.
(iii)
Building data.
(iv)
Construction data.
(v)
Occupancy capacity.
(vi)
Commercial data.

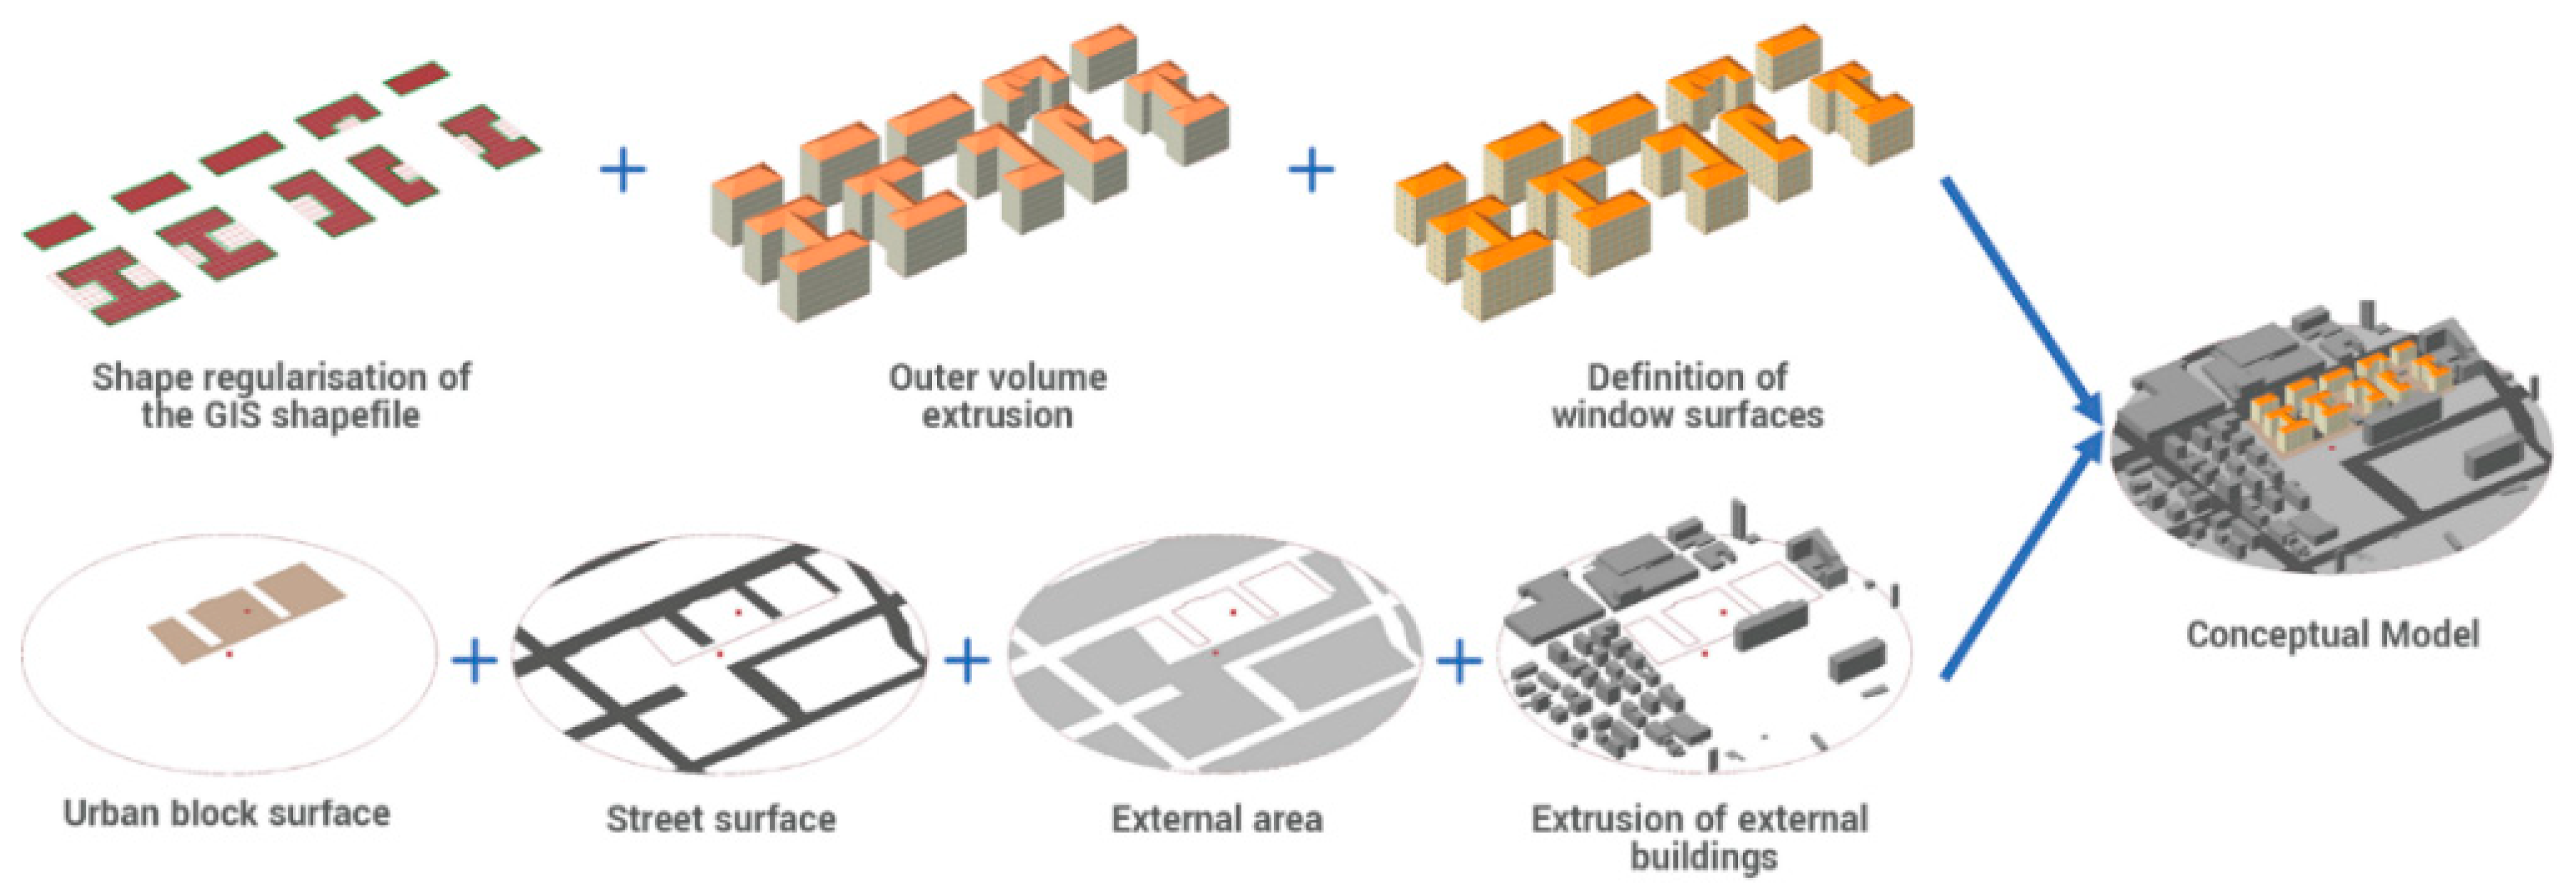
4.2.1. Application of the Methodology to a Case Study and Creation of the “Conceptual Model”

In order to achieve conciseness, only the relevant sections of the urban-scale analysis are presented that led to the identification of the case study as particularly significant for urban regeneration intervention [51]. Data from the “Cataloguing Matrix of Built Heritage” concerning construction and typological characters were used to undertake a systematic selection of urban blocks based on urban planning and dimensional constraints (encompassing only areas ranging from 8000 to 12,000 square meters). Therefore, this process excludes all unsuitable areas for building replacement per the current urban planning instruments and contextual constraints. As a result, a sample of 211 sites built before 1971, compatible with the intervention of demolition and reconstruction, has been identified. Among these, one urban block, identified as FID 273 and located in the northern outskirts of Bologna, was chosen as the exemplary case study for conducting the proposed energy-efficient, Life Cycle Assessment (LCA), and Life Cycle Cost (LCC) simplified analyses. This urban block comprises 10 residential buildings, with a total gross floor area of 24,441.60 square meters and six services (canopies or car garages). It exhibits several recurring characteristics of Bologna’s second post-war residential building stock; the block consists of highly dense buildings varying in height from four to six floors, with underground floors, commercial space at the ground floor, and limited green spaces, as the courtyards are used for parking. The construction characteristics of this block are quite prevalent in the rest of the residential city’s stock of period; the buildings feature a reinforced concrete frame structure, outer walls of 28-thickness solid bricks, floors of reinforced brick–concrete with thickness varying from 16 to 20 cm, and windows are 50% single-pane glass in wooden frames and the other 50% are double-pane glass in aluminium frames. All the main geometric and construction information is summarised in Figure 8.
These data have been employed in formulating an algorithm applicable to several urban blocks (Figure 9) aimed at semi-automatically transforming two-dimensional GIS polygons and their associated attributes into a three-dimensional, morphologically defined model, referred to as the “Conceptual Model” within the parametric software Grasshopper (1.0.0007). The first step is rectifying the polygons’ irregularities derived from the shapefile by generating a new standardised plan composed of numerous small regular rectangles. At this point, the algorithm utilises the building permits database to model the shapefiles, extruding the external context and internal structures. Subsequently, the roof covering is automatically modelled based on the pitched or flat type. In the final modelling stage, the Ladybug and Honeybee plugins are employed to determine the thermal zones, characterise the facades and define their thermal properties (density, thermal conductivity, etc.). The window surfaces are automatically modelled, referring to the minimum Italian law value of one eighth of the net floor area [61]. The surrounding context was modelled using a circle with a radius of 100 m, excluding all geometric entities outside. In this manner, a portion of the city is obtained, consisting of roads, blocks, and buildings that will be used to model external shading and other parameters in the energy simulation.

4.2.2. Quick Tool for Building Energy Consumption Simulation

The first tool developed in this research pertains to the simplified calculation of heating, cooling, and domestic hot water energy consumption at the urban block scale. This assessment will be conducted by comparing the existing buildings (S1 Baseline) with other progressively increasing energy renovation scenarios (e.g., roof insulation, external thermal insulation, window replacement, photovoltaic system installation, etc.) and a demolition and reconstruction scenario, using the circular model. The characteristics of the proposed interventions are summarised in Figure 10.
Specifically, the energy simulation was conducted using the Honeybee (0.0.66) software, part of the open-source plugin suite, Ladybug. This tool enables dynamic simulations of natural lighting and energy consumption using the EnergyPlus/OpenStudio simulation engine. To consider the highly variable behaviour of residential users [62], a set of schedules has been used, some defined by the authors, others derived from literature data or sector regulations: the EPW environmental data refers to Borgo Panigale (one of Bologna’s districts); the occupancy was evaluated at 28.3 m2/person (in line with the calculated data from the Cataloug Matrix); the domestic hot water consumption was considered as 100 L/m2a [63]; lighting was determined as 5 W/m2 based on studies from literature studies [64] and Honeybee; air exchange rates were determined according to the values indicated by the UNI TS 11300-1 regulation [65], 0.3 h−1 for air exchange rate and 0.5 h−1 for older buildings; heating setpoints, cooling setpoints, appliances, and other user schedules refer to the appendices of the UNI EN 16798-1:2019 regulation [63] and the ASHRAE Handbook of Fundamentals 2005 [66].
The results of the EnergyPlus simulations were calculated using a thermal zone per each floor, then averaged to obtain a single value for each building, and further averaged to obtain a meaningful value for the urban block in kWh/m2 of gross floor area. Finally, the obtained energy modelling was calibrated using a second energy model, operating in a semi-steady state method, developed within the EdilClima EC700 (12.23.08) software, in compliance with the current Italian regulations UNI-TS 11300 [65], achieving a variation in the results of less than 10–15% across different simulation scenarios.
The average annual heating demand of each building was converted into equivalent quantities of natural gas and electricity to estimate the Global Warming Potential (GWP) associated with the use stage of each scenario (B6). This conversion was based on the updated OneClick LCA database as of 2022, relying on Ecoinvent and International Energy Agency (IEA) data. Subsequently, the annual cost per square meter due to natural gas and electricity consumption was estimated using the Italian market prices (EUR 1.0764/Sm3 for natural gas and EUR 0.6601/kWh for electricity) provided by the Regulatory Authority for Energy Networks and Environment—ARERA, referring to November 2022 [67]. The results of these measurements, presented in Table 2, reveal a very high energy consumption for the existing buildings in their current state (S1 Baseline), amounting to 235.65 kWh/m2. Additionally, all energy solutions lead to a significant and progressive reduction in energy consumption, depending on the quantity and type of interventions: S2—Roof (−16.77%); S3—Walls (−38.56%); S4—Windows (−7.33%); S5—Envelope (−63.50%); S6—Photovoltaic (−4.75%); S7—Advanced (−68.25%); S8—Deep Renovation (−84.76%); and S9—Replacement (−95.66%).

4.2.3. Quick Tool for Material Passport and Life Cycle Inventory Analysis

The second tool pertains to the computation of the quantity of the materials stocked inside buildings through a Grasshopper algorithm that efficiently and systematically measures the dimensional data concerning the external surfaces (area, height, and volume) and structural elements, starting from the georeferenced shapefiles (Figure 11). These data are important for life cycle analyses, as structures embody varying amounts of CO2, ranging from 30% to 60% during construction and 20% to 40% when also considering the use stage [10]. The algorithm developed in Grasshopper has a twofold purpose: (i) to model an equivalent frame hypothetically defined according to building data and construction techniques of that time; (ii) to systematise the calculations related to the building envelope surfaces. Therefore, the tool allows estimation of, for each building, the quantities of each material, associating the area and volume data with construction data contained in the Cataloguing Matrix (Table 3). This instrument undoubtedly experiences a certain margin of uncertainty compared to analysing a single building, albeit not significant for urban-scale applications, as it has the potential to map the quantities of materials in many urban blocks. The resulting database, therefore, serves these three fundamental purposes:
(i)
Having the quantity data of all building envelope components in order to assess the environmental impacts during the construction stage (A1–A5) of different energy refurbishment scenarios.
(ii)
Obtaining the dimensional data of all building components, including structure, envelope, flooring, etc., for evaluating the environmental impacts related to the demolition and end-of-life phase of existing buildings (C1-D).
(iii)
Estimating all building components for calculating the necessary materials and evaluating the environmental impacts of the reconstruction project (A1–A5), which is hypothesised to occur at the end of the analysis period.
More specifically, the algorithm models the sections of the structural elements based on the data available from the building permits, while the number is defined parametrically according to the overall spans and lengths. The weight of reinforcement bars was assumed according to minimum quantities prescribed by the Italian law and direct comparisons with other projects: in the pillars, the steel area was evaluated as As = 0.8% Ac; in the longitudinal bars of the beams, As = 0.3% Ac; in the inverted beams of the foundation, As = 0.2% Ac [68]. From the attribute tables attached to the building practices, it was possible to accurately determine the materials constituting the outer walls, forming in Bolognese solid bricks (28 cm) with external and internal lime plaster finishing. Regarding the slabs, a variable height between 16 and 20 cm was assumed, with an additional 2 cm for a concrete screed and ceramic flooring. The roof slab is complemented by waterproofing, wooden battens, and clay tiles. The reinforced concrete basement floor slab is assumed to be 15 cm thick. The window areas were estimated assuming half are double-glazed aluminium and the remaining are single-glazed wood [61]. It was not possible to assess the piping of the water systems. At the same time, the electrical cables were estimated based on literature averages, and the air conditioning units were estimated through visual analysis of the facades. The presence of furniture or hazardous materials was not assumed.
The output of this modelling consists of a series of numerical values of volumes and areas. These results are then imported into an Excel spreadsheet composed of different sections, where materials are grouped into homogeneous categories: vertical load-bearing structure, foundations, external walls, systems, etc. The first part establishes a unique connection between the data in the table and the algorithm’s results. The second part specifies the method for calculating the quantities of material for each construction element (e.g., which law will be used to estimate the number of reinforced bars inside concrete). The third part contains the calculation module, which allows for deriving the weight of the construction elements from the data related to each element’s number, length, surface, thickness, volume, and density.
Finally, the EWC code and the possible presence of substances affecting their reusability or recycling are indicated based on literature data classified according to the construction period [69]. From the total weight of construction materials stored in the buildings, it was possible to calculate the average material intensity, which amounts to 1.50 t/m² GFA, in line with the ranges available in the literature concerning reinforced concrete frame buildings, from 1.36 t/m² GFA to 1.54 t/m² GFA [70].
Among the most significant findings in analysing the composition of this type of building are the structural elements (main beams, edge beams, columns, cantilever beams, and slabs), and outer walls are the near totality of weight, 11,042.91 t and 24,228.66 t compared to the overall total of 36,590.88 t (Table 3) (Figure 12). Nevertheless, although reinforcing bars (357.26 t) and other metallic materials (approximately 36.40 t) constitute a very small proportion by weight, their recycling represents significant environmental benefits [71]. The data calculated following this workflow allow, with a reasonable approximation, the inventory analysis of existing buildings. Combining this information with the first tool results provides energy consumption and operational stage data, enabling simplified Life Cycle Assessment (LCA) and Life Cycle Costing (LCC) analyses.

4.3. Life Cycle Assessment (LCA) and Life Cycle Cost (LCC)

The circular construction model is analysed, focusing on a simplified assessment of its environmental and economic impacts using the georeferenced tools presented thus far. This evaluation will be conducted comparatively with the energy refurbishment scenarios previously discussed, using the gross floor area per square meter as the functional unit to maintain compatibility with data from the “Cataloguing Matrix of Built Heritage”. The analysis period is 30 years, as the average life expectancy of energy renovation interventions [72]. In addition, the existing buildings have already exceeded 70 years of service life and would reach a total lifespan of 100 years after another 30 years, assumed as the maximum duration before needing to be demolished and reconstructed in the same form and volume, utilising standard Italian technologies: reinforced concrete frames, brick blocks, and outer EPS insulation. The boundary of the conducted analyses is schematically depicted in Figure 13. In summary, the following aspects are evaluated over 30 years:
  • For all the energy refurbishment scenarios (S2–S8): (i) the production stage for materials needed for renovation; (ii) the construction stage; (iii) the use stage (energy consumption and maintenance); (iv) demolition of the currently existing residential buildings; (v) end of life of demolition materials; and (vi) reconstruction using standard techniques and the same volume and shape.
  • For the preservation scenario (S1 baseline): (i) use stage, i.e., energy consumption and maintenance; (ii) demolition of the buildings; (iii) end of life of the demolished materials; and (iv) reconstruction using standard techniques and the same volume and shape.
  • For the demolition and circular reconstruction scenario: (i) demolition of existing buildings; (ii) end of life of materials; (iii) reconstruction using the Integrho model; and (iv) use stage (energy consumption and maintenance) of the new buildings.
  • The environmental burden from the materials incorporated within the existing building stock, i.e., the production and construction stage (A1–A5) of the existing buildings, is not considered in any analysis scenarios.
The geometric information of the buildings under analysis is summarised in Figure 14. Specifically, for the demolition and reconstruction scenario, an increase of approximately 10% in gross floor area was assumed, supplemented by an additional 10% derived from the optimisation of the existing buildings. The production stage encompasses the materials required for each scenario’s energy refurbishment (or demolition and reconstruction) operations (Figure 15). The assumptions regarding using recycled materials and the end-of-life treatment of materials in the circular model scenario are provided in Supplementary Materials (Table S1). The use phase was evaluated, including four main elements:
  • Energy consumption for heating, cooling, and domestic hot water, assessed for each scenario with the first tool presented.
  • Energy consumption from appliances and lighting, taken from the Joint Research Centre (JRC) technical report for the European Commission, based on data from the European ODYSSEE database: 193.00 kWh/per.y [73].
  • Water consumption of residential buildings, using a module of OneClick LCA.
  • Building maintenance and replacement of components that deteriorate with ageing were estimated by referring to the table in the “Guideline for Sustainable Building” document from “Bundesministerium für Verkehr, Bau-Wohnungswesen”, employing the average lifetime value to evaluate maintenance operations [72].
The simplified module of OneClick LCA has been employed to evaluate the impacts of demolition and end-of-life waste management. For the demolition stage (C1), the module calculates the effects per square meter of gross surface area. It refers to the data in the “RICS professional standards and guidance, UK: Whole life carbon assessment for the built environment” [74]. Environmental impacts related to the treatment process at the waste material sorting plant (machinery for handling, electricity consumption, and emissions from handling) and disposal at recycling, waste-to-energy, or landfill facilities are assessed using specific modules of OneClick LCA based on the EWC code of materials.
As for transportation, evaluated within the same module, data available in the literature have been used: 50 km to recycling facilities for inert materials, 20 km to waste-to-energy facilities, and 100 km to recycling facilities for metal materials. Regarding the transport stage (A4), the calculations have been performed using the higher value between the default value provided by the OneClick LCA (1.10.0) software and the value commonly found in the literature for each material type: 50 km for massive materials [44] and 100 km for all others [75]. The impacts of the construction phase are typically around 4–5% of production stage [76] and have been evaluated with the OneClick LCA module for construction sites in the Mediterranean climate. Specifically, it assumes the production of 5 kg/m2 of construction waste, the consumption of 25 kWh/m2 of electricity, and 3.5 L/m2 of diesel.
The economic viability of different scenarios is evaluated in the medium/long term by examining the benefits generated from the reduction in annual energy cost compared to the operational and construction costs associated with each scenario (Table 2). This assessment aims to estimate the feasibility through the Life Cycle Cost Analysis (LCCA) approach, whose methodological foundation can be traced back to ISO 15686-5:2017. The effectiveness of the design solutions is assessed in terms of costs and potential savings (“negative costs”), and the results will be presented using the indicators Net Present Value (NPV) and Profitability Index (PI). The following assumptions are made:
(i)
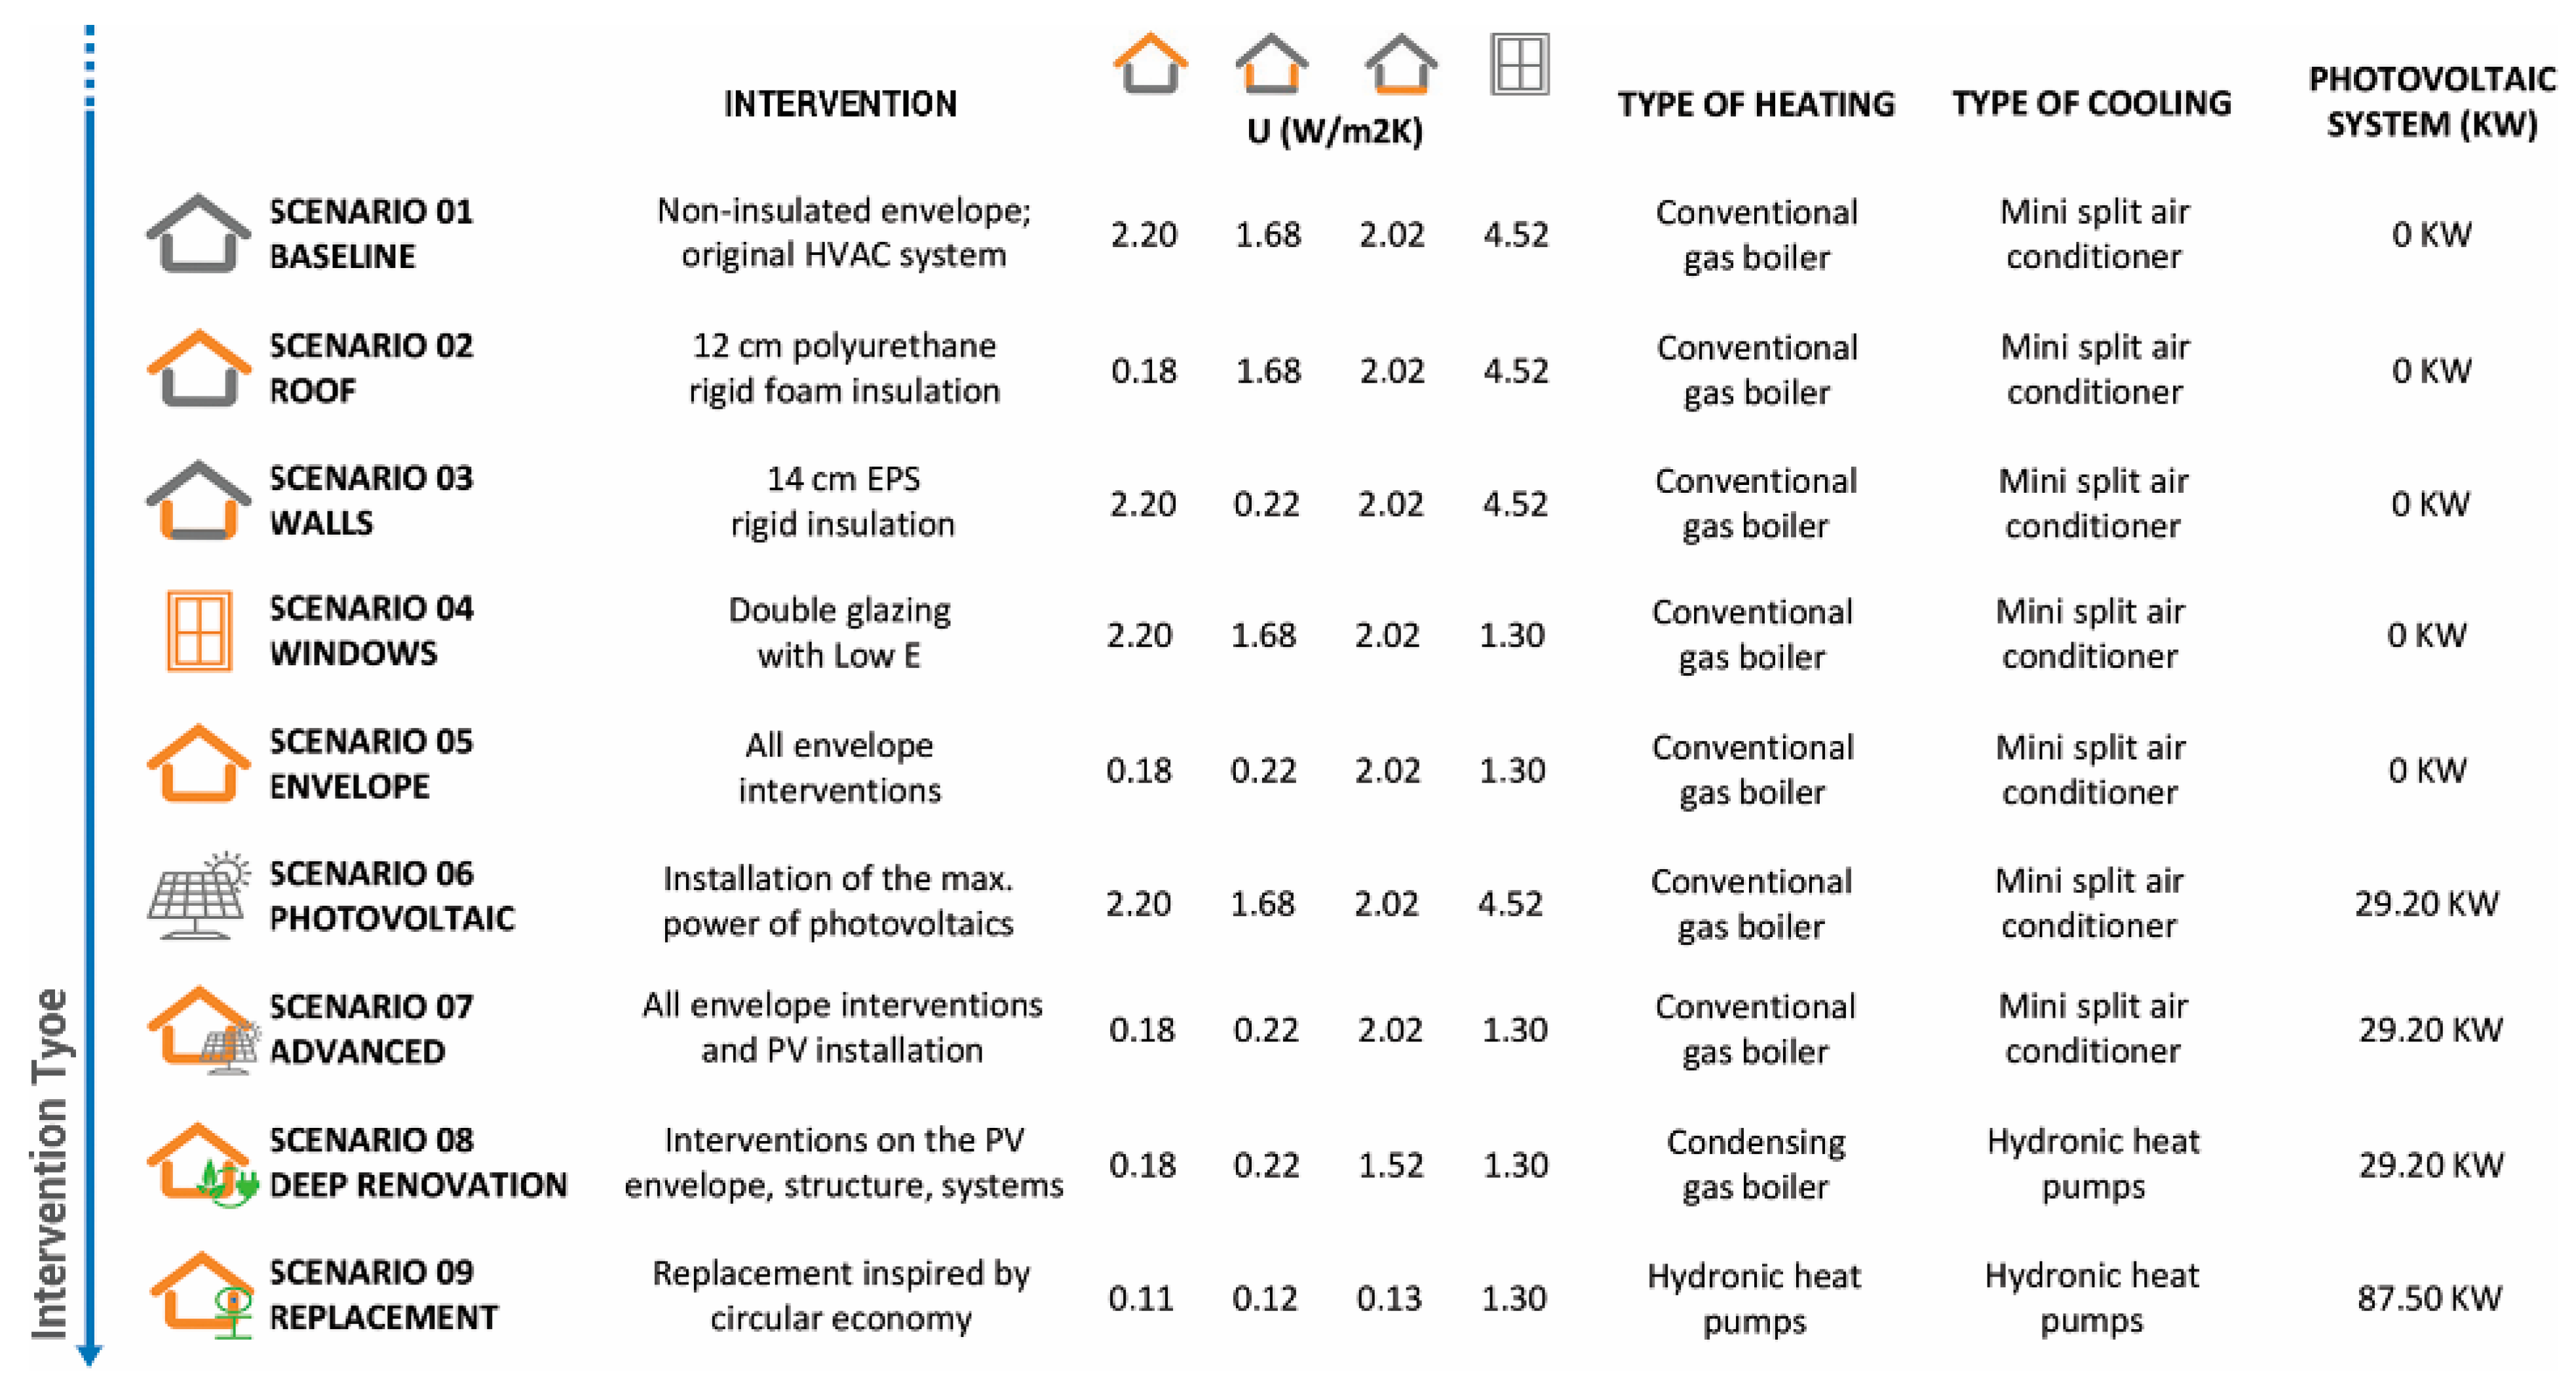
The initial cost of refurbishment interventions (thermal insulation, roof insulation, photovoltaic system installation, and replacement of heating systems) was calculated parametrically or referenced from literature average data. For the new construction scenario, a specific cost estimation was carried out (Table 4, Tables S2 and S3).
(ii)
The benefits derived from the interventions are evaluated as the difference in annual energy cost between the baseline and the considered scenario [69].
(iii)
Maintenance costs were taken from the literature and comparison with similar interventions [77].
(iv)
The cost of demolition and end-of-life waste treatment is based on a specific publication [71].
(v)
The residual value of the demolition and reconstruction scenario was assessed through linear depreciation relative to the intervention construction cost. The retrofitting scenarios were evaluated with a zero residual value since they are expected to be demolished at the end of the 30-year analysis period.
(vi)
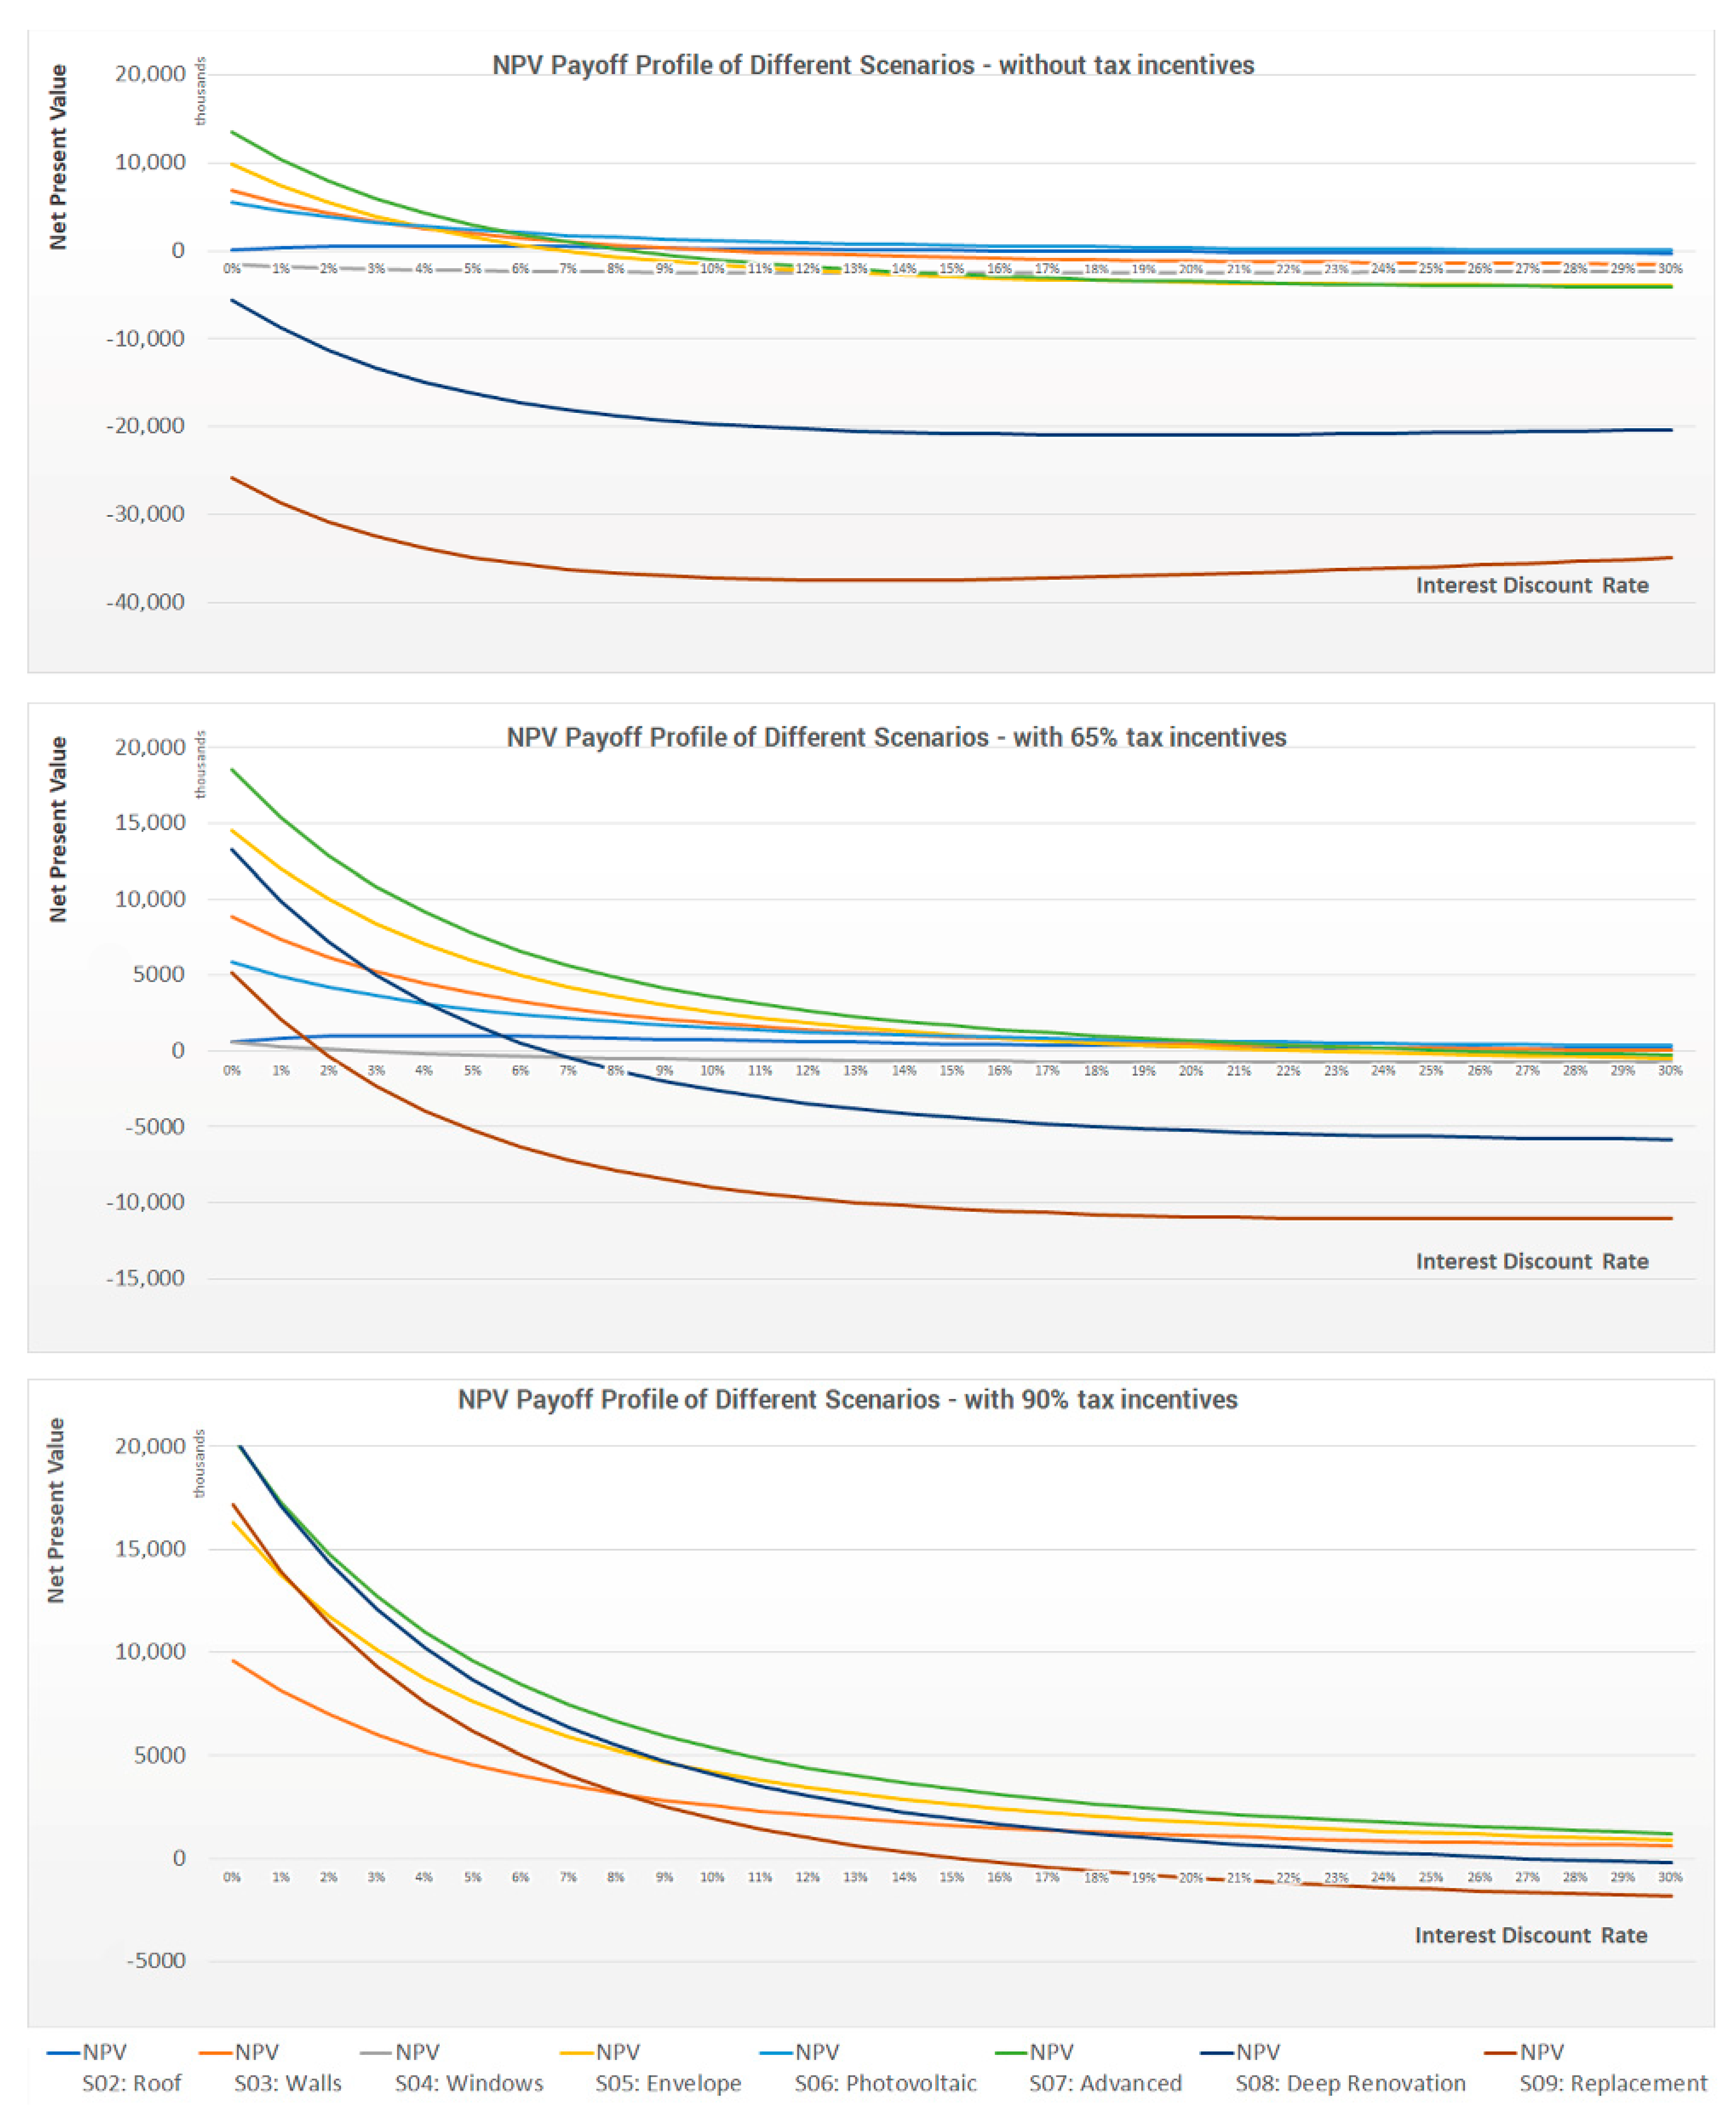
The possible application of tax incentives was considered by current Italian regulations, which provide three thresholds of potential tax deductions based on the type of energy retrofitting intervention: 50%, 65%, and 90% (Table S4).

5. Results

5.1. Interpretation of Life Cycle Assessment (LCA) Results

The results obtained from the simplified LCA analysis are presented in a series of summarised diagrams (Figure 16), which assess the percentage variation relative to the baseline scenario for each impact category. The first graph encompasses all the stages described in the preceding section, including the demolition and reconstruction of buildings in all analysed scenarios after 30 years of use. On the other hand, the second diagram exclusively considers the impacts of the use stage, excluding the operations required to implement the interventions and the end-of-life stage. The third graph accounts for all effects of material production in each scenario, the 30-year use stage, and the end of life solely for the materials installed during the intervention. Consequently, this final assessment places a disadvantageous perspective on the demolition and reconstruction scenario, which is evaluated comprehensively, while, for the other scenarios, the demolition of existing buildings is excluded.
The first diagram shows that all the hypothesised scenarios effectively reduce the environmental impacts of existing buildings, even when considering demolition and reconstruction at the end of the 30-year analysis period. At the same time, partial interventions, such as roof insulation (−11.08%), windows (−3.55%), and photovoltaics (−10.20%), have a limited impact compared to those involving the entire envelope (ranging from −42.73% to −50.21%). In this perspective, any energy renovation intervention, from roof insulation to window replacement and even more significant ones, contributes to reducing greenhouse gas emissions, even in the medium term of 30 years, significantly lowering energy consumption for heating and cooling. The scenarios that achieve the best results across all analysed parameters are the demolition and reconstruction employing the “Integrho” circular model (−74.51%), followed by deep renovation (−50.21%). Furthermore, the analysis results do not account for the biogenic carbon storage of materials which would further favour the replacement model in assessments due to its predominantly bio-based raw materials. From this perspective, taking immediate action through replacement, rather than postponing demolition in the future, proves to be a more environmentally sustainable strategy, although the outcome should be evaluated based on the construction system used for reconstruction. Indeed, the marked result difference between the deep renovation and replacement scenarios is linked to the reconstruction model. Evaluating environmental impacts only concerning the use stage, the difference between the two scenarios diminishes to 5.88%. Finally, the last diagram shows environmental impacts under the assumption that, in scenarios S01–S08, the buildings are not demolished and reconstructed after the 30-year analysis period. Despite these assumptions being particularly unfavourable for the replacement scenario, the demolition and reconstruction achieve a reduction in emissions in line with energy refurbishment scenarios: −58.43% compared to the deep renovation’s −64.19%. To gain further insight into the influence of the circular building model on the assessments above, the impacts related to individual components (structural frame, slabs, outer walls, etc.) of the Integrho model were compared with the standard reconstruction model (Figure 17). The primary contributors in terms of impact are the horizontal load-bearing structures, consisting of steel beams and cross-laminated timber (CLT) slabs, which account for a total of 24.44% of the Global Warming Potential (GWP), followed by the non-structural layers of floors, including dry screed layers with cellulose flakes, gypsum fibre screeds, and radiant panel (13.82%).
These categories are followed by mechanical systems (13.66%), vertical load-bearing steel structures and reinforced concrete shear walls (13.08%). Furthermore, concerning the Integrho model, a particularly high proportion of biogenic carbon storage in materials is evident, totalling 8,823,175.71 KgCO2eq, compared to a greenhouse gas emission of 15,546,190.90 KgCO2eq over the lifecycle.

5.2. Interpretation of Life Cycle Cost (LCC) Results

The simulation was conducted by evaluating the Net Present Value (NPV) (Figure 18) and the Profitability Index (PI) (Figure 19) while varying the interest rate, set as a variable not to influence the analysis results with a predetermined value. Each scenario was assessed based on potential tax deductions available in Italy, 0%, 65%, and 90% (where applicable), to identify the most suitable energy retrofit interventions that can be undertaken on the building stock within a life cycle cost–benefit analysis. Considering the calculation method used, demolition and reconstruction costs at the end of the 30-year simulation period were not included in the study for scenarios other than S9. Indeed, as positive cash flows do not stem from this operation, the NPV method would not account for economically viable interventions. For this reason, the demolition and reconstruction was not accounted in refurbishment scenarios but was only evaluated in the replacement one. As a general result across all scenarios, the contribution provided by tax incentives in energy retrofit interventions proves crucial to ensuring their economic feasibility.
The only strategy deviating from this trend is installing photovoltaic systems, which have a very short payback period despite the unfavourable assumptions of gas heating systems for apartments. Conversely, the situation differs for the more expensive scenarios, S08 Deep Renovation and S09 Replacement, which become economically viable with 90% incentives. Considering the hypothesis of no available tax deductions, despite the extended evaluation period, not all scenarios consistently appear economically sustainable.
S2 Roof yields positive results for interest rates below 16%, with a payback period of 6 years; S3 Walls for interest rates below 11%, with a payback period of 9 years; the S4 Windows scenario is not economically sustainable without incentives; S5 Envelope for interest rates below 7%, with a payback period of 13 years; and S7 Advanced for 8% and 11 years. The 90% scenario, as anticipated, deems all envelope-related interventions economically sustainable, while deep renovation and replacement scenarios yield positive outcomes only with low-interest rates. However, the results concerning scenarios S8 and S9 should be evaluated, considering that the NPV method evaluates an investment positively solely by rating its cashflows. Therefore, all works, primarily structural ones, that do not yield any benefits in terms of energy consumption reduction lead solely to an increase in initial implementation costs. Consequently, they should be assessed based on improved structural safety and residential quality for individuals without a direct comparison with scenarios involving simple energy retrofit.

5.3. Implementation of the Knowledge Base of the Residential Building Stock of Bologna

The tools presented in this research allow for the implementation of the “Cataloguing Matrix of Built Heritage Heritage” seen in Section 4.2 with four specific sections, related to the outcome of simplified analyses each building (Figure 20):
(i)
Energy efficiency: the energy consumption data per gross square meter and the variation compared to the baseline scenario, considering heating, cooling, and domestic hot water, calculated using the Honeybee (0.0.66) software for each analysis scenario.
(ii)
Environmental impacts: the cradle-to-cradle GWP data for each analysis scenario and the variation compared to the baseline scenario are reported.
(iii)
Economic impacts: comprise the market value of the existing buildings and their value after the refurbishment or new construction intervention. In addition, these include the reduction in annual energy costs and the global cost of the analysed interventions.
(iv)
Material passport data: include the material quantities stored in the buildings, divided by EWC code and evenly distributed among the buildings, in kg/m2.
From the subsequent implementation of these data in the municipal georeferenced model, it would be possible to obtain a Digital Twin at the city scale [73]. With appropriate input corrections, this tool could potentially expand both territorially, covering the entire urban territory, and temporally, encompassing not only the second post-war heritage but also functionally, including not only residential buildings.

6. Discussion

The present article has addressed the energy retrofitting of the second half of the 20th-century residential built heritage (1945–1965). The residential stock of this period embedded main issues related to construction techniques and advanced obsolescence. Therefore, while the necessity to intervene in this type of heritage aligns with one of the fundamental strategies for achieving European climate neutrality objectives, implementing these actions on a large housing stock at the urban scale presents significant complexity. This complexity arises from the need to contend with economic and financial analyses, as well as the social and cultural dimensions. For this purpose, a model of urban regeneration based on demolition and reconstruction has been proposed, adhering to the principles of circular economy as a benchmark to be utilised in comparative analyses with other refurbishment scenarios. This model has been formulated by harmonising bioclimatic and functional adaptability strategies with those derived from applying circularity principles to the building project, including building in layers, design for disassembly, and design out waste.
The proposed methodology for assessing urban-scale impacts comprises several phases: informative, procedural, instrumental, and applicative, with the aim of studying different intervention typologies, particularly deep renovation and demolition and reconstruction. From this analysis, the circular model Integrho, due to its design characteristics, demonstrates impacts in terms of greenhouse gas emissions production comparable to the deep renovation scenario (5% difference), even not considering the future demolition and reconstruction of buildings after the 30-year period and without accounting for the high level of storage of biogenic carbon in materials, 8,823,175.71 KgCO2eq against a greenhouse gas emissions total in the life cycle of 15,546,190.90 KgCO2eq. Similarly, positive results are found in other impact category indicators (AP, EP, etc.). Consequently, the economic aspect was addressed, evaluating that the replacement scenario, analysed with the same tax incentives provided for energy renovation interventions, can be economically viable through the tax deductions, specifically 65%, if accompanied by the current volumetric bonuses mandated by regulations, to the extent of at least 20%. The analysis results are subsequently incorporated into the “Cataloguing Matrix of Built Heritage”, allowing this tool to be enriched with energy, environmental, and economic impact data. Applying this methodology to the entire urban area could yield a decision support tool for administrations, aiding in making more informed strategic choices regarding heritage. Furthermore, this tool enables the determination of material quantities stored within buildings, thereby enhancing the potential of urban mining.

7. Conclusions

The present article has introduced a methodology based on employing GIS georeferenced data processing tools to conduct simplified analyses on energy consumption, Life Cycle Assessment (LCA), and Life Cycle Costing (LCC) of residential building stock at the urban block scale. It has highlighted the economic convenience of all energy renovation scenarios analysed, demonstrating effectiveness in reducing energy consumption and environmental impacts. In particular, the simplified LCA analysis conducted at the urban block scale allowed the environmental sustainability to be established in the medium–long term of the demolition and reconstruction intervention based on a construction model inspired by circular economy principles. This finding underscores the validity of these principles in developing an urban regeneration model for second post-war residential buildings based on replacement. Furthermore, it was evaluated how the circular construction model can compete, in terms of environmental impacts, with other analysis scenarios, even when not considering the future long perspective of demolition and reconstruction of the buildings undergoing refurbishment. From an economic point of view, replacement is feasible when supported by substantial tax incentives or by employing an Energy Service Company (ESCo) model, which is not the subject of this article. In both scenarios, two assumptions are considered: (i) approximately a 20% increase in volume will be sold at market value and (ii) all inhabitants will retain ownership of their properties after the reconstruction [51]. In this perspective and under these assumptions, demolition and reconstruction overcome the issues related to gentrification, allowing residents in the outskirts to access new housing, which is often economically unattainable in those areas due to high land property values. Consequently, replacements can be considered one of the sustainable models to be employed in a strategic vision aimed at achieving widespread renewal of the residential building stock in line with the decarbonisation achievement set by the European Union for 2050.

Supplementary Materials

The following supporting information can be downloaded at: https://www.mdpi.com/article/10.3390/buildings13092355/s1, Table S1: Input and end-of-life materials used in the circular building mode; Table S2: Construction costs for each analysis scenario; Table S3: Summary of Cost Estimation related to demolition and reconstruction intervention scenario; Table S4: Summary table of the maximum tax incentives for energy renovation by intervention type (65% and 90%).

Author Contributions

Conceptualisation, C.C., A.C.B. and R.G.; methodology, C.C.; software, C.C.; validation, C.C., A.C.B. and R.G.; formal analysis, C.C.; investigation, C.C.; resources, R.G.; data curation, C.C.; writing—original draft preparation, C.C.; writing—review and editing, A.C.B. and R.G.; visualisation, C.C.; supervision, R.G. All authors have read and agreed to the published version of the manuscript.

Funding

This research received no external funding.

Data Availability Statement

The data presented in this study are available on request from the corresponding author.

Conflicts of Interest

The authors declare no conflict of interest.

References

  1. Butera, F.M. Affrontare La Complessità: Per Governare La Transizione Ecologica; Ambiente: Milan, Italy, 2021. [Google Scholar]
  2. United Nations Environment Programme. Executive Summary of the 2020 Global Status Report for Buildings and Construction—Towards a Zero-Emissions, Efficient and Resilient Buildings and Construction Sector 2020. Available online: https://wedocs.unep.org/20.500.11822/34572 (accessed on 7 August 2023).
  3. Levermore, G. A Review of the IPCC Assessment Report Four, Part 1: The IPCC Process and Greenhouse Gas Emission Trends from Buildings Worldwide. Build. Serv. Eng. Res. Technol. 2008, 29, 349–361. [Google Scholar] [CrossRef]
  4. European Commission—Department: Energy. Energy Efficiency in Buildings; European Commission: Brussels, Belgium, 2020; Available online: https://commission.europa.eu/document/download/65660913-cecb-4f2f-b34c-c9bbf9bed1af_en?filename=in_focus_energy_efficiency_in_buildings_en.pdf (accessed on 10 September 2023).
  5. Consilium. Europa. Available Online: https://www.consilium.europa.eu/it/policies/green-deal/fit-for-55-the-eu-plan-for-a-green-transition/ (accessed on 24 February 2023).
  6. Camera dei Deputati. Una Stima Dell’impatto Delle Misure Di Incentivazione, Rapporto 2021; Servizio Studi—Dipartimento Ambiente: Roma, Italia, 2021. [Google Scholar]
  7. ENEA. Rapporto Annuale Sull’Efficienza Energetica; ENEA: Rome, Italy, 2021. [Google Scholar]
  8. Commissione V della Camera dei deputati (Bilancio, Tesoro e programmazione). Audizione Della Presidente Dell’Ufficio Parlamentare Di Bilancio Nell’ambito Dell’indagine Conoscitiva Sugli Effetti Macroeconomici e Di Finanza Pubblica Derivanti Dagli Incentivi Fiscali in Materia Edilizia; Ufficio Parlamentare di Bilancio: Rome, Italy, 2023; Available online: https://www.upbilancio.it/wp-content/uploads/2023/03/Audizione-incentivi-fisc_edil.pdf (accessed on 7 August 2023).
  9. EN 15978; CEN—European Committee for Standardization. Sustainability of Construction Works—Assessment of Environmental Performance of Buildings—Calculation Method 2012. CEN: Brussels, Belgium, 2012.
  10. Cellura, M. Life Cycle Assessment Dell’Edificio; Editoriale Delfino: Milano, Italy, 2017. [Google Scholar]
  11. OECD. Material Resources, Productivity and the Environment; OECD Green Growth Studies; OECD Publishing: Paris, France, 2015. [Google Scholar]
  12. Zimmermann, R.K.; Kanafani, K.; Rasmussen, F.N.; Andersen, C.; Birgisdóttir, H. LCA-Framework to Evaluate Circular Economy Strategies in Existing Buildings. IOP Conf. Ser. Earth Environ. Sci. 2020, 588, 042044. [Google Scholar] [CrossRef]
  13. Vilches, A.; Garcia-Martinez, A.; Sanchez-Montañes, B. Life Cycle Assessment (LCA) of Building Refurbishment: A Literature Review. Energy Build. 2017, 135, 286–301. [Google Scholar] [CrossRef]
  14. Hasik, V.; Escott, E.; Bates, R.; Carlisle, S.; Faircloth, B.; Bilec, M.M. Comparative Whole-Building Life Cycle Assessment of Renovation and New Construction. Build. Environ. 2019, 161, 106218. [Google Scholar] [CrossRef]
  15. van Stijn, A.; Malabi Eberhardt, L.C.; Wouterszoon Jansen, B.; Meijer, A. A Circular Economy Life Cycle Assessment (CE-LCA) Model for Building Components. Resour. Conserv. Recycl. 2021, 174, 105683. [Google Scholar] [CrossRef]
  16. Benedetti, A.C.; Costantino, C.; Gulli, R.; Predari, G. The Process of Digitalization of the Urban Environment for the Development of Sustainable and Circular Cities: A Case Study of Bologna, Italy. Sustainability 2022, 14, 13740. [Google Scholar] [CrossRef]
  17. Meadows, D.H.; Randers, J.; Behrens, W. The Limits to Growth: A Report to the Club of Rome; Universe Books: New York, NY, USA, 1972. [Google Scholar]
  18. Steffen, W.; Richardson, K.; Rockström, J.; Cornell, S.E.; Fetzer, I.; Bennett, E.M.; Biggs, R.; Carpenter, S.R.; de Vries, W.; de Wit, C.A.; et al. Planetary Boundaries: Guiding Human Development on a Changing Planet. Science 2015, 347, 1259855. [Google Scholar] [CrossRef]
  19. IPCC. Climate Change 2013: The Physical Science Basis—Google Scholar. Available online: https://scholar.google.com/scholar_lookup?title=AR6%20Climate%20Change%202021%3A%20the%20Physical%20Science%20Basis&publication_year=2021&author=IPCC (accessed on 25 July 2023).
  20. Pomponi, F.; Moncaster, A. Circular Economy for the Built Environment: A Research Framework. J. Clean. Prod. 2017, 143, 710–718. [Google Scholar] [CrossRef]
  21. Geissdoerfer, M.; Savaget, P.; Bocken, N.M.P.; Hultink, E.J. The Circular Economy—A New Sustainability Paradigm? J. Clean. Prod. 2017, 143, 757–768. [Google Scholar] [CrossRef]
  22. Ellen MacArthur Foundation. Towards the Circular Economy. J. Ind. Ecol. 2013, 2, 23–44.
  23. Bocken, N.M.P.; de Pauw, I.; Bakker, C.; van der Grinten, B. Product Design and Business Model Strategies for a Circular Economy. J. Ind. Prod. Eng. 2016, 33, 308–320. [Google Scholar] [CrossRef]
  24. Bragadin, M.A.; D’Alesio, M.; Ferrante, A. Demolish or Rebuild? Life Cycle Cost Analysis and Maintenance Plan for the Pro-Get-One Case Study—TEMA. Tema 2022, 8, 77–88. [Google Scholar]
  25. Mastrucci, A.; Marvuglia, A.; Benetto, E.; Leopold, U. A Spatio-Temporal Life Cycle Assessment Framework for Building Renovation Scenarios at the Urban Scale. Renew. Sustain. Energy Rev. 2020, 126, 109834. [Google Scholar] [CrossRef]
  26. Ferrari, S.; Zagarella, F.; Caputo, P.; Dall’O’, G. A GIS-Based Procedure for Estimating the Energy Demand Profiles of Buildings towards Urban Energy Policies. Energies 2021, 14, 5445. [Google Scholar] [CrossRef]
  27. Ferrari, S.; Zagarella, F.; Caputo, P.; Dall’O’, G. Mapping Buildings’ Energy-Related Features at Urban Level toward Energy Planning. Buildings 2021, 11, 322. [Google Scholar] [CrossRef]
  28. Rossknecht, M.; Airaksinen, E. Concept and Evaluation of Heating Demand Prediction Based on 3D City Models and the CityGML Energy ADE—Case Study Helsinki. ISPRS Int. J. Geo-Inf. 2020, 9, 602. [Google Scholar] [CrossRef]
  29. Helsinki. Heating Demand and Climate Atlas. Available online: https://kartta.hel.fi/3d/Heating/Apps/Helsinki/View.Html (accessed on 25 March 2023).
  30. Lotteau, M.; Loubet, P.; Pousse, M.; Dufrasnes, E.; Sonnemann, G. Critical Review of Life Cycle Assessment (LCA) for the Built Environment at the Neighborhood Scale. Build. Environ. 2015, 93, 165–178. [Google Scholar] [CrossRef]
  31. Davila, C.C.; Reinhart, C. Urban Energy Lifecycle: An Analytical Framework to Evaluate the Embodied Energy Use of Urban Developments. In Proceedings of the Proceedings of the BS2013: 13th Conference of International Building Performance Simulation Association, Chambery, France, 26–28 August 2013. [Google Scholar]
  32. Norman, J.; MacLean, H.L.; Kennedy, C.A. Comparing High and Low Residential Density: Life-Cycle Analysis of Energy Use and Greenhouse Gas Emissions. J. Urban Plan. Dev. 2006, 132, 10–21. [Google Scholar] [CrossRef]
  33. Stephan, A.; Crawford, R.H.; de Myttenaere, K. Multi-Scale Life Cycle Energy Analysis of a Low-Density Suburban Neighbourhood in Melbourne, Australia. Build. Environ. 2013, 68, 35–49. [Google Scholar] [CrossRef]
  34. Nichols, B.G.; Kockelman, K.M. Life-Cycle Energy Implications of Different Residential Settings: Recognising Buildings, Travel, and Public Infrastructure. Energy Policy 2014, 68, 232–242. [Google Scholar] [CrossRef]
  35. Brøgger, M.; Wittchen, K.B. Estimating the Energy-Saving Potential in National Building Stocks—A Methodology Review. Renew. Sustain. Energy Rev. 2018, 82, 1489–1496. [Google Scholar] [CrossRef]
  36. Frayssinet, L.; Merlier, L.; Kuznik, F.; Hubert, J.-L.; Milliez, M.; Roux, J.-J. Modeling the Heating and Cooling Energy Demand of Urban Buildings at City Scale. Renew. Sustain. Energy Rev. 2018, 81, 2318–2327. [Google Scholar] [CrossRef]
  37. Gulli, R.; Benedetti, A.C.; Costantino, C. Obiettivo 2030. Nuovi Paradigmi per l’edilizia Residenziale Delle Periferie Urbane/Goal 2030. New Paradigms for Housing in Urban Peripheries. In Proceedings of the 2030 d.c. Proiezioni Future per una Progettazione Sostenibile; Gangemi Editore International: Messina, Italy, 2022. [Google Scholar]
  38. Corrado, V.; Ballarini, I.; Corgnati, S.P. National Scientific Report on the TABULA Activities in Italy; Dipartimento Di Energetica, Gruppo Di Ricerca TEBE, Politecnico Di Torino: Torino, Italy, 2012. [Google Scholar]
  39. Gulli, R. Recupero e Conservazione Degli Edifici; Edicom Edizioni: Monfalcone, Italy, 2021. [Google Scholar]
  40. Donghi, D. Manuale Dell’Architetto; Unione Tip-Editrice Torinese: Torino, Italy, 1923. [Google Scholar]
  41. Predari, G. I Solai Latero-Cementizi Nella Costruzione Moderna in Italia. 1930–1950; Edicom Edizioni: Monfalcone, Italy, 2015. [Google Scholar]
  42. Consiglio Nazionale delle Ricerche Manuale Dell’architetto; CNR-USIS: Roma, Italy, 1946.
  43. ISTAT 15° Censimento Generale Della Popolazione e Delle Abitazioni; Edifici ed Abitazioni: Rome, Italy, 2011.
  44. Asdrubali, F.; Cumo, F.; Di Matteo, U.; Cellura, M.; Beccali, G. L’analisi Di Ciclo Di Vita Degli Edifici: Metodi, Strumenti, Casi Di Studio; Celid: Turin, Italy, 2012. [Google Scholar]
  45. Italian Government. Decreto Ministeriale 26 Giugno 2015. Applicazione Delle Metodologie Di Calcolo Delle Prestazioni Energetiche e Definizione Delle Prescrizioni e Dei Requisiti Minimi Degli Edifici; Governo Italiano: Rome, Italy, 2015. Available online: https://www.mimit.gov.it/index.php/it/normativa/decreti-interministeriali/decreto-interministeriale-26-giugno-2015-applicazione-delle-metodologie-di-calcolo-delle-prestazioni-energetiche-e-definizione-delle-prescrizioni-e-dei-requisiti-minimi-degli-edifici (accessed on 10 September 2023).
  46. ENEA. La Certificazione Energetica Degli Edifici; Documento Esteso; ENEA: Rome, Italy, 2020. [Google Scholar]
  47. Saraceno, P. Ricostruzione e Pianificazione (1943–1948); Laterza: Laterza, Bari, Italy, 1969; Volume 115. [Google Scholar]
  48. Villani, L. Le Borgate Del Fascismo: Storia Urbana, Politica e Sociale Della Periferia Romana. Le Borgate Del Fascismo; Ledizioni: Milan, Italy, 2012. [Google Scholar]
  49. Margani, G.; Colombrita, N.; Lione, R. La Riqualificazione Dell’edilizia Residenziale Del Secondo Dopoguerra: La “Zona a Mare” Di Catania; Aracne: Rome, Italy, 2014. [Google Scholar]
  50. Aiello, L.; Raiteri, R.; Novi, F. Regole Tipologiche: Metodo Analitico per La Scelta Delle Tipologie Edilizie per La Residenza; Edizioni Luigi Parma: Bologna, Italy, 1979. [Google Scholar]
  51. Costantino, C. L’edilizia Residenziale Nell’era Dell’economia Circolare. Modelli e Paradigmi per La Rigenerazione Delle Periferie Urbane. Dissertation Thesis, University of Bologna, Bologna, Italy, 2023. Available online: http://Amsdottorato.Unibo.It/View/Dottorati/DOT563/,35Ciclo (accessed on 3 June 2023).
  52. Leising, E.; Quist, J.; Bocken, N. Circular Economy in the Building Sector: Three Cases and a Collaboration Tool. J. Clean. Prod. 2018, 176, 976–989. [Google Scholar] [CrossRef]
  53. Rahla, K.M.; Mateus, R.; Bragança, L. Implementing Circular Economy Strategies in Buildings—From Theory to Practice. Appl. Syst. Innov. 2021, 4, 26. [Google Scholar] [CrossRef]
  54. Frederiksen, L.K.; Munch-Petersen, P. Building Circular Economy—Strategies for Decoupling in Architectural Practice. In Structures and Architecture—Bridging the Gap and Crossing Borders; CRC Press: Boca Raton, FL, USA, 2019. [Google Scholar]
  55. Brand, S. How Buildings Learn: What Happens after They’re Built; Penguin: London, UK, 1995. [Google Scholar]
  56. Durmisevic, E. Transformable Building Structures: Design for Disassembly as a Way to Introduce Sustainable Engineering to Building Design and Construction. Doctoral Thesis, Delft University of Technology, Delft, The Netherlands, 2005. [Google Scholar]
  57. Durmisevic, E. Circular Economy in Construction Design Strategies for Reversible Buildings. Available online: Bamb2020.Eu/Wp-Content/Uploads/2019/05/Reversible-Building-Design-Strateges.Pdf (accessed on 18 October 2022).
  58. Beim, A. Circular Construction—Materials Architecture Tectonics; KADK/CINARK: Copenhagen, Denmark, 2019. [Google Scholar]
  59. Costantino, C.; Benedetti, A.C.; Gulli, R. Renovation And Reconstruction Of Built Heritage. Criteria, Instruments, and Means For Energy Savings at Urban Scale. In Proceedings of the International Multidisciplinary Scientific GeoConference, Albena, Bulgaria, 16–25 August 2020; SGEM: Wien, Austria, 2022; Volume 22, pp. 607–614. [Google Scholar]
  60. Geographic Information System of the Municipality of Bologna. Available online: http://dru.iperbole.bologna.it/cartografia (accessed on 2 May 2023).
  61. Italian Government. Decreto Ministeriale Sanità 5 Luglio 1975. Modificazioni Alle Istruzioni Ministeriali 20 Giugno 1896, Relativamente All’altezza Minima Ed Ai Requisiti Igienico-Sanitari Principali Dei Locali Di Abitazione 1975; Governo Italiano: Rome, Italy, 1975; Available online: https://www.prefettura.it/FILES/AllegatiPag/1164/07.06.2023_T_14_D.M._Sanit__05_luglio_1975-posti_CAS.pdf (accessed on 10 September 2023).
  62. Carnieletto, L.; Ferrando, M.; Teso, L.; Sun, K.; Zhang, W.; Causone, F.; Romagnoni, P.; Zarrella, A.; Hong, T. Italian Prototype Building Models for Urban Scale Building Performance Simulation. Build. Environ. 2021, 192, 107590. [Google Scholar] [CrossRef]
  63. Ente Nazionale Italiano di Unificazione. UNI EN 16798, Prestazione Energetica Degli Edifici—Ventilazione per Gli Edifici—Parte 1: Parametri Di Ingresso Dell’ambiente Interno per La Progettazione e La Valutazione Della Prestazione Energetica Degli Edifici in Relazione Alla Qualità Dell’aria Interna, All’ambiente Termico, All’illuminazione e All’acustica—Modulo M1-6; Ente Nazionale Italiano di Unificazione: Milan, Italy, 2019. [Google Scholar]
  64. Hong, W.Y.; Rahmat, B.N.N.N. Energy Consumption, CO2 Emissions and Electricity Costs of Lighting for Commercial Buildings in Southeast Asia. Sci. Rep. 2022, 12, 13805. [Google Scholar] [CrossRef]
  65. Ente Nazionale Italiano di Unificazione. UNI/TS 11300-1. Prestazioni Energetiche Degli Edifici—Parte 1: Determinazione Del Fabbisogno Di Energia Termica Dell’edificio per La Climatizzazione Estiva Ed Invernale; Ente Nazionale Italiano di Unificazione: Milan, Italy, 2014. [Google Scholar]
  66. Thevenard, D.J.; Humphries, R.G. The Calculation of Climatic Design Conditions in the 2005 ASHRAE Handbook-Fundamentals. ASHRAE Trans. 2005, 111, 457–466. [Google Scholar]
  67. ARERA Prezzi e Tariffe per Il Servizio Di Elettricità e Gas in Italia Nel Mercato Tutelato. Available online: https://www.arera.it/it/prezzi.htm (accessed on 8 November 2022).
  68. Italian Government. Regio Decreto-Legge 16 Novembre 1939 N°2229, Norme per L’esecuzione Delle Opere in Conglomerato Cementizio Semplice ed Armato 1939; Governo Italiano: Rome, Italy, 1939; Available online: https://www.gazzettaufficiale.it/eli/gu/1940/04/18/92/so/92/sg/pdf (accessed on 10 September 2023).
  69. Butera, S.; Oberender, A. Materialeatlas over Byggematerialers Genbrugs-Og Genanvendelsespotentialer: Et InnoBYG-Projekt; Teknologisk Institut Byggeri: Høje Tåstrup, Denmark, 2016. [Google Scholar]
  70. Krause, K.; Hafner, A. Resource Efficiency in the Construction Sector: Material Intensities of Residential Buildings—A German Case Study. Energies 2022, 15, 5825. [Google Scholar] [CrossRef]
  71. Costantino, C.; Benedetti, A.C.; Gulli, R. Environmental Expeditive Assessment of Carbon Footprint at the End-of-Life Phase of a Residential Buildings Block. Comparative Evaluation of Different Demolition and Waste Treatment Scenarios Based on LCA and LCC. In Proceedings of the Colloqui.AT.e 2022, Memoria e Innovazione; Edicom Edizioni: Monfalcone (Gorizia), Italy, 2022. [Google Scholar]
  72. Bundesministerium für Verkehr. Bau-Wohnungswesen Guideline for Sustainable Building. Life Span of Building Structures and Components; Federal Office for Building and Regional Planing: Berlin, Germany, 2001. [Google Scholar]
  73. Baldassarri, C.; Allacker, K.; Reale, F.; Castellani, V.; Sala, S. Consumer Footprint. Basket of Products Indicator on Housing; Publications Office of the European Union: Luxembourg, 2017. [Google Scholar]
  74. Papakosta, A.; Sturgis, S. RICS Professional Statement: Whole Life Carbon Assessment for the Built Environment; Royal Institution of Chartered Surveyors (RICS): London, UK, 2017. [Google Scholar]
  75. Zabalza Bribián, I.; Valero Capilla, A.; Aranda Usón, A. Life Cycle Assessment of Building Materials: Comparative Analysis of Energy and Environmental Impacts and Evaluation of the Eco-Efficiency Improvement Potential. Build. Environ. 2011, 46, 1133–1140. [Google Scholar] [CrossRef]
  76. Beccali, M.; Cellura, M.; Fontana, M.; Longo, S.; Mistretta, M. Energy Retrofit of a Single-Family House: Life Cycle Net Energy Saving and Environmental Benefits. Renew. Sustain. Energy Rev. 2013, 27, 283–293. [Google Scholar] [CrossRef]
  77. Fregonara, E.; Carbonaro, C.; Pasquarella, O. LCC Analysis per Valutare la Sostenibilità Economica di Scenari Tecnologici Alla Scala del District. Valori e Valutazioni. 2018, 21, 59–73. [Google Scholar]
  78. Paiho, S.; Pulakka, S.; Knuuti, A. Life-Cycle Cost Analyses of Heat Pump Concepts for Finnish New Nearly Zero Energy Residential Buildings. Energy Build. 2017, 150, 396–402. [Google Scholar] [CrossRef]
  79. DEI. Prezzario Nuove Costruzioni 2° Semestre 2022; Tipologia del Genio Civile: Rome, Italy, 2022. [Google Scholar]
  80. DEI. Prezzi Tipologie Edilizie 2019; Tipologia del Genio Civile: Rome, Italy, 2019. [Google Scholar]
Figure 1. On the left, the Italian residential building stock by construction years; in the centre, the heritage breakdown by the number of residential floors; on the right, the percentage of vertical load-bearing structure types. © Authors’ graphical elaboration.
Buildings 13 02355 g001
Figure 2. The energy rating of Italian residential buildings divided by construction period. © Authors’ graphical elaboration.
Buildings 13 02355 g002
Figure 3. Circular economy principles applied throughout the entire life cycle, main bioclimatic strategies, and diagram of Intergrho’s construction system. © Authors’ graphical elaboration.
Buildings 13 02355 g003
Figure 4. Workflow employed in the presented paper. © Authors’ graphical elaboration.
Buildings 13 02355 g004
Figure 5. Workflow that led to the implementation of the “Cataloguing Matrix of Built Heritage Heritage” with results of simplified analysis. © Authors’ graphical elaboration.
Buildings 13 02355 g005
Figure 6. Workflow that led to the creation of the “Cataloguing Matrix of Built Heritage”. © Authors’ graphical elaboration.
Buildings 13 02355 g006
Figure 7. Different categories of data contained in the “Cataloguing Matrix of Built Heritage” by integrating georeferenced data with building permit information. © Authors’ graphical elaboration.
Buildings 13 02355 g007
Figure 8. Case study FID 273: positioning, geometric, and constructive characterisation of buildings. © Authors’ graphical elaboration.
Buildings 13 02355 g008
Figure 9. Workflow for the creation of the “Conceptual Model” of FID 273. © Authors’ graphical elaboration.
Buildings 13 02355 g009
Figure 10. Thermal transmittance of the building envelope elements, HVAC typologies, and peak power of the photovoltaic system in each scenario. © Authors’ graphical elaboration.
Buildings 13 02355 g010
Figure 11. Breakdown of Conceptual Model into building elements. © Authors’ graphical elaboration.
Buildings 13 02355 g011
Figure 12. Distribution of construction materials by building elements and by EWC code in the analysis of residential block, FID 273. © Authors’ graphical elaboration.
Buildings 13 02355 g012
Figure 13. System boundaries in each evaluated scenario. © Authors’ graphical elaboration.
Buildings 13 02355 g013
Figure 14. Geometrical and construction information of buildings in the energy and deep renovation scenarios on the left and in the replacement scenario on the right. © Authors’ graphical elaboration.
Buildings 13 02355 g014
Figure 15. Construction elements in each scenario: existent buildings on the left, energy renovation in the centre, and circular replacement on the right. © Authors’ graphical elaboration.
Buildings 13 02355 g015
Figure 16. Percentage change in environmental impacts of the nine analysis scenarios evaluated compared to baseline (100%): considering all analysed stages (top), only the use stage (middle), and excluding the demolition/reconstruction at the end of the analysis period for retrofit scenarios (bottom). © Authors’ graphical elaboration.
Buildings 13 02355 g016
Figure 17. Comparison in terms of environmental impacts between the two reconstruction models: (i) based on the principles of circular economy applied to scenario S9; (ii) based on traditional construction techniques applied to scenarios S1–S8. © Authors’ graphical elaboration.
Buildings 13 02355 g017
Figure 18. Net Present Value (NPV) assessed for each intervention scenario at varying interest rates and tax incentives: absent at the top, 65% in the middle, and 90% at the bottom. © Authors’ graphical elaboration.
Buildings 13 02355 g018
Figure 19. Profitability Index (PI) assessed for each intervention scenario at varying interest rates and tax incentives: absent at the top, 65% in the middle, and 90% at the bottom. © Authors’ graphical elaboration.
Buildings 13 02355 g019
Figure 20. Implementation of different categories of data contained in the “Cataloguing Matrix of Built Heritage” from results of simplified analyses. © Authors’ graphical elaboration.
Buildings 13 02355 g020
Table 1. Main sector regulations concerning residential construction in Italy.
Regulatory FrameworkYearMain Italian Law
Structural1971L.1086/1971 Norme per la disciplina delle opere di conglomerato cementizio armato, normale e precompresso, ed a struttura metallica
Seismic1974L.64/1974, Provvedimenti per le costruzioni, con particolari prescrizioni per le zone sismiche
Urban Planning1968D.M. 1444/68, Limiti inderogabili di densità edilizia, di altezza, di distanza fra i fabbricati e rapporti massimi tra gli spazi destinati agli insediamenti residenziali e produttivi e spazi pubblici o riservati alle attività collettive, al verde pubblico o a parcheggi, da osservare ai fini della formazione dei nuovi strumenti urbanistici o della revisione di quelli esistenti, ai sensi dell’art. 17 della legge n. 765 del 1967
Energy1976
1991
Legge 373/1976, Norme per il contenimento del consumo energetico per usi termici negli edifici
Legge10/1991 Norme per l’attuazione del Piano energetico nazionale in materia di uso nazionale dell’energia, di risparmio energetico e di sviluppo delle fonti rinnovabili di energia
Accessibility1989D.M. 236/1989, Prescrizioni tecniche necessarie a garantire l’accessibilità, l’adattabilità e la visitabilità degli edifici privati e di edilizia residenziale pubblica, ai fini del superamento e dell’eliminazione delle barriere architettoniche
Fire Safety1987D.M.246/1987 Norme di sicurezza antincendi per gli edifici di civile abitazione.
Acoustic1997DPCM5-12-1997 Requisiti acustici passivi degli edifici.
Table 2. Energy consumption, costs, and Global Warming Potential (GWP) and respective variations, evaluated for each scenario, compared to the baseline. © Authors.
ScenarioEnergy
Consumption (kW/m2y)
Variation in Energy Cons.
(%)
Annual
Energy Cost
(EUR/m2y)
Variation in A. Energy Cost
(%)
GWP Use Stage (B6) (kgCO2eq/m2y)Variation in GWP (B6)
(%)
S1—Baseline235.65-38.48-53.16-
S2—Roof196.09−16.7731.92−6.5544.18−16.89
S3—Walls144.76−38.5623.98−14.5032.85−38.20
S4—Windows218.36−7.3335.16−3.3148.98−7.87
S5—Envelope85.87−63.5014.30−24.1719.53−63.26
S6—Photovoltaic224.58−4.7527.21−11.2743.77−17.66
S7—Advanced74.80−68.256.58−31.9012.66−76.18
S8—Deep Renovation35.87−84.763.51−34.976.75−87.31
S9—Replacement10.14−95.664.50−33.983.47−93.46
Table 3. Summary table of energy consumption, costs, and Global Warming Potential (GWP) and respective variations, evaluated for each scenario, compared to the baseline. © Authors.
Demolition Waste European Waste Code (EWC)Quantity
(t)
Construction Waste Factor
(%)
Concrete17.01.0111,008.1030.08
Tiles and Ceramics17.01.03776.352.12
Mixtures of concrete, bricks, tiles, and ceramics other than those mentioned in 17.01.0617.01.0724,228.6666.22
Wood17.02.0177.480.21
Glass17.02.022.170.01
Plastic17.02.039.240.03
Bituminous mixtures other than those mentioned in 17.03.0117.03.0251.700.14
Aluminium17.04.021.090.01
Iron and Steel17.04.05357.260.98
Mixed Metals17.04.0735.310.10
Cables other than those mentioned in 17.04.1017.04.1116.950.05
Gypsum-based construction materials other than those mentioned in 17.08.0117.08.028.930.03
Waste Electrical and Electronic EquipmentWAEE17.640.05
TOTAL-36,590.88100.00
Table 4. Relevant operating and intervention costs for each scenario. © Authors.
ElementCostSource of Data
Electricity supply for lighting and air conditioning0.6601 EUR/kWhARERA, IV Trimester 2022 [67]
Natural gas supply for heating1.0764 EUR/Sm3ARERA, October 2022 [67]
Maintenance of the photovoltaic system40 EUR/m2y(Fregonara et al., 2018) [77]
Maintenance of the conventional gas boiler80 EUR/pcs yAltroconsumo, 2022
Maintenance of the heat pump1.5% C0 EUR/pcs y(Paiho et al., 2017) [78]
S2/S5/S7—Installation of 12 cm PIR insulation in the roof180.00 EUR/m2 of roof surface“DEI nuove costruzioni, I semestre 2022” [79]
S3/S5/S7—Installation of 14 cm EPS thermal insulation with graphite.150.00 EUR/m2 of
wall surface
“DEI nuove costruzioni, I semestre 2022” [79]
S4/S5/S7—Installation of new windows (U < 1.30 W/m²K).1.250.00 EUR/m2 of
wall surface
“DEI nuove costruzioni, I semestre 2022” [79]
S6/S7/S8—Installation of a photovoltaic system2.400.00 EUR/kWp(Fregonara et al., 2018) [77]
S8—Deep Renovation, including wall insulation, roof insulation, structural interventions on floors, and vertical structures1.188.00 EUR/m2
GFA
“Prezzario delle tipologie edilizie DEI del 2019” [80]
Cost of demolishing existing buildings131.32 EUR/m2 GFA(Costantino et al., 2022) [71]
S09—Cost of new buildings, Integrho model, including structures, finishes, mechanical and electrical systems1.825.68 EUR/m2 GFA“DEI nuove costruzioni, I semestre 2022” [79]
S01/S02/S03/S04/S05/S06/S07/S08—Cost new buildings using standard construction systems, including structures, finishes, mechanical, and electrical systems1.843.00 EUR/m2 GFA“Prezzario delle tipologie edilizie DEI del 2019” [80]
Disclaimer/Publisher’s Note: The statements, opinions and data contained in all publications are solely those of the individual author(s) and contributor(s) and not of MDPI and/or the editor(s). MDPI and/or the editor(s) disclaim responsibility for any injury to people or property resulting from any ideas, methods, instructions or products referred to in the content.

