Article

Interoperability between Deep Neural Networks and 3D Architectural Modeling Software: Affordances of Detection and Segmentation

School of Sustainable Engineering and the Built Environment, Arizona State University, Tempe, AZ 85287-1404, USA
*
Author to whom correspondence should be addressed.
Buildings 2023, 13(9), 2336; https://doi.org/10.3390/buildings13092336
Submission received: 17 August 2023 / Revised: 12 September 2023 / Accepted: 13 September 2023 / Published: 14 September 2023
(This article belongs to the Special Issue Application of Computer Technology in Buildings)

Abstract

:
Building owners are working on converting their legacy documentation 2D floor plans into digital 3D representations, but the manual process is labor-intensive and time-consuming. In this paper, deep learning is leveraged to automate the process. This automation requires interoperability between artificial neural networks and prevailing 3D modeling software. The system processes 2D floor plans and outputs parameters of recognized walls, single doors, double doors, and columns. The parameters include the start point and end point of the wall and the center point of the door and column. These parameters are input into Revit 2022 through the Revit API 2022 after post-processing. The dimensional parameter integration affordances of object detection and instance segmentation are studied and compared using Faster R-CNN and Mask R-CNN models. Instance segmentation was found to require more time for data labeling but was more capable of informing the modeling of irregularly shaped objects. The mean Average Precision (mAP) of object detection and instance segmentation are 71.7% and 69.3%, respectively. Apart from single doors, the average precision for other categories falls within the range of 74% to 96%. The results provide software developers with guidance on choosing between object detection and instance segmentation strategies for processing legacy building documents. These types of systems are anticipated to be pivotal to the industry’s transition from 2D to 3D information modalities and advise practitioners to carefully choose suitable models and consider the recommendations provided in this study to mitigate potential failure cases.

1. Introduction

Building information modeling (BIM) benefits construction projects throughout the whole project life cycle. It can enhance collaboration among entities, identify potential design clashes ahead to reduce cost, execute effective site analysis and sustainable design, and access precise information for asset management [1]. The process of creating digital BIM models requires legacy system updates from 2D floor plans to 3D digital models. However, this manual digitalization process is costly and time-consuming. Due to these prohibitive costs and inefficiency, many researchers have been automating this digitalization process using computer vision. Computer vision is a prevailing implementation of artificial intelligence. It is used to perform such tasks as pattern recognition, object detection, image classification, and instance segmentation on images, such as 2D floor plans. Some researchers have used object detection to detect components in floor plans, identifying their locations with bounding boxes and class labels [2,3,4,5]. Other researchers used instance segmentation instead, with their system’s output location predictions with masks and class labels [6,7,8].
To reconstruct the 3D model from 2D floorplans using computer vision techniques, there are two main steps. The first step is to train a neural network model, and the second step is to perform 3D model reconstruction from neural network outputs. However, the previous research articles only focus on the first step and show performance metrics of the model and visualizations of predictions on images. There is a research gap in the second step, which is the practice of interoperability. Interoperability indicates how two software systems communicate with each other. In this scenario, the first system is the neural network “system” and the second one is the 3D modeling software “system”. The process of 3D reconstruction from the neural network outputs indicates their interoperability, which demonstrates how well the neural network can communicate with 3D modeling software. Furthermore, despite object detection and instance segmentation being used individually for floor plan processing, the two have never been compared and tradeoffs identified. For software developers to understand which of these they should use, the differences between the post-processing of object detection output and instance segmentation output to interoperate with 3D modeling software need to be explored. The comparison between these two tasks is missing in current research papers. As a result, the following research questions inspired us to conduct this research. “How to automate the process of using neural network outputs to generate 3D model?” and “What are the trade-offs and differences between object detection and instance segmentation tasks under 3D reconstruction from 2D floorplans scenario?”.
In this context, the end-to-end 3D model reconstruction from 2D floor plans using object detection and instance segmentation pipeline is proposed. This pipeline is composed of two main parts: neural networks model training and interoperability between artificial neural networks and building modeling software. This study uses Arizona State University Tempe campus floor plans as a dataset including 29 sheets of size 3400 × 2200 pixels. During the data preprocessing step, each sheet is randomly cropped into 800 × 800 pixels 100 times. The annotations are manually labeled, including walls, left single doors, right single doors, double doors, and columns. The cropped images were fed into both object detection and instance segmentation algorithms to predict the location of instances. To reconstruct the 3D model in Revit 2022, the requirements for building each category are referenced in the Revit API 2022 document. Based on the Revit API 2022 document, a detailed procedure is provided for post-processing both object detection and instance segmentation outputs when transforming 2D floor plans into 3D building models as the concept of interoperability. Besides the statistical model evaluation, the detection and segmentation models are compared, and failure cases are discussed.
This paper is arranged as follows: Section 2 illustrates the related work, including processing 2D floor plans using deep learning and different approaches for 3D model generation. Section 3 describes the details of the methodology, including data creation, model training, and detailed post-processing algorithms to generate 3D models. Section 4 shows the performance metric of object detection and instance segmentation models and the 3D reconstruction model visualization. This section also includes a discussion of failure cases and future works. Section 5 indicates the conclusion of this paper. The main contribution of this work is as follows:
  • Propose a comprehensive post-processing workflow for refining object detection and instance segmentation outputs to generate 3D models.
  • Explore and present the considerations involved in choosing between object detection and instance segmentation for recognizing building systems. Additionally, examine instances of object recognition failures and their consequences on interoperability with modeling software.
Implications
  • Provide possible post-process algorithms to facilitate interoperability between neural networks and 3D modeling software.
  • The team’s developing machine learning systems will be able to perform resource allocation more effectively, understanding the tradeoff between data labeling effort and building component recognition capabilities and affordances.
  • Inform human-in-the-loop automated modeling quality control checklists.
The research domain of this paper combines elements of computer vision with the field of architectural component digitalization, specifically focusing on how deep neural networks can interoperate with 3D modeling software in the architectural context.

2. Related Work

2.1. Processing 2D Floor Plans Using Object Detection and Instance Segmentation

Deep learning is one of the machine learning algorithms that utilizes multiple layers to progressively extract higher-level features from the raw input, which is based on artificial neural networks with representation learning [9]. The deep learning algorithm is widely used in computer vision tasks to perform pattern recognition, keypoint detection, object detection, image classification, and instance segmentation on images since its capability to attain cutting-edge outcomes in computer vision tasks is proven [10]. The use of deep learning technology has been growing rapidly. Researchers have detected architectural components on 2D floor plans with bounding boxes and class labels. Park and Kim [2] proposed ensembled methods that combine data-based pattern recognition, object detection, and rule-based heuristic methods. The object detection tasks include wall junctions, openings, and room detection tasks. The wall junction is divided into 13 types, and each training data sample is less than 40 pixels. The openings class includes four types: right-handed single door, left-handed single door, double-hinged door, and window. The room detection has eight types: bedroom, restroom, entrance, balcony, stair room, closet, duck, and living room. Mishra et al. [3] detected furniture objects, windows, doors, sofas, sinks, and tables by Cascade Mask R-CNN network. They exploited and compared traditional convolution and deformation convolution methods. Some other researchers concentrate on detecting structural components. Zhao et al. [4] compared Faster R-CNN with YOLO architecture models on grid head, column, and beam detection 2D structural drawings. The result reveals that Faster R-CNN performs slightly better than YOLO based on precision, recall, and F1 score. This study detects architectural components on floor plans using the Faster R-CNN network. The detected components include walls, single doors, double doors, and columns.
Some studies identified objects on 2D floor plans using semantic segmentation. Xiao et al. [11] cropped the original 2D drawings into smaller image dimensions for feeding into a neural network model. They manually did pixel-level labeling on 300 2D drawings and implemented transfer learning from ResNet-152. This model is pretrained on the ImageNet dataset and then executed recognition and localization on five architectural components: wall, window, door, column, and stairs. Jang et al. [12] segmented doors and walls on floor plan images by DeepLabV3+ architecture [13]. To restore the output to the original size of images, they removed the final three layers, average pooling layer, fully connected layer, and softmax layer, and added five deconvolution layers. They finally generate City Geography Markup Language (CityGML) and Indoor Geography Markup Language (IndoorGML) models from the further centerline and corner detection algorithm on walls and doors. Seo et al. [14] also used the DeepLabV3+ architecture to conduct two semantic segmentation experiments. The first experiment segmented walls, windows, hinged doors, sliding doors, and evacuation doors on architectural drawings. The second experiment segmented room, entrance, balcony, dress room, bathroom, living room, evacuation space, and pantry. Proposed applications for their work included automated 3D modeling, generating evacuation paths, calculating evacuation distance, and building energy rating analysis.
Some researchers combine the results of object detection and segmentation tasks on 2D drawings. Dodge et al. [5] first utilized fully convolutional networks (FCN) to do wall segmentation after trying different pixel strides. They used the Faster R-CNN framework to detect 6 classes on the same images and optical character recognition (OCR) to estimate room size. Kippers et al. [15] developed an approach that combined semantic segmentation with U-Net and object detection with Faster R-CNN on the floor plan. They obtained the outline of the floor plan as a contour after the semantic segmentation task. The combination of the simplified contour with object detection task result is used for arranging doors and windows. The previous studies combined the results of object detection and segmentation models to achieve the best performance of object recognition on the floor plan. On the other hand, the discussion of the differences between object detection and instance segmentation models is focused on in this study in terms of interoperability between artificial neural networks and prevailing 3D modeling software. The Fast R-CNN and Mask R-CNN models were selected for this study since they are widely used in practice and research [3,4,5,14].

2.2. Different Approaches for 3D Model Generation

3D modeling involves creating a mathematical, three-dimensional representation of an object, whether it is an inanimate item or a living entity. This is accomplished using dedicated software to manipulate edges, vertices, and polygons within a simulated 3D environment [16]. Researchers choose different 3D modeling software to reconstruct digital models from floor plans. For example, a study interested in indoor space modeling aimed to reconstruct Geography Markup Language (GML) models that could integrate, exchange, and store 3D geospatial data. Jang et al. [12] generated vector output from deploying segmentation on original floor plan images. City Geography Markup Language level of detail 2 (CityGML LOD2) and Indoor Geography Markup Language (IndoorGML) 3D data models were created automatically.
Other studies aim to create Industry Foundation Classes (IFC) files by extracting information from 2D floor plans. Ideally, IFC files enable interoperability between BIM software and facilitate communication among entities in a project. IFC files can be viewed by IFC viewer software such as DDS-CAD viewer or imported into Revit. Zhao et al. [4] detected grid head, column, and beam on drawings and got their geometry, location, and attribute information stored in the XML file. They extracted and wrote the information in the XML file into corresponding IFC entities. Lu et al. [17] preprocessed the CAD drawings to filter and extract text belonging to beams and columns using OCR. The text includes geometrical information and locations, which are outputted in Excel files. The structural components in Excel files are integrated into TXT files. The structure of TXT files is building object ID, relationship with other components, name, size, materials, local location, and global location. These TXT files are input into ifcengine to create IFC files.
Several previous works performed 3D modeling within Autodesk Revit. Yang et al. [18] reconstruct beams, slabs, and columns 3D Revit model from CAD files. The reconstruction process includes four steps by plug-in Dynamo in Revit. The authors first generated column and beam axes since the elements are defined by swept solids sweeping along a direction. They further organized the semantic information into a parameter table. The semantic information comprises axis ID, reference level, elevation, material, section height, section width, web thickness, flange thickness, and element drawing code. Finally, the semantic-rich element Revit model is constructed.
However, the detail of how to generate 3D models from manipulating and post-processing neural network outputs is missing in the previous literature. In this study, an API is being used, and perform modeling within proprietary software, rather than focusing on open-source tools such as IFC, due to its popularity in the AEC industry. This study generates the Revit 2022 model directly using the neural network output after post-processing. The information exchange between the neural network and modeling software can be more secure in this way since some information would be missing when importing the IFC files to Revit from user feedback [19,20]. However, the open-source tools are as essential as commercial software, so how the proposed workflow can be integrated with tools, such as Blender 3.6, is demonstrated. Blender 3.6 is a free and open-source 3D software that can generate animated videos, 3D applications, video games, virtual reality, etc. BlenderBIM v0.0.230902 is an add-on of Blender 3.6 that supports the BIM model creation with the IFC format.

3. Methodology

This section covers the data generation process, neural network training, inference, post-processing, and 3D model reconstruction in Revit 2022 for both object detection and instance segmentation tasks, as shown in Figure 1.

3.1. Data Creation

In this study, 2D architectural drawings of Arizona State University Tempe campus buildings were provided by the University Facilities Management department. The dataset comprised AutoCAD files along with their corresponding PDF counterparts. The 29 of these PDF files were transformed into JPG format, each with dimensions of 3400 × 2200 pixels, constituting the original dataset. This original dataset was then split into a training set of 21 sheets and a validation set with 8 sheets. To conduct supervised learning tasks, the dataset was annotated using the LabelMe annotation tool [21]. The annotation process involved determining the class taxonomy and annotation format and technique.
In this paper, the taxonomy of classes includes single left-hand doors (L door), single right-hand doors (R door), double doors, walls, and columns. After annotating all classes, the entire dataset included 596 left-hand door instances, 555 right-hand door instances, 283 double-side door instances, 6722 wall instances, and 485 column instances. Based on the quantity of each class, it can be seen there are more than ten times as many wall instances as any other class instances. To solve this imbalanced data classification problem, the common data-based methods were not selected, i.e., over-sampling the rare classes or under-sampling overrepresented classes. Instead, to avoid covariate shift, an ensemble of multiple models was executed to boost the performance of prediction [22].
Object detection classifier 1 and instance segmentation classifier 2 were each two-model ensembles, as shown in Figure 2. The first model of each ensemble was trained on Training Subset 1. This subset was comprised of only wall instances from the entire training set, as shown in Figure 3b. The second model of each ensemble was trained on Training Subset 2. This subset was comprised of all object instances except wall instances, as shown in Figure 3c.
Two different annotation techniques for object detection and instance segmentation were used. For the object detection task, each object instance on each drawing sheet with a bounding box and a class label was identified. For wall and column instances, the bounding box encompassed the entire object symbol. For door instances, the wall opening was included but excluded the door swing portion of the symbol, as shown in Figure 4a. This format for the door annotations was chosen to make the step of converting the bounding box into a door during digital model reconstruction more convenient. For the instance segmentation task annotations, a polygon was drawn surrounding the wall and column instances and a rectangle for door instances encompassing the wall opening but excluding the door swing portion of the symbol, as shown in Figure 4b. The blue arrows in Figure 4a show the circumstances with different styles of annotations between object detection and instance segmentation.
Each sheet with 100 crops of 800 × 800 pixels was randomly sampled without scaling, as shown in Figure 5, and the object annotation positions were recomputed to the local crop coordinates. After this random cropping process, a JSON file was generated for each crop. The JSON files were organized into the required sets to prepare for model training, as defined in Figure 2.

3.2. Object Detection and Instance Segmentation Model Training

The first steps of doing model training were selecting a programming language, deep learning libraries, a programming environment, and neural network architectures. Python with Detectron2 library [23], a Pytorch 1.8 -based modular library, on Visual Studio Code 2022 and NVIDIA RTX A4000 GPU processor were used (NVIDIA, Santa Clara, CA, USA). To choose neural network architectures, state-of-the-art computer vision algorithms, such as YOLO and SOLO, were not used since exploring the possible failure cases industry practitioners would encounter is the purpose of this study. This study could be more informative if the selected models were widely used in practice. As a result, the Faster R-CNN model architecture for object detection and the Mask R-CNN model architecture, for instance, segmentation, were selected. The hyperparameters used for training include 0.001 learning rate, 64 batch size, and 58 epochs.

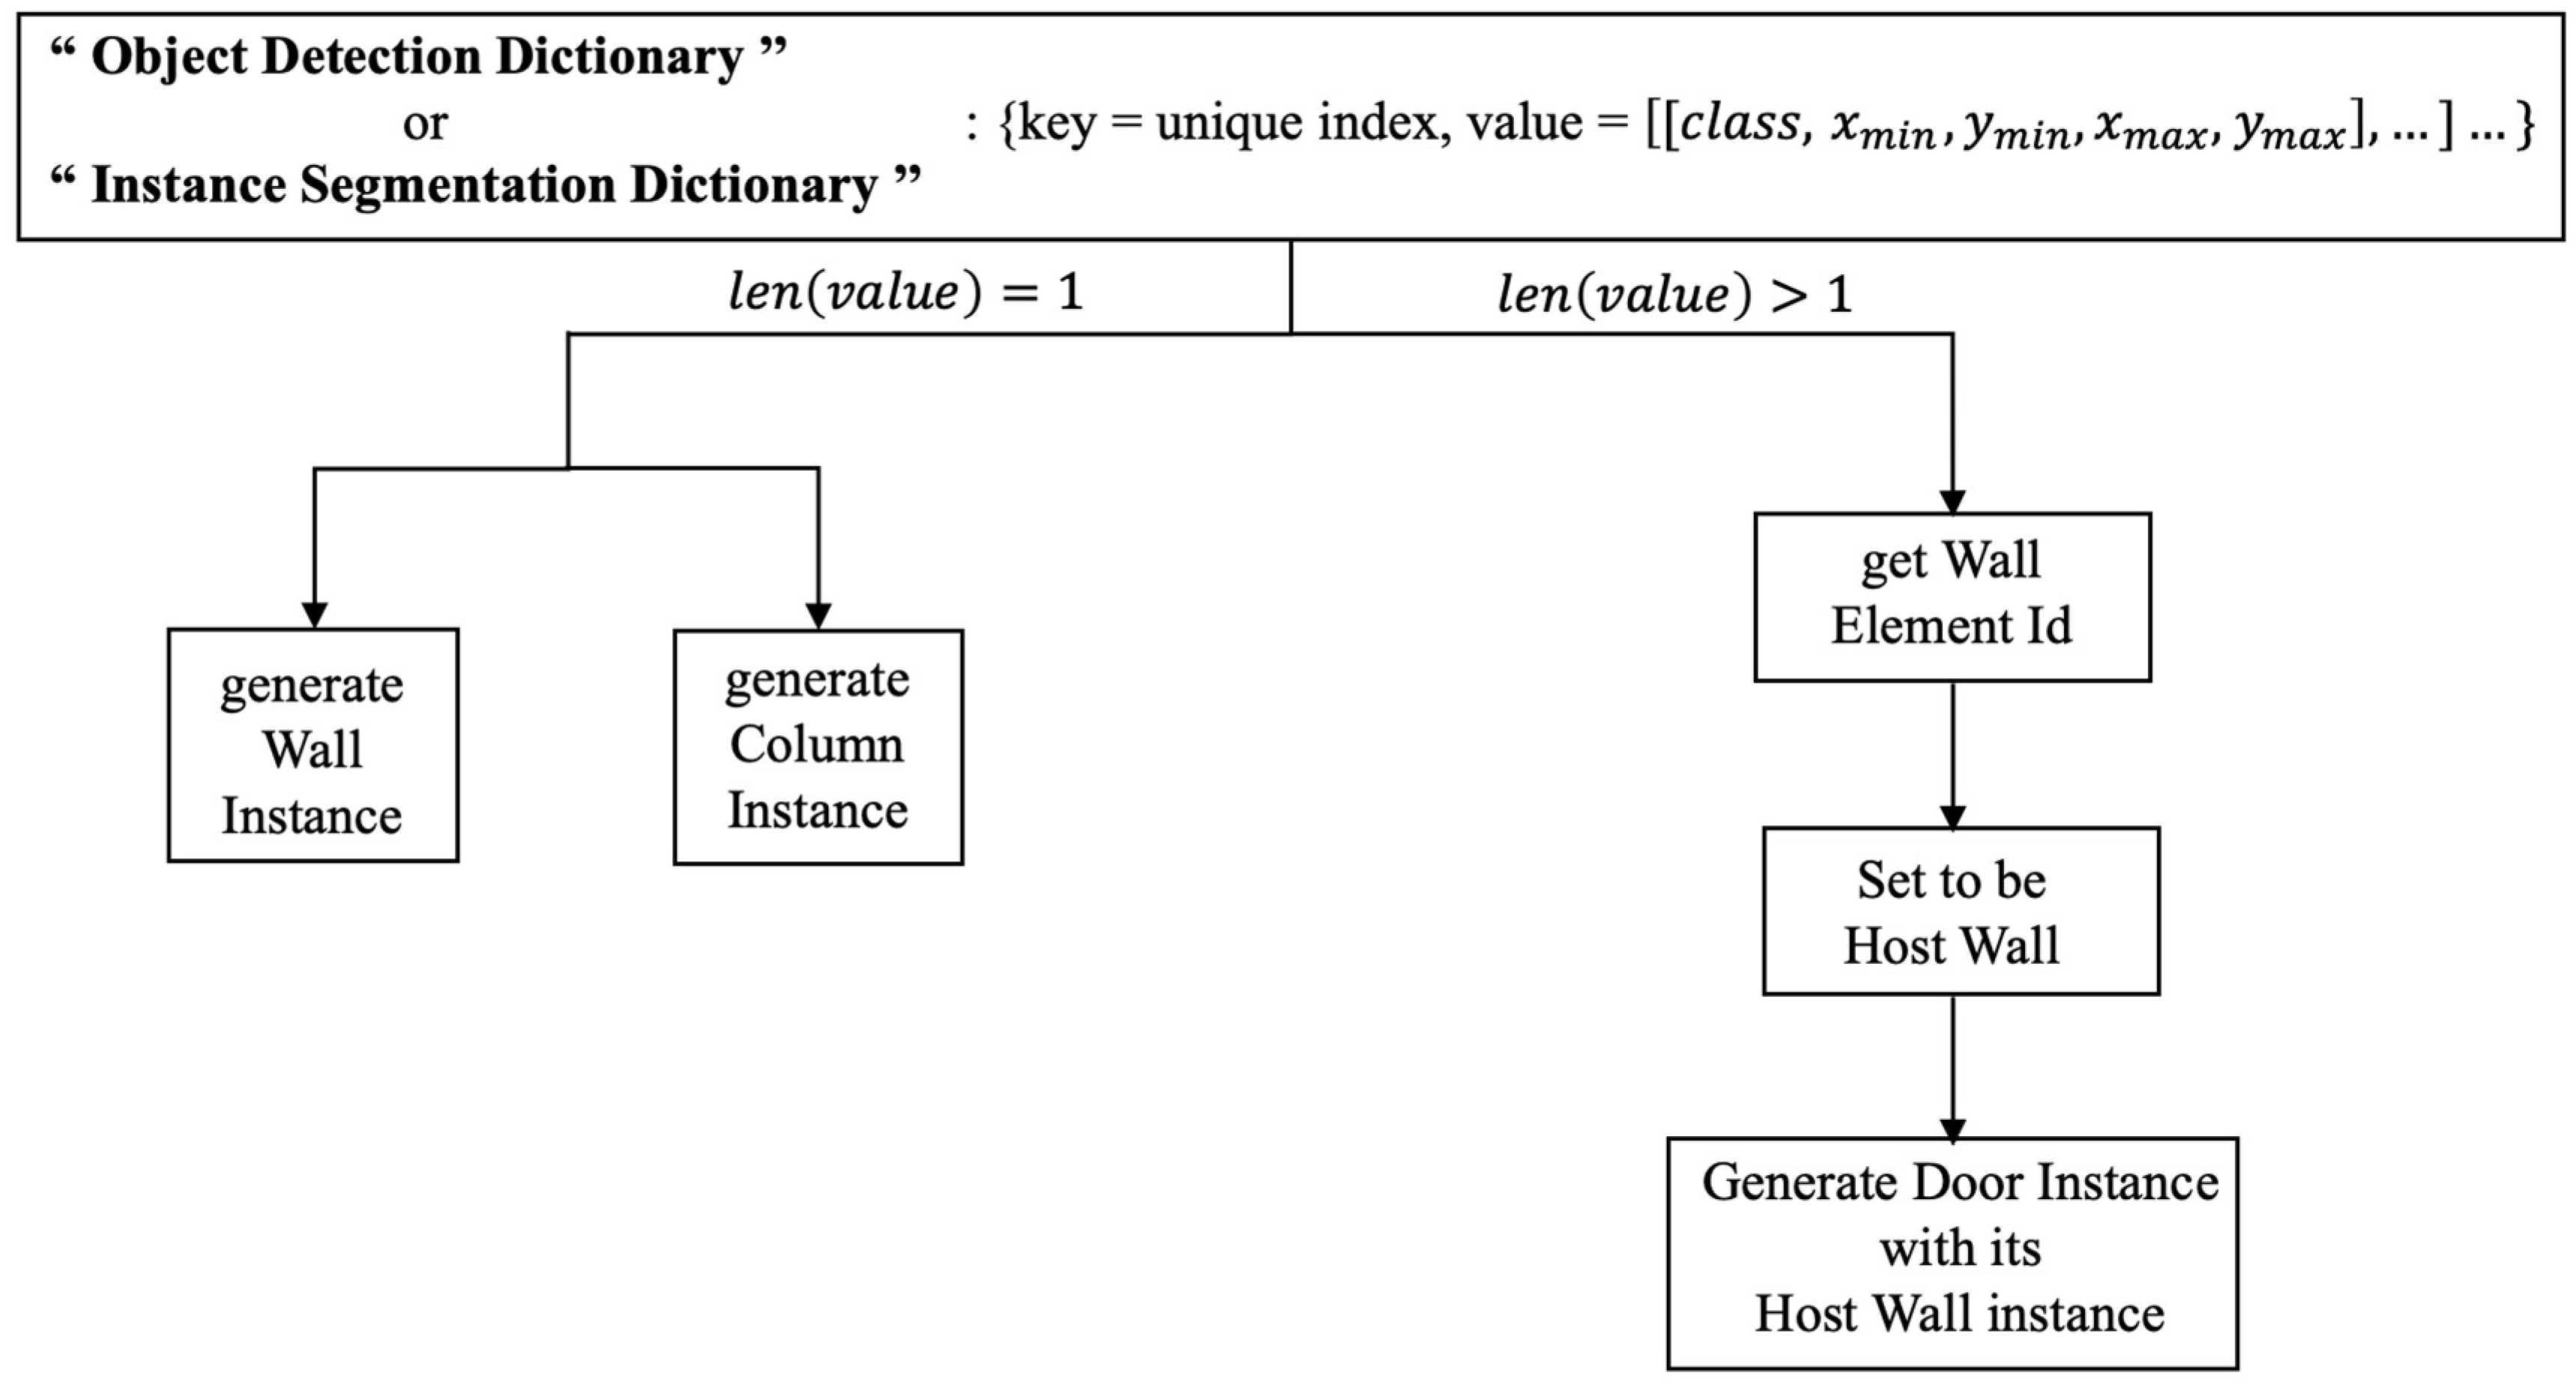
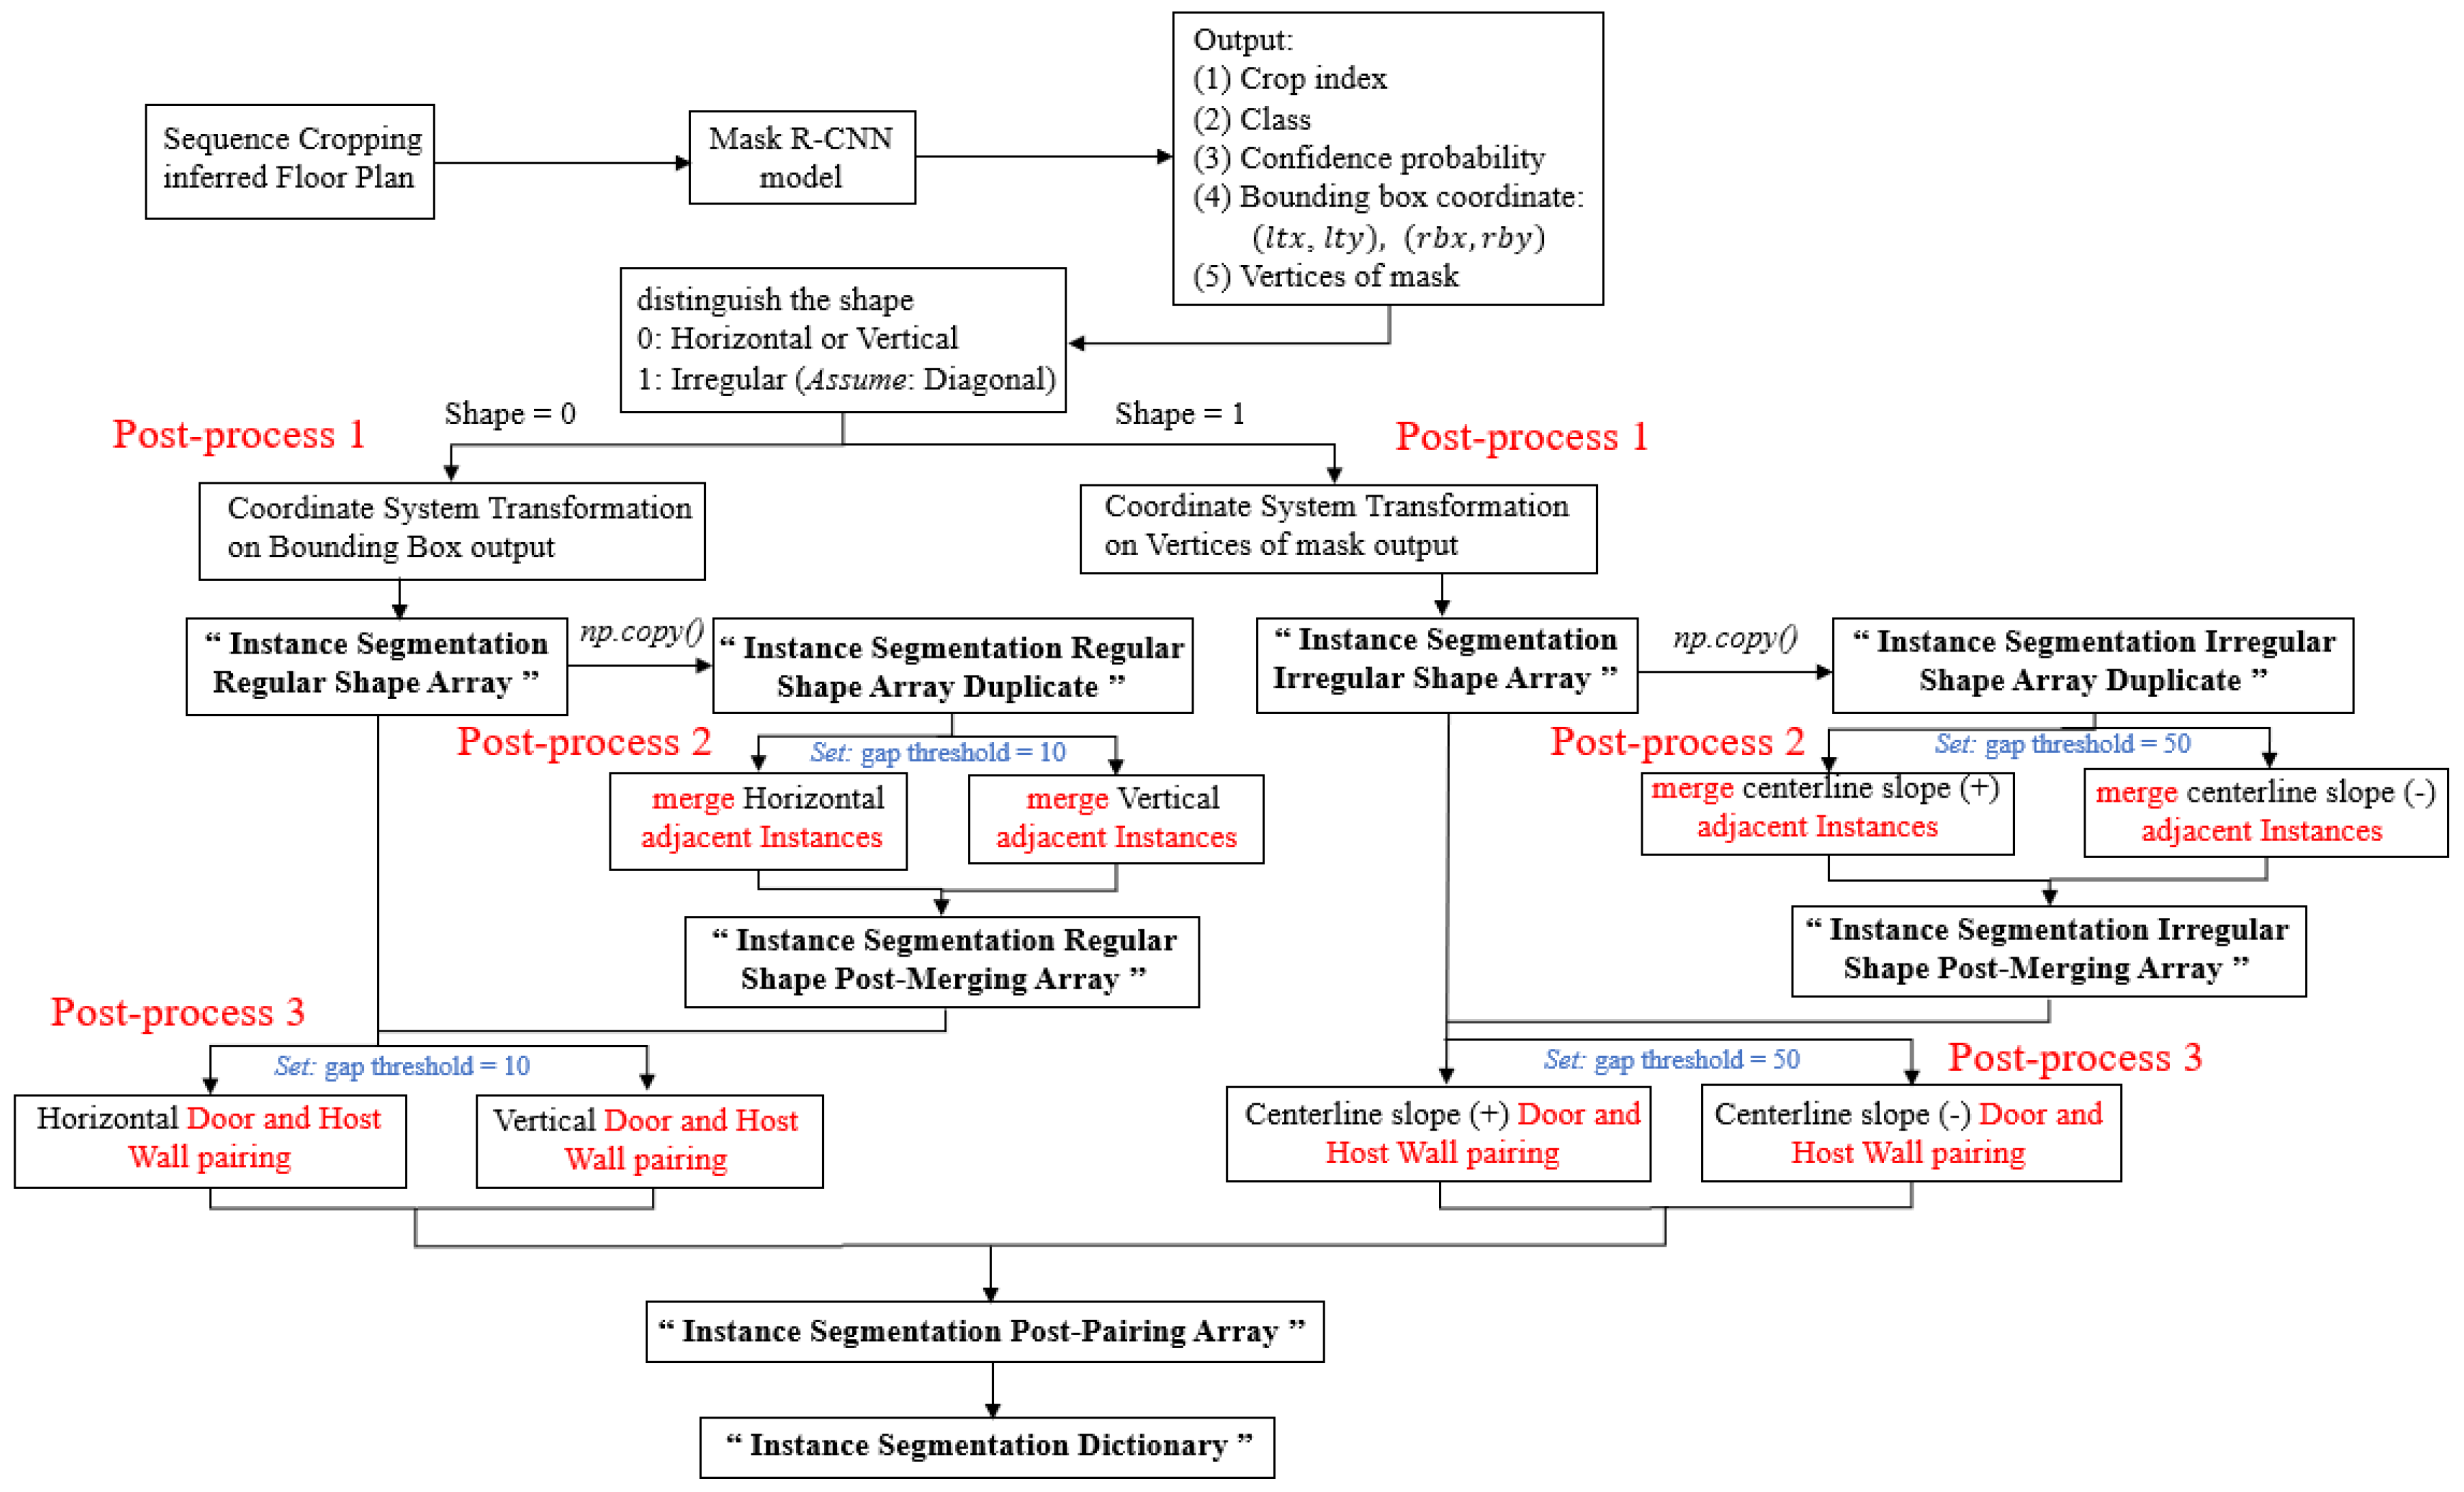
3.3. Object Detection Inference and Post-Processing

After getting the Faster R-CNN trained model, object detection inference on the new 2D floor plan was executed. The detection model output the class and bounding box information of each predicted instance. Three post-processing steps were then conducted to create 3D models, as shown in Figure 6. The post-processing steps include coordinate system transformation, merging adjacent instances, and pairing door and host wall. For the detailed pipeline, please refer to Figure A1.
To perform model inference on a new floor plan, each drawing was partitioned into 800 × 800 pixels crops in a sliding window sequence, as shown in Figure 7. This cropping was necessary to match the data input size formatting requirement of the deep learning algorithms that were set during the training process. The inference on each crop was run using the trained Faster R-CNN model(s) outputting (1) crop index (the number inside each crop in Figure 7), (2) class, (3) confidence probability, (4) bounding box coordinates, top left corner, and bottom right corner coordinates.

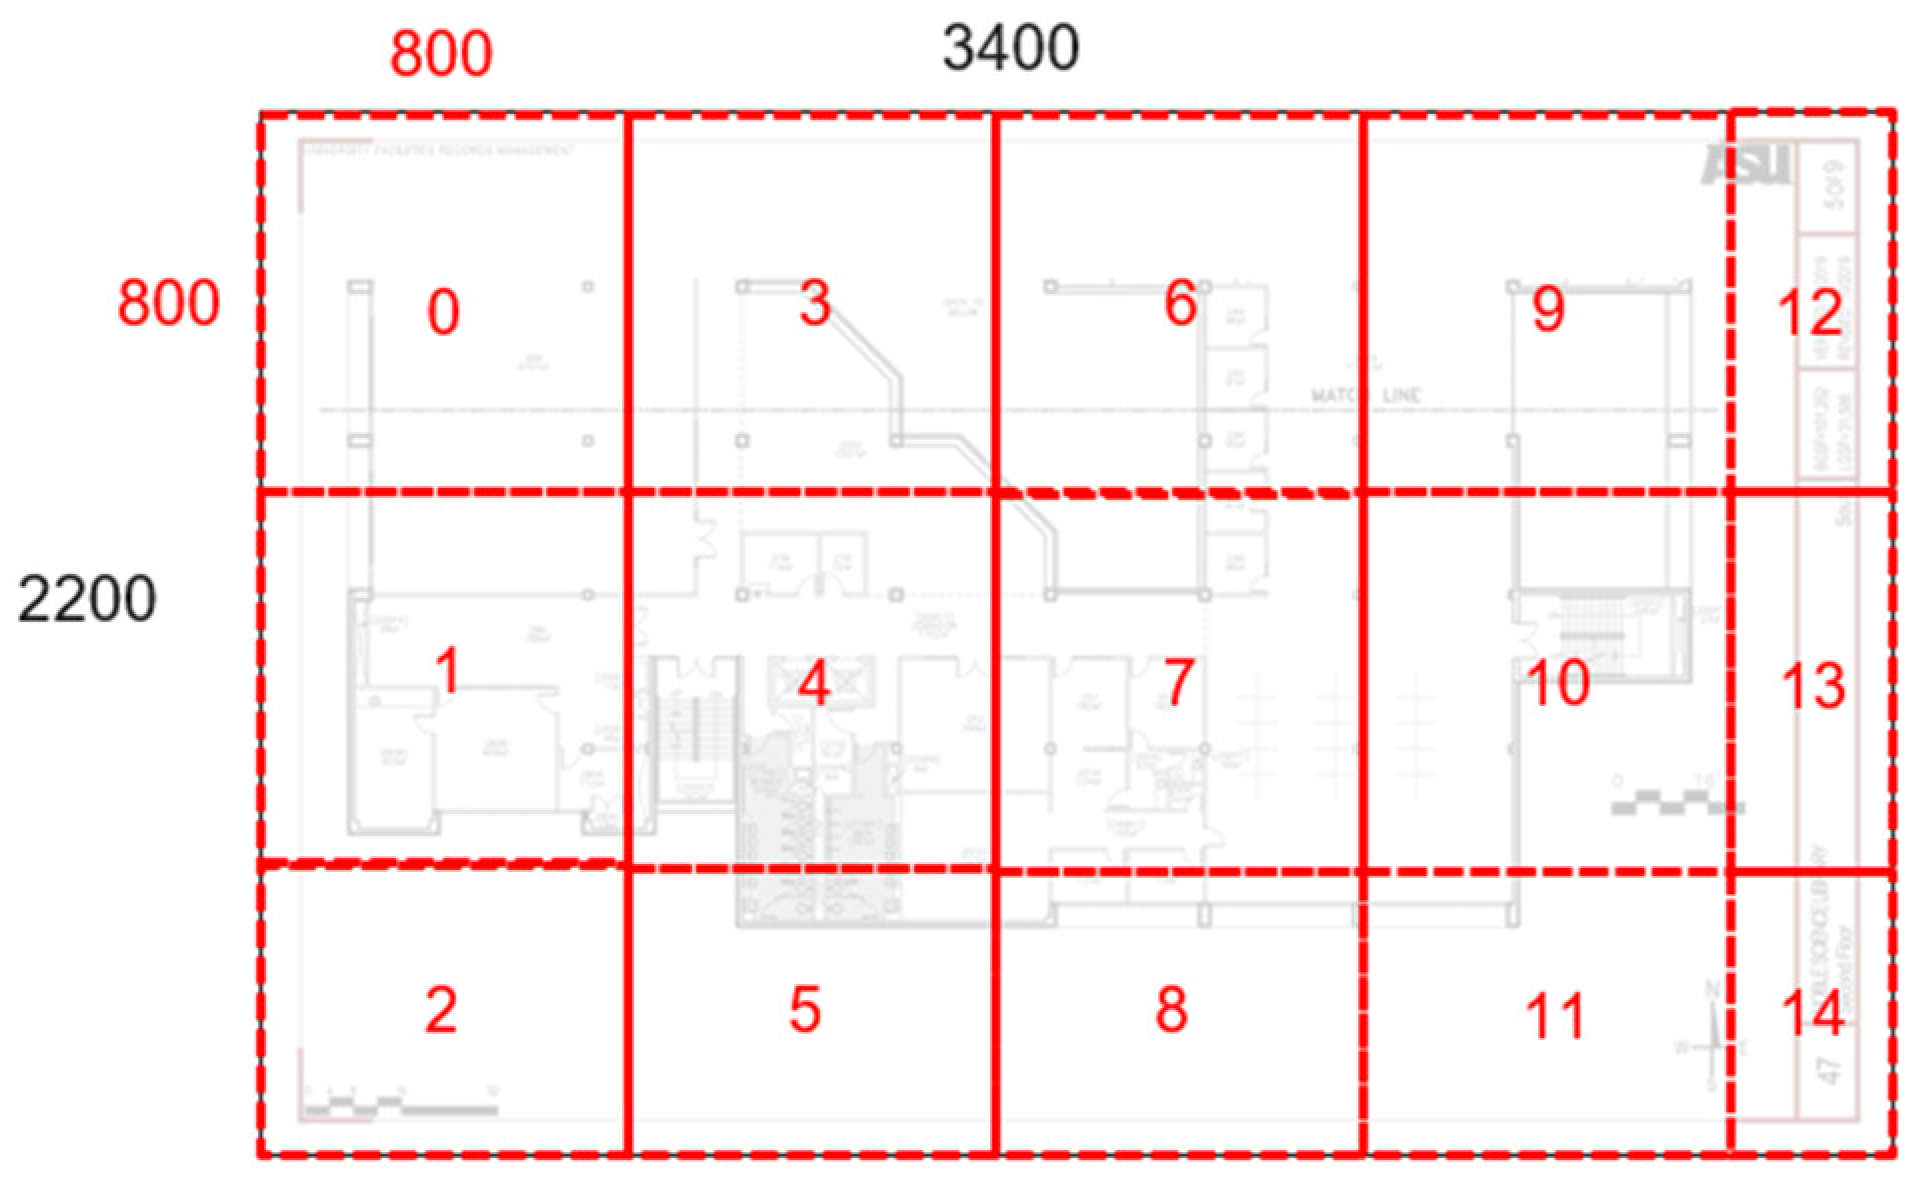
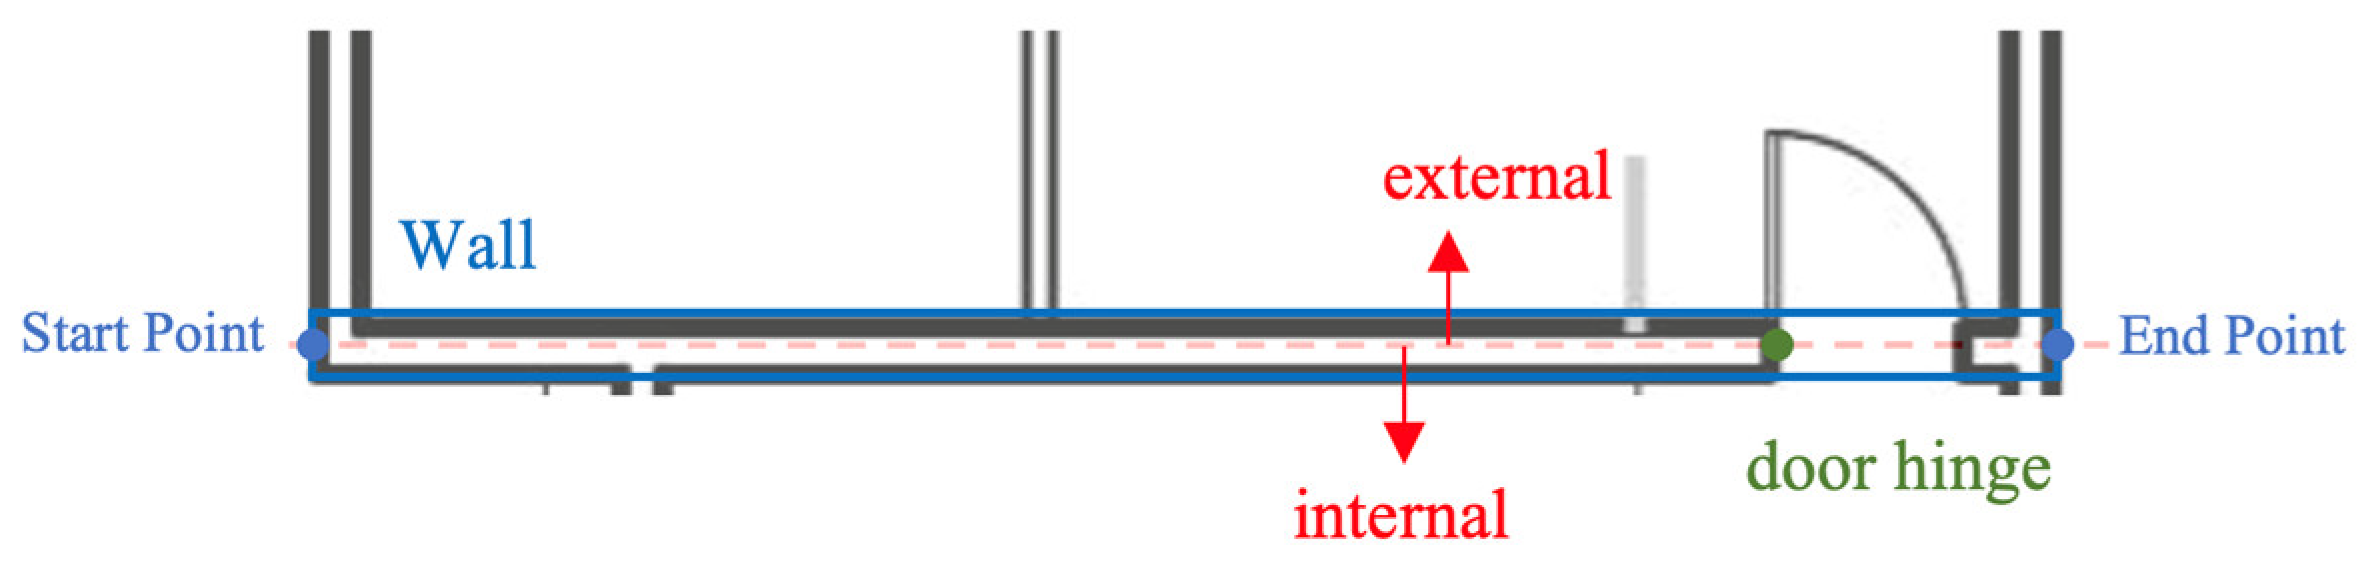
3.3.1. Post-Process 1: Coordination System Transformation

The first step of post-processing the inference output was to transform the bounding box outputs from local crop coordinates to global sheet coordinates, as shown in Figure 8.

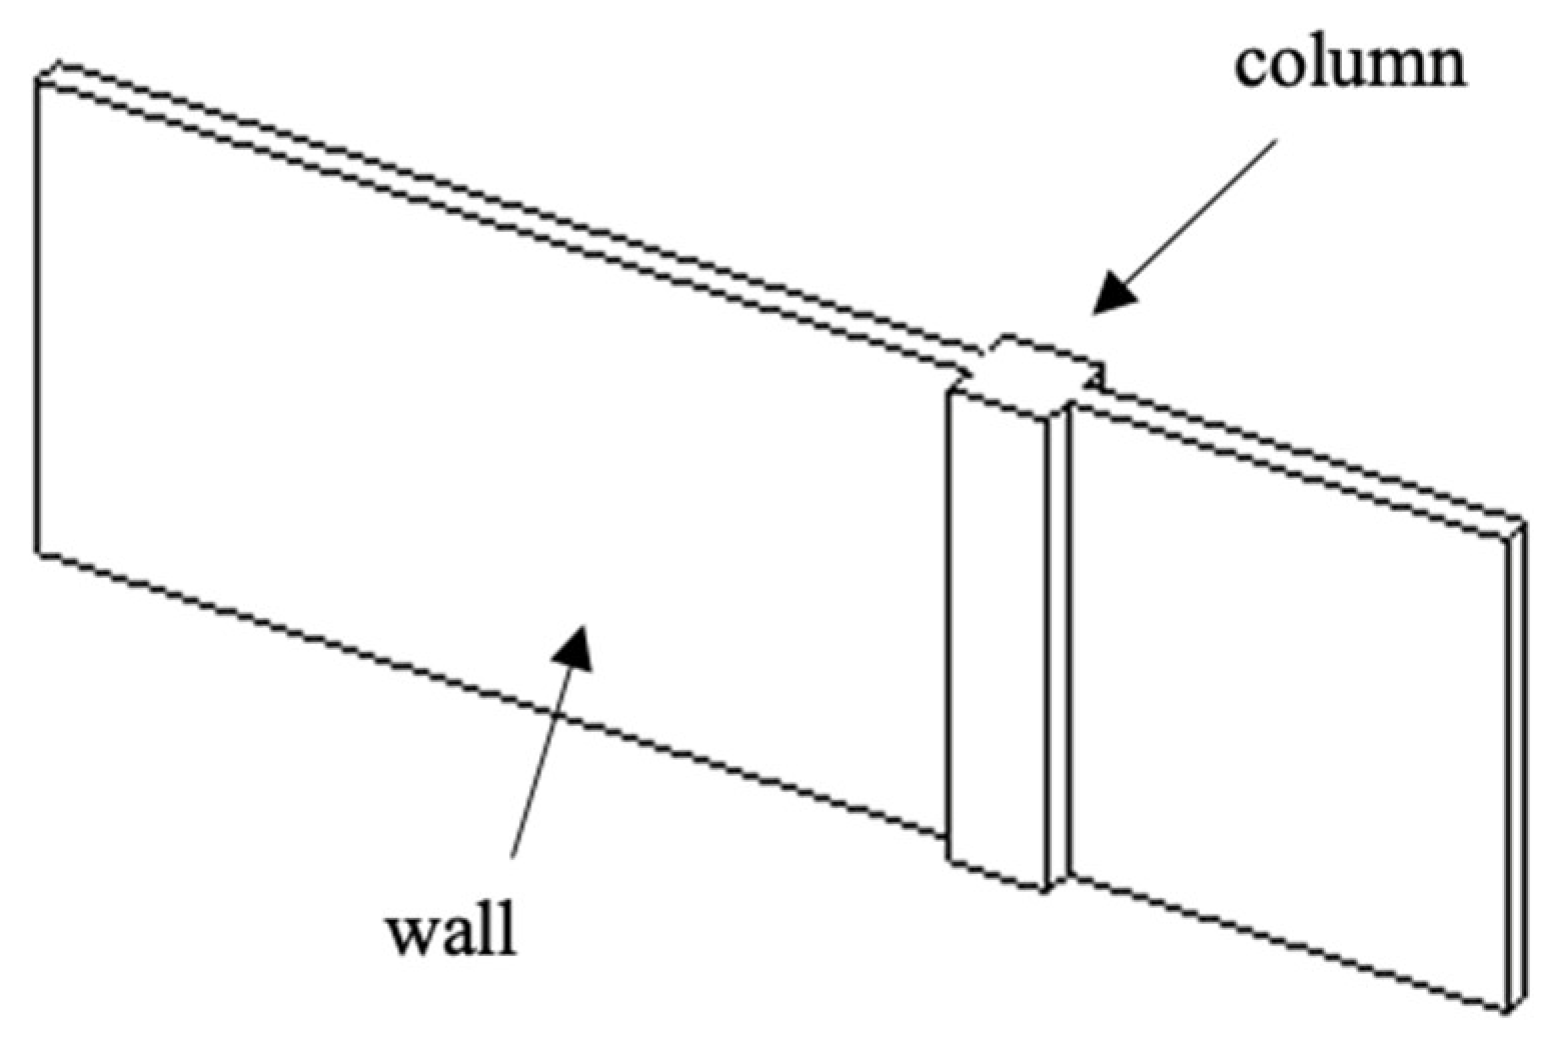
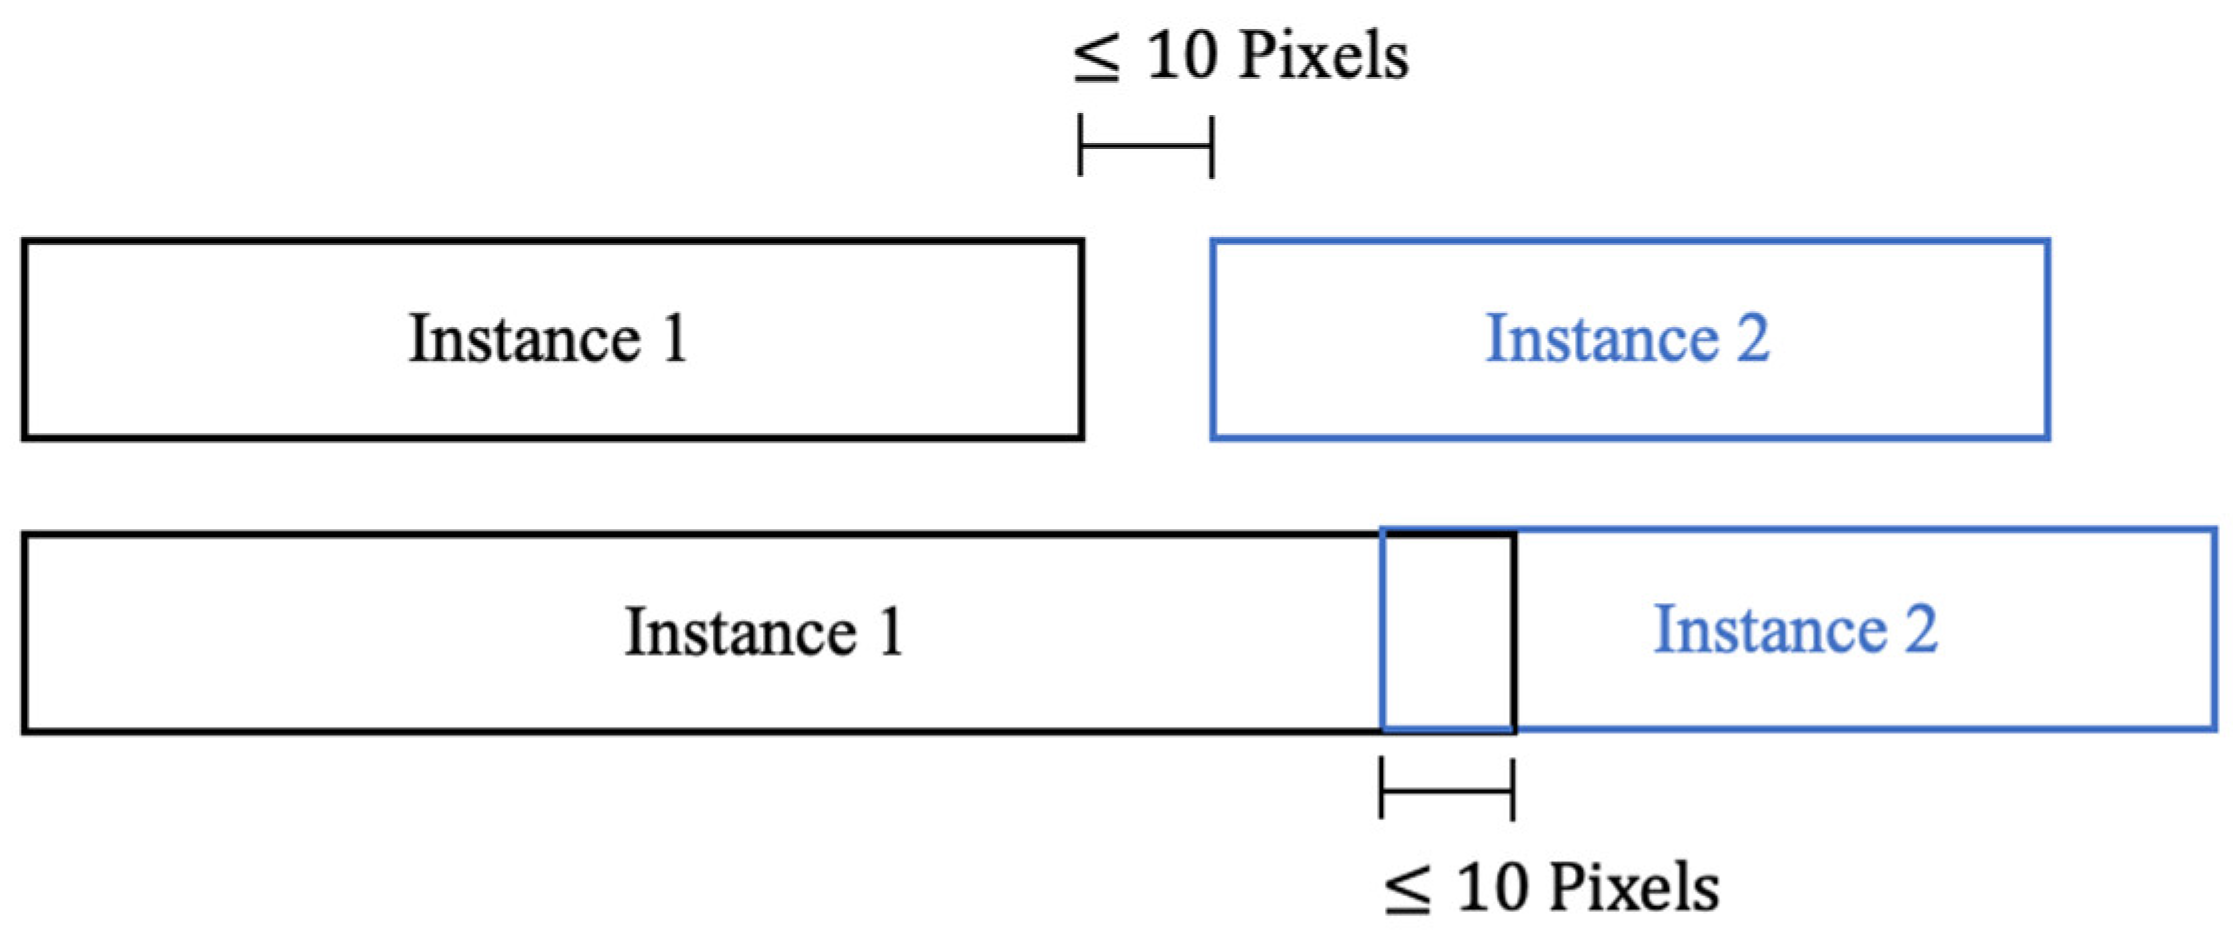
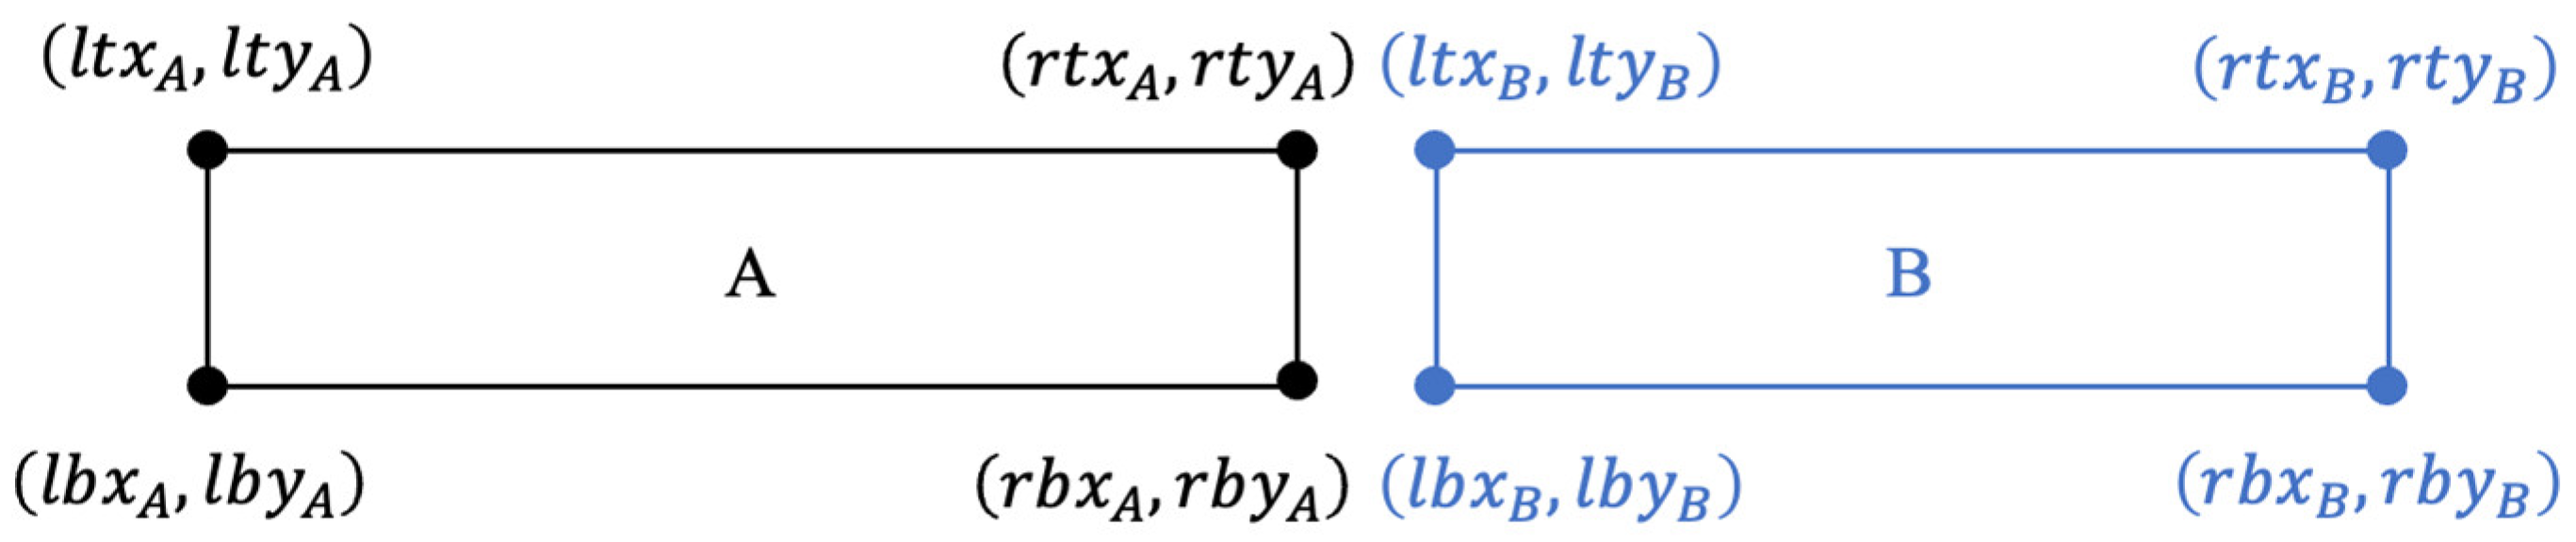
3.3.2. Post-Process 2: Merging Adjacent Instances

The useful information was aggregated from the neural network output in an array so that it could be used for 3D reconstruction. Each instance inference is represented as a 1-D array with 10 values: (1) unique index, (2) class, (3) l t x , (4) l t y , (5) l b x , (6) l b y , (7) r t x , (8) r t y , (9) r b x , (10) r b y . The r b x represents x coordinate of the right bottom corner, l t x represents x coordinate of the left top corner, l b y represents y coordinate of the left bottom corner, l t y represents y coordinate of the left bottom corner, as defined in Figure 9. All instances inference arrays for all classes were assembled into a single 2D array called “Object Detection Array”. For post-processing purposes, an “Object Detection Array Duplicate” copied from “Object Detection Array” was created.
The requirements of 3D reconstruction in Revit 2022 for each class should be identified. The requirements were determined by the functions in Revit API 2022 Docs that were used. There are three kinds of reconstruction processes. The first one is to reconstruct wall instances that do not have any embedded instances (e.g., doors). Equation (1) is used to reconstruct the wall instances. Secondly, to reconstruct column instances, the wall and column should be modeled separately based on observation even if the column is embedded in the wall, as shown in Figure 10. Equation (2) is used to reconstruct column instances. The last one is to reconstruct the door instances which are embedded in their host walls. The host wall is reconstructed by Equation (1), and Id of the host wall is acquired from Equation (3). Equation (4) is then used to reconstruct single door or double door instances. The different door types are specified in the symbol attribute in Equation (4).
Wall.Create(document, curve, wallTypeId, levelId, height, offset, flip, structural)
Create.NewFamilyInstance(location, symbol, level, structuralType)
GetElement(wall.Id)
Create.NewFamilyInstance(location, symbol, host, level, structuralType)
The next step was merging the adjacent instances since the continuation of wall instances across crop boundaries assumption was made, Figure 11b replaced by Figure 11a. This merging step first separates the horizontal object instances from the vertical object instances. If the width of the instance is larger than its height, it is determined as horizontal and vice versa. All instances were looped through in “Object Detection Array Duplicate” and merged adjacent instances if their coordinates were within a threshold proximity, set as 10 pixels through trial-and-error. The trial-and-error process is recommended to determine the appropriate threshold for different sizes of drawings. Proximity refers to both a threshold gap and threshold overlap, as shown in Figure 12. Prior to merging the instances, the instance was checked to establish whether it had horizontal or vertical shape.
For horizontal instance A in “Object Detection Array Duplicate”, another adjacent horizontal instance B was searched on the positive direction of the x-axis with a larger x value in “Object Detection Array Duplicate”, as shown in Figure 13. There were three possible combinations of instance A and instance B, as shown in Figure 14. The proposed strategy was merging all adjacent wall and door instances on the floor plan. After merging, this post-merging instance was set as a wall instance and all door instances were placed on this wall. There were five conditions that needed to be met. First, both A and B were horizontal instances. Secondly, both A and B did not belong to the column class. Thirdly, l t x B minus r t x A was less than 10 pixels. Fourthly, l t x B was larger than l t x A . Lastly, the difference between r t y A and l t y B was less than 10 pixels.
If instance B conforming to these five requirements was found, three manipulations to A and B instances in “Object Detection Array Duplicate” were conducted. First, l t x B equal to l t x A , l b x B equal to l b x A , l t y B equal to l t y A and l b y B equal to l b y A were set, which indicates that A merged into B. Secondly, the class of instance B to be the wall class was set. Lastly, instance A in “Object Detection Array Duplicate” was removed. For the vertical instances, the horizontal merging pipeline was repeated for the vertical bounding boxes.

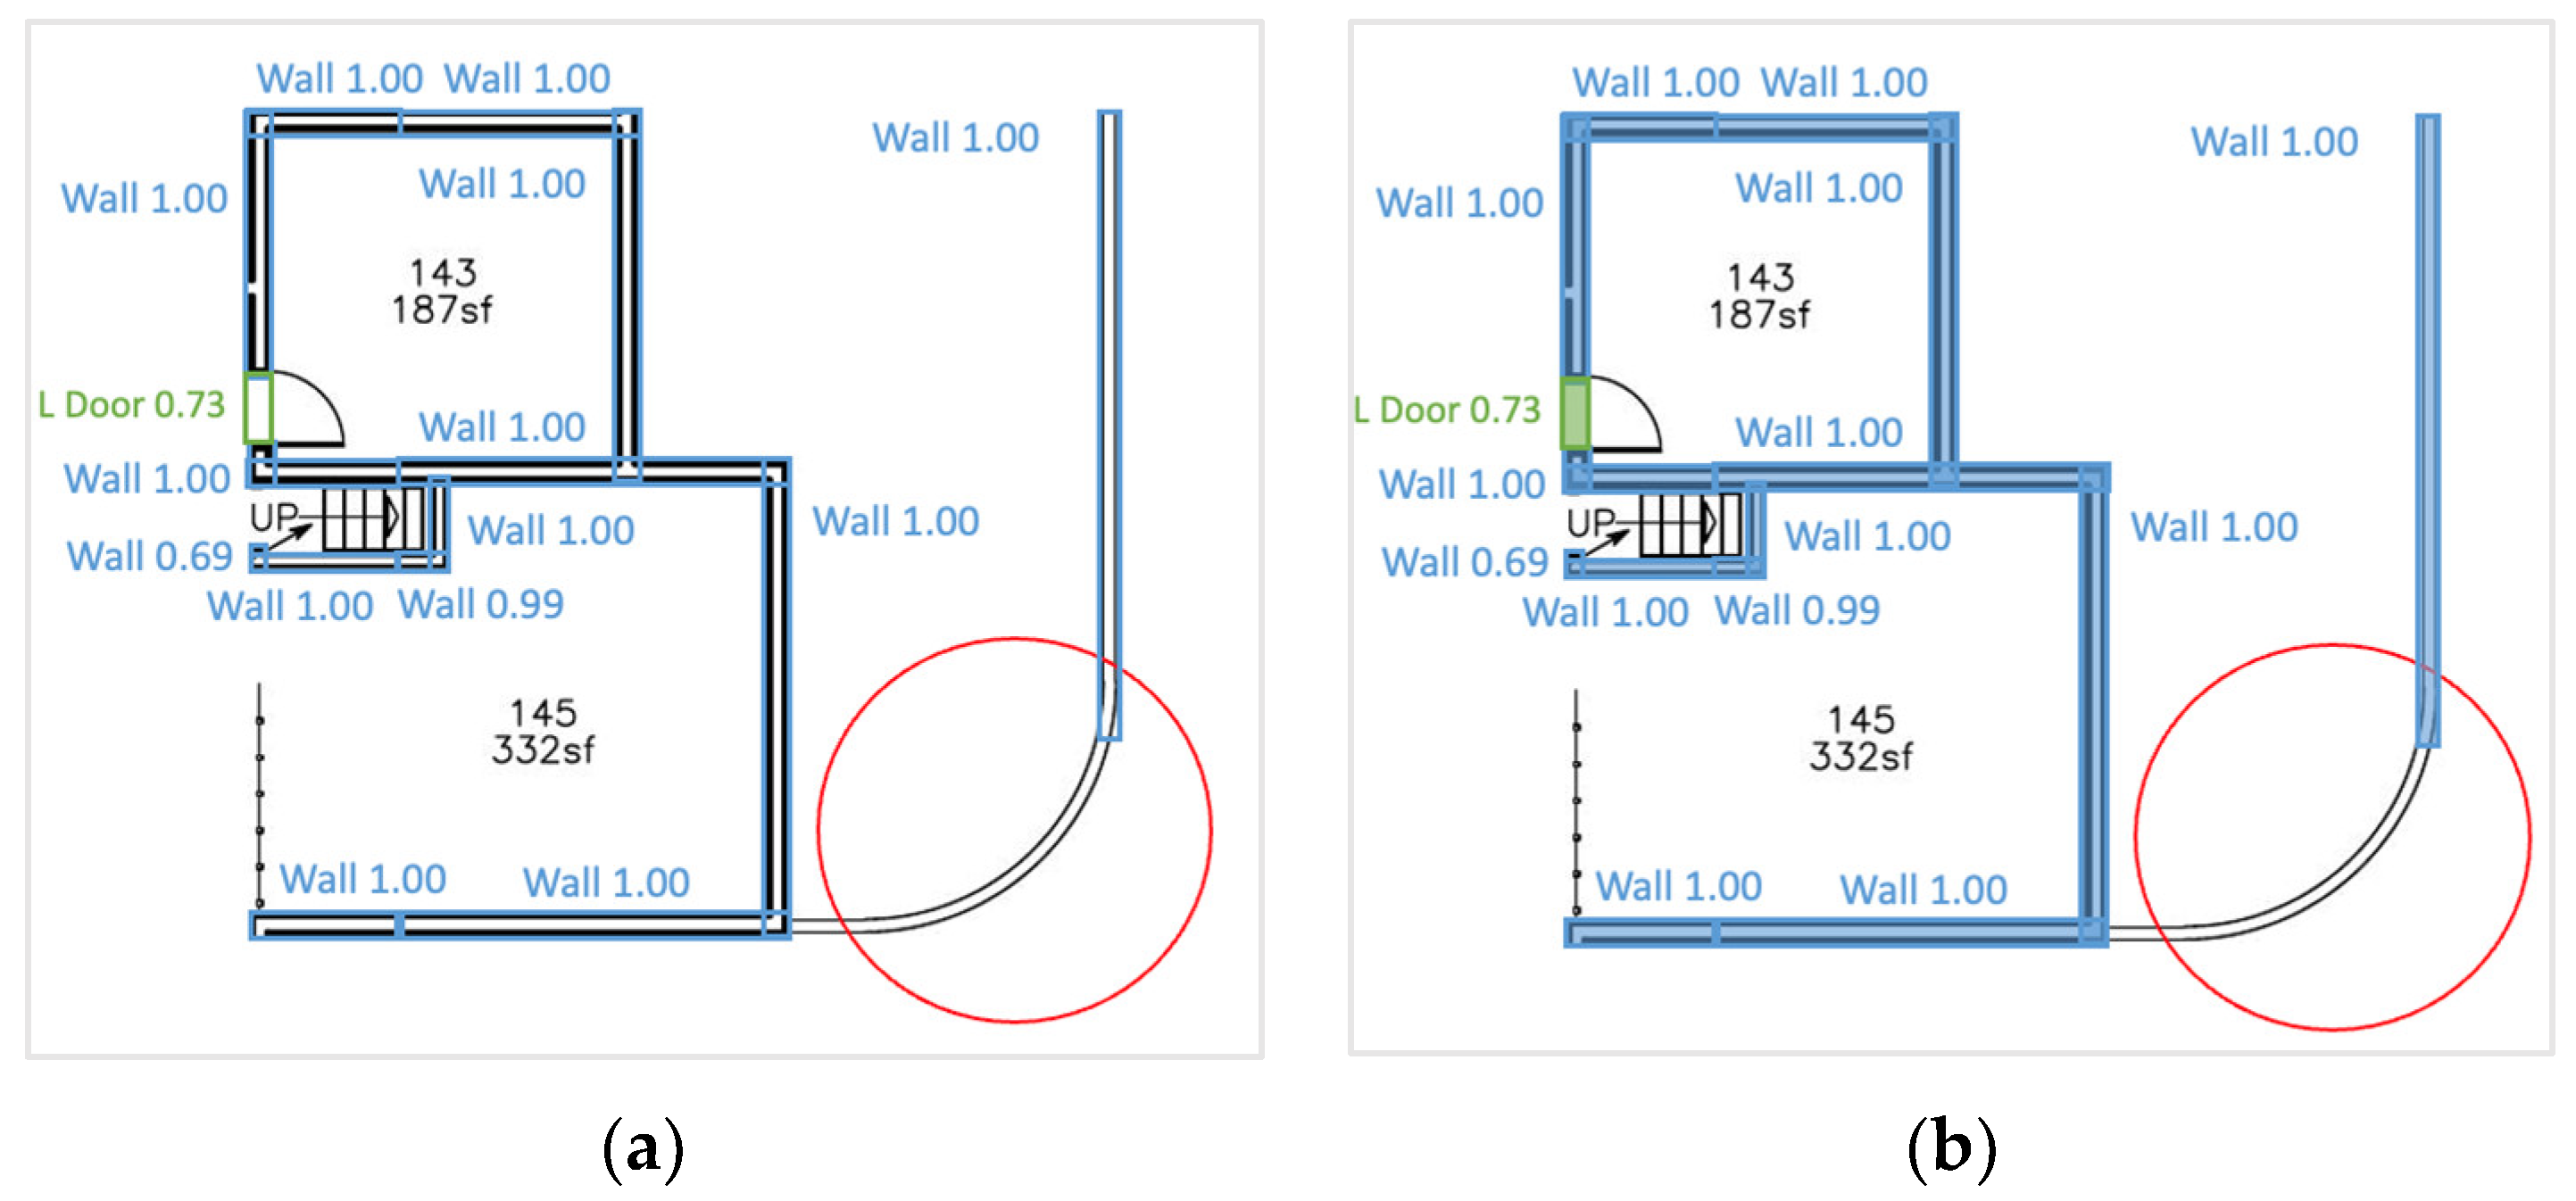
3.3.3. Post-Process 3: Pairing Door and Host Wall Instances

At this point, two arrays were held: the “Object Detection Array” and the “Object Detection Post-Merging Array”. To reconstruct door instances in Revit 2022, their host wall needed to be specified, which means each door was embedded in a specific host wall. The proposed strategy was to append the door instances from “Object Detection Array” to “Object Detection Post-Merging Array” and set the index value of the doors (unique index, the first value of the array) to be the same as their host walls so that using a dictionary can pair them by their index as key later. To conduct this strategy, all instances were looped through in the “Object Detection Post-Merging Array” for each door instance in the “Object Detection Array” and fed into either horizontal or vertical instance operation.
For horizontal door D in “Object Detection Array”, its host wall C was searched in “Object Detection Post-Merging Array”, as shown in Figure 15. There were four rules that needed to be followed. First, both C and D were horizontal instances. Secondly, instance D belonged to one of the left-hand door, right-hand door, and double door classes. Thirdly, l t x D was larger than l t x C and smaller than r t x C . Lastly, the difference between l t y C and l t y D was less than 10 pixels. If an instance C was discovered following these four criteria, two actions were taken. First, the index value of the D instance in “Object Detection Array” was set to be the same as the index value of the C instance in “Object Detection Post-Merging Array”. Next, the D instance in “Object Detection Array” was appended to “Object Detection Post-Merging Array”. For the vertical instances, the horizontal pairing pipeline was repeated for the vertical door and host wall pairs.
The last step of preparation for 3D model reconstruction was creating a dictionary. To generate this dictionary from “Object Detection Post-Merging Array”, first the coordinates of the four vertices needed to be converted to start point and end point representation, as shown in Figure 16, since these two points were offered for reconstructing every instance later. The x coordinate of the start point is represented as x m i n , which is equal to l t x for the horizontal instance and the middle value of l t x and r t x for the vertical instance. The y coordinate of the start point is represented as y m i n , which is the middle value of l t y and l b y for horizontal instance and equal to l t y for vertical instance. The x coordinate of endpoint is represented as x m a x , which is equal to r t x for horizontal instance and the middle value of l b x and r b x for vertical instance. The y coordinate of the endpoint is represented as y m a x , which is the middle value of r t y and r b y for horizontal instance and equal to l b y for vertical instance. After this conversion, a 2D “Object Detection Post-Merging Array” composed of a 1-D array for each inference instance was generated. This 1-D array contained (1) index (the door and its host wall have the same index, other instances have a unique index), (2) class, (3) x m i n , (4) y m i n , (5) x m a x , (6) y m a x .
Vertices to start point and end point representation.
Finally, a dictionary named “Object Detection Dictionary” from “Object Detection Post-Merging Array” was finalized for the following 3D reconstruction step. The key of “Object Detection Dictionary” was defined as the index in “Object Detection Post-Merging Array” and the value of “Object Detection Dictionary” was an array having (1) class, (2) x m i n , (3) y m i n , (4) x m a x , (5) y m a x .

3.4. Instance Segmentation Inference and Post-Processing

After getting the Mask R-CNN trained model, the instance segmentation inference process could be executed on the new 2D floor plan. The detection model output the class and mask information of each predicted instance. Each instance was first distinguished into horizontal, vertical, and irregular shapes based on the predicted mask. Horizontal and vertical instances were separated with irregular ones to do the following post-processing. There were three post-processing steps: coordinating system transformation, merging adjacent instances, and pairing door and host wall, which were the same as object detection inference pipeline. Finally, all post-processing results were aggregated to create 3D Revit 2022 models, as shown Figure 17. For the detailed pipeline, please refer to Figure A2.
Each drawing was cropped into 800 × 800 pixels in size in the sequence of a sliding window. Each crop was done through the inference process using the trained Mask R-CNN model(s) outputting (1) crop index, (2) class, (3) confidence probability, (4) bounding box coordinates, top left corner, and bottom right corner coordinates, (5) vertices of masks.

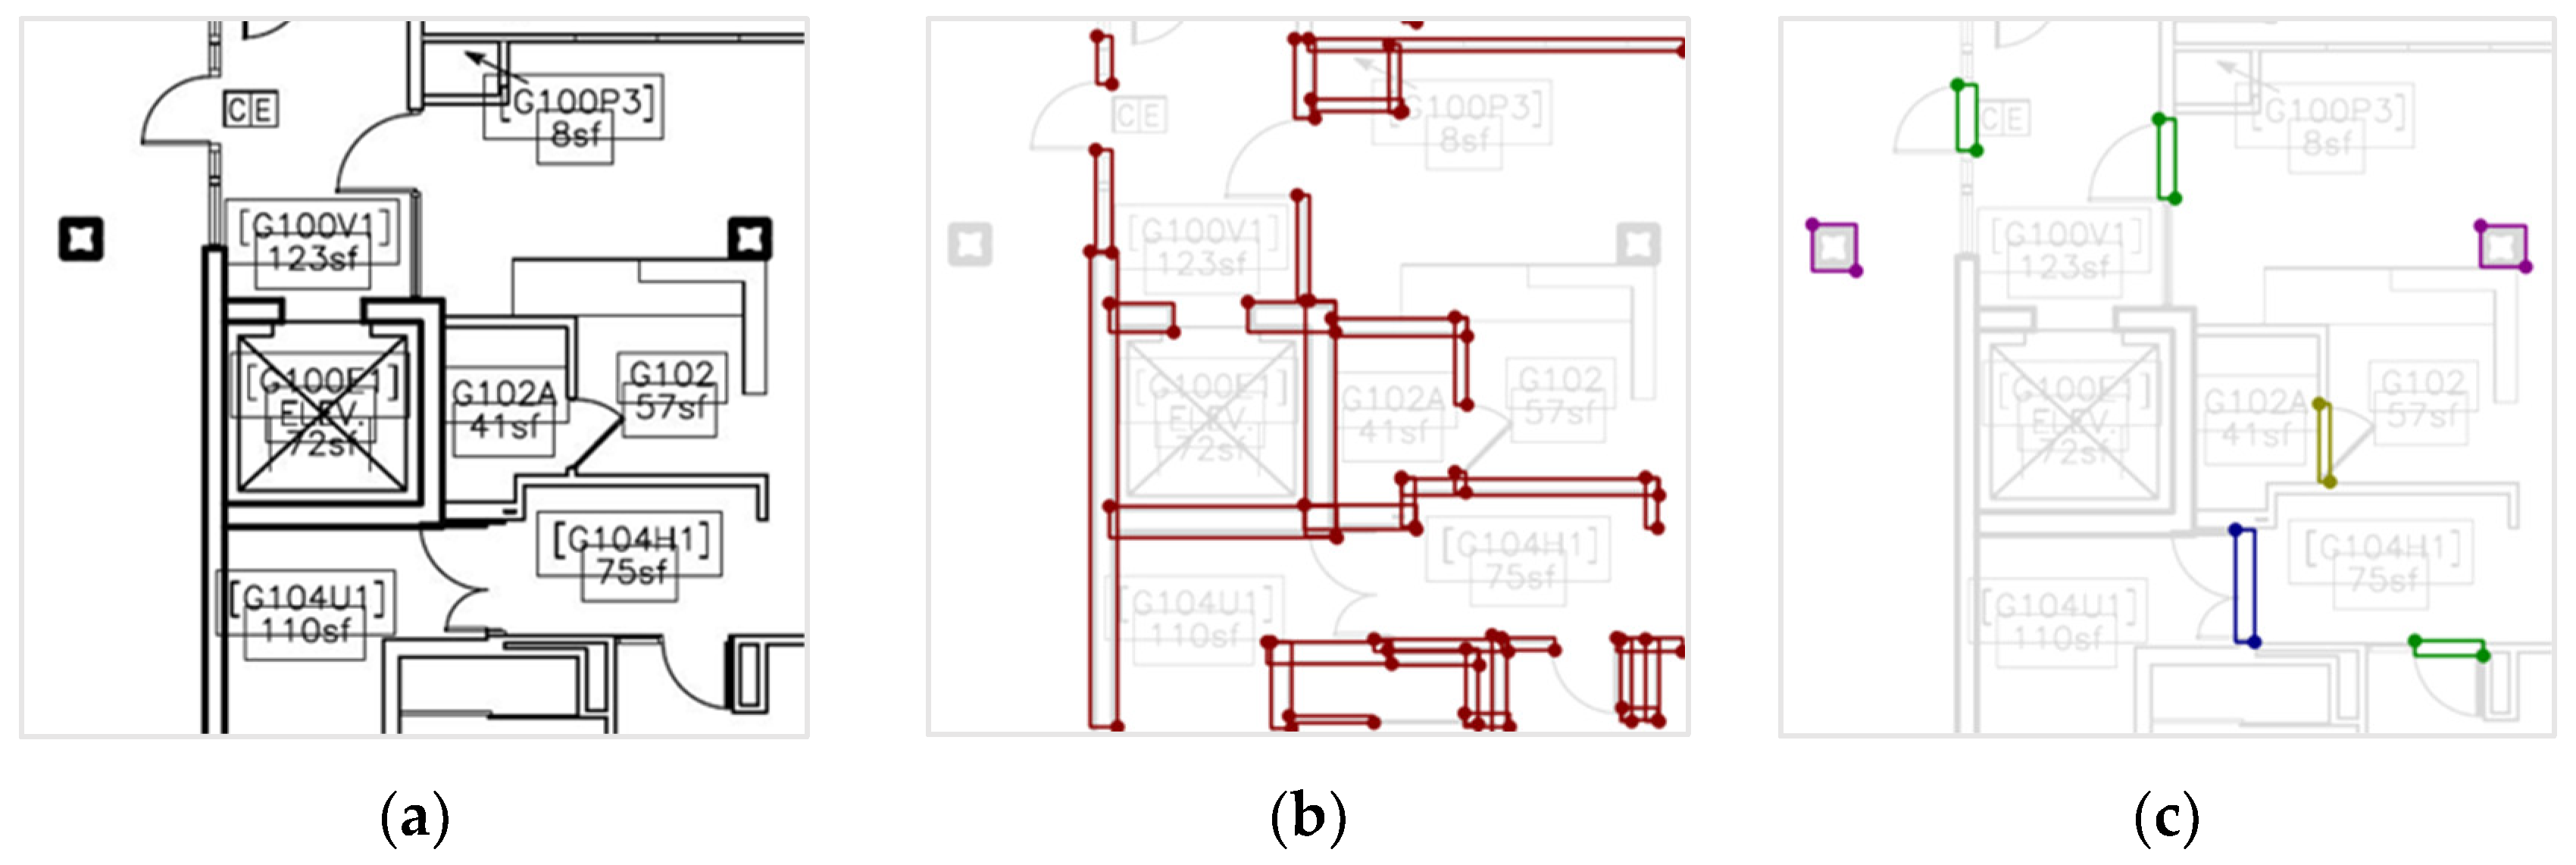
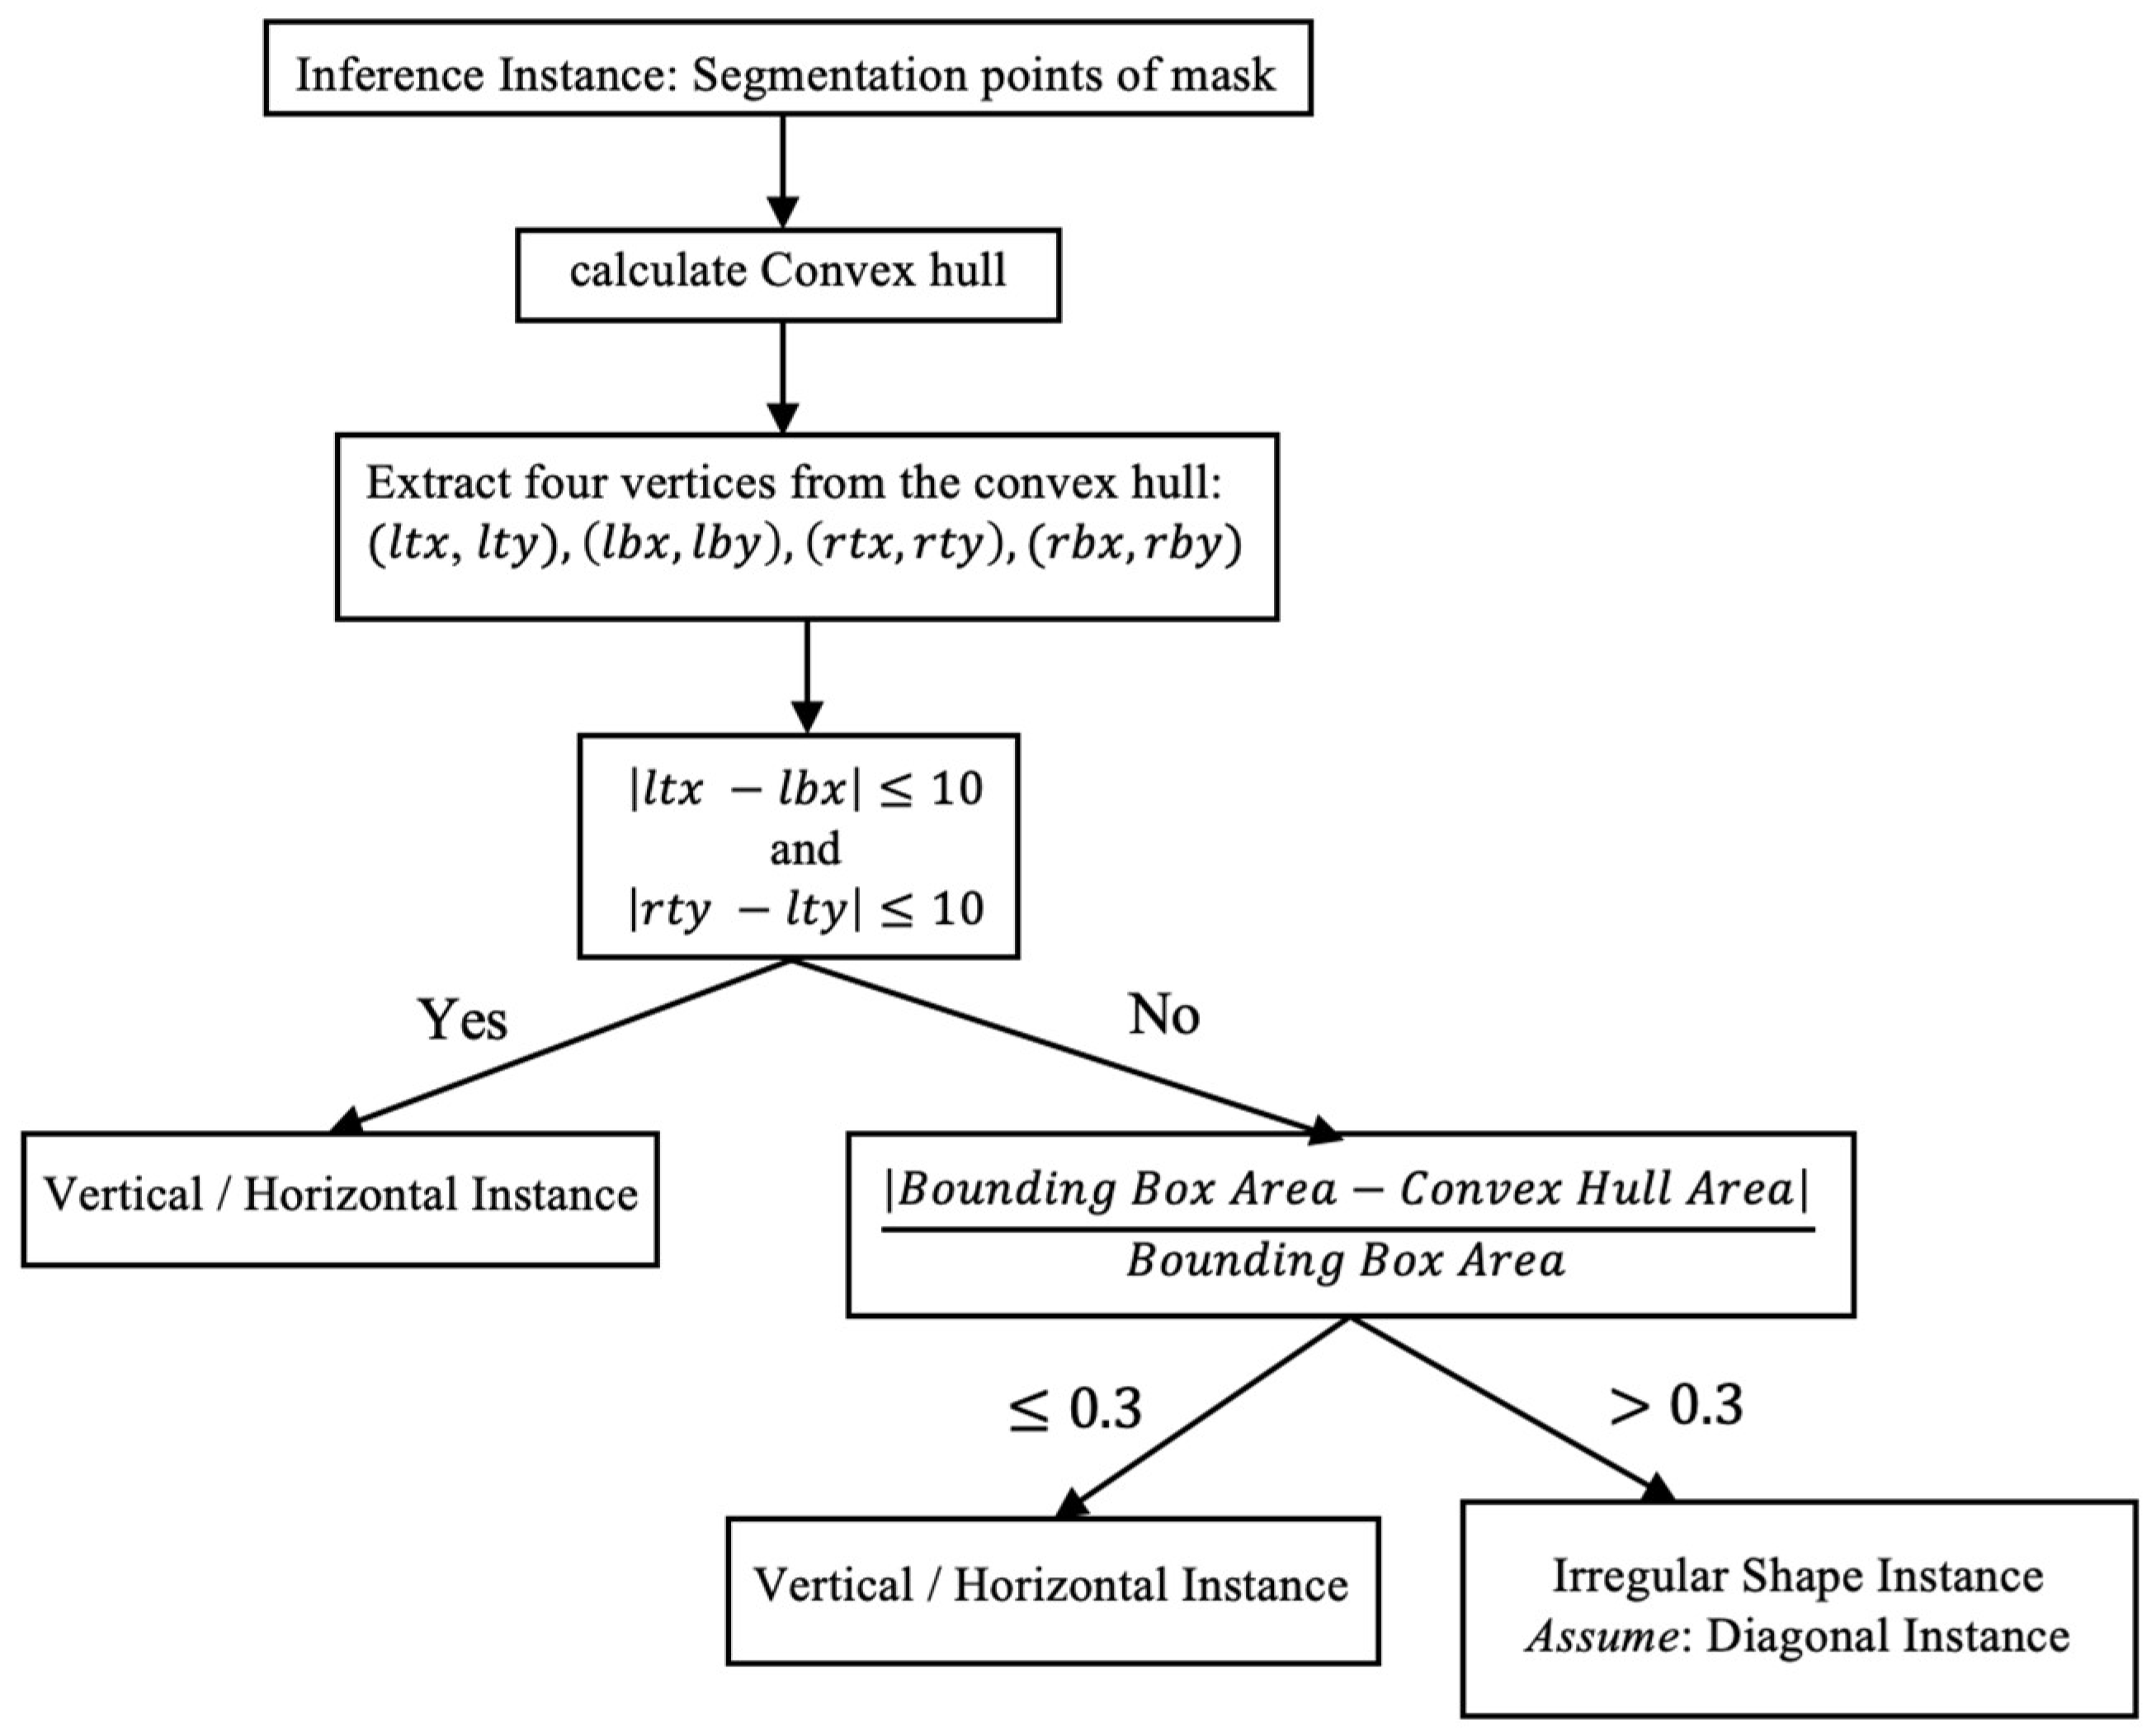
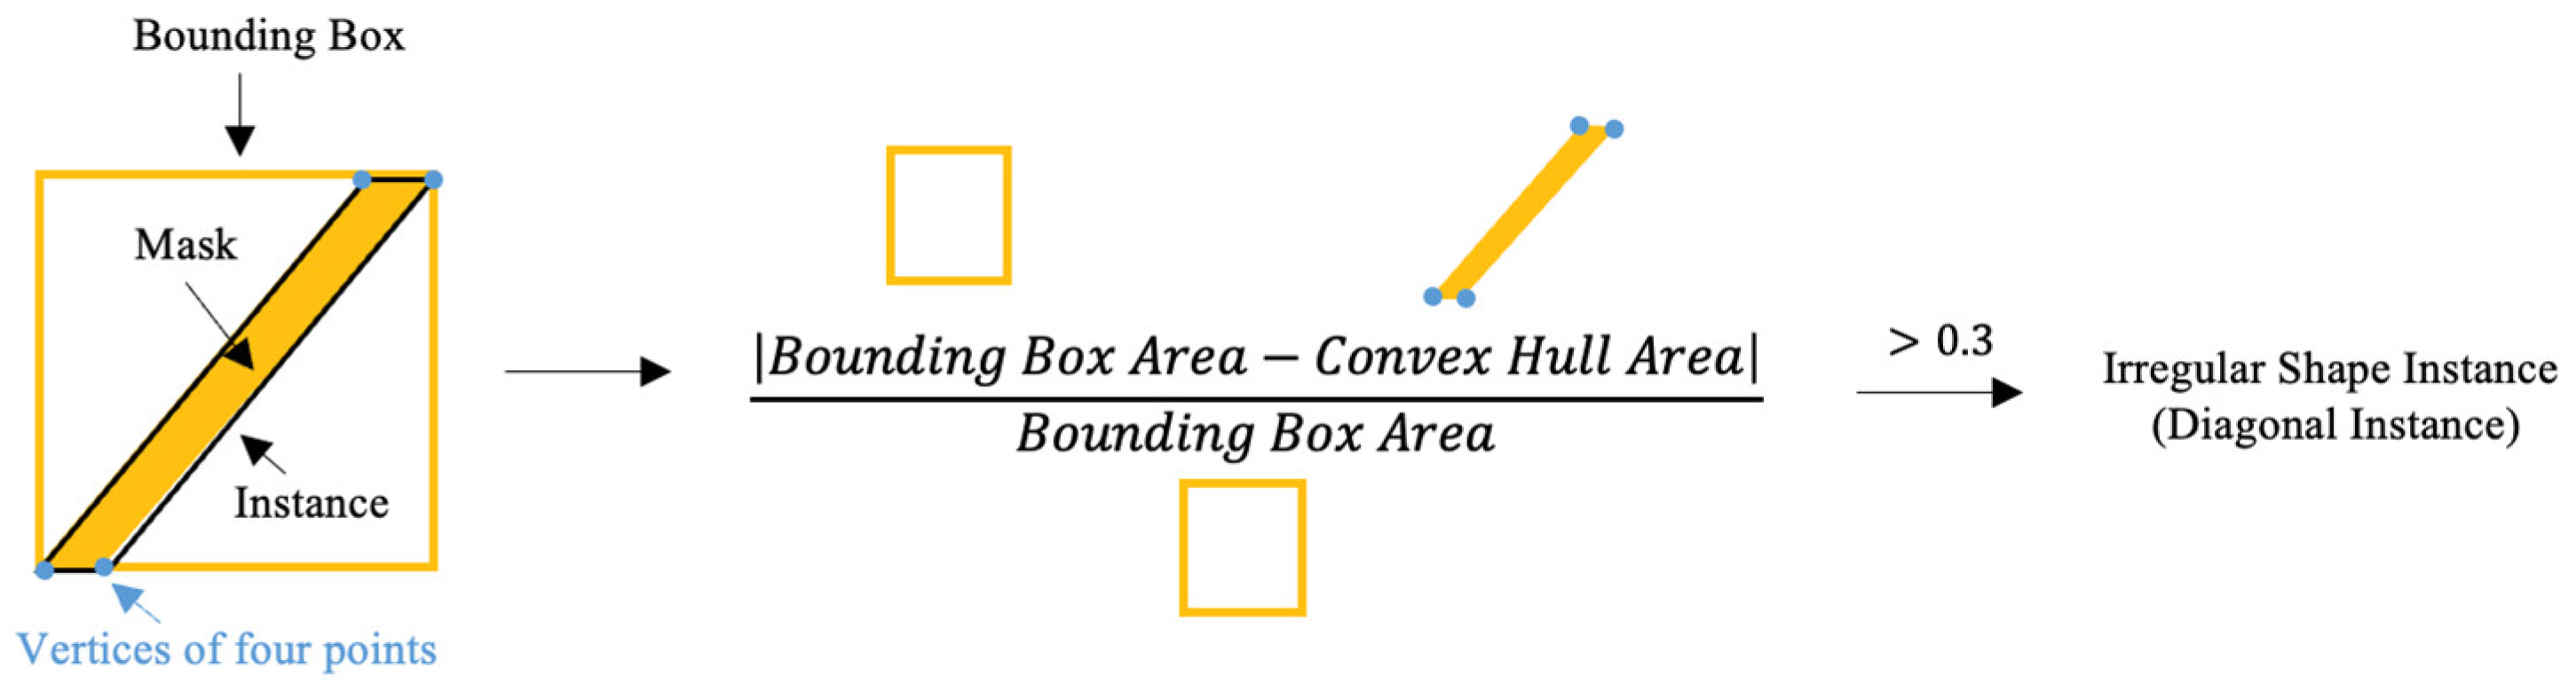
3.4.1. Distinguish the Shape of the Instance

A pipeline was created in Figure 18 to distinguish the shape of each instance since different algorithms would be fed into it depending on its shape. Instances were sorted into horizontal, vertical, and irregular shape instances. To have a better understanding of the shape of an instance from its mask, a set of segmentation points, the convex hull points were calculated and the four vertices points, l t x ,   l t y ,   l b x ,   l b y ,   r t x ,   r t y ,   r b x ,   r b y , were extracted on the edges to represent each mask, as shown in Figure 19. The first shape identifier used the values from these four points to distinguish the shape. If Equations (5) and (6) were satisfied, the shape of the instance would be determined as either vertical or horizontal. However, if the two inequalities were not all satisfied, a second shape identifier was applied, which compared the four vertices with bounding box coordinates. Take an instance in Figure 19 as an example, both bounding box coordinates and four vertices of convex hull information for an instance existed. The area enclosed by the bounding box and convex hull were calculated separately. If Equation (7) was satisfied, the shape of the instance was determined as either vertical or horizontal. Otherwise, like the case in Figure 20, the shape of the instance was determined as diagonal. The 0.3 threshold in Equation (7) was determined through a trial-and-error process. This process is recommended to practitioners to decide the appropriate threshold for instance shape identification in their study.
l t x l b x 10
where l t x is left top corner x-axis coordinate of four vertices points from convex hull, l b x is left bottom corner x-axis coordinate of four vertices points from convex hull.
r t y l t y 10
where r t y is right top corner y-axis coordinate of four vertices points from convex hull, l t y is left top corner y-axis coordinate of four vertices points from convex hull.
A B o u n d i n g   B o x A C o n v e x   H u l l A B o u n d i n g   B o x   0.3
where A B o u n d i n g   B o x   is the area enclosed by bounding box, A C o n v e x   H u l l is the area enclosed by four vertices points from convex hull.
For each instance, the representation of their coordinates, l t x , l t y , l b x , l b y , r t x , r t y , r b x , r b y , was subject to its shape. If the shape was a horizontal or vertical instance, its bounding box coordinates were used to reconstruct after transforming its coordination system to sheet system, which means l t x , l t y , l b x , l b y , r t x , r t y , r b x , r b y values were computed from bounding box coordinates. However, if the shape was a diagonal instance, the coordination system of its four vertices points was transformed from convex hull.
Ultimately, each instance was represented by a 1-D array with 11 values: (1) unique index, (2) class, (3) shape, (4) l t x , (5) l t y , (6)   l b x , (7) l b y , (8) r t x , (9) r t y , (10) r b x , (11) r b y . For post-processing purposes, the vertical and horizontal instance information was extracted to an array called “Instance Segmentation Regular Shape Array” and the rest of the instances to the other array called “Instance Segmentation Irregular Shape Array”.

3.4.2. 3 Post-Processing Steps

There were three main steps for post-processing: (1) coordination system transformation, (2) merging adjacent instances, and (3) pairing doors and host walls. The exact same process was applied as object detection inference on horizontal or vertical instances. For diagonal instances, the same concept was used but with two modifications. First, the instances were separated into positively and negatively sloped diagonal instances, as shown in Figure 21. The instances were split with a positive slope of centerline from negative ones. Secondly, the gap threshold was set to 50 pixels instead of 10 pixels. The threshold was being loosened since the predicted diagonal instances exhibited diverse slopes. Raising the threshold to 50 pixels could aid in combining the neighboring diagonal instances with different slopes. Finally, information could be aggregated and finalized in a dictionary named “Instance Segmentation Dictionary” for later 3D reconstruction. The results of merging and pairing regular shape instances with irregular shape instances named “Instance Segmentation Post-Pairing Array” were combined. The key of the “Instance Segmentation Dictionary” was the index in the “Instance Segmentation Post-Pairing Array” and the value of “Instance Segmentation Dictionary” was an array having (1) class, (2) x m i n , (3) y m i n , (4) x m a x , (5) y m a x .

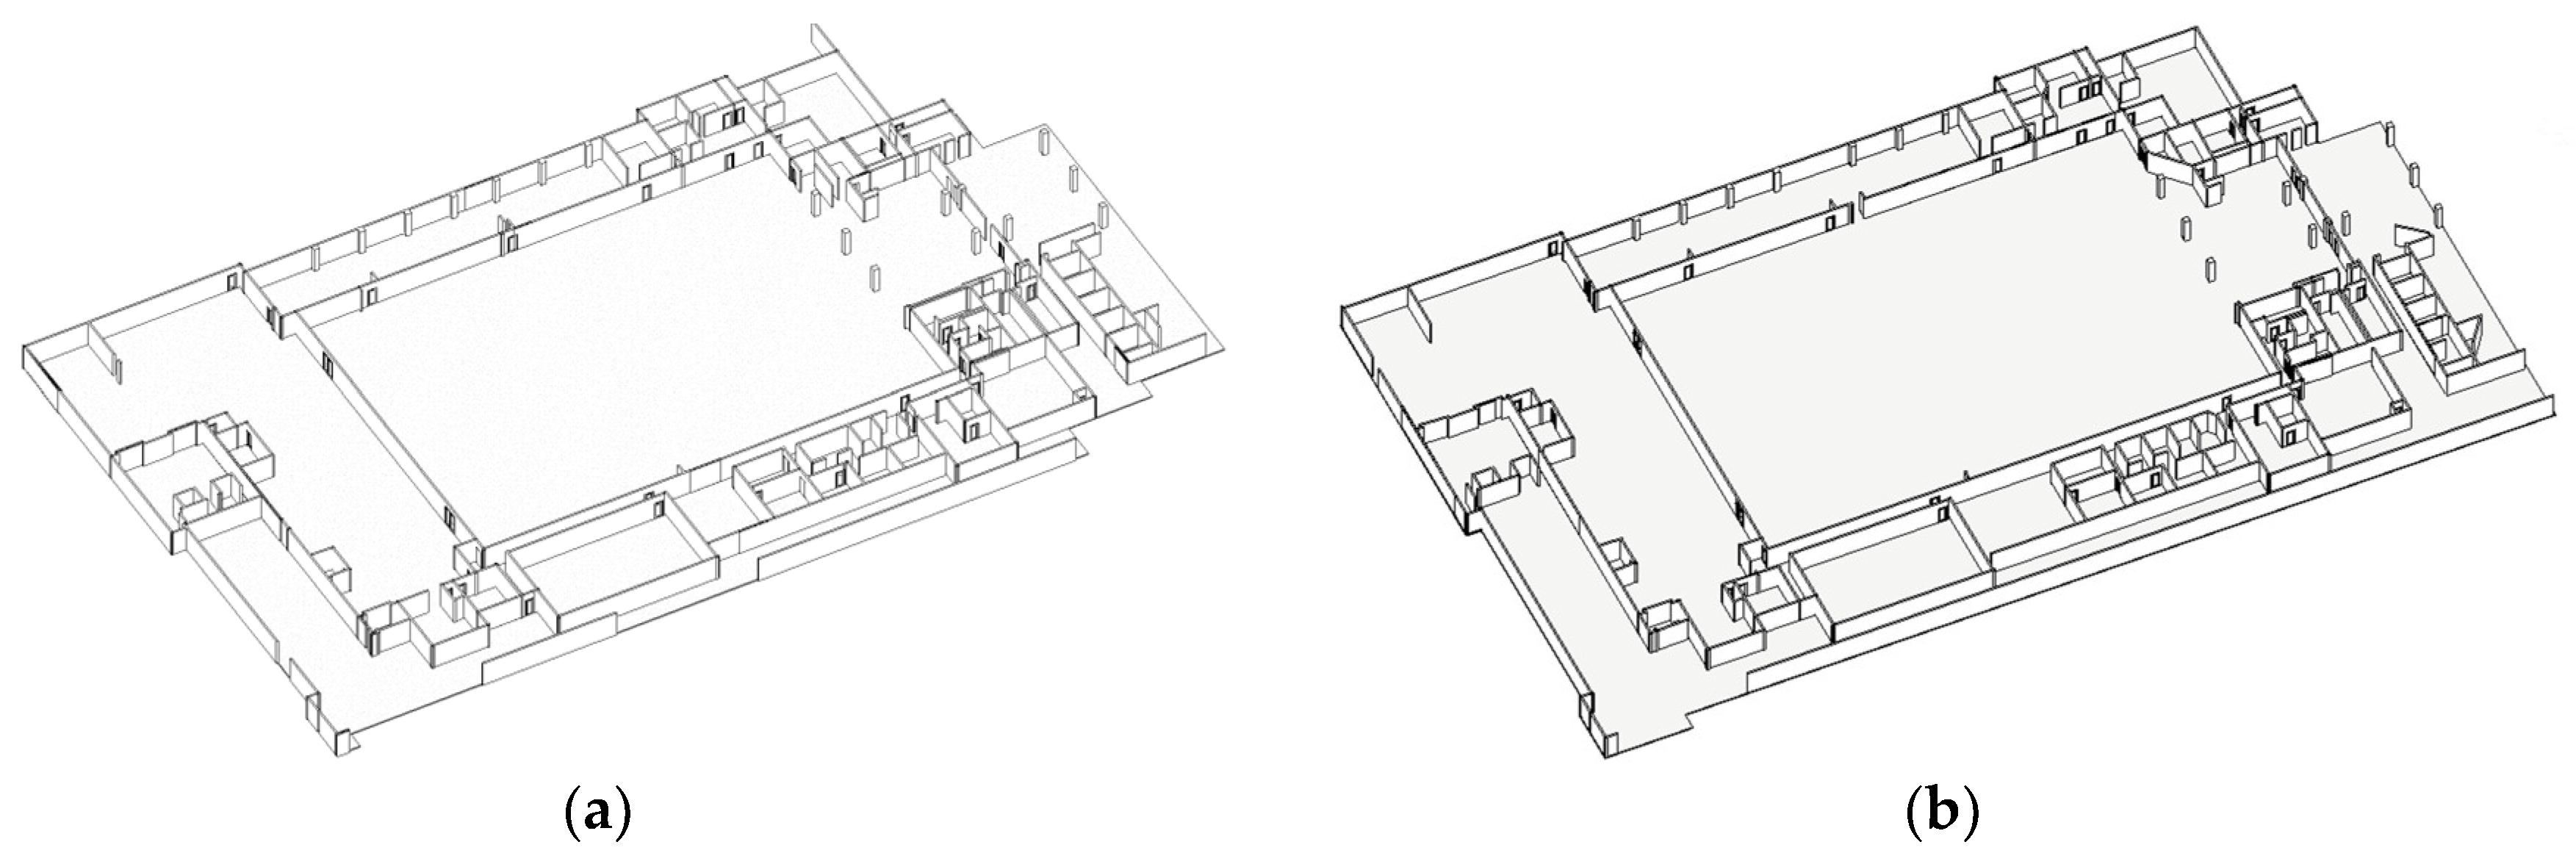
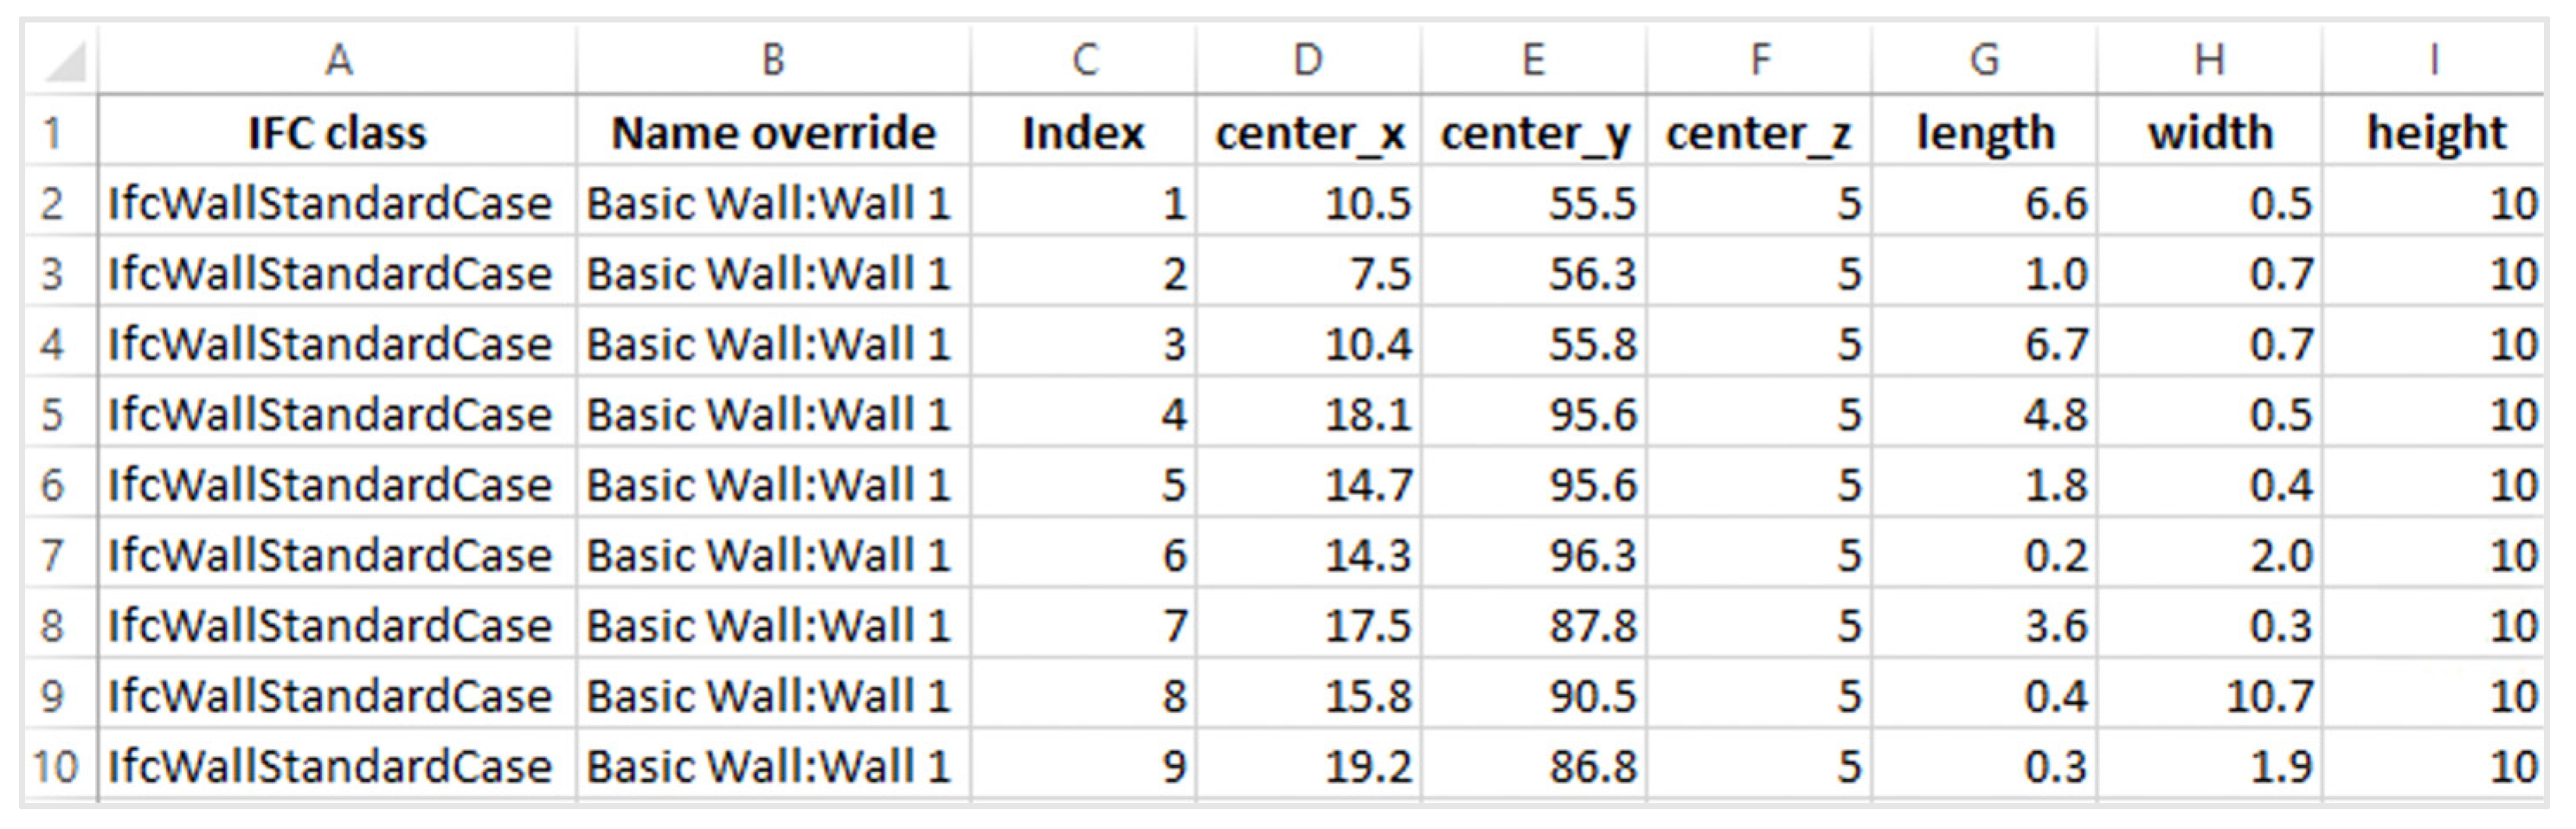
3.5. 3D Model Reconstruction in Revit 2022

After model inference and post-processing, a dictionary for both object detection and instance segmentation was created. To create a 3D model in Revit 2022, a script was written to extract information from the dictionary in Visual Studio code referencing the Revit API 2022, and the whole process is displayed in Figure 22. Take an object (one pair of key and value) in the dictionary, the key is a unique index, and the value is a 2D instance array class, x m i n , y m i n , x m a x , y m a x . For example, if index 20 is a pair of a double door and its host wall, it would be represented as 20 :   w a l l ,     x m i n ,   y m i n ,   x m a x ,     y m a x ,   d o u b l e   d o o r ,     x m i n ,   y m i n ,   x m a x ,   y m a x in the dictionary.
The first step was to check the number of instances for each object depending on its value. If there was only one instance, it must be either a column or a wall instance, which means there were no instances embedded in it. Equation (1) was used to reconstruct the wall, and Equation (2) to reconstruct the column model in Revit 2022. If there was more than one instance, one of them would be a wall instance, and the others would be any kind of door instance, which indicates the door instances were embedded in the wall instance. In this case, the Id of the wall instance from Equation (3) was set to the host variable in Equation (4). The type of door was set to the symbol variable, and the middle coordinate of the door was set to the location variable in Equation (4). Finally, the 3D model in Revit 2022 was generated automatically when this script was activated.

4. Results and Discussion

This section covers the quantitative performance metric of object detection and instance segmentation classifiers, identifying failure cases of object recognition and their downstream impacts on interoperability with modeling software, comparing processing on floor plans and results of using object detection versus instance segmentation models, and exploring alternative open-source 3D modeling software (Blender 3.6), as shown in Figure 1.

4.1. Quantitative Results of Object Detection and Instance Segmentation Classifiers

The average precision with a 0.5 IoU threshold ( A P 50 ) of each class is used to evaluate the results of each classifier and calculated the mean average precision from all five classes discretely, as shown in Table 1. Comparing the results among classes, the column instances could mostly be recognized, double door and wall instances have about 70 to 90% average precision, left-handed door, and right-handed door instances are much more challenging to be recognized.

4.2. Inference Results

The object detection and instance segmentation inference results are shown in Figure 23 and Figure 24, which are a portion of a new floor plan. The colors of bounding boxes and masks are subject to different classes and the number beside the class label in Figure 23c and Figure 24c are the confidence probability of the instances.
To visualize the entire floorplan model reconstruction, two different floorplan examples are shown. The first reconstructed Revit 2022 model was generated from the object detection system, as shown in Figure 25a, which contains all horizontal and vertical instances. The second one was generated from the instance segmentation system as shown, in Figure 25b. There are not only vertical and horizontal instances but also some diagonal walls being constructed.

4.3. Observations and Failure Cases on Inference Results

The observations from the inference result include two parts. The first part is the failure cases coming from neural network prediction. The second part is the failure cases that happened when communicating between the neural network output and Revit 2022.

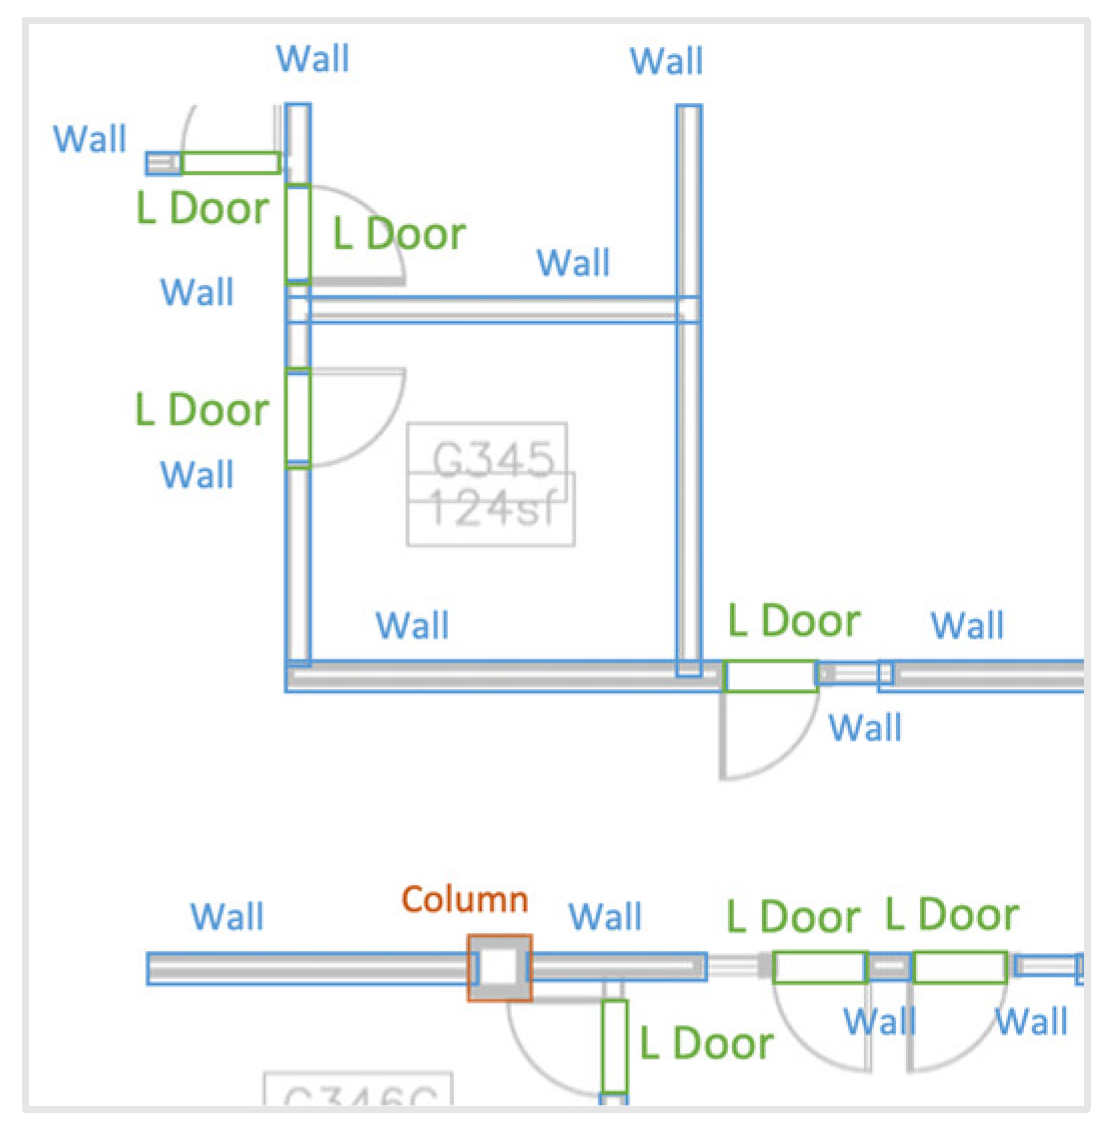
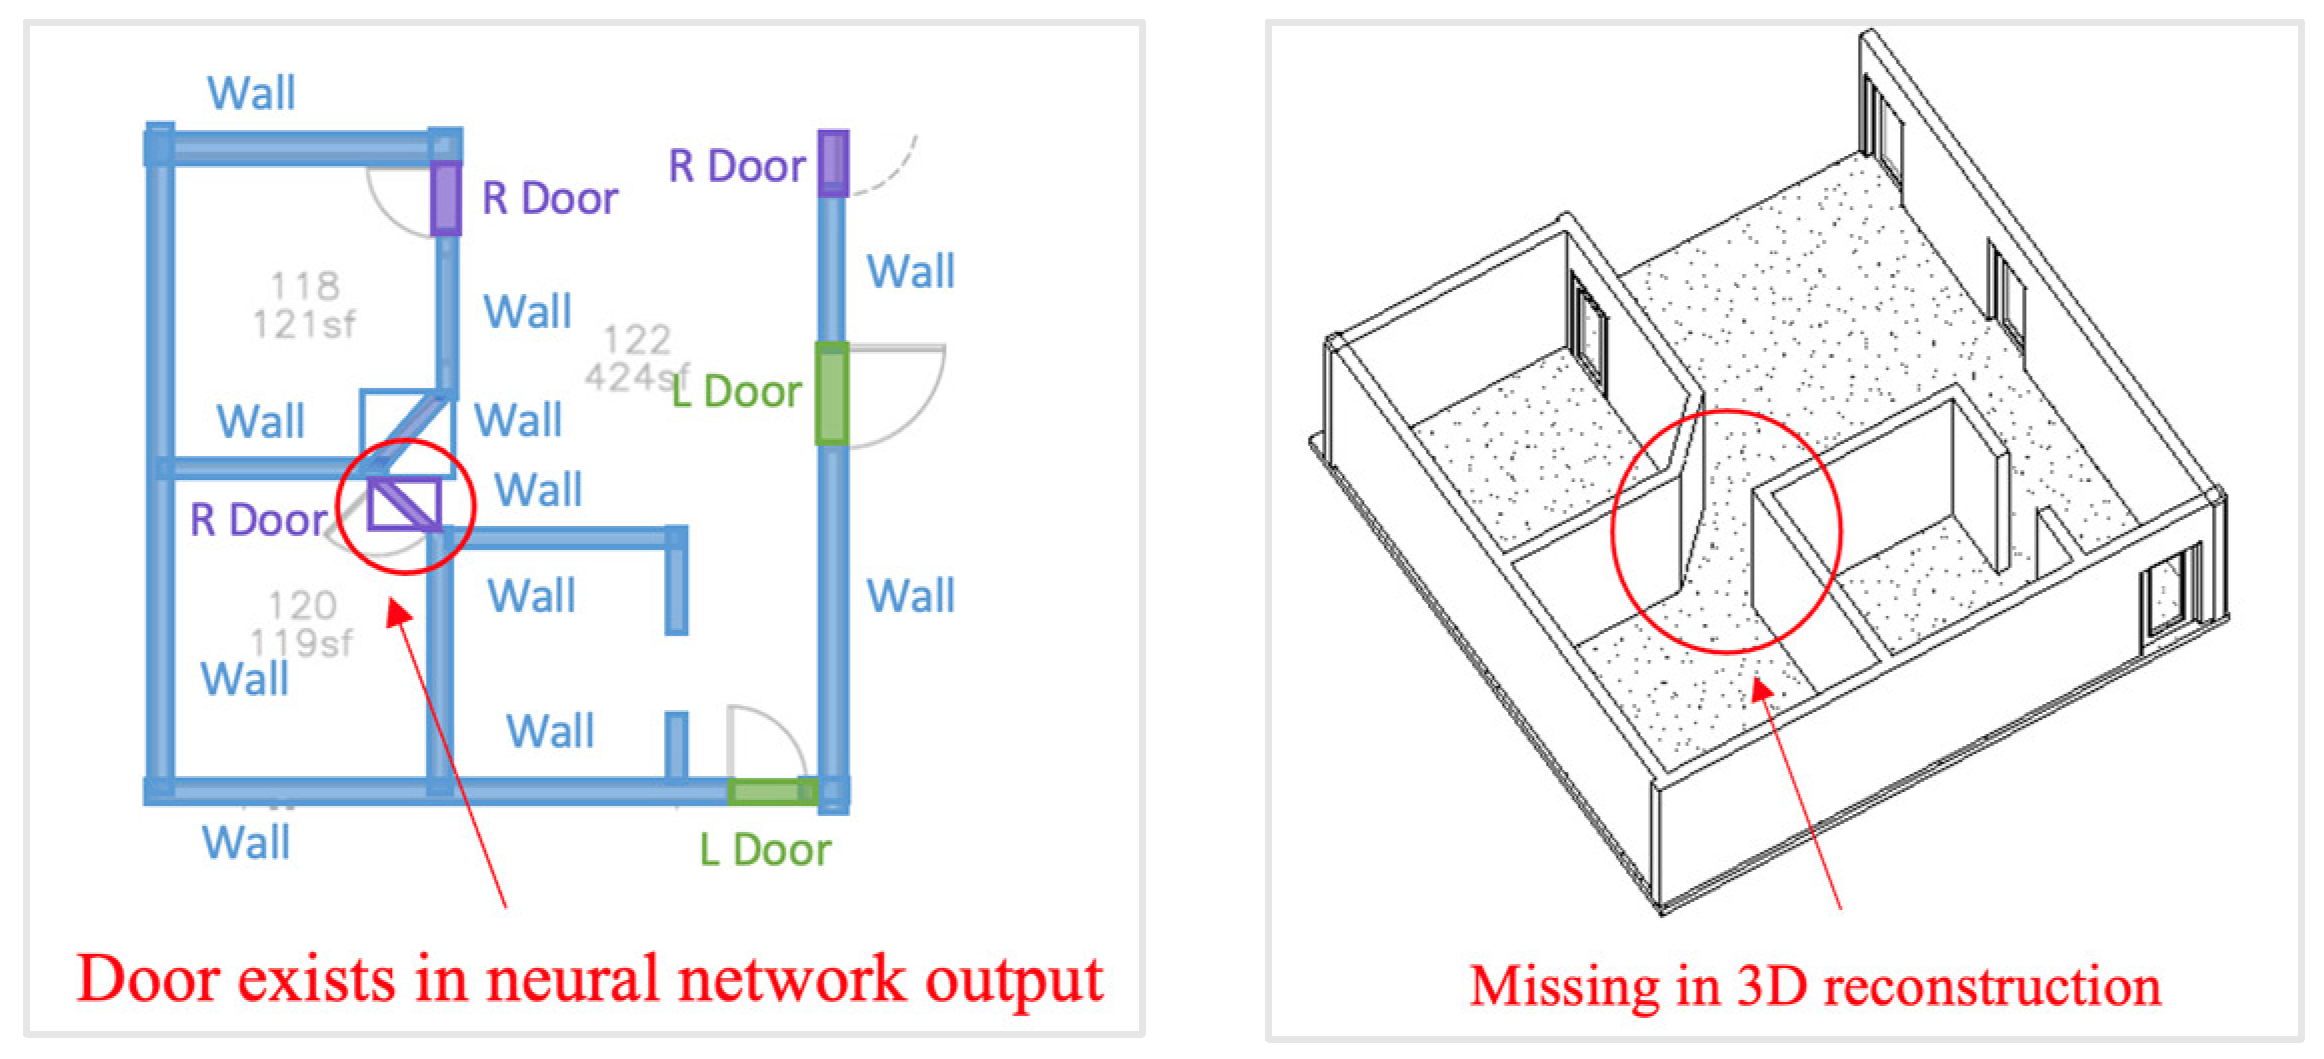
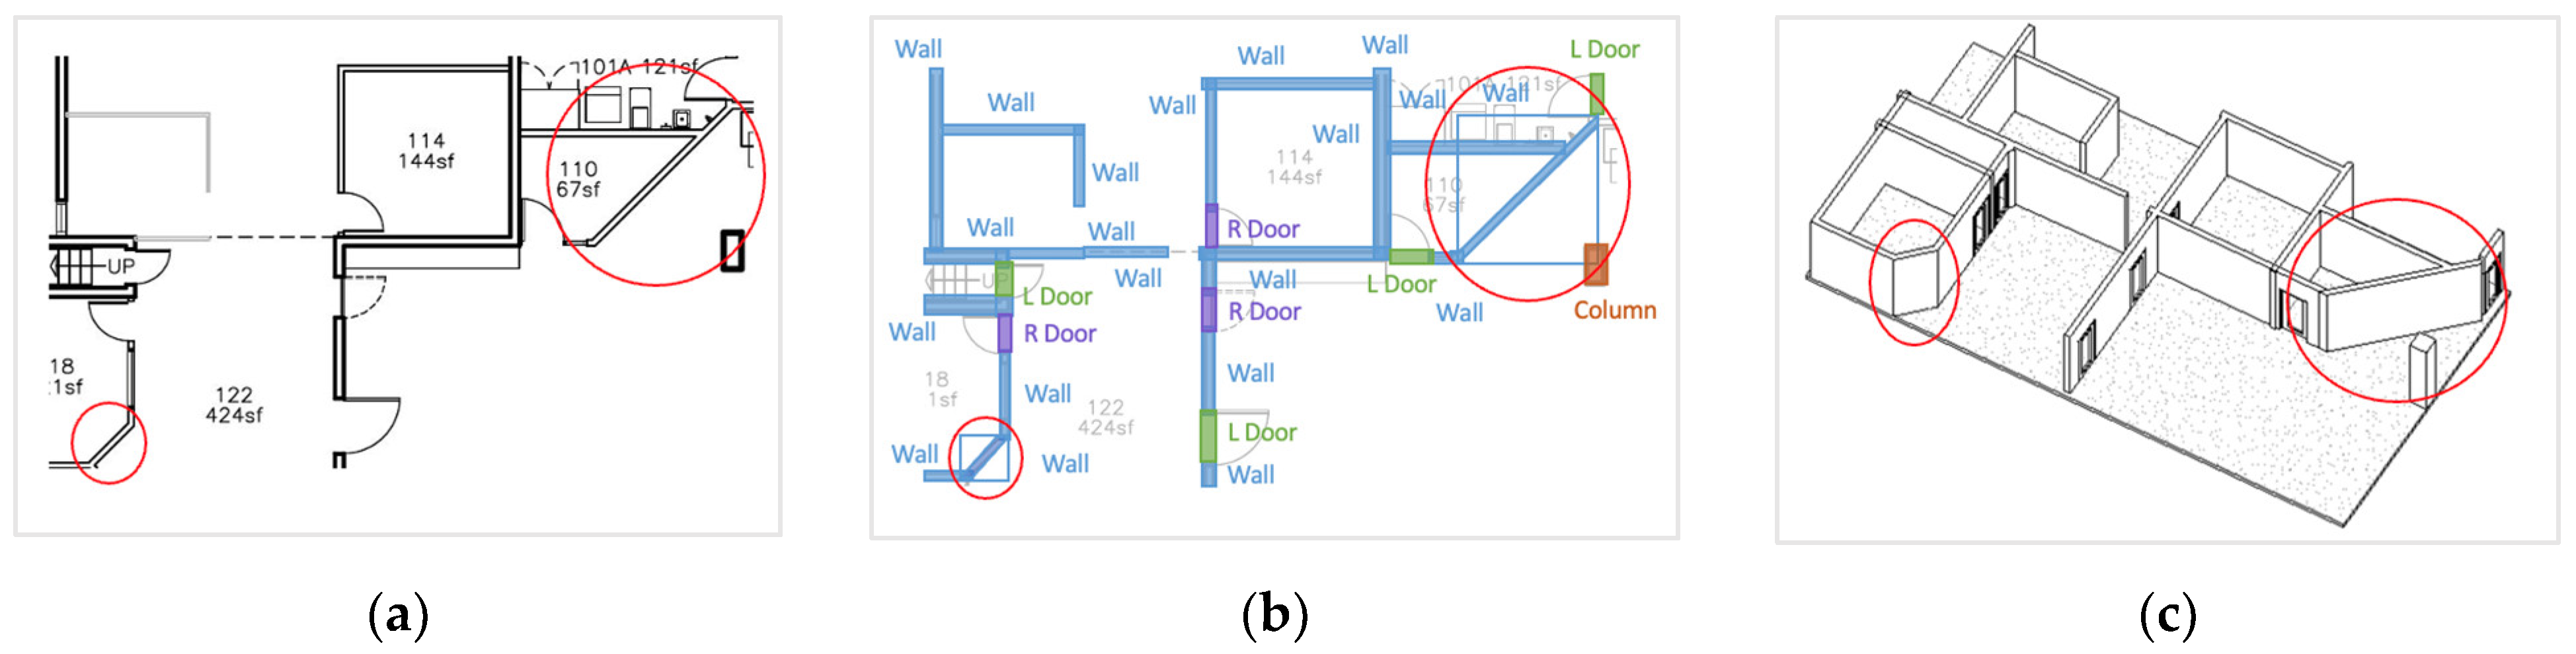
4.3.1. Neural Network Failure Cases

Title block. The building name in the title block was misclassified as a wall since the alphabet letters contain straight lines similar to the wall instance, as shown in Figure 26. Two suggestions are provided to prevent these failure cases. The first one is to manually eliminate the title block before the inference process. The second solution is feeding each inferred floor plan into an automatic main viewport detection system before making inference.
Insufficient diversity of training set. If the instance types or shapes are encountered that do not appear much in the training set, they would be difficult to recognize. The expectation of detection and segmentation inference on the instance at the bottom of Figure 27a should be a single horizontal wall, but the result is not consistent as expected, as shown in Figure 27b, since this wall type is not well represented in the training set. Another example is curved wall recognition. Both models can recognize the curved wall in Figure 28 but cannot recognize it in Figure 29 (the red circle indicates the curved wall) since there are not many curved walls existing in the training set. The types and shapes of each class should be more diverse in the training set so that the trained model could be more capable of recognizing different types and shape instances during the inference process.
Single door prediction. The A P 50 of the left-handed door and right-handed door classes are 0.5. When the prediction results are visualized on floor plan images, the models can identify the location of doors accurately, but it is hard for the classifier to distinguish if the door swung left or right, as shown in Figure 30. As a result, merging the labels of left-handed doors and right-handed doors into a single class called ‘Single Door’ is recommended. Whether the door opens externally or internally can be determined instead, as well as the location of the door hinge during post-processing, as shown in Figure 31. The first post-process step is to identify which side the door opens. Two adjacent rectangles on each side of the inferred single-door rectangle are created, as shown in Figure 32. The pixel intensities of both rectangles can be checked to establish which one contains mostly all white pixels and which one contains some black pixels, the latter indicates the side door opens. The second step is to create a bar chart from the rectangle containing black pixels. The x-axis of the bar chart is the length of the rectangle along with inferred door, divided into small bins. The y-axis is the sum of pixel intensities of each bin, as shown in Figure 33b. According to the bar chart, the identification of the door hinge position relies on determining the side with a higher concentration of black pixels, as shown on the left side in Figure 33a.

4.3.2. Interoperability Failure Cases

Isolated door instances. The post-processing algorithms in Section 3 could make the 3D digital reconstruction mostly align with the neural network output, as shown in Figure 34. For door instances creation in 3D modeling software, all door instances are assumed to be embedded in their host wall, so Equation (4) is used to generate all door instances in Revit 2022. However, the case falling out of this assumption is discovered, as shown in Figure 35. This door cannot be generated during the 3D reconstruction phase even if this door instance exists in the neural network output. The proposed advice is that the door instances without a host wall should be isolated during the post-processing phase, and there are two possible solutions. First, placing the isolated door by creating a custom door family rather than using Equation (4). Secondly, creating a wall with the same location, the value of x m i n , y m i n , x m a x , y m a x , as the isolated door, and set it to the host wall.
Door instance placement on diagonal merging wall. The neural network output visualization is shown in Figure 36a, and it could successfully detect or segment the double door and its host wall, originally two walls adjacent to the door. The 3D reconstruction after the post-process is shown in Figure 36b, which indicates that merging and pairing the walls and double door instances are achieved but the double door could not be placed. The reason is that the ratios of two sides of diagonal door and post-merging wall are different. Because of this, the location of the double door position is not aligned with the centerline of its host wall after merging, so the double door is missing on the 3D model. The proposed suggestion is to adjust the position of the door to overlap the centerline of its host wall.
The thickness of wall instances. The thickness of all wall instances in the 3D reconstruction model is the same constant value since their length is only defined by giving the value of x m i n , y m i n , x m a x , y m a x . Figure 36a shows that the thickness of the wall instance can be recognized with a purple circle indication, but this information is ignored to construct the 3D model in Figure 36b. This can be solved by expanding the Revit 2022 reconstruction script with additional functionalities offered by the Revit API 2022 so that the model would be more customized.

4.4. Comparison of Object Detection and Instance Segmentation Results

The main difference between object detection and instance segmentation inference results is the prediction of instances with irregular shapes. The object detection model inferred the diagonal walls in Figure 37a with a bounding box surrounding it, as shown in Figure 37b with red circles, which cause these walls to become horizontal walls in the 3D model, as shown in Figure 37c, since its start point and end point are computed, as described in Figure 17. In contrast, the instance segmentation model inferred these walls using a mask with a polygon surrounding it, as shown in Figure 38b, so that its start point and end point toward the diagonal orientation can be computed. Hence, the instance segmentation model can make the diagonal instances generated in the 3D model correctly but they would be failure cases if the object detection model is chosen. Although the instance segmentation model seems more robust, there is a trade-off between prediction accuracy and annotation efforts. When annotating the instances for the instance segmentation task, a polygon needs to be drawn carefully, matching the boundary of the instance, which needs more time and patience in comparison to drawing a rectangle by giving two points for the object detection task. To gain a sense of how labeling the instance segmentation task is more time-consuming, the annotation procedure of Figure 39 is timed for the object detection task and instance segmentation task separately. The result shows that it took twice as long to do instance segmentation annotation as it did to do object detection annotation. Accordingly, the proposed recommendation is that the choice between object detection and instance segmentation should consider time constraints and the number of irregular instances in the inference floor plan. If the floor plan mostly consists of regular shape instances, as shown in Figure 40a, the object detection model should be considered to save time and labor. If there are many irregularly shaped instances, as shown in Figure 40b, it is suitable for implementing instance segmentation tasks for digital reconstruction.

4.5. Alternative 3D Modeling Software

Instead of commercial 3D modeling software, such as Revit 2022, some users prefer to use open-source modeling software, such as Blender 3.6, due to its relative accessibility and flexibility. To explore the capabilities of interoperability for Blender 3.6, the wall detection output from our previous work is utilized [24] in an attempt to create a 3D wall model. The neural network output is aggregated in a CSV file, as shown in Figure 41, and the coordinate system transformation and merging of adjacent wall instances post-process are conducted. However, the location and class representation of a 3D object in Blender 3.6 is different from Revit 2022. First, an instance in Revit 2022 is localized by giving its start point and end point, as shown in Figure 16, but the location of an instance is defined by giving its center point coordinates, length, width, and height for Blender 3.6, as shown in Figure 42. Secondly, the function is used to specify the instance class in Revit 2022, as discussed in Section 4, but the class of an instance is set by providing its IFC class. Thus, a CSV file is generated containing the IFC class, center point coordinates, length, width, and height for each instance, as shown in Figure 43. Finally, a script is written to read the information in a CSV file based on Blender 3.6 Python API and reconstruct the digital wall model in Blender 3.6, as shown in Figure 44.

4.6. Limitations

In summary, a few of the pipeline’s critical limitations are as follows:
  • The post-processing pipeline for object detection and instance segmentation outputs cannot accommodate all conditions, such as an isolation door without a host wall.
  • Reconstructing irregular shape instances from instance segmentation outputs is limited to diagonal instances.
  • The parameters of reconstruction models generated from neural network outputs are limited to length and width.
  • This study is limited to the institutional building, which includes bookstore, library, office, classroom, and auditorium.

4.7. Future Works

The limitations of this work identify several tasks for future studies. Performing some actions during the preprocessing and post-processing phases should be considered. During the data collection phase, more 2D floorplan data should be augmented and various object types and shapes of each class that are commonly used in the industry should be investigated. Adding these diverse objects to the training set could optimize the generalizability of the models. Prior to inferring objects on the new floor plan, the floor plan should be fed into another system that detects the boundary of the main viewport automatically and the floor plan images should be cropped based on the boundary to avoid detecting wrong instances on the title block. To reconstruct more precise single doors in Revit 2022, all single doors should be annotated as the same class and post-processing on predicted single door instances should be conducted to identify the side and hinge of the door.
To optimize the detail of the 3D reconstruction, it is anticipated that the specific parameters of the shape can be obtained from neural network outputs. The specific parameters are determined by the class and shape of the objects. Take the wall objects as an example, the current outputs of the neural network, bounding boxes, and masks contain the location information of the instances. The length and width of each instance are further computed but are limited to using length and width parameters to describe the shape of each instance. For the new system, the shape of the wall would be identified to determine the subsequent process. If the object is a regular shape, the current strategy is used to reconstruct it and add the thickness and height values to the 3D models. The thickness of each instance is extracted from width information and written to the Revit 2022 model by Revit API 2022. To add height parameters, an OCR (Optical Character Recognition) detection system could be trained on elevation plans. The system would read the text of height values on elevation plans and input the height parameter of instances in Revit 2022. On the other hand, if the system detects a curved wall, it not only adds the thickness and height values but also outputs the curvature of the wall. The curvature information can link to the Revit 2022 model by Revit API 2022. In addition to architectural drawings recognition, the analogous pipeline outlined in this research can be employed for structure and MEP drawings recognition tasks. Investigating and comparing the performance in this regard represents a valuable avenue for research.

5. Conclusions

This paper presents automated 3D Revit 2022 model reconstruction from 2D floor plans. The reconstructed classes are single doors, double doors, columns, and walls. Object detection and instance segmentation tasks are conducted and compared. The performance metric of object detection and instance segmentation models indicate average precision of all categories beyond 74% except for the single doors category. Combining left and right single doors is suggested to optimize the performance drastically. Revit API 2022 is used for communicating with neural network output after the post-processing step. From the reconstruction of Revit 2022 models, some failure cases are raised from the neural network, including the wrong detection on the title block, insufficient diversity of shapes and types in the training set, and object detection on irregular shape instances. The optimization of the post-processing steps is raised, including isolating the door in-stance without the host wall, manipulating the location of the door on post-merging diagonal walls, and adding a parameter of thickness to the model. For the comparison of object detection and instance segmentation, the instance segmentation model performs more precise results on diagonal instances but is more time-consuming during the labeling phase. The suggested decision of choosing between these two models should consider project time and the number of irregular shape instances in the floor plan.
In the future, the proposed recognition system is intended to expand more parameters, such as the height and width of instances, and apply to structural and MEP drawings automatic recognition. The reconstruction process and discussion in this study could be of practical use and guidance for 2D to 3D digital transformation in the AEC industry.

Author Contributions

Conceptualization, C.W., M.G. and T.C.; methodology, C.W., M.G. and T.C.; software, C.W.; validation, C.W., M.G. and T.C.; formal analysis, C.W.; investigation, C.W., M.G. and T.C.; resources, C.W.; data curation, C.W.; writing—original draft preparation, C.W.; writing—review and editing, C.W., M.G. and T.C.; visualization, C.W.; supervision, T.C. All authors have read and agreed to the published version of the manuscript.

Funding

This research received no external funding.

Data Availability Statement

All data, models, or code that support the findings of this study are available from the corresponding author upon reasonable request.

Conflicts of Interest

The authors declare no conflict of interest.

Appendix A

Figure A1. Detailed Object detection inference and post-process pipeline.
Buildings 13 02336 g0a1
Figure A2. Instance Segmentation inference and post-process pipeline.
Buildings 13 02336 g0a2

References

  1. Ullah, K.; Lill, I.; Witt, E. An Overview of BIM Adoption in the Construction Industry: Benefits and Barriers. In Proceedings of the 10th Nordic Conference on Construction Economics and Organization, Tallinn, Estonia, 7–8 May 2019; Lill, I., Witt, E., Eds.; Emerald Reach Proceedings Series; Emerald Publishing Limited: Bingley, UK, 2019; Volume 2, pp. 297–303. [Google Scholar]
  2. Park, S.; Kim, H. 3DPlanNet: Generating 3D Models from 2D Floor Plan Images Using Ensemble Methods. Electronics 2021, 10, 2729. [Google Scholar] [CrossRef]
  3. Mishra, S.; Hashmi, K.A.; Pagani, A.; Liwicki, M.; Stricker, D.; Afzal, M.Z. Towards Robust Object Detection in Floor Plan Images: A Data Augmentation Approach. Appl. Sci. 2021, 11, 11174. [Google Scholar] [CrossRef]
  4. Zhao, Y.; Deng, X.; Lai, H. Reconstructing BIM from 2D structural drawings for existing buildings. Autom. Constr. 2021, 128, 103750. [Google Scholar] [CrossRef]
  5. Dodge, S.; Xu, J.; Stenger, B. Parsing floor plan images. In Proceedings of the 2017 Fifteenth IAPR International Conference on Machine Vision Applications (MVA), Nagoya, Japan, 8–12 May 2017; pp. 358–361. [Google Scholar]
  6. Kalervo, A.; Ylioinas, J.; Häikiö, M.; Karhu, A.; Kannala, J. CubiCasa5K: A Dataset and an Improved Multi-task Model for Floorplan Image Analysis. arXiv 2019, arXiv:1904.01920. [Google Scholar]
  7. Sandelin, F. Semantic and Instance Segmentation of Room Features in Floor Plans Using Mask R-CNN. Master’s Thesis, Uppsala University, Uppsala, Sweden, 2019. [Google Scholar]
  8. Umapathy, S.G.; Iliev, A.I. Segmentation of Floorplans and Heritage Sites: An Approach to Unbalanced Dataset. J. Digit. Present. Preserv. Cult. Sci. Herit. 2022, 12, 205–216. [Google Scholar]
  9. Taye, M.M. Understanding of Machine Learning with Deep Learning: Architectures, Workflow, Applications and Future Directions. Computers 2023, 12, 91. [Google Scholar] [CrossRef]
  10. He, K.; Zhang, X.; Ren, S.; Sun, J. Deep Residual Learning for Image Recognition. In Proceedings of the IEEE Conference on Computer Vision and Pattern Recognition (CVPR), Las Vegas, NV, USA, 27–30 June 2016; pp. 770–778. [Google Scholar]
  11. Xiao, Y.; Chen, S.; Ikeda, Y.; Hotta, K. Automatic Recognition and Segmentation of Architectural Elements from 2D Drawings by Convolutional Neural Network. In Proceedings of the 25th International Conference of the Association for Computer-Aided Architectural Design Research in Asia (CAADRIA), Bangkok, Thailand, 5–6 August 2020; Volume 1, pp. 843–852. [Google Scholar]
  12. Jang, H.; Yu, K.; Yang, J. Indoor reconstruction from floorplan images with a deep learning approach. ISPRS Int. J. Geo-Inf. 2020, 9, 65. [Google Scholar] [CrossRef]
  13. Chen, L.-C.; Papandreou, G.; Kokkinos, I.; Murphy, K.; Yuille, A.L. DeepLab: Semantic Image Segmentation with Deep Convolutional Nets, Atrous Convolution, and Fully Connected CRFs. IEEE Trans. Pattern Anal. Mach. Intell. 2016, 40, 834–848. [Google Scholar] [CrossRef] [PubMed]
  14. Seo, J.; Park, H.; Choo, S. Inference of drawing elements and space usage on architectural drawings using semantic segmentation. Appl. Sci. 2020, 10, 7347. [Google Scholar] [CrossRef]
  15. Kippers, R.G.; Koeva, M.; Keulen, M.; Elberink, S.J. Automatic 3D building model generation using deep learning methods based on CityJSON and 2D floor plans. Int. Arch. Photogramm. Remote Sens. Spat. Inf. Sci. 2021, 46, 49–54. [Google Scholar] [CrossRef]
  16. Verykokou, S.; Ioannidis, C. An Overview on Image-Based and Scanner-Based 3D Modeling Technologies. Sensors 2023, 23, 596. [Google Scholar] [CrossRef] [PubMed]
  17. Lu, Q.; Chen, L.; Li, S.; Pitt, M. Semi-Automatic Geometric DFwiigital Twinning for Existing Buildings Based on Images and CAD Drawings. Autom. Constr. 2020, 115, 103183. [Google Scholar] [CrossRef]
  18. Yang, B.; Liu, B.; Zhu, D.; Zhang, B.; Wang, Z.; Lei, K. Semiautomatic Structural BIM-Model Generation Methodology Using CAD Construction Drawings. J. Comput. Civ. Eng. 2020, 34, 1–17. [Google Scholar] [CrossRef]
  19. Missing Elements When Importing IFC Model with User IFC Template in Revit. Autodesk. Available online: https://www.autodesk.com/support/technical/article/caas/sfdcarticles/sfdcarticles/Missing-elements-when-importing-IFC-model-with-user-IFC-template-in-Revit.html (accessed on 15 August 2023).
  20. Some Room Objects are Missing after Import IFC File to Revit. Autodesk. Available online: https://www.autodesk.com/support/technical/article/caas/sfdcarticles/sfdcarticles/Some-Room-objects-are-missing-after-import-IFC-file-to-Revit.html (accessed on 15 August 2023).
  21. Russell, B.; Torralba, A.; Murphy, K.; Freeman, W.T. LabelMe: A database and web-based tool for image annotation. J. Comput. Vis. 2007, 77, 157–173. [Google Scholar] [CrossRef]
  22. Huyen, C. Designing Machine Learning Systems; O’Reilly Media Inc.: Sebastopol, CA, USA, 2022. [Google Scholar]
  23. Wu, Y.; Kirillov, A.; Massa, F.; Lo, W.-Y.; Girshick, R. Detectron2; GitHub: San Francisco, CA, USA, 2019. [Google Scholar]
  24. Wei, C.; Gupta, M.; Czerniawski, T. Automated Wall Detection in 2D CAD Drawings to Create Digital 3D Models. In Proceedings of the 39th International Symposium on Automation and Robotics in Construction (ISARC), Bogota, Colombia, 12–15 July 2022; pp. 152–158. [Google Scholar]
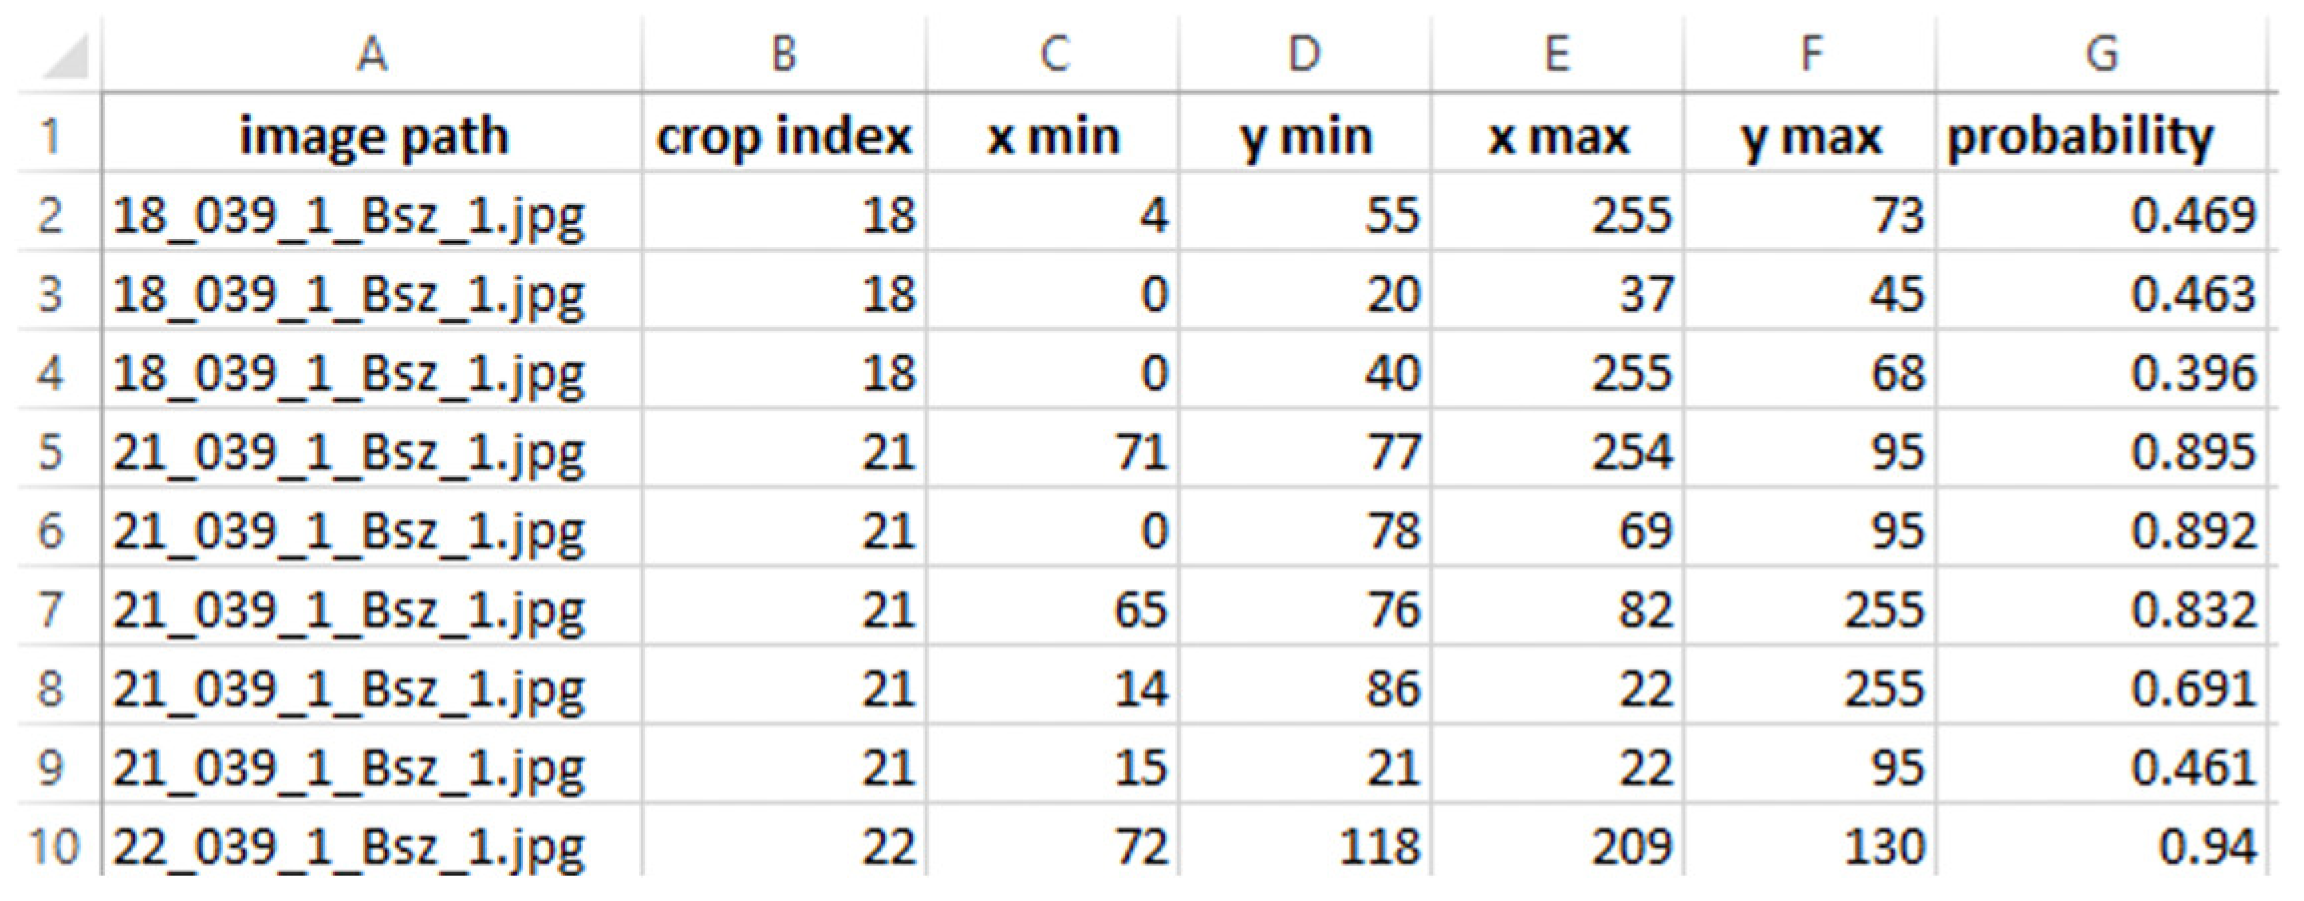
Figure 1. Research framework and pipeline.
Buildings 13 02336 g001
Figure 2. Object detection classifier and instance segmentation classifier.
Buildings 13 02336 g002
Figure 3. (a) Original floor plan; (b) wall instances annotation; and (c) L door, R door, double door, column instances annotation (Diverse color annotations are used to differentiate between various categories).
Buildings 13 02336 g003
Figure 4. Annotation: (a) Object detection; and (b) Instance Segmentation.
Buildings 13 02336 g004
Figure 5. Random cropping: (a) 3400 × 2200 pixels floor plan; and (b) 800 × 800 pixels crop randomly sampled from (a).
Buildings 13 02336 g005
Figure 6. Overall object detection inference pipeline.
Buildings 13 02336 g006
Figure 7. 800 × 800 pixels sliding windows sequence cropping for 3400 × 2200 pixels floor plan. (The numbers 1 to 14 indicate the sequence of crops).
Buildings 13 02336 g007
Figure 8. Crop coordinate system transforms into sheet coordinate system.
Buildings 13 02336 g008
Figure 9. Vertices of bounding box representation.
Buildings 13 02336 g009
Figure 10. Wall and column instance in Revit 2022.
Buildings 13 02336 g010
Figure 11. Revit 2022 model example: (a) Without merging instances; and (b) after merging process.
Buildings 13 02336 g011
Figure 12. The gap threshold implication for merging instances.
Buildings 13 02336 g012
Figure 13. Horizontal instances A and B in “Object Detection Array Duplicate”.
Buildings 13 02336 g013
Figure 14. Three possible combinations of adjacent instances A and B.
Buildings 13 02336 g014
Figure 15. Horizontal wall instance C and door instance D.
Buildings 13 02336 g015
Figure 16. Vertices to start point and end point representation.
Buildings 13 02336 g016
Figure 17. Overall instance segmentation inference pipeline.
Buildings 13 02336 g017
Figure 18. The pipeline of identifying the shape of inference instances.
Buildings 13 02336 g018
Figure 19. Process of getting four vertices of convex hull from mask.
Buildings 13 02336 g019
Figure 20. A diagonal instance example identified from second shape identifier.
Buildings 13 02336 g020
Figure 21. Two types of diagonal instances description.
Buildings 13 02336 g021
Figure 22. 3D reconstruction pipeline by a given dictionary.
Buildings 13 02336 g022
Figure 23. Object detection inference result: (a) Original floorplan; (b) predicted bounding boxes; (c) floorplan with predicted bounding boxes.
Buildings 13 02336 g023
Figure 24. Instance segmentation inference result: (a) Original floorplan; (b) predicted mask and bounding boxes; (c) floorplan with predicted mask and bounding boxes.
Buildings 13 02336 g024
Figure 25. Reconstructed Revit 2022 models: (a) From object detection output; (b) from instance segmentation output.
Buildings 13 02336 g025
Figure 26. Title block failure case.
Buildings 13 02336 g026
Figure 27. Unseen wall type in training set example: (a) Expected inference result indicated by blue dash line; (b) real inference result.
Buildings 13 02336 g027
Figure 28. Example of recognized curved wall: (a) Object detection inference result; (b) instance segmentation inference result.
Buildings 13 02336 g028
Figure 29. Example of not recognized curved wall: (a) Object detection inference result; (b) instance segmentation inference result.
Buildings 13 02336 g029
Figure 30. Inference result.
Buildings 13 02336 g030
Figure 31. External/internal door and door hinge position indication.
Buildings 13 02336 g031
Figure 32. Two rectangle creations from the inferred single-door intersection.
Buildings 13 02336 g032
Figure 33. Door hinge position indication. (a) Inferred door; (b) column chart for door hinge position identification.
Buildings 13 02336 g033
Figure 34. A successful case of neural network output and 3D modeling software communication. (a) Neural network output visualization; (b) 2D floor plan of 3D model reconstruction; (c) 3D model reconstruction.
Buildings 13 02336 g034
Figure 35. The case of a door not embedded in a host wall.
Buildings 13 02336 g035
Figure 36. Illustration of missing double door (red circle) and thickness of wall ignorance (purple circle) during 3D reconstruction. (a) Instance segmentation output visualization; (b) 2D floor plan of 3D model reconstruction.
Buildings 13 02336 g036
Figure 37. Object detection on diagonal instances inference result (red circles). (a) Original floor plan; (b) neural network output visualization; (c) 3D model reconstruction.
Buildings 13 02336 g037
Figure 38. Instance segmentation on diagonal instances inference result (red circles). (a) Original floor plan; (b) neural network output visualization; (c) 3D model reconstruction.
Buildings 13 02336 g038
Figure 39. Image of comparing annotation time.
Buildings 13 02336 g039
Figure 40. Floor plan examples: (a) Floor plan contains mostly horizontal and vertical instances; (b) floor plan contains some diagonal instances.
Buildings 13 02336 g040
Figure 41. Neural network output assembled in CSV file.
Buildings 13 02336 g041
Figure 42. Blender 3.6 user interface: Instance defined by IFC class, location, and dimensions in Blender 3.6.
Buildings 13 02336 g042
Figure 43. CSV file for 3D reconstruction in Blender 3.6.
Buildings 13 02336 g043
Figure 44. Three levels of wall instances reconstruction in Blender 3.6.
Buildings 13 02336 g044
Table 1. Average precision of each class for Object Detection and Instance Segmentation Classifiers.
ClassWallL DoorR DoorDouble DoorColumnmAP
Classifier 1
(Object Detection)
74.551.747.987.996.571.7
Classifier 2
(Instance Segmentation)
74.448.650.077.196.869.3
Disclaimer/Publisher’s Note: The statements, opinions and data contained in all publications are solely those of the individual author(s) and contributor(s) and not of MDPI and/or the editor(s). MDPI and/or the editor(s) disclaim responsibility for any injury to people or property resulting from any ideas, methods, instructions or products referred to in the content.

