Article

Effects of Crushing and Grinding on the Porosity of Hardened Cement Paste

by
Mohamed ElKarim Bouarroudj
1,2,3,*,
Sébastien Rémond
3,
Bogdan Cazacliu
4,
Guillaume Potier
1,2,
Luc Courard
5 and
David Bulteel
1,2
1
IMT Nord Europe, Institut Mines-Télécom, Centre for Materials and Processes, F-59000 Lille, France
2
Univ. Lille, Institut Mines-Télécom, Univ. Artois, Junia, ULR 4515—LGCgE—Laboratoire de Génie Civil et géoEnvironnement, F-59000 Lille, France
3
Univ Orléans, Univ Tours, INSA CVL, LaMé, EA 7494, 8 Rue Léonard De Vinci, 45072 Orléans, France
4
FSTTAR, Aggregates and Materials Processing Laboratory, Route de Bouaye-CS4, 44344 Bouguenais Cedex, Nantes, France
5
GeMMe Building Materials, Department of Urban and Environmental Engineering (UEE), Faculty of Applied Sciences, University of Liège, 4000 Liège, Belgium
*
Author to whom correspondence should be addressed.
Buildings 2023, 13(9), 2319; https://doi.org/10.3390/buildings13092319
Submission received: 19 July 2023 / Revised: 15 August 2023 / Accepted: 21 August 2023 / Published: 13 September 2023
(This article belongs to the Special Issue Advances in Building Materials and Methods)

Abstract

:
The objective of this paper was to study the impact of crushing and grinding on the porosity of hardened cement paste, which is responsible for the high values of recycled concrete aggregate (RCA) water absorption. Hardened cement pastes with three different water to cement ratios have been crushed in one to three steps with a jaw crusher to produce aggregate larger than 2 mm and ground with a disc crusher in order to produce particles lower than 150 µm. Water absorption tests and mercury intrusion porosimetry (MIP) were performed for the different resulting sizes. It was observed that the crushing procedure did not significantly affect the porosity of the aggregate. However, MIP performed on the powders showed differences in the pore size distribution compared with the monolith. This can better be attributed to a modification of the surface roughness of the particles than to a modification of their porosity. In all cases, the water absorption rate was the highest during the first 1 min after soaking in water. It was also observed that the morphology of the particles changed from a step of crushing to another.

1. Introduction

In Europe, a large part of buildings reach the end of life. The construction of new buildings and the demolition of old ones generate large quantities of construction and demolition wastes (CDWs), most of which is not harmful to the environment and human health. Construction uses huge amounts of natural resources, which are increasingly difficult to find [1]. Recycling CDWs helps alleviate the shortage of natural materials [2].
A significant part of CDWs comprise recycled concrete aggregate (RCA). RCA can be used in concrete manufacturing as aggregates [3,4,5,6], as mineral addition (ground RCA) [7,8,9], and also as a raw meal in cement fabrication (ground RCA) [10,11]. RCA is composed of a mix between natural aggregate and old, hardened cement paste [12,13]. The latter is usually much more porous than natural aggregates, which makes the water absorption (WA) of RCA much higher than that of natural aggregates and complicates their incorporation in concrete production. During RCA production, cement paste tends to concentrate in fine particles; this is why it is more difficult to valorize the fine particles than the coarser ones [14]. Refs. [7,8] propose the use of this fraction as a mineral addition.
RCAs are produced in recycling plants, which can be mobile or stationary. Stationary recycling plants have a developed waste sorting and crushing chain, which can produce better quality recycled aggregate than mobile plants. The main advantage of mobile plants is to limit transportation distances. Three types of crushers are commonly used for RCA production: impact, jaw and cone crushers. Both jaw and impact crushers are the most common types used by producers of recycled aggregates [15]. In general, for the production of mineral additions, a grinding procedure is needed, and the ball meal is the common procedure used in manufacturing this type of construction material [16]. Thus, there are different techniques, and each one has a different intensity, which may have an influence on the characteristics (generated cracks) of the produced aggregates.
Several cycles of crushing and grinding are needed in the production of RCA as aggregate and as mineral additions. This production process could significantly influence the RCAs’ properties by creating internal cracks, which would increase their porosity and WA.
Knowing the intra-granular porosity of aggregate is of great importance for RCA, because this determines the real density (envelope volume of a particle) and the WA of the aggregate, which are useful data for concrete mixture proportioning [17]. Different methods exist to measure the porosity or WA. Mercury intrusion porosimetry (MIP) can be used to know the porosity and pore size distribution of the material. This method is limited by the maximum pressure (200 MPa), so the smallest pores cannot be measured [18]. The standard EN 1097-6 [19] and IFSTTAR N°78 [20] methods can be applied to granular materials, as these two methods are based on measuring the water content during the saturated surface dry state of the material initially immersed in wanitially im, as minera showed that using the standard EN 1097-6 [19] or IFSTTAR protocol [20] to measure the WA is not possible for particles lower than 0.5 mm. The authors proposed a method to estimate the WA for particles lower than 0.5 mm. This method is based on the linear relationship between the WA and cement paste content, where the WA is obtained by interpolation. Another method, based on a theoretical model, has been proposed by [21]. This model is based on the particle size distribution of the ground material and the pore size distribution obtained from the monolith using MIP. Both the extrapolation method proposed by [22] and the model proposed by [21] assume that the properties of the old, hard cement paste are the same in the different granular classes of the material. This hypothesis might not be valid if, for example, the crushing or grinding of the particles significantly influences the porosity of the material. Thus, the intensity of crushing and grinding can have a significant influence on the porosity (due to the eventual cracks) and therefore the characteristics of the materials, which will make their characterization and use difficult.
The objective of this paper is to study the effect of multiple crushing (producing particles 20/0.15 mm) and grinding (producing powder < 0.15 mm) steps on the properties of hard cement pastes used as model RCA. Hard cement paste represents a major part of the porosity of RCA. If the crushing procedure led to a significant increase in the porosity of the cement paste, then this would have significant consequences for the properties of the recycled aggregate. Having a model RCA containing only cement paste appears to be the most effective method to identify the effect of the process on the modification of the RCA aggregate’s properties. In this research, only the porosity that is related to the paste itself is studied. However, modification of the porosity at the interface between the cement paste and aggregate could also be expected, and it would also change the RCA properties, although this is not explored in the present paper.
Model RCAs made from the crushing of three pure hard cement pastes of varying water to cement ratios are used in this study. The model RCA is prepared in the laboratory with three different water to cement ratios for modeling RCA produced with high, medium and low concrete mechanical properties. The influence of the water to cement ratio on the properties of hard cement paste is well known and has been the object of many studies [23,24,25]. In this paper, the properties of monolith hard cement pastes of varying W/C are characterized only to precisely determine the physical properties of the model materials before grinding. Yet, the objective of our work is to study the influence of the process on the variation in these properties.
This paper is organized as follows. First, the methodology and the model RCA preparation are presented. Next, the different experimental methods are presented. In Section 3, different results concerning the WA kinetics are first presented, and after that, the effect of crushing and grinding on the model RCA’s properties is presented. Finally, the conclusions and perspectives are formulated in Section 4.

2. Experimental Method

2.1. Materials

Pure cement pastes have been manufactured in the laboratory with three different water to cement ratios (0.3, 0.5 and 0.7). The used cement is CEM I 52.5 N, complying with standard EN 197-1 [26]. For the cement paste manufactured with a water to cement ratio equal to 0.3, a superplasticizer has been used.
To ensure good homogenization during the manufacturing of the cement paste, half of the cement quantity is first added with all the water and mixed for 90 s. After that, the second half is added, and the mixing process continues for another 90 s. For the mix made with a superplasticizer, the latter is added into water. After mixing, the cement paste is poured into plastic bottles and gently vibrated to minimize the presence of air bubbles. The fresh cement paste is then sealed and rotated continuously for 6 h (until setting) using a proper rotating machine in order to avoid segregation and bleeding. To finish, the cement pastes are stored at 20 °C in the sealed bottles for 90 days to ensure a high hydration degree [24,27].

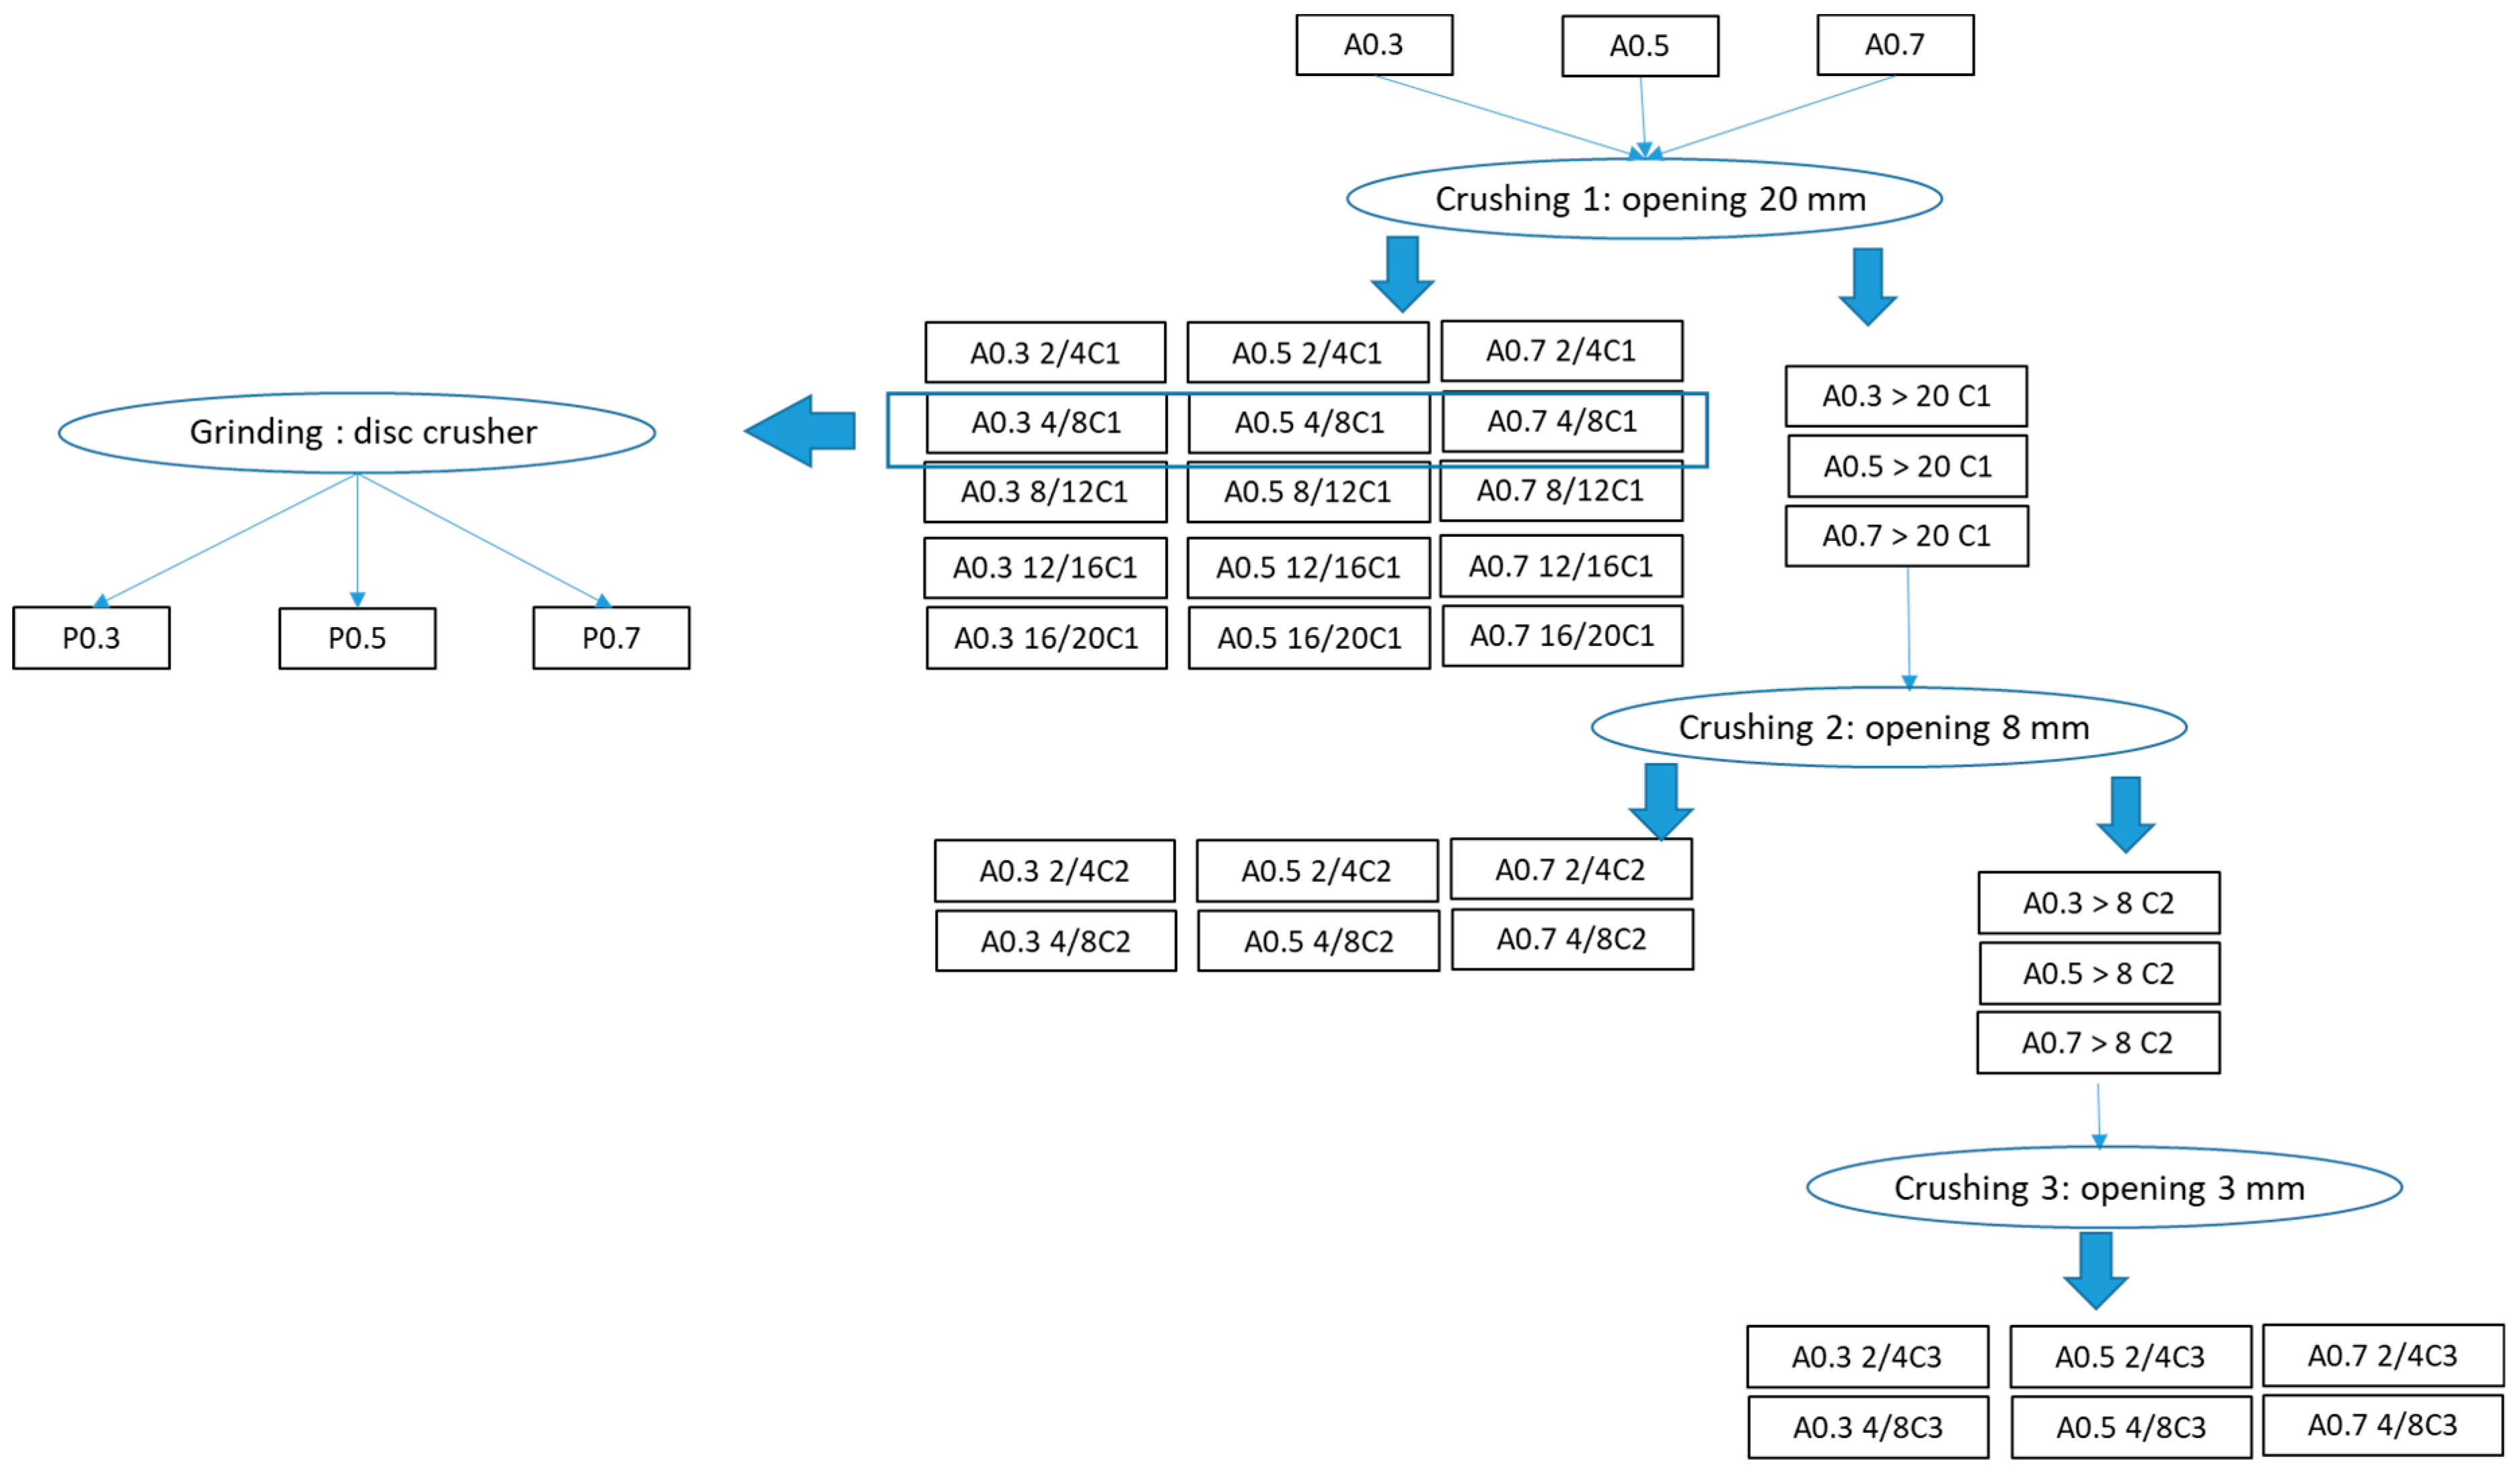
2.2. Crushing Procedure

After the 90 days of curing, the three samples are crushed with a jaw crusher with a 20 mm opening size. The obtained aggregates are sieved underwater in 6 different fractions (larger than 20 mm, 20/16 mm, 16/12.5 mm, 12.5/8 mm, 8/4 mm, and 4/2 mm). The particles lower than 2 mm are not conserved. The aggregates larger than 20 mm are crushed for a second time with the same jaw crusher with an opening size of 8 mm. The aggregates larger than 8 mm produced from the second crushing procedure are crushed for a third time with an opening size of 3 mm. The aggregates obtained after the second and third crushing are then sieved under water in two fractions (8/4 mm and 4/2 mm).
All the prepared samples are dried in an oven at 50 °C. This drying temperature is selected in order to avoid excess drying, which would lead to the partial dehydration of the hydrates and would have an impact on the microstructure of the cement paste [15].
A part of the dried 8/4 mm cement paste obtained after the first crushing is ground with a disc crusher. After that, the powders are sieved to have grains smaller than 0.15 mm.
Figure 1 illustrates the used protocol to manufacture the needed aggregates and powders.

2.3. Characterization Tests

2.3.1. Flakiness Coefficient

The flakiness coefficient (FA) has been measured according to NF-EN 933-3 [28] to characterize the shape of the aggregates of the 4/8 mm fractions. The FA is determined by doing a double dry particle size analysis, using successively and for the same sample of aggregate: first, a standard sieve with a square mesh, and after that, a series of sieves with parallel slots of standard widths.
The test is performed by sieving each granular class by using the parallel slots of sieves and weighing the passersby through each slit. Equation (1) presents the calculation of this coefficient, where M represents the mass of the passersby using the sieves with parallel slots and m the passersby using sieves with a square mesh.
FA = M m

2.3.2. Water Absorption and Kinetics

The water absorption coefficient is determined according to the European standard EN 1097-6 [19]. It involves immersing a dry sample in water to measure the sample mass increase due to the penetration of water into the pores. The WA is calculated according to Equation (2).
WA = M S S D M D M D
MSSD corresponds to the mass of the samples in a saturated surface dry state. This state is obtained after drying the sample progressively with different sheets of colored absorbent paper until no traces of water can be observed on the paper. MD corresponds to the dry mass of the samples at 50 °C.
To assess the WA kinetics, the aggregates, which are dried and divided into 5 fractions, are immersed in water for 1 min, 10 min, 4 h, 24 h, and 7 days. After each period and for each fraction, the WA is measured 3 times.

2.3.3. Mercury Intrusion Porosity

This measurement consists of introducing liquid mercury under pressure into the porosity of a sample. Mercury is a non-wetting fluid; it is necessary to apply an increasing pressure so that it can penetrate the small porosity. The test assumes that the pores have a cylindrical shape of diameter D, and the Washburn equation provides the relation between the pressure (P) and the diameter of the pores (Equation (3)), where γ is the surface tension of mercury (0.485 N/m) and θ is the contact angle (130°) [18]. Depending on the volume of mercury injected, the pore size distribution of the sample can thus be obtained.
D = 4 γ   cos θ / P
A Micromeritics AutoPore IV porosimeter with a mercury pressure between 0 and 200 MPa is used. The latter allows access to pores with a diameter between 500 µm and 7 nm.

2.3.4. Estimation of the Powder Porosity

[21] proposed a model to estimate the intra-granular porosity of powders. The model is based on the particle size distribution (PSD) of the powder and the pore size distribution of the monolith (material before grinding). Equation (4) presents the used equation, where Rj refers to the radius of the grain, ri is the pore radius, ϕ is the initial porosity, xi is the volume fraction of each size of pore, yj corresponds to the volume fraction of each size of grain, and R5% corresponds to the radius of 5% of the passing particles, according to [21]. This radius can be chosen for the limit between the inter- and intra-granular porosity of the powder.
The PSD test is performed with a laser granulometer (Mastersizer 2000) using the Fraunhofer model [24]. Because of the anhydrous particles present in the cement paste, the tests are performed in ethanol instead of water.
ϕ r = ϕ × j = 0 k y j × i = 0 m x i + i = m + 1 n x i × ( 1 3 r i R j + 3 r i R J 2 r i R j 3   )
With
r i < r i + 1 , f o r i = 1   t o   i = n r m < 0.1547 × R 5 %   a n d   r m + 1 0.1547 × R 5 %

3. Results and Discussion

3.1. Water Absorption Kinetics

Figure 2 presents the WA kinetics for the different granular fractions and water to cement ratios. As classically observed [22], the WA coefficient increased with the paste’s water to cement ratio. Concerning the water absorption kinetics, at least two main behavioral regimes could be observed for all the water to cement ratios and particle sizes: (1) after a couple of minutes (1–10 min), the water absorbed increased logarithmically with the immersion time, as is also observed in the literature data [29,30]; and (2) at a shorter immersion time, the water absorbed increased much faster in time.
The absorption kinetics after the first several minutes up to several days (“long term”) were similar for all the samples. In this range of immersion times, the relation with the amount of water absorbed was not changed by the aggregate size, although the water absorption rate increased with the initial water to cement ratios of the samples.
The absorption during the first minutes of immersion (“short term”) and the limit between the two absorption kinetic regimes were significantly influenced by the particle size. Figure 3 presents the WA results after 1 and 10 min of immersion as a function of the particle’s size. The results show that the WA after 1 min of immersion decreased with the particle size. A difference of 30% in saturation is observed between the fractions 20/16 mm and 2/4 mm. By contrast, for the given water to cement ratio paste, the WA in a period of time greater than 10 min is independent on the particle size.
The long-term absorption level had a slight tendency to increase with the particle size. This difference can be attributed to the fact that it is easier to reach the saturated surface dry state (SSS) with large aggregates than with small ones. For the latter, a slight over-drying might occur, leading to a slightly lower WA. However, given the standard deviation of the test, this small variation observed was significant only for the lower initial water to cement ratio of the sample.
It can be concluded in this part that the particle size of the model RCA had a significant impact on the water absorbed during the first minutes of immersion. After this period, the WA reached a high saturation degree and continuously increased with the immersion time, albeit with similar trends between the different aggregate sizes. Moreover, the WA coefficients after 10 min of immersion seem to be independent of the size of the particles as soon as the latter is lower or equal to 8 mm. Therefore, in the following, we have decided to study the WA coefficient after 24 h of immersion for the aggregates 2/4 mm and 4/8 mm.

3.2. Effect of Crushing on the Properties of RCA

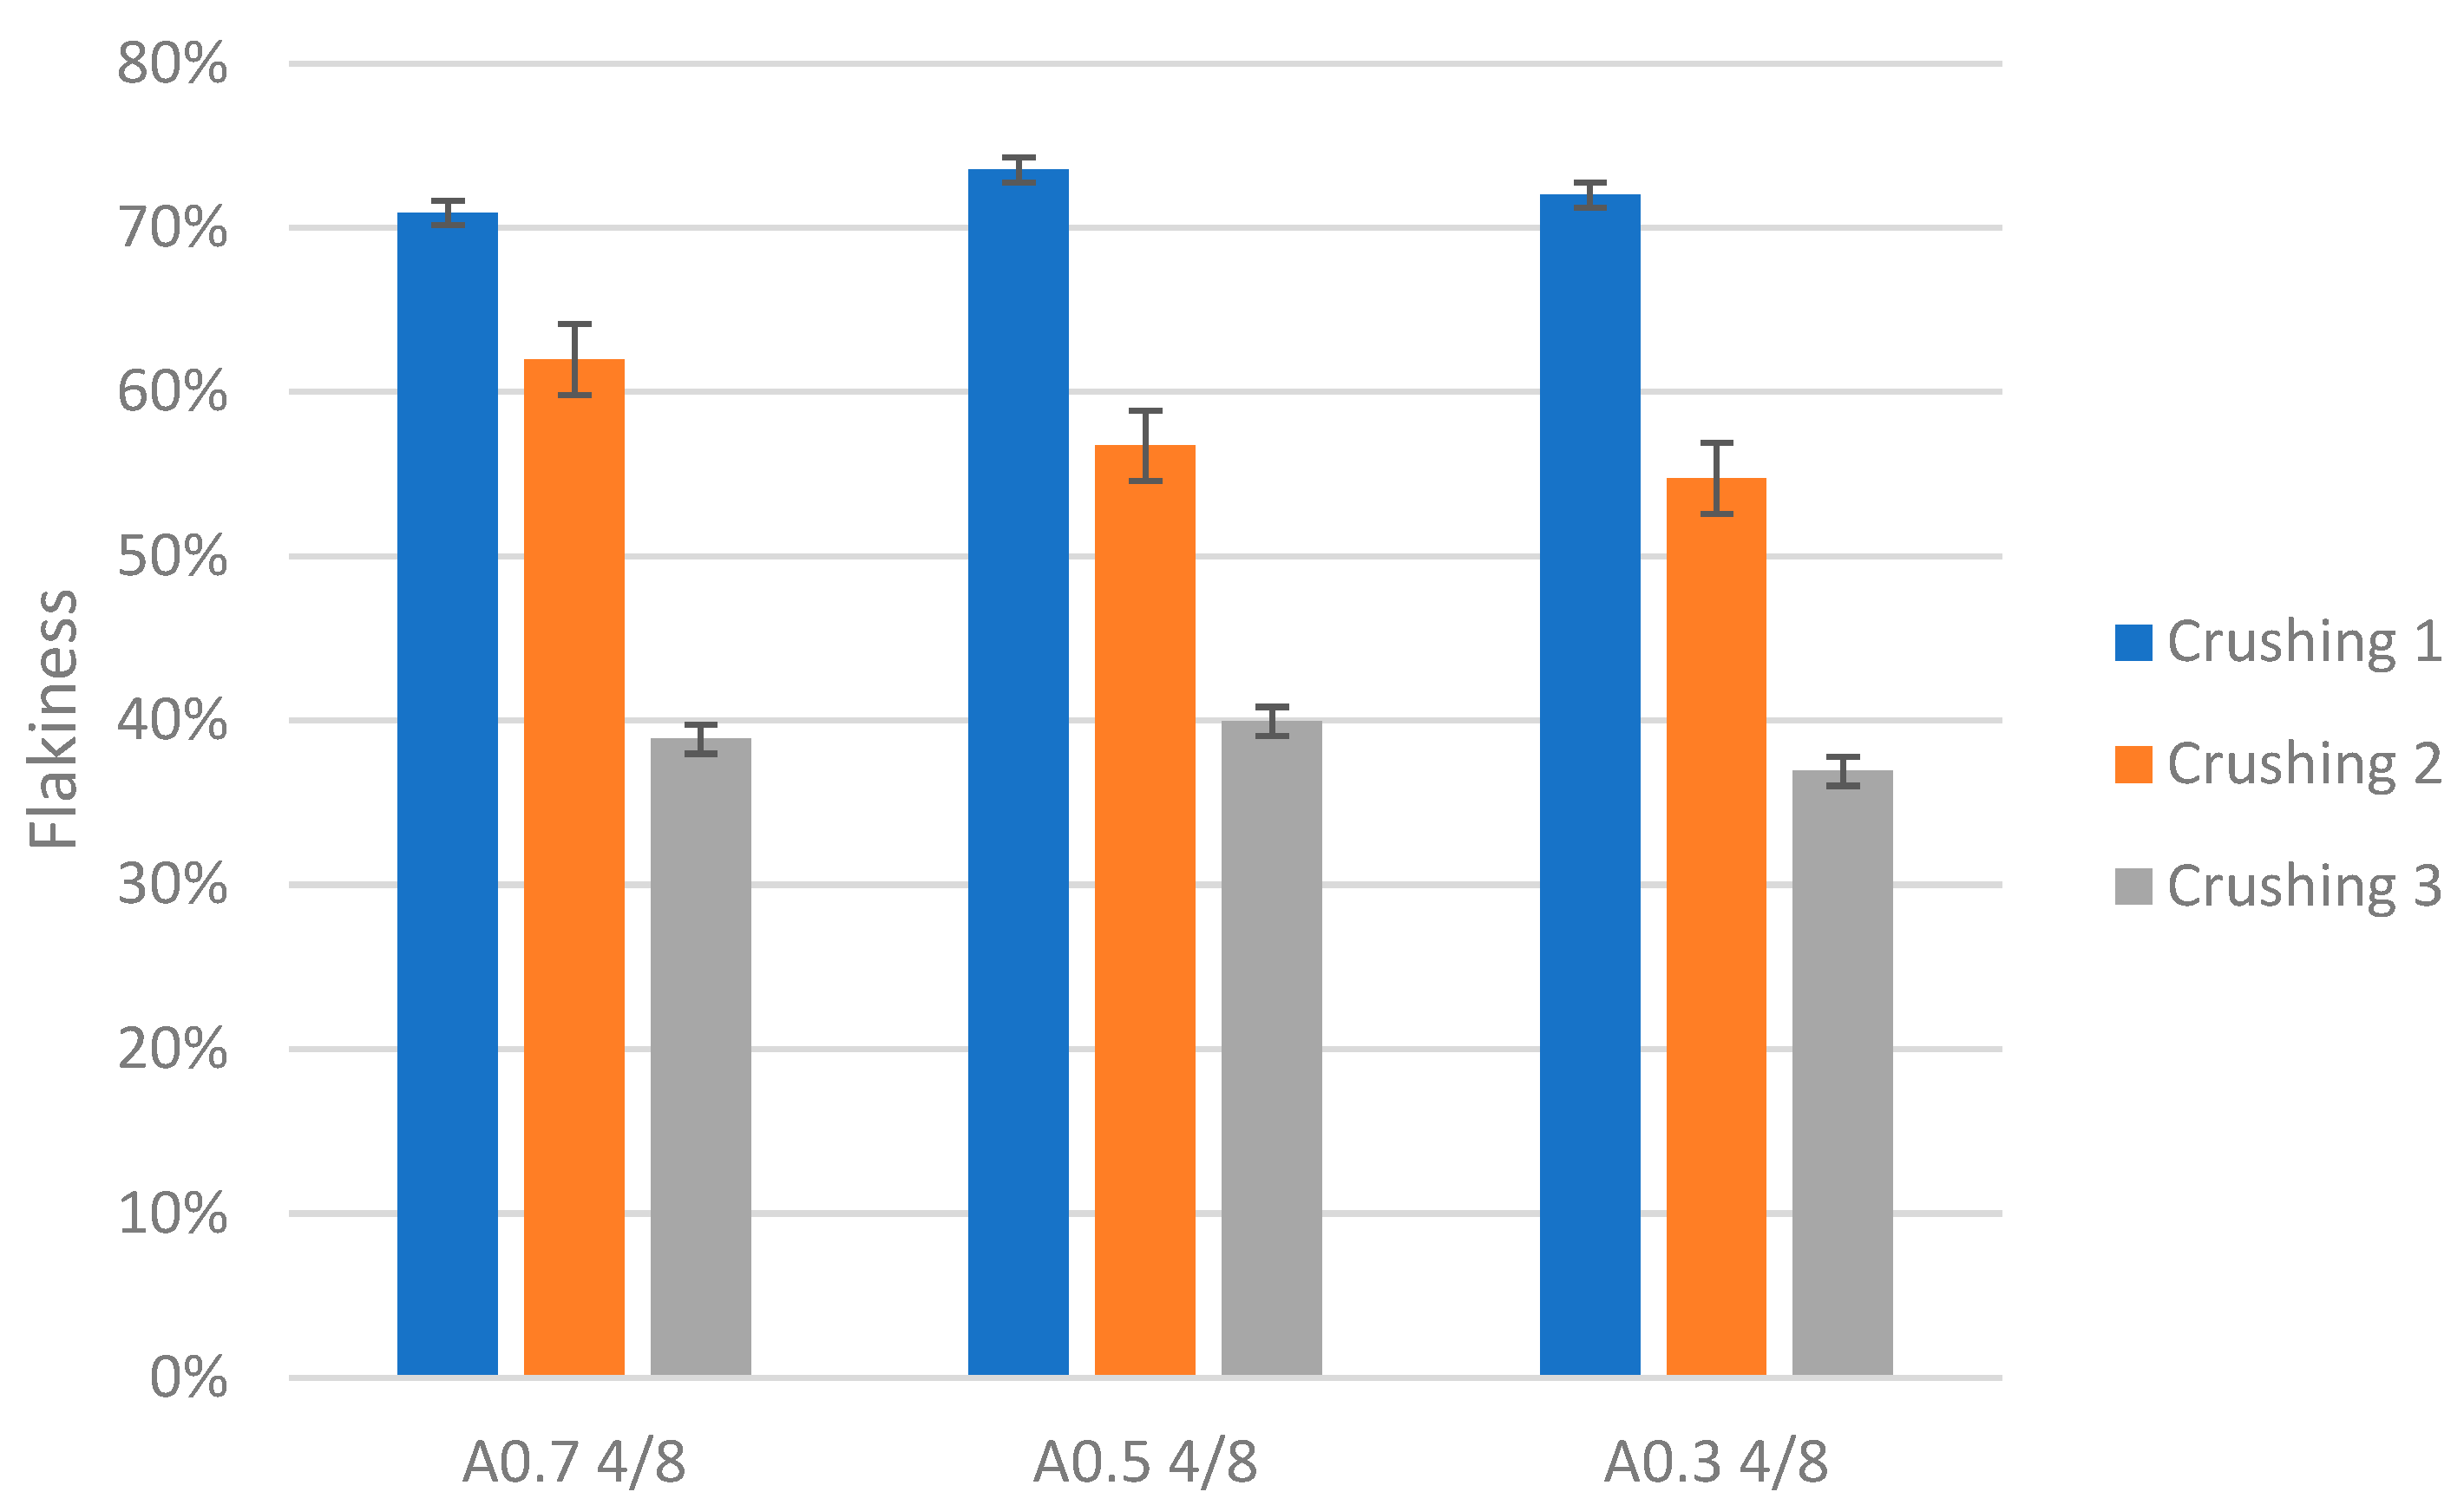
3.2.1. Flakiness Coefficient

It is observed that the successive crushing and grinding procedures impact the morphology of the particles. The flakiness test is performed to verify this observation on the 4/8 mm particles issued from one, two and three crushing procedures.
Figure 4 presents the flakiness coefficient of the 4/8 mm granular fraction obtained after one, two and three crushing stages. The paste water to cement ratio did not influence the effect of the crushing method on the flattening coefficient, which seemed strictly dependent on the crushing process. One can also observe that the successive stages of crushing drastically decreased the flattening coefficient. It is suggested here that a simple empirical model can mainly explain the experimental results. This model assumes that:
  • The used RCAs are composed of isotropic and homogeneous particles;
  • The non-flat particles produce only non-flat sister particles;
  • The flat particles produce about p flat particles and 1 p non-flat particles;
  • The monolith materials (before the crushing procedure) are considered flat particles with FA = 100%.
In this case, the flattening coefficient could be expressed with Equation (5), with n being the number of crunching stages and p being a fitting parameter obtained from the first crushing procedure and found to be equal to 0.74. Within this assumption, the mean deviation between the model prediction and the nine experimental flattening coefficients is of 3%.
F A = p n
It is observed that this very simplified empirical model does not consider the ratio between the opening size of the jaw crusher and the size of the feed particles. This ratio, which is kept relatively constant from one stage of crushing to another in the present tests, probably mostly affects the parameter p. In addition, the model does not consider that the flow regime in the jaw crusher is probably different in the various crushing stages. Indeed, when the feed particles are coarse compared with the size of the jaw hopper, only a few particle–particle interferences occur (“open flow”). The daughter fragments produced by this type of flow are very irregular and are not subsequently modified by the particle bed [29]. For smaller feed particles, the daughter fragments are more regular in shape because of the number of particle–particle interferences.
To finish, the simplified model does not take into account that the flattening coefficient varies inversely with the size of the sub-fragments in the crushed aggregate [30,31]. In the first two crushing steps, the fraction 4/8 mm is smaller than the opening of the crusher. It becomes bigger in the last step (opening of the crusher at 3 mm).

3.2.2. MIP Porosity

Figure 5 presents the total porosity obtained via the MIP test for the 4/8 mm and 2/4 mm fractions and the different water to cement ratios. It is shown that the total MIP porosity increased with the water to cement ratio. This result is in accordance with the one obtained for the WA (Figure 3). The comparison between the porosity of the particles with the same W/C shows that crushing the particles several times did not have a significant impact (considering the standard deviation) on the total porosity.

3.2.3. 24 h Water Absorption

Figure 6 presents the comparison between the 24 h WA of the particles crushed once, twice, and three times. The results show that there is a small difference in the WA (smaller than 1%), which is non-significant because of the accuracy of the SSD assessment.
In this part of the paper, it can be concluded that the crushing procedure does not have a significant impact on the porosity of the particles. However, the opening of the crusher and the successive crushing procedures have a significant impact on the grain morphology.

3.3. Effect of Grinding on the Porosity of Particles

3.3.1. Powder Porosity

The particle size distributions (PSDs) of the powders obtained from the grinding of the three cement pastes are similar, with close values for the diameter of the passing particle at 5% (d5%) and 95% (d95%) (see Figure 7).
The modeling procedure used to estimate the porosity (Equation (4)) was applied to the three powders, before and after grinding. Table 1 presents the results obtained. The porosity after grinding is only slightly lower than the porosity in the monoliths. This result could be explained by the size of the smallest powder grain, which is still 10 times higher than the size of the pores.
In the used model (Equation (4)), the eventual cracks that could be produced by the grinding are not taken into consideration. The cracks that appeared during grinding could, however, increase the porosity and WA of the powders.

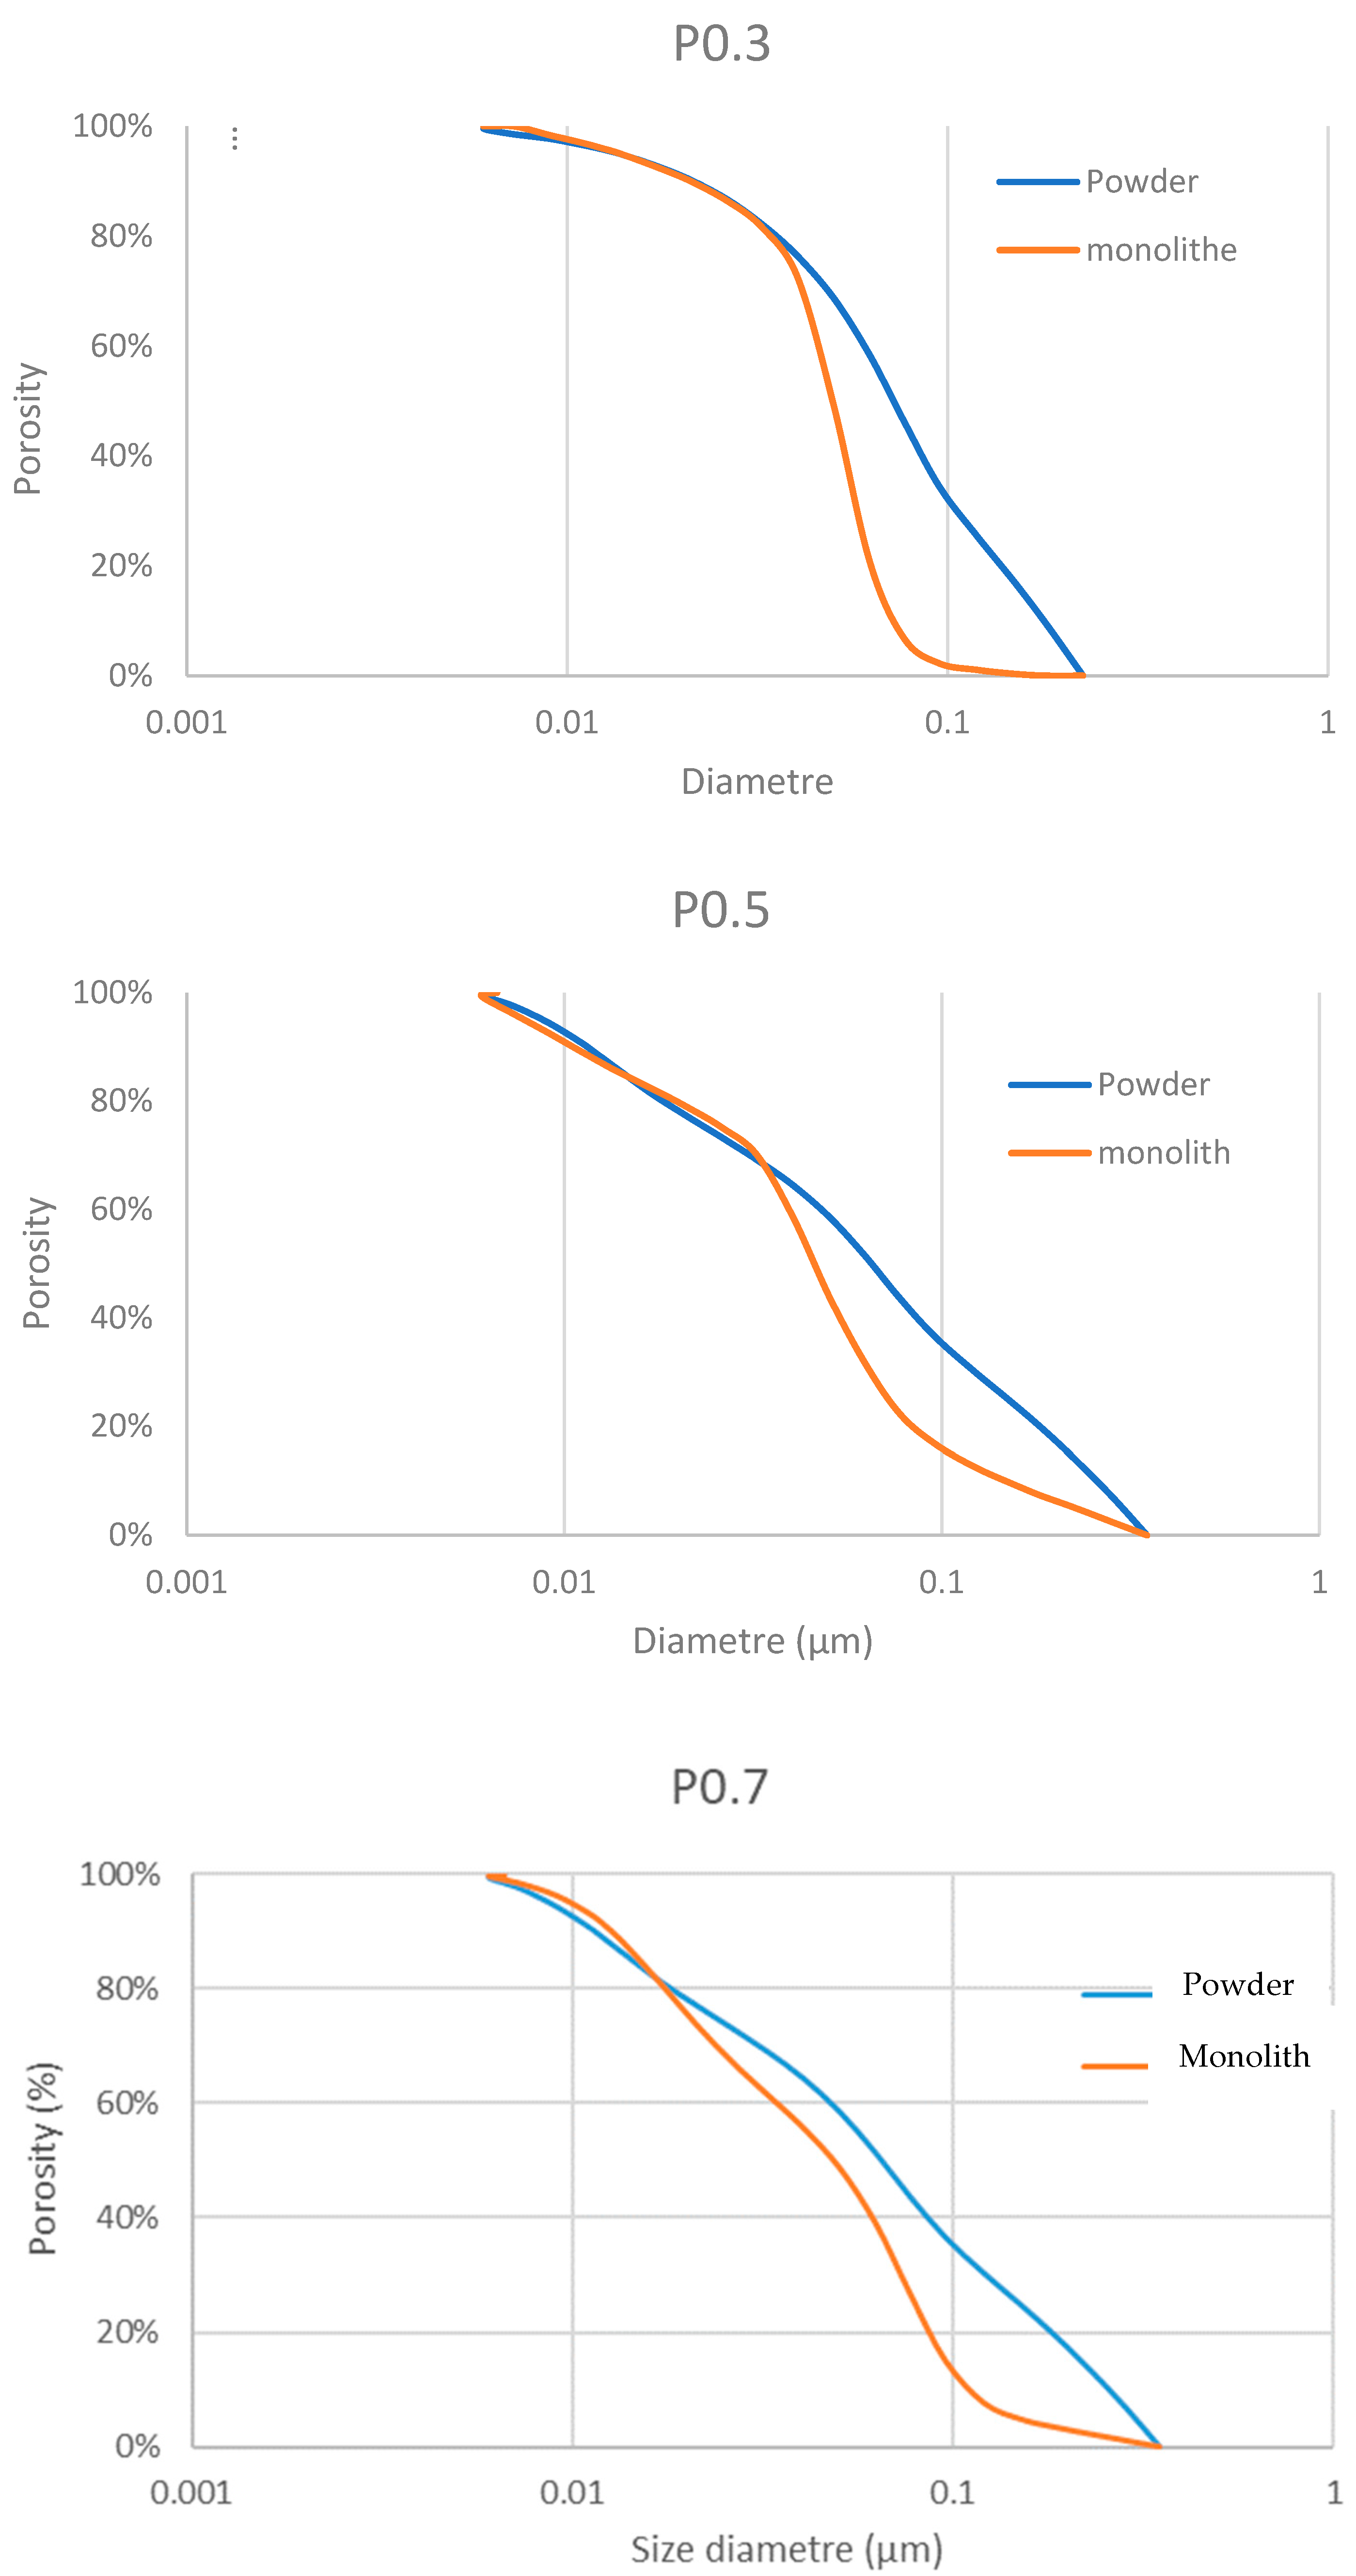
3.3.2. Pore Size Distribution Comparison

MIP analyses have been carried out on both the powder and original monolith material. For the powders, according to [21,32], there are three distinct zones in the resulting MIP curves. The first zone corresponds to the compaction under the mercury pressure increase, going from a random loose to a random close packing [33]. The second zone corresponds to the filling of the inter-granular porosity with mercury. Finally, in the third zone, the intra-granular porosity is filled with mercury. Figure 8 illustrate the results of the MIP test. To correctly interpret the obtained curves, one main difficulty is to define the separation limit between the zones of inter- and intra-granular porosity. [21] proposed defining this separation with three neighboring particles in a packing of mono-size spherical grains of radius R, which does not take into account any grain surface roughness. As explained by [21], the smallest pore of the packing corresponds to a bottleneck that has a diameter smaller than 0.1547 × d5%, where d5%, as defined in the previous section, is considered the size of the smallest grain.
A comparison is performed between the pore size distribution of the intra-granular porosity (third part of the MIP results) of the powders and the one of the monolith materials. Figure 9 presents the results obtained for the different pastes. For the small pore sizes, up to 0.03 µm for P0.3 and P0.5 and up to 0.017 µm for P0.7, the monolith and powder pore size distributions are very close to each other. The size of the pores corresponds approximately to the size of the surface roughness of a cement paste [34]. For the larger pore sizes, the powders’ porosity was systematically larger than the monoliths. The larger porosity at this size of the powders could be attributed either to cracks or changes in the surface roughness created during the grinding procedure.
Some researchers [33,35] worked on the geometrical roughness of cement paste. They used coherence scanning interferometry (CSI) and scanning confocal microscopy (SCM) in the surface reconstructions. The authors showed that the larger part of the surface roughness is smaller than 1 µm. Figure 9 illustrates the filling of a particle with mercury for a pressure that corresponds to a size of pore less than and greater than 0.1547 R. This illustration shows the difficulty of making the separation between the intra-granular porosity and that located at grain’s surface due to the roughness (which corresponds to the inter-granular porosity).
In the model of [21], an arbitrary limit radius has been defined between the inter- and intra-granular porosity of the powder. This limit has been estimated from the intergranular porosity between three touching spherical particles with a small radius (corresponding to R5% of the powder’s PSD). In reality, the particles obtained from the grinding of hard cement paste are not spherical, and they do not have a smooth surface neither. In particular, the surface asperities of the ground particles should be considered as inter-granular porosity (where they are considered as intra-granular porosity in the model as soon as they are smaller than the limit radius). The model therefore overestimates the intra-granular porosity for non-smooth non-spherical particles.
In Figure 9, it is observed that for pore sizes up to 0.03 µm for P0.3 and P0.5 and 0.017 µm for P0.7, the same pore size distribution is obtained between the powders and the corresponding monoliths. The only pore sizes for which differences are observed are those for which a large uncertainty exists concerning the separation between the inter- and intra-granular porosities. It is therefore most probable that the differences observed between the porosities of the powders and those of the monoliths are due more to the arbitrary limit radius of the model than to a modification of the intra-granular porosity of the powder itself.

4. Conclusions

Hardened cement pastes with three different water to cement ratios have been produced and used as model RCAs. The latter have been crushed and ground to study the effects of multiple crushing and grinding operations on the RCAs’ properties. The following conclusions have been drawn:
  • First, the water absorption kinetics have been studied as a function of the particle size for the model RCAs produced from the three different hard cement pastes after a single crushing operation. The results show that the WA before 1 min of immersion under water is higher when the particle size decreases. For longer immersion times, the kinetics are not affected by the particle size. It is also observed for long-term immersion that the WA has a slight tendency to increase with the particle size. This difference is attributed to the saturated surface dry state (SSS) measurement, which is much easier to reach with large aggregates than with small ones. Thus, it can be concluded that for particles lower than 8 mm, the size does not have an impact on the WA.
  • The properties of particles larger than 2 mm and lower than 8 mm produced with different crushing cycles are then compared. It is shown that the morphology of the grains is affected by the opening of the crusher, where the bigger the opening size of the crusher, the flatter the particles are.
  • The grinding procedure concerns particles smaller than 150 µm. The porosity estimation is obtained with the model proposed by Bouarroudj et al. [21]. MIP has been used on the three powders and the pore size distributions have been compared with the one of the monoliths (material before grinding). The results first show a zone (up to 0.03 µm for P0.3 and P0.5 and up to 0.017 µm for P0.7) where no difference is obtained between the powder and the monolith and a second zone where a difference is observed. This difference is more attributed to a change in the surface roughness of the particles than to a change in the porosity.
Based on these results, it can be concluded that successive crushing and grinding does not significantly impact the porosity of the cement paste present in the recycled concrete aggregate. This means that the crushing and grinding intensity have not a significant impact on the properties of the produced recycled materials (aggregate and mineral additions).

Author Contributions

Conceptulization, M.E.B.; methodology, M.E.B., S.R., B.C., G.P. and D.B.; Writing, M.E.B. and S.R.; original draft preparation, M.E.B.; data draft, M.E.B. and G.P.; review and editing, S.R., B.C., L.C. and D.B. All authors have read and agreed to the published version of the manuscript.

Funding

This research work has been carried out in the frame of the VALDEM project (convention n°1.1.57 of Interreg France-Wallonie-Vlaanderen 2014–2020), partly financed by the European Regional Development Funds and Wallonia.

Data Availability Statement

If readers require data from this article, please contact the corresponding author.

Conflicts of Interest

The authors declare no conflict of interest.

References

  1. Delvoie, S.; Zhao, Z.; Michel, F.; Courard, L. State of the Art on Recycling Techniques for the Production of Recycled Sands and Aggregates from Construction and Demolition Wastes. In Proceedings of the Mid-Term Conference SeRaMCo, Luxembourg, 28–29 November 2018; pp. 28–30. [Google Scholar]
  2. Pn, R. Complete Recycling of Concrete. 2012. Available online: http://www.pnrecybeton.fr/ (accessed on 18 July 2023).
  3. Evangelista, L.; de Brito, J. Durability performance of concrete made with fine recycled concrete aggregates. Cem. Concr. Compos. 2010, 32, 9–14. [Google Scholar] [CrossRef]
  4. Bouarroudj, M.E. Utilisation de Matériaux Naturels Modèles Pour la Formulation de Mortier Contenant des Sables et des Fines de Granulats Recyclés. Ph.D. Thesis, Université de Liège, Liège, Belgium, 2019. [Google Scholar]
  5. Omary, S.; Ghorbel, E.; Wardeh, G.; Nguyen, M.D. Mix Design and Recycled Aggregates Effects on the Concrete’s Properties. Int. J. Civ. Eng. 2017, 8, 973–992. [Google Scholar] [CrossRef]
  6. Evangelista, L.; de Brito, J. Mechanical behaviour of concrete made with fine recycled concrete aggregates. Cem. Concr. Compos. 2007, 29, 397–401. [Google Scholar] [CrossRef]
  7. Bordy, A.; Younsi, A.; Aggoun, S.; Fiorio, B. Cement substitution by a recycled cement paste fine: Role of the residual anhydrous clinker. Constr. Build. Mater. 2017, 132, 1–8. [Google Scholar] [CrossRef]
  8. Oksri-Nelfia, L.; Mahieux, P.Y.; Amiri, O.; Turcry, P.; Lux, J. Reuse of recycled crushed concrete fines as mineral addition in cementitious materials. Mater. Struct. 2016, 49, 3239–3251. [Google Scholar] [CrossRef]
  9. Bouarroudj, M.E.; Rémond, S.; Bulteel, D.; Potier, G.; Michel, F.; Zhao, Z.; Courard, L. Use of grinded hardened cement pastes as mineral addition for mortars. J. Build. Eng. 2020, 34, 101863. [Google Scholar] [CrossRef]
  10. Diliberto, C.; Lecomte, A.; Mechling, J.M.; Izoret, L.; Smith, A. Valorisation of recycled concrete sands in cement raw meal for cement production. Mater. Struct. 2017, 50, 127. [Google Scholar] [CrossRef]
  11. Krour, H.; Trauchessec, R.; Lecomte, A.; Diliberto, C.; Barnes-Davin, L.; Bolze, B.; Delhay, A. Incorporation rate of recycled aggregates in cement raw meals. Constr. Build. Mater. 2020, 248, 118217. [Google Scholar] [CrossRef]
  12. Evangelista, L.; Guedes, M.; De Brito, J.; Ferro, A.C.; Pereira, M.F. Physical, chemical and mineralogical properties of fine recycled aggregates made from concrete waste. Constr. Build. Mater. 2015, 86, 178–188. [Google Scholar] [CrossRef]
  13. Omary, S.; Ghorbel, E.; Wardeh, G. Relationships between recycled concrete aggregates characteristics and recycled aggregates concretes properties. Constr. Build. Mater. 2016, 108, 163–174. [Google Scholar] [CrossRef]
  14. Bulteel, D.; Courard, L.; Remond, A.L.S.; Groslambert, S.; Zhao, Z.; Bouarroudj, M.; Colman, C. Transfert Technologique Interreg VALDEM, Repport. 2020. Available online: www.valdem-interreg.eu/fr (accessed on 18 July 2023).
  15. Silva, R.V.; de Brito, J.; Dhir, R.K. Availability and processing of recycled aggregates within the construction and demolition supply chain: A review. J. Clean. Prod. 2017, 143, 598–614. [Google Scholar] [CrossRef]
  16. Rompaey, V. Etude de la Réactivité des Ciment Riches en Laitier, à Basse Température et à Temps Court, sans Ajout Chloruré. Ph.D. Thesis, Université Libre de Bruxelles (ULB), Brussels, Belgium, 2013. [Google Scholar]
  17. De Larrard, F. Structures Granulaires et Formulation des Bétons, Etudes et Recherches des Laboratoires des Ponts et Chaussées, OA 34. 2000, p. 414. Available online: http://www.concretonline.com/pdf/00hormigon/art_tec/docu_ref01.pdf (accessed on 20 February 2023).
  18. Daïan, J. Porométrie au Mercure. Le Modèle XDQ. Ph.D. Thesis, Université Joseph Fourier, Grenoble, France, 2007. [Google Scholar]
  19. EN 1097-6:2013; Tests for Mechanical and Physical Properties of Aggregates—Part 6: Determination of Particle Density and Water Absorption. CEN: Brussels, Belgium, 2013.
  20. Test Methode No.78; Tests on Granulats in Concrte: Measurment of Total Water Absorption of Crushed Sand. IFSTTAR: Paris, France, 2011.
  21. Bouarroudj, M.E.; Rémond, S.; Grellier, A.; Bulteel, D.; Michel, F.; Zhao, Z.; Courard, L. Intra granular porosity of mineral powders: Modeling and experimentation. Mater. Struct. 2021, 54, 88. [Google Scholar] [CrossRef]
  22. Zhao, Z.; Remond, S.; Damidot, D.; Xu, W. Influence of hardened cement paste content on the water absorption of fine recycled concrete aggregates. J. Sustain. Cem. Based Mater. 2013, 2, 186–203. [Google Scholar] [CrossRef]
  23. Neville, A. Properties of Concrete, Computational Modelling of Concrete Structures, 5th ed.; Pearson: London, UK, 1988; 350p. [Google Scholar] [CrossRef]
  24. Cyr, M. Contribution à la Caractérisation des Fines Minérales et à la Compréhension de Leur Rôle Joué dans le Comportement Rhéologique des Matrices Cimentaires. Ph.D. Thesis, Université Sherbrook et Insa de Toulouse, Toulouse, France, 1999. [Google Scholar]
  25. Bentz, D.P. Quantitative comparison of real and CEMHYD3D model microstructures using correlation functions. Cem. Concr. Res. 2006, 36, 259–263. [Google Scholar] [CrossRef]
  26. EN 197-1:2012; Cement—Part 1: Composition, Specifications and Conformity Criteria for Common Cements. CEN: Brussels, Belgium, 2012.
  27. Frías, M.; Cabrera, J. Pore size distribution and degree of hydration of metakaolin-cement pastes. Cem. Concr. Res. 2000, 30, 561–569. [Google Scholar] [CrossRef]
  28. EN 933-3:2012; Test for the Caracterisation of the Aggregate Geometre—Part 3: Flakiness Coefficient. CEN: Brussels, Belgium, 2012.
  29. Durney, T.E.; Meloy, T.P. Particle shape effects due to crushing method and size. Int. J. Miner. Process. 1986, 16, 109–123. [Google Scholar] [CrossRef]
  30. Gaudin, A.M. Principles of Mineral Dressing; McGraw-Hill: New York, NY, USA, 1939. [Google Scholar]
  31. Bouquety, M.N.; Descantes, Y.; Barcelo, L.; De Larrard, F.; Clavaud, B. Experimental study of crushed aggregate shape. Constr. Build. Mater. 2007, 21, 865–872. [Google Scholar] [CrossRef]
  32. Guerin, E.; Tchoreloff, P.; Leclerc, B.; Tanguy, D.; Deleuil, M.; Couarraze, G. Rheological characterization of pharmaceutical powders using tap testing, shear cell and mercury porosimeter. Int. J. Pharm. 1999, 189, 91–103. [Google Scholar] [CrossRef]
  33. Rémond, S. Compaction of confined mono-sized spherical particle systems under symmetric vibration: A suspension model. Phys. A Stat. Mech. Its Appl. 2004, 337, 411–427. [Google Scholar] [CrossRef]
  34. Apedo, K.L.; Montgomery, P.; Serres, N.; Fond, C.; Feugeas, F. Geometrical roughness analysis of cement paste surfaces using coherence scanning interferometry and confocal microscopy. Mater. Charact. 2016, 118, 212–224. [Google Scholar] [CrossRef]
  35. Apedo, K.L.; Munzer, C.; He, H.; Montgomery, P.; Serres, N.; Fornd, C.; Feugeas, F. Cement paste surface roughness analysis using coherence scanning interferometry and confocal microscopy. Mater. Charact. 2015, 100, 108–119. [Google Scholar] [CrossRef]
Figure 1. Illustration of the used procedure to manufacture the materials. “A” stands for aggregate type, “C” for crushing and “P” for powder.
Buildings 13 02319 g001
Figure 2. WA results obtained for the different samples. The standard deviation is calculated from 3 tests and is equal to 0.3%.
Buildings 13 02319 g002
Figure 3. WA results obtained for 1 and 10 min of saturation.
Buildings 13 02319 g003
Figure 4. Flakiness test results for the granular fraction 4–8 mm.
Buildings 13 02319 g004
Figure 5. Porosity results for the 2/4 mm and 4/8 mm fractions crushed once, twice, and three times.
Buildings 13 02319 g005
Figure 6. Water absorption results for the 2/4 mm and 4/8 mm fractions crushed once, twice, and three times.
Buildings 13 02319 g006
Figure 7. Particle size distribution of powder. D5% of P0.7, P0.5 and P0.3 are, respectively, 2.65 µm, 2.2 µm and 2.1 µm.
Buildings 13 02319 g007
Figure 8. Illustration of MIP test on powder. VCompacting corresponds to the compaction going from random loose to random close packing. Vinter corresponds to the filling of inter-granular porosity and Vintra correspond to the filling of intra-granular porosity. Vinjec is the injected volume of mercury as a function of the pressure P. [21].
Buildings 13 02319 g008
Figure 9. The porosity percentage distribution comparison between the powder and monolith.
Buildings 13 02319 g009
Table 1. Porosity results of the powder using the model.
MonolithPowder
P0.312.6%11.3%
P0.524.0%22.4%
P0.737.0%34.9%
Disclaimer/Publisher’s Note: The statements, opinions and data contained in all publications are solely those of the individual author(s) and contributor(s) and not of MDPI and/or the editor(s). MDPI and/or the editor(s) disclaim responsibility for any injury to people or property resulting from any ideas, methods, instructions or products referred to in the content.

