Article

Analysis and Comparison of the Infrastructure Report Cards as a Decision Making Tool for Sustainable Development

by
David Boix-Cots
1,*,
Francesc Pardo-Bosch
2,3 and
Pablo Pujadas
2,3
1
Department of Civil and Environmental Engineering, Universitat Politècnica de Catalunya · BarcelonaTech (UPC), C/Jordi Girona 1-3, 08034 Barcelona, Spain
2
Department of Project and Construction Engineering, Universitat Politècnica de Catalunya · BarcelonaTech (UPC), Av. Diagonal 647, 08028 Barcelona, Spain
3
Group of Construction Research and Innovation (GRIC), C/Colom, 11, Ed. TR5, 08222 Terrassa, Spain
*
Author to whom correspondence should be addressed.
Buildings 2023, 13(9), 2166; https://doi.org/10.3390/buildings13092166
Submission received: 31 July 2023 / Revised: 23 August 2023 / Accepted: 24 August 2023 / Published: 26 August 2023
(This article belongs to the Special Issue Advances in Sustainable and Smart Cities)

Abstract

:
Infrastructure plays a pivotal role in a nation’s economic and societal progress. However, due to the substantial expenses and the constraints of a limited government budget, the need to assess the condition of each infrastructure and identify those requiring utmost attention has become imperative. To address the challenge of assessing and prioritizing infrastructure, national civil engineering associations have developed infrastructure report cards (IRCs) following diverse methodologies. The objective of this paper is to present and compare the existing IRCs, analysing their key characteristics and comparing them through the developed comparison guidelines. The findings offer valuable insights into IRCs, encompassing general knowledge, diverse practices, and areas for improvement. Furthermore, it provides guidance to civil engineering associations in nations lacking an infrastructure report card, as well as to governments and national infrastructure planners. Recommendations highlight the importance of government collaboration without direct control, transparent methodology explanations, and accessible results presentation. Enhancing IRCs based on these recommendations can facilitate structured, rational, realistic, and sustainability-based decision making. The study acknowledges limitations, including the challenge of assessing IRCs’ real impact and the limited dataset. Despite these limitations, this paper provides a crucial step toward improving IRCs and fostering informed infrastructure decisions.

1. Introduction

Infrastructure construction stands as one of the most paramount and fundamental catalysts for prosperity, representing a vital economic and social impetus for sustained growth and a true enabler of a nation’s competitiveness. Numerous studies attest to the substantial and positive impact of infrastructure on output, productivity, and long-term growth rates [1,2,3]. For example, the World Economic Forum [4] states that, in the United States, an additional 1% of real gross domestic product invested in infrastructure could lead to an economic expansion by a factor of 1.2.
These allocations, contingent upon the properties and priorities of each country’s infrastructure, play a pivotal role and are divided between new projects and the maintenance of the national infrastructure stock. For instance, the American Society of Civil Engineers [5] highlights that failing to fund and repair the aging infrastructure in the United States would result in a decline of USD 10 trillion in gross domestic product, the loss of over 3 million jobs, and a USD 2.4 trillion increase in exportation costs, leading to an annual household loss of USD 3300. These figures are not unique to the United States; the World Bank Group [6] estimates that, by 2040, developing and developed markets will require an investment of approximately USD 94 trillion to bridge the global financing gap. Therefore, while infrastructure investments typically receive significant budget allocations [7], governments must increase their investment in infrastructure [4]. The magnitude of these investments can have profound economic, environmental, and social ramifications due to the extensive number of people directly and indirectly affected, necessitating careful consideration by decisionmakers to maximise the return on public funds. As the disparity between available funds and investment needs continues to widen, identifying the most sustainable allocation of resources becomes an essential endeavour.
However, many face stringent constraints and limited resources, exacerbating the challenge of allocating public investments to infrastructure projects, which has become a significant national issue. Currently, there is not a universally accepted and transparent methodology that incorporates not only financial information but also environmental and social aspects, technical and scientific data, ethical and political concerns, and stakeholder interests [8] to address the complex, multifaceted, and crucial question of determining the necessary investment and prioritizing infrastructure projects. Allocations are often based on political interests, electoral outcomes, or mere cost–benefit analyses [9] rather than dedicated methods for prioritizing the public [10], resulting in inefficiencies that deliver less value to citizens than intended [11,12,13,14].
Nonetheless, in recent years, a methodology has gained traction among international societies of civil engineers to shed light on national infrastructure prioritization. This methodology, known as the infrastructure report card (IRC), is based on a national infrastructure assessment, with the results communicated through a report card to enhance citizen understanding. This concept originated in the United States in 1988 with the congressionally chartered National Council on Public Works Improvement report titled “Fragile Foundations: A Report on America’s Public Works” [15]. Its vision was to facilitate knowledge transfer from civil engineers to society and governments [16] in order to address the communication gap, stimulate policy responses [17,18,19,20,21,22], reduce information asymmetry among stakeholders, and enhance governmental accountability, innovation diffusion, and national competitiveness [21]. These reports are typically published during economic crises [23,24,25,26].
The development and implementation of these IRCs present a remarkable opportunity to use them as decision making tools for promoting sustainable development and attaining sustainable infrastructure objectives [27]: (i) by identifying infrastructure gaps, as infrastructure report cards assess the condition and performance of various infrastructure sectors, highlighting areas that require attention and investment. Decisionmakers can prioritise investments and allocate resources effectively to address critical needs and promote sustainable development. Furthermore, IRCs provide guiding resource allocation, helping to allocate resources more effectively by identifying priority areas and projects. (ii) Informing strategic planning, as the information provided in IRCs can inform long-term strategic planning for infrastructure development. Decisionmakers can use the report card findings to identify areas where sustainable infrastructure is lacking and incorporate these considerations into their planning processes. (iii) Promoting stakeholder engagement, as IRCs involve the participation of various stakeholders, including engineering professionals and policymakers, and are prepared to inform the citizens. The engagement process fosters collaboration and dialogue among stakeholders, leading to a better understanding of infrastructure challenges and potential solutions. Furthermore, IRCs promote transparency and inclusivity in the decision making processes.
While the works on this topic are limited, these IRCs have spurred some studies. For instance, their outcomes have been utilized to promote assessments of airport asset surfaces [28], new measurement systems for bridge evaluation [29] or water distribution networks [30], risk analyses for water infrastructure failure [31], and prioritization methods for subway investments based on functional failure impacts [32]. Other publications have focused on how an evaluation has been conducted [33], opinions about IRCs themselves [34], or comparisons related to policy actions and their resulting outcomes [35].
Nevertheless, no study has presented and compared these documents. The existence of numerous national civil engineering associations conducting their IRCs with distinct methodological frameworks has led to a wide spectrum of examined sectors, evaluation approaches, and presentation formats, resulting in significant variations among them.
The comparison and analysis of these diverse attributes and methods can offer practitioners and researchers invaluable knowledge to advance more efficient and comprehensive infrastructure assessment tools. This, in turn, can enhance decision making processes and guide strategic planning for sustainable infrastructure development. Furthermore, such understanding can empower practitioners and researchers to gain insights into best practices, identify potential gaps or limitations in existing IRCs, and explore opportunities for improvement.
Considering this evident gap in the literature, the primary objective of this paper is to present and compare the currently available IRCs, providing professionals and researchers with crucial insights into the distinctive characteristics of these assessments. The distinctive novelty of this study is that it bridges the knowledge void by offering a review of IRCs, highlighting their varying methodologies, criteria, and presentation styles, and thereby contributing to a deeper understanding of their role in infrastructure management.
The paper is structured as follows: the subsequent section outlines the methodology employed. Section 3 presents each IRC individually. Section 4 offers a comparison and discussion of these IRCs. Finally, the concluding section presents a general summary.

2. Materials and Methods

This section presents the methodology employed to conduct the comparative analysis of the existing IRCs, as depicted in Figure 1. As depicted in the figure, the initial phase focuses on the collection of the IRCs, constituting the first step of identification. The second phase involves presenting the IRCs, following a framework generated through a meticulous examination of the collected documents and the identification of suitable comparison parameters. Lastly, phase 3 encompasses the actual comparison, employing the selected parameters and guidelines.

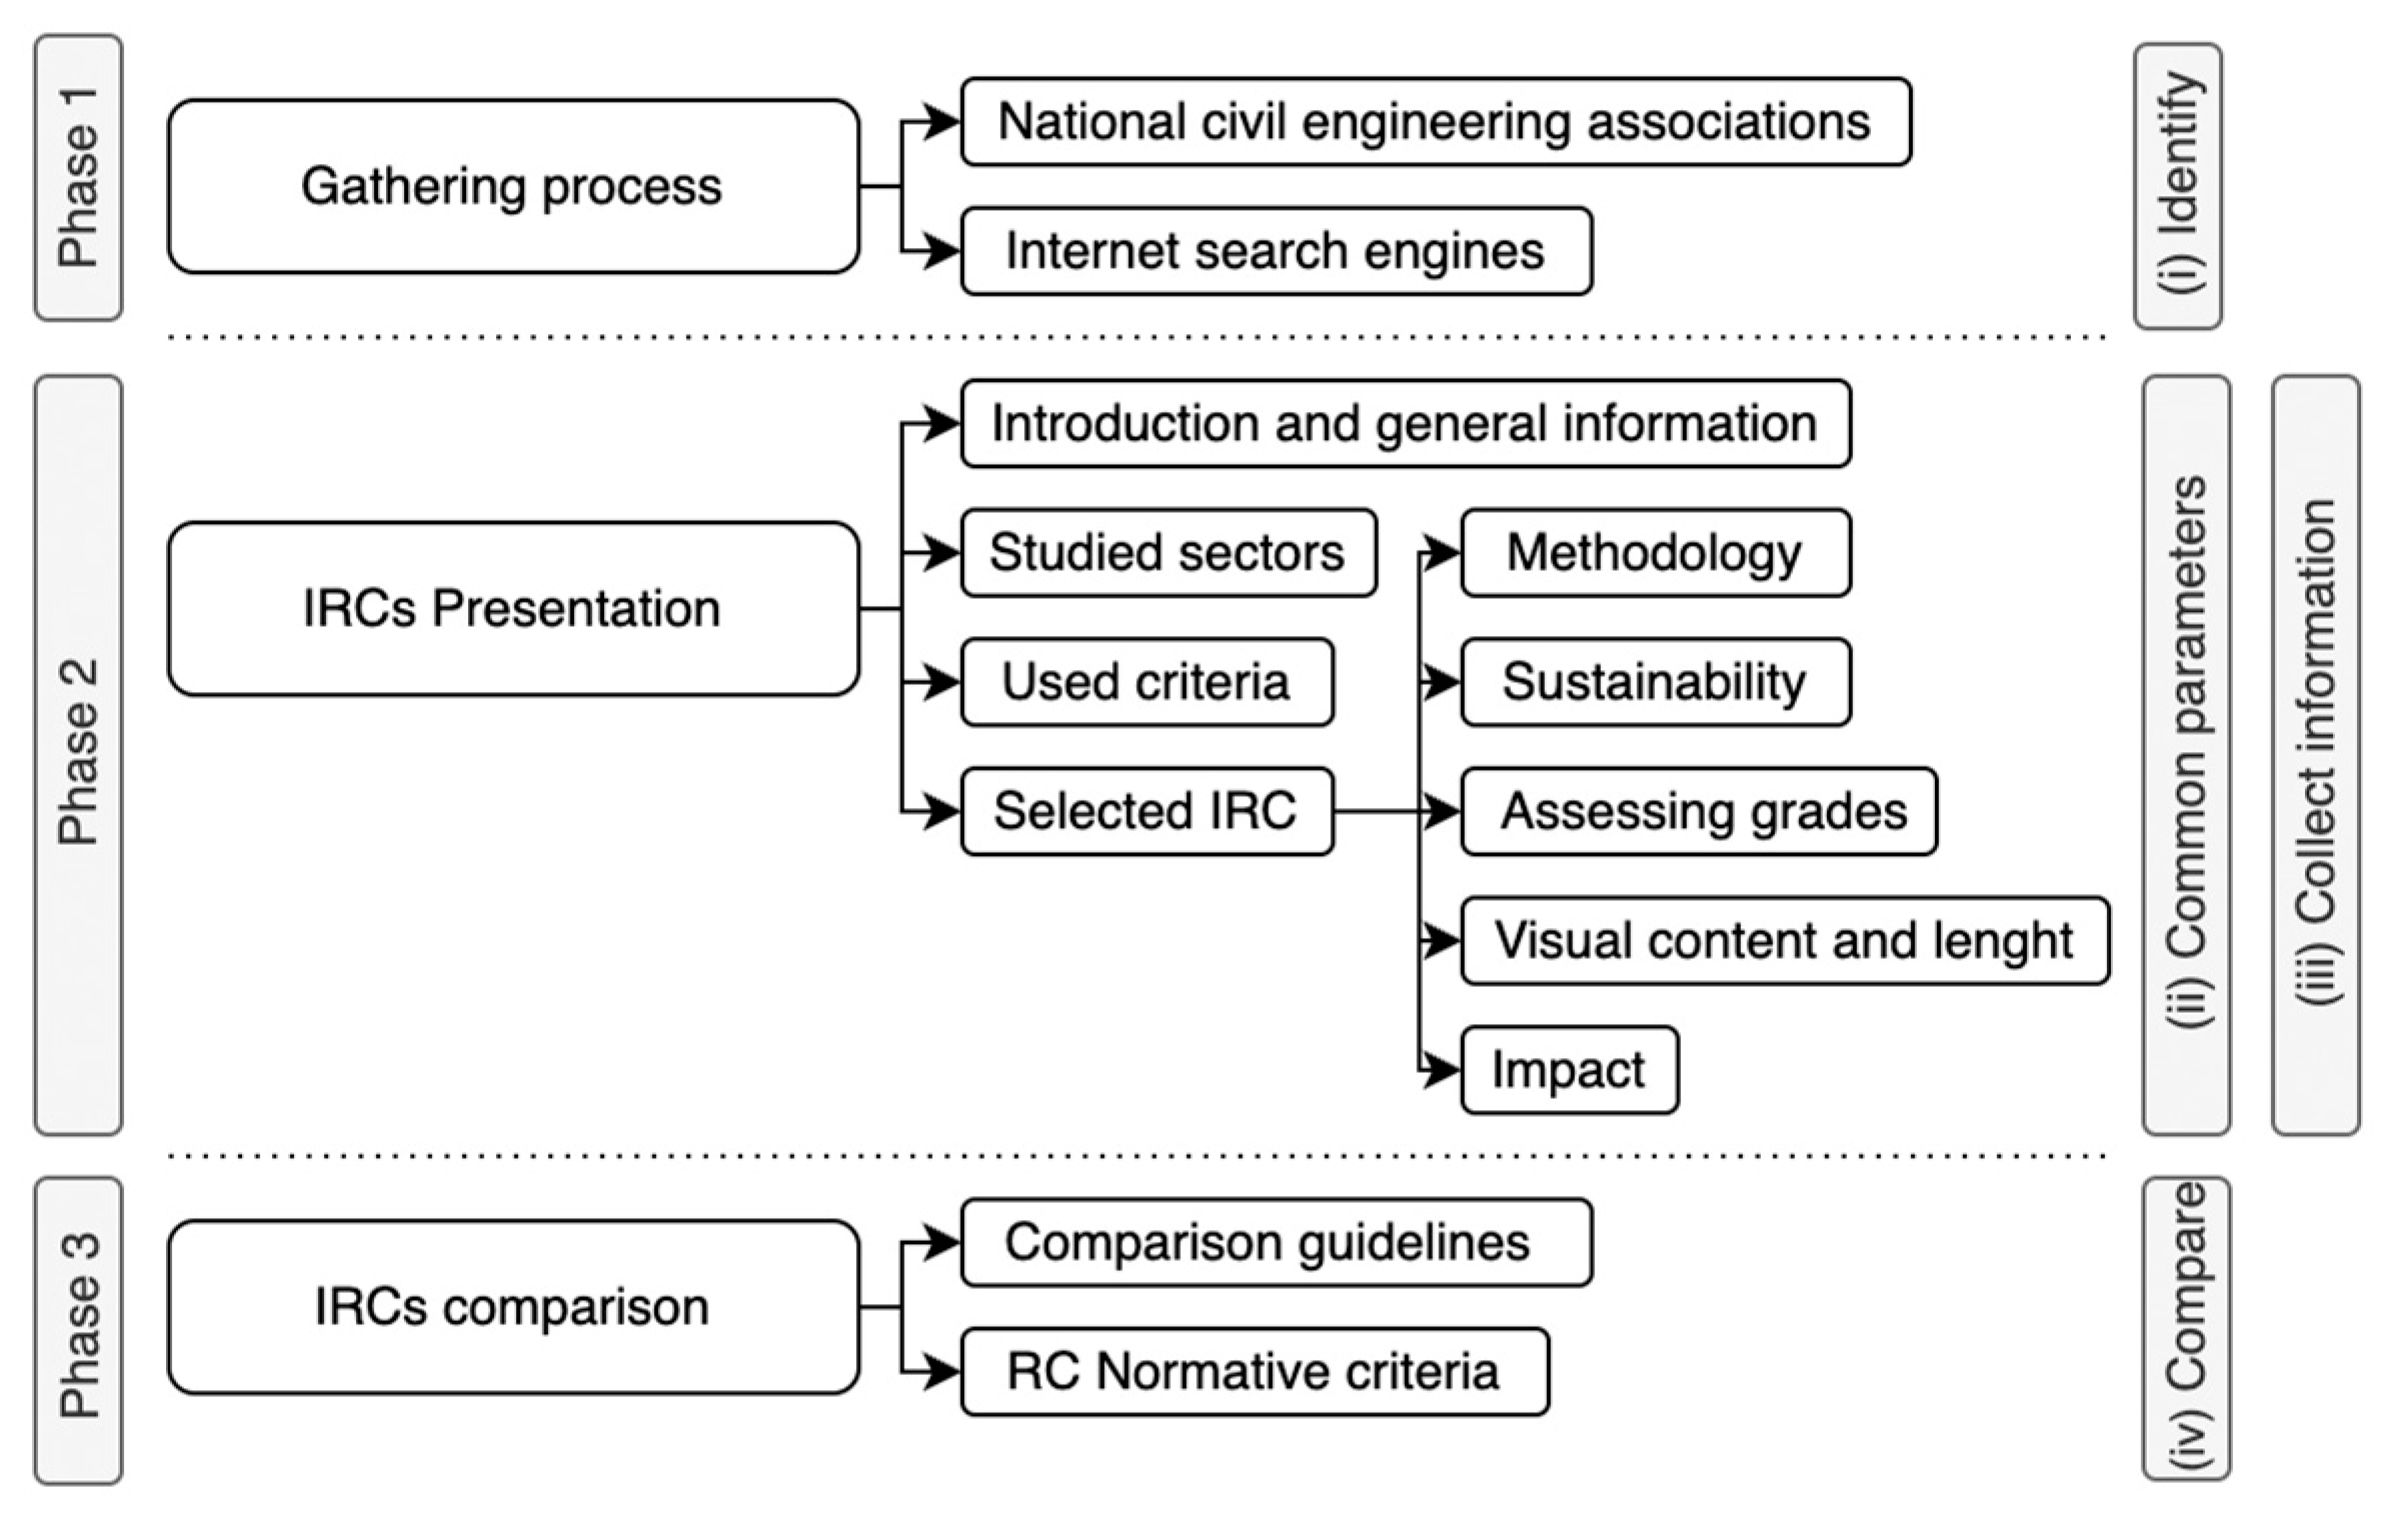
2.1. Research Design and Data Collection

An initial information search was conducted by the internationally recognized bibliographic database Web of Science, which accesses articles from over 12,000 journals worldwide [36]. One of the main justifications for using this database was the depth of its coverage, yielding more outputs than any other database collection. However, since these documents are typically reports or studies carried out by national civil engineering associations, the desired results were not obtained. Therefore, we proceeded to use the general search engine to find information related to the IRCS, locating the associations that have prepared them, as well as other potential sources of information, like news or national reports. After reviewing the results, a total of 21 documents from 8 countries were found.

2.2. Results Presentation Framework

As previously mentioned, the framework for presenting results has been developed considering the key parameters for comparing the IRCs. Additionally, the collected documents are presented on a country-by-country basis, enhancing clarity for the readers. Each country section includes an introductory segment providing general information, allowing the reader to familiarize themselves with the history and relevant aspects of the IRC. The evolution of the studied sectors is shown, along with the evaluation criteria employed for assessing the infrastructures. Note that, for the purpose of elucidating the progression of an IRC across its various editions, certain approximations have been employed. For instance, if a particular document analysed the “schools and universities” sector and, in subsequent editions, the sector was referred to as “education”, the latter designation was employed. Finally, the most recent IRC (or the one closest to the comparison standards) is selected, and information is provided on its methodology, consideration of infrastructure sustainability, grading scales, visual content, document length, and visible impact.

2.3. Comparison Design

For the IRCs comparison, some key characteristics have been collected in a process focused on two main aspects. The first entails employing guidelines for comparison. Through the extensive review of the documents to identify common key points suitable for comparison, Table 1 has been generated. This table encompasses the guidelines for comparing the IRCs, categorized into methodology, assessment, sample results, and document format. Each guideline corresponds to a specific question related to the IRC, enabling a comprehensive and structured comparison.
To address certain of these guideline questions, which cannot be directly answered by a number or a word, it is imperative to create profiles. These profiles, commonly referred to as groups, enable the allocation of a unique numerical or linguistic identifier to each IRC based on its specific attributes or characteristics [37].
External support is categorized based on the stage of the process in which external actors, who are not part of the editorial institution, can contribute their perspectives. The label “Preliminary phase” indicates that these actors are only involved in providing information during the data gathering phase, whereas the label “Throughout process” indicates that external actors have the opportunity to provide their input during the entirety of the evaluation.
The traceability of assessment methodology, which refers to the ability to track and document the entire process and steps involved in the evaluation process, is divided into three profiles regarding its transparency and clarity. The labels “Unclear”, “Primary guidelines”, and “Well-defined” indicate the different levels at which the IRCs have clearly and comprehensively presented their methodology. The examination of stated sub-sectors indicates whether the IRC divides the sectors into subsectors, indicating the sub-sector number in parentheses.
Sustainability is contingent upon its level of significance along the whole document. The label “Not considered” indicates its absence, “Critical sectors” implies consideration within directly related areas, “Comments” suggests it is at least commented in all sectors, and ‘In all sectors’ indicates its assessment in every sector. The determination of objectivity versus subjectivity is a complex process. The “Objective” label is assigned if objective and traceable indicators are provided, while “Subjective” is used if only expert opinions are used to grade the infrastructures.
The concept of transversality refers to the inclusion of external stakeholders in the assessment of infrastructure. In those IRCs where only the editors themselves have provided ratings, it is considered its absence, while, in cases where external experts have been able to contribute their opinions and influence the scores obtained, its existence is considered.
The traceability of experts’ opinions assesses the level of clarity in expert assessments for readers. Countries without any provided data sources are labelled as “non-existent”, while the labels “Partial” and “Total” are assigned when there are some documents available or when experts’ responses are clearly indicated, respectively.
Similarly, the traceability of sub-indicator assessments measures the level of clarity regarding how these indicators have been assessed. The labels “Partial” and “Total” have been used to indicate information without references or the provision of a well-defined comparison system, respectively. Sector-grade upgrade recommendations classify countries based on whether they provide explicit indications on how to address existing issues. The label “Any” is applied when the IRC does not provide any advice, “Hints” when the IRC mentions future challenges, and “Complete” when the IRC offers detailed expert recommendations for each sector.
Regarding economic future needs and the distinction between maintenance and upgrading, comparable categories have been used. The label “Any” is assigned when the IRC does not mention any future funding requirements or fails to distinguish between maintenance and improvement. The label “Hints” is used when general future needs have been discussed or the differentiation between maintenance and upgrading is provided based on factual information. Lastly, “Complete” is applied when the IRC specifies the needs for each sector and clearly distinguishes between maintenance and upgrading using well-defined criteria.
Finally, the evaluation of the results presentation should consider both non-technical and technical viewpoints. As such, the labels “Unclear” and “Clear” are utilized to characterize the transparency with which each IRC outlines their methodology and grading system. Additionally, the label “Improved” indicates that the IRC has incorporated techniques to enhance the readability of the results within their presentation.
The second aspect involves comparing the IRCs with the normative criteria set forth by Gormley and Weimer [38] for report cards. By evaluating the IRCs against these normative criteria, a comprehensive assessment can be made to determine their alignment with the desired standards of (i) validity, as all relevant dimensions must be correctly analysed; (ii) comprehensiveness, as all essential dimensions must be considered; (iii) comprehensibly, to be understandable to other readers; (iv) relevance, to provide relevant information to other readers; (v) reasonableness, having a reasonable preparation cost; (vi) functionality, as the report cards have to convince targeted organisations.

3. Results

In this section, the acquired IRCs resulting from the collection process are presented. As alluded to in the preceding section, they have been organized according to their respective countries. Within each country-specific section, an initial segment is devoted to providing a comprehensive overview, encompassing general information, historical evolution, as well as the examined sectors and criteria. Subsequently, a second segment offers a detailed depiction of the most recent IRC, encompassing the methodology employed, consideration of infrastructure sustainability, grading scales employed, inclusion of visual content, overall document length, and discernible impact. Lastly, a table presenting the comparison guideline results for all the showcased IRCs is provided.

3.1. United States

3.1.1. Introduction

As mentioned in the introduction, the initial national infrastructure assessment report card format was introduced by the United States of America in 1988 through the document released by the National Council on Public Works Improvement [39]. This report aimed to provide the government with expert recommendations on the allocation of public funds. However, after a decade, when it became clear that the federal government would not update the document, the American Society of Civil Engineers (ASCE) took the initiative to publish their first IRC in 1998 [40].
Since then, the USA’s IRC has undergone significant developments. It has transitioned from a concise rating document that highlighted infrastructure issues and proposed solutions [41] to an expanded format that provides a more comprehensive analysis of each sector [42,43,44,45,46]. For example, the initial IRC in 1988 focused on eight sectors: highways, mass transit, aviation, water resources, water supply, wastewater, solid waste, and hazardous waste. Over time, the scope of sectors studied has expanded, as depicted in Table 2.
Simultaneously, the criteria employed to evaluate these sectors have undergone progressive developments to align with contemporary social standards. While the 1988 IRC did not explicitly outline any criteria, the more recent editions of IRCs have established a comprehensive set of criteria, enabling readers to understand the assessment process, as demonstrated in Table 3.
Despite the existence of the aforementioned nine federal-level IRCs, it is important to note that each of the 50 states in the United States, along with the District of Columbia and Puerto Rico, has its own specialized IRC conducted by the respective state sections of the ASCE. These state-level IRCs exhibit varying degrees of development, with 13 of them currently providing only hints and recommendations on the ASCE webpage (specifically, Arkansas, Delaware, Indiana, Massachusetts, Nebraska, New Mexico, Ohio, Rhode Island, South Carolina, South Dakota, West Virginia, Wisconsin, and Wyoming). The remaining 39 states have attached documents that serve as the state-level representation of the federal IRC. However, it is important to note that these state-level documents are not included in the scope of this study.

3.1.2. ASCE 2021 Report Card for America’s Infrastructure

The ASCE 2021 IRC assesses and uses the sectors and grading criteria shown in Table 2 and Table 3. The assessment process is carried out by a committee comprising 31 experts in the field. The involvement of external experts in the IRC is limited to the initial input phase, primarily focused on data collection. Subsequently, the committee consults with technical and industry experts to gather subjective data for grading the infrastructure and providing recommendations for improvement.
The IRC does not explicitly outline sub-indicators determined by experts. Instead, each sector is evaluated based on specified criteria and critical expert opinions, presenting various facts and data to support the final assessment and recommendations for improving the sector. The recommendations are structured around key areas such as investment, leadership and action, and resilience.
Sustainability plays a significant role in the IRC, with explicit consideration given to the economic, environmental, and social aspects of sustainability in each sector’s recommendations. The assessment of sectors is presented on a grading scale ranging from A to F, accompanied by plus and minus signs.
In terms of visual content, the IRC incorporates a substantial amount of data graphics and conceptual representations across all studied sectors. The complete document spans 168 pages, but ASCE also provides a concise 17-page executive summary for quick access to information.
In addition to the IRC itself, ASCE publishes other related documents that highlight the significance of the IRC. For instance, the “Failure to act report” emphasizes the potential consequences for social and economic sustainability if current infrastructure practices are not improved. ASCE indicates that the documented work has contributed to enhancing infrastructure investment policies [47,48] and has successfully raised public awareness about infrastructure conditions and investment requirements [49].

3.2. Australia

3.2.1. Introduction

Engineers Australia (EA) has been publishing an annual national report since 1999, with the first basic IRC released and finalized in 2001. From 2001 to 2005, detailed state-by-state IRCs were published, generating and culminating in the 2005 national EA IRC. The last EA IRC was released in 2010 [50], and it is the focus of this study due to the unavailability of other documents.
The impact and success of EA’s IRCs are evident. In the 2005 IRC, EA recommended the establishment of a “National Infrastructure Council” to provide independent advice on infrastructure policy, planning, and delivery in Australia. Three years later, the government formed Infrastructure Australia (IA) to fulfil this role. Subsequently, IA published the “Australian Infrastructure Audit” in 2015 and 2019. However, these documents are not considered in this study as they differ in methodology. While the EA 2010 IRC focuses on assessing infrastructure with a grading system, the Australian Infrastructure Audit primarily provides statements about future sector challenges and offer recommendations in the form of key messages, outcomes for users, impact on communities, challenges, and opportunities. Consequently, only the EA 2010 IRC is analysed in this study.
Although the EA 2010 IRC divides the sectors in roads, rail, airports, ports, potable water, wastewater, stormwater, irrigation, electricity, gas, and telecommunications, it does not provide specific criteria for assessing them.

3.2.2. Australian Infrastructure Report Card: 2010

The methodology employed in the EA 2010 IRC involves data collection by experts and the gathering of subjective opinions from stakeholders to create a state-by-state assessment. The collected data are evaluated based on a single criterion: the comparison between the current state of infrastructure and its future requirements. Although specific sub-indicators are not explicitly mentioned, several critical aspects can be inferred. The contrasting themes include infrastructure condition, availability, reliability, resilience, planning, and funding. After analysing each state, the national IRC is generated by assigning weights to the individual state reports based on their relative size and economic importance. This process yields the sector assessment and comments, which contribute to its improvement.
The EA 2010 IRC does not provide specific recommendations for further infrastructure improvement beyond the assessment of present and future needs. However, it does include a state and territory rating summary that highlights the main challenges faced in each region.
The document emphasizes sustainability from a three-pillar perspective. The grading criteria utilize the alphabetical range from A to F, with plus and minus signs indicating positions within each grade.
Notably, the EA 2010 IRC lacks visual content in the studied sectors. The assigned grades are presented within the sector explanations, and the document spans a total of 39 pages.
Nevertheless, the impact of the EA IRC and the social and policy contributions made by the institution’s publications are undeniable. The recognition of the importance of infrastructure status has been heightened by their efforts, leading to the establishment of a specialized committee following their recommendations.

3.3. South Africa

3.3.1. Introduction

The South African Institution of Civil Engineers (SAICE) introduced the inaugural “Infrastructure Report Card for South Africa” in 2006 [51], coinciding with the advanced stage of the national Reconstruction and Development Programme [52], which included public ownership infrastructure investment. Subsequently, two more IRCs following the same methodology to present an evolving view of infrastructure were published in 2011 and 2017 [53,54].
Regarding the studied sectors, the 2006 edition analysed the water, sanitation, solid waste, management, roads, airports, ports, rail, electricity, and health care sectors. In the following editions, the education sector has been added. Notably, these sectors are further subdivided into multiple sub-sectors, each assessed independently. For example, the roads sector is divided by type (national, provincial, or municipal), and the water sector is distinguished between resources and areas due to significant differences between them. The initial IRC featured 21 sub-sectors, followed by 27 in the second edition, and 29 in the most recent one.
Finally, all SAICE IRCs are assessed using the same four criteria: condition, performance, capacity, and future need.

3.3.2. SAICE 2017 Infrastructure Report Card for South Africa

The SAICE 2017 Infrastructure Report Card for South Africa was produced by an IRC team comprising SAICE volunteers who collaborated with the Council for Scientific and Industrial Research. The assessment and comments for each sub-sector are derived from the expertise of SAICE specialist sub-sector divisions, which provide valuable assistance to the SAICE IRC team. The report does not explicitly reveal sub-indicators or the specific evaluation process employed. Instead, each sector is elaborated upon, presenting pertinent information and data in relation to the stated criteria used to assign grades to individual sub-sectors. This procedure results in the sector evaluation and remarks, which play a role in enhancing it.
It does not provide explicit recommendations or solutions for infrastructure improvement beyond the comments provided for each sub-sector. Its main focus is to assess the current status and challenges of the infrastructure.
Sustainability is mentioned sporadically, often through indirect references such as in the context of solid waste management.
The grading system for sub-sectors follows an alphabetical scheme from A to E, with plus and minus symbols indicating a slightly higher or lower assessment within each grade. Arrows are used to indicate the sector’s evolution since the previous IRC.
In terms of visual content, the report has limited data graphics and concept representations. Out of the ten sectors and twenty-nine sub-sectors assessed, only eight visual elements are included in five sectors. This may be attributed to the relatively short length of the report, which spans 44 pages.
Although no prioritization documents related to the South African IRC have been found, its impact is evident. The release of the first IRC in 2006 garnered media attention for SAICE and the IRC team [55]. The government also conducted workshops and presentations at various levels [48], emphasizing infrastructure needs and promoting future investment.

3.4. United Kingdom

3.4.1. Introduction

The United Kingdom has a series of annual reports called “State of the Nation” reports, compiled by a panel of experts from the Institution of Civil Engineers (ICE) since 2000. Starting from 2008, these reports have focused on specific issues [56], highlighting critical points in the national infrastructure to raise awareness among citizens and politicians and stimulate public debate. Two of these reports, the 2010 and 2014 State of the Nation reports, can be considered national IRCs for the UK.
In addition to infrastructure analysis, these documents cover various topics such as sustainability, engineers’ capabilities and skills, funding and delivery, planning and regulation [57], or leadership, finance and funding, and government workforce and civil engineers’ capabilities and capacity [58].
Indeed, the considered sectors have remained relatively consistent, including sectors such as energy, strategic transport, local transport, flood management or flood risk management, water and wastewater, and waste and resource management. However, there have been evolutionary changes in the specific criteria employed between the 2010 and 2014 IRCs. In the 2010 IRC, the criteria used were condition and capacity, resilience, sustainability, impact on significant cuts, and future needs. These criteria focused on assessing the current state of the infrastructure, its ability to meet demand, its resilience to external factors, its sustainability considerations, and the impact of budget cuts on infrastructure development. In the 2014 IRC, the criteria were modified to condition and capacity, resilience, leadership, and economic and social factors. These criteria aimed to assess the condition and capacity of the infrastructure, its ability to withstand and recover from disruptions, the leadership in infrastructure planning and delivery, and the economic and social impacts of the infrastructure system.

3.4.2. ICE State of the Nation: Infrastructure 2014

The ICE State of the Nation: Infrastructure 2014 is prepared by a panel of esteemed ICE experts. This group of proficient ICE specialists formulates a questionnaire comprising eight inquiries pertaining to the aforementioned criteria. They subsequently analyse the responses from ICE members alongside qualitative evidence provided by external stakeholders in order to determine sector grading and formulate their recommendations for its improvement.
The analysis of each sector does not directly involve the explicit application of the stated criteria. Instead, these criteria are integrated within the crucial focal points where pertinent data and facts are presented. Conversely, the study does not present any additional sub-indicators. As part of the sector recommendations and objectives for 2018, this State of the Nation report offers a set of overarching suggestions aimed at enhancing the assessments. These suggestions primarily focus on four key areas: strategic criteria, sector-specific considerations, engineering standards, and research and development. Notably, sustainability constitutes a significant thematic focus of the study, appearing in many key areas.
The assessment employs an alphabetical grading system, complemented by a plus or minus symbol to indicate the anticipated trajectory of the sector in the absence of any modifications to the current situation.
Visual content is utilized in three out of the six sectors, illustrating key critical points. However, the emphasis is placed more on the recommendations and written data, possibly due to the concise nature of the infrastructure report card (IRC), which spans a mere 27 pages.
The impact of the United Kingdom’s Infrastructure Report Card is clearly emphasized in the 2014 edition. A timeline graphic highlighting major government infrastructure programs, investment plans, and policy strategies implemented since 2010 is presented, underscoring the significance of these reports.

3.5. Canada

3.5.1. Introduction

In 2003, the Canadian Federal Government commissioned a series of documents known as the InfraGuide, with the aim of compiling the finest engineering practices for infrastructure management and creating a comprehensive guide for municipal government operations [59]. The final instalment of these guides, InfraGuide 7, published in 2004, focused on addressing the infrastructure decision making process and the planning requirements for government and infrastructure stakeholders.
Subsequently, several years after the publication of the last InfraGuide, the Canadian Construction Association, the Canadian Public Works Association, the Canadian Society for Civil Engineering, and the Federation of Canadian Municipalities came together to establish the Project Steering Committee (PSC). The PSC played a pivotal role in launching the inaugural Canadian Infrastructure Report Card (CIRC) and enlisted the participation of numerous stakeholders, forming the Report Card Advisory Board (RCAB). This initiative was introduced when “The Building Canada Plan”, initially released in 2007, was nearing its expiration, and the RCAB witnessed an increase in stakeholder representation by the second edition, owing to the warm reception received by the initial document [60,61,62].
While the CIRCs adhere to a consistent structure to ensure repeatability and transparency, there have been evolutions in the text format, document introductions, objectives, and the number of sector categories presented in Table 4. These changes are a result of incorporating feedback from infrastructure stakeholders and the government. The length of the report has also varied, with the first edition spanning 67 pages, while subsequent editions were expanded to 163 pages. One noteworthy alteration between CIRCs was prompted by feedback from stakeholders, namely the removal of the concept of “replacement value” in the latest edition.
Conversely, the assessment criteria themselves have remained unchanged. At the heart of the CIRC lies the Infrastructure Status Survey, which has served as its foundation. This survey, developed collaboratively by the PSC and the RCAB in 2012 and 2016, comprises an extensive set of questions for each sector, encompassing aspects such as inventory, condition, and capacity. Notably, the condition serves as the sole grading criterion employed.
In light of the significant impact generated by the CIRC, Infrastructure Canada (IC) and Statistics Canada (SC) jointly introduced the Canada Core Public Infrastructure Survey (CCPIS) in 2019. This new survey model aligns with the structure of the Infrastructure Status Survey but encompasses a broader scope, encompassing Canadian municipalities and public infrastructure owners. As a result of this change, the PSC and RCAB were disaggregated in the latest edition, giving rise to a new structure known as the CIRC Representatives. This new entity includes the Canadian Construction Association, the Canadian Public Works Association, the Canadian Society for Civil Engineering, the Federation of Canadian Municipalities, as well as new stakeholders, such as the Association of Consulting Engineering Companies Canada, the Canadian Parks and Recreation Association, the Canadian Urban Transit Association, and the Canadian Network of Asset Managers.

3.5.2. Canada Infrastructure Report Card 2019

The methodology employing the CIRC 2019 document revolves around the creation of the CCPIS by IC and SC, which encompasses the sector categories outlined in Table 4 and adheres to the condition criteria. The survey is administered to Canadian municipalities and public infrastructure owners, with a focus on gathering information pertaining to publicly owned infrastructures.
Each sector is further divided into sub-categories for assessment purposes. For example, the potable water sector is segmented into linear asset inventory (comprising local water pipes and transmission pipes) and non-linear asset inventory (encompassing water treatment facilities, storage tanks, water pump stations, and water reservoirs). Once SC has collected all the data from the survey responses, the CIRC representatives analyse the provided answers. They employ population extrapolation techniques to convert the municipal-level results into national-level findings.
Each sub-category is assigned a condition assessment rating, which includes categories such as Unknown, Very Poor, Poor, Fair, Good, and Very Good, each with their respective meanings. The focus of the CIRC primarily revolves around providing comments on the quantity or percentage of elements requiring investment rather than offering policy or planning recommendations. Additionally, sustainability is not considered a prominent aspect within the assessment.
Visual content is utilized throughout the CIRC, particularly in presenting key data and result outputs for the sectors under study. This visual representation is particularly notable given the concise length of the latest edition, which spans 55 pages.
The impact of the CIRCs is evident in various aspects, such as the introduction of the CCPIS Federal Program and the substantial participation of diverse stakeholder groups.

3.6. Zambia

3.6.1. Introduction

In 2012, the Engineering Institution of Zambia (EIZ) made the decision to develop an IRC Framework inspired by the ASCE Report Card, including a group of sub-indicators and new methodologies. This framework aimed to address the poor maintenance investment culture and the flawed perception of resource allocation that were impeding the country’s development, leading to a heavy reliance on foreign aid [63].
Further on, in May 2015, the Zambia IRC was launched under the title “2014 Baseline Report Card for Zambia’s Infrastructure” (for the purpose of this article, the year 2015 will be referred to as the release year). While the document provides guidelines for the Zambia IRC, certain aspects, such as the sectors studied, underwent changes [64].
The proposed framework initially included 14 sectors, encompassing roads, bridges, airports, railways, drinking water, wastewater, solid waste, electricity, fuel infrastructure, health infrastructure, educational facilities, agricultural infrastructure, and information and telecommunications technology infrastructure.
However, the final document narrowed down the sectors to nine, which consisted of roads, bridges, airports, railways, water supply, sanitation, solid waste, electricity, and information and communication technology. Nonetheless, other elements, such as the assessment criteria comprising condition, capacity, operations, and security, have remained consistent throughout the report.

3.6.2. Zambia Infrastructure Report Card 2015

The Zambia IRC is carried out by an IRC Consultancy Team, comprised of EIZ. This team utilizes a notable and innovative grading methodology, which is based on sub-indicators. Each sector within the report card consists of a set of sub-indicators for each criterion, providing objective and comparable data or subjective evaluations when data are controversial or unavailable.
The criteria employed in the assessment are consistent across sectors with the exception of the water sectors, where the criterion “Operations” is replaced by “Coverage”. However, the definitions of these criteria and the specific sub-indicators used vary depending on expert opinions. As a result, a total of 122 multiple study factors or sub-indicators grouped according to their criteria are generated to assess the sectors, which are further divided into sub-sectors.
The assessment of these sub-indicators is conducted subjectively, without explicit grading standards or weighted values for criteria integration being provided. Once each sub-indicator is evaluated and integrated to determine the criteria assessment, all sector criteria are combined using a 25% weight to derive the final valuation for each sector.
It is worth noting that sustainability is not a prominent consideration. Only directly related categories, such as solid waste management and rural water supply and sanitation, mention environmental and social sustainability, respectively.
The sector grading method in the IRC utilizes alphabetical grades from A to F, accompanied by interpretation, description, and a corresponding numeric percentage. Conclusions and recommendations are provided for most sub-sectors, except for water-related categories, where investment requirements are outlined. Energy categories encompass both points.
The Zambia IRC includes various visual elements in most sub-sectors, often presenting simple photographs of the structures under discussion. Statistical data are presented in 10 out of 14 sub-sectors, resulting in a document length of 145 pages.
Furthermore, the IRC received extensive media coverage and highlighted the need for the Zambian government to enhance public allocation for infrastructure maintenance and upgrading [65].

3.7. Ghana

3.7.1. Introduction

In 2016, the Ghana Institution of Civil Engineers (GhIE) introduced the Ghana Infrastructure Report Card (GIRC) with the objective of assessing the national infrastructure’s availability, quality, and performance. The development of the GIRC was prompted by two key national issues: the disparity in infrastructure between urban and rural areas, leading to population migration, and the infrastructure’s insufficient capacity to accommodate the country’s growing population. To address these challenges, GhIE proposed the formation of the GhIE Committee, comprising civil engineers from the public, private, and academic sectors, responsible for drafting the GIRC [66].
Although the intention is to produce multiple iterations of the GIRC over time, currently, only one document has been drafted, covering the roads, bridges, electric power, and potable water sectors. While it is mentioned that these sectors are further divided into sub-sectors, the GIRC does not provide specific information regarding this subdivision. Inspired by ASCE, the GIRC adopts the same set of assessing criteria: capacity, condition, funding, future need, operation and maintenance, public safety, resilience, and innovation.

3.7.2. Ghana Infrastructure Report Card 2016

The GIRC process begins with the GhIE Committee gathering current reports, documents, and available data to create an infrastructure factsheet for each sector. Additionally, a survey containing questions related to the infrastructure’s status is prepared.
The next step involves infrastructure agencies reviewing the data’s reliability and accuracy to ensure their credibility. Subsequently, the sector factsheets and the questionnaire are distributed to two distinct groups: the technical group, consisting of sector engineers and other engineering professionals, and the non-technical group, which includes staff from infrastructure agencies, the general public, and stakeholders. These groups are required to answer the questionnaire after reviewing the sector factsheets.
The answers provided by both groups are used to calculate a percentage score for each criterion, which is then integrated equally to determine the sector’s assessment. This methodology allows for the incorporation of input from technical experts as well as non-technical stakeholders, contributing to a comprehensive evaluation of Ghana’s infrastructure.
The factsheets provided offer comprehensive information regarding the factors that need to be considered for assessment. However, they do not provide specific details about sub-indicators, relying instead only on expert opinions to understand the assessment process.
Notably, sustainability is given significant emphasis, with economic, social, and environmental aspects evident in the data presented, particularly in relation to future needs, public safety, resilience, and innovation.
The integrated results of the survey are presented in the final document, with sector-specific information divided by criteria. The document includes the sector’s grade, the grade point average (GPA) score, percentage score, and a description of its condition.
While visual content is primarily utilized in sector-grading figures, critical data are primarily presented in tabular form. The document spans 43 pages. As of now, the impact of the GIRC on Ghanaian society or the government has not been validated. Although a national infrastructure plan for 2018–2047 has been released, no specific news or updates regarding the GIRC have been found.

3.8. Spain

3.8.1. Introduction

In 2019, the Spanish Association of Civil Engineers (AICCP-IC) introduced their publication titled “Public Works and Services Under Scrutiny” aimed at providing information about the state of national infrastructure and acting as an intermediary between society and the government. The Spanish Infrastructure Report Card (SIRC) employs an objective, quantifiable, and credible methodology [67] and comprises several distinct documents, including a comprehensive description of the SIRC methodology, an executive summary encompassing all results, and an extensive report for each analysed sector, accompanied by a sector factsheet. The SIRC analyses six sectors: roads, rail, aviation, ports, public transport, and the water cycle.
Similar to the ASCE assessment criteria, the SIRC adopts the capacity, performance, funding, future need, operation and maintenance, public safety, resilience, and innovation criteria. It is worth noting that the performance criterion replaces the condition criterion and evaluates how well the infrastructure is functioning or performing in terms of achieving specific objectives or desired outcomes.

3.8.2. Spain Infrastructure Report Card 2019

The AICCP-IC introduced a novel methodology for the SIRC with the aim of creating an objective, quantifiable, traceable, and transparent assessment, which consists of both a qualitative and a quantitative evaluation.
The quantitative score is derived from a comprehensive set of 148 sub-indicators, carefully selected based on their representativeness, repetitiveness, reproducibility, sensitivity, and simplicity. These sub-indicators can be found in global databases, and the sources for each value are fully cited. To obtain an objective assessment, these sub-indicators are compared across different countries, with the best-performing country assigned the highest value, while others are compared relative to it.
In addition to the quantitative evaluation, a qualitative grade is obtained through an AICCP-IC survey. This survey is answered by experts and includes a series of questions for each criterion and sector, allowing them to provide comments and suggestions. The answers from the survey are presented in the respective sector’s documents. Once each sub-indicator and criterion have been assessed, an average is calculated between the objective (quantitative) and subjective (qualitative) results to determine the final sector grade. Furthermore, this grade is accompanied by expert recommendations.
Indeed, the SIRC considers the specific characteristics of each sector and criterion when selecting the sub-indicators, adapting its quantity according to their needs. It is worth mentioning that the ports sector, which is primarily operated by private companies under concession from the public administration, does not have specific sub-indicators listed.
It is commendable to note that sustainability is considered a crucial aspect. The three pillars of sustainability (economic, social, and environmental) are reflected in various sub-indicators, particularly within the future needs criteria. The emphasis on sustainability is evident in the surveys conducted with experts, as well as in the executive summary and factsheets, where it is highlighted as a principal comment.
The grading system utilizes a numerical assessment ranging from 0 to 10, with correlations to the European Credit Transfer System (ECTS) and ASCE grading scales, along with their respective meanings. These assessments are prominently displayed in each sector’s factsheet, providing both quantitative and qualitative values and comments.
Regarding visual content, due to the multi-document format, a specific analysis of visual materials is not provided. However, the division of the document into parts allows for better adaptation to different readerships. The executive summary and sector reports cater to experts and practitioners who seek in-depth analysis, featuring technical graphs and images. On the other hand, the factsheets are designed for the general public, featuring more general pictures and graphs that convey essential information.
While the SIRC has received significant media coverage within civil engineering, construction, and related fields, its direct impact on the administration has yet to be proven. Nonetheless, the comprehensive coverage and attention afforded to the SIRC in relevant industries indicate its influence and relevance in the infrastructure sector.

3.9. Comparison Guidelines Summary

After the presentation of all the selected IRCS, the results of the comparison guidelines are displayed in Table 5, providing comprehensive information on all the key aspects of each document.

4. Findings and Discussion

As delineated within the methodology, the current section entails an examination conducted through a comparative analysis of IRCs. This comparative analysis, constituting the fourth step of the process, is executed in a dual manner. The initial approach involves employing the comparison guidelines results contained in Table 5.
There are notable disparities among the IRCs of different countries. In terms of methodology, countries can be categorized into those that incorporate external assistance in their assessments (such as Canada, Ghana, and Spain) and those that do not. It is crucial to highlight that, overall, external support throughout the infrastructure assessment process adds expertise, objectivity, diverse perspectives, and credibility to the process. Furthermore, these three countries consider external opinions alongside the editor’s perspectives, which is a significant factor in avoiding institutional biases and ensuring more accurate infrastructure data. However, the traceability of experts’ opinions is only present in Canada and Spain, further bolstering the quality and reliability of assessment outcomes. These three factors collectively enhance the quality and reliability of the assessment outcomes, leading to more informed decision making and improved infrastructure planning, management, and development.
Regarding the assessment methodology traceability, the IRCs that adhere closely to the approach outlined by ASCE demonstrate better methodological explanations and transparency, providing insight into the process and enhancing objectivity. This is a key characteristic with which to use the IRCs to accomplish the sustainable infrastructure objectives. Transparency and methodological explanations in infrastructure assessment support accountability, comparability, replicability, stakeholder engagement, and learning. They contribute to the achievement of sustainable infrastructure objectives by providing reliable information and fostering collaboration among stakeholders, which can understand the methodology being used, and can actively contribute their insights, provide feedback, and collaborate in the assessment.
While sustainability is a crucial concern for more developed nations, developing countries tend to focus more on the current state of their infrastructure as they face the challenge of balancing immediate infrastructure needs with long-term sustainability objectives. However, the UN Sustainable Development Goals (SDGs) can serve as a guide and aspiration for these countries, encouraging them to gradually transition towards more sustainable infrastructure practices as their capacities and resources improve. This guide should be implemented, gradually, in the developing countries regarding infrastructure assessment in the form of indicators or experts’ considered criteria.
When it comes to assessment, the use of quantitative indicators that are well-presented and referenced for each criterion is uncommon, likely due to the challenges of obtaining data. However, Zambia, which solely mentions the indicators to be evaluated by experts, and, in particular Spain, which assesses them quantitively, have proposed their utilization to shed light on the methodology. Canada, despite not being explicitly associated with indicator usage, could also be included in this group as indicators can be derived from the survey they employ. It is worth highlighting that, although Spain does not explicitly state sub-sectors, the characteristics of these sub-sectors are assessed within the framework of the indicators. This distinction becomes evident in the discussion of objectivity versus subjectivity, where the majority of countries rely solely on subjective expert assessments to grade their infrastructure, which can introduce potential issues stemming from subjectivity and limited transparency. These concerns arise from the fact that the evaluators are often civil engineers, and there may be a subconscious inclination to favour projects with financial benefits, creating bias and reducing objectivity. Additionally, the divergence of opinions among various experts may lead to inconsistencies in assessment outcomes. This inconsistency could be exacerbated when comparing the same infrastructure sectors across multiple document editions. It is crucial to address these issues by incorporating objective indicators to achieve more comprehensive and reliable infrastructure evaluations.
With the exception of Canada, which primarily focuses on condition assessment, developed countries seem to consider future needs as a critical factor when providing investment recommendations. This proactive approach allows for better planning and allocation of resources, leading to more sustainable and resilient infrastructure systems. However, there is a disparity in how maintenance and upgrading are distinguished, with comments generally categorizing investments into these two areas. It is essential to distinguish between these needs as maintenance plays a critical role in maintaining the safety and functionality of the existing infrastructure, while upgrading is vital to address evolving requirements and enhance performance. Treating both as interchangeable might lead to the neglect of essential repairs, thereby jeopardizing the integrity of the infrastructure.
Finally, there are significant variations in the visual content presented. While the objective of each IRC is to inform and provide recommendations to the government and citizens, some IRCs are challenging for non-experts or individuals unfamiliar with the field of infrastructure to comprehend. In contrast, others effectively present technical information and typical results in a user-friendly manner. For instance, the United States’ IRC employs 85 elements across all studied sectors within 168 pages. On the other hand, Australia’s IRC does not utilize any visual elements in its 39 pages, potentially resulting in a loss of comprehensibility. South Africa’s IRC employs eight elements across five out of ten sectors in 44 pages, aiming for a balanced dissemination of information, similar to the United Kingdom’s IRC, which employs three elements across three out of six sectors within 44 pages. The IRCs of Canada and Zambia incorporate numerous visual elements, with 64 elements across seven out of seven sectors for Canada and 71 elements across 10 out of 14 sectors for Zambia, spanning 55 and 145 pages, respectively. Ghana’s IRC consists of 43 pages, but the results are presented using factsheets to facilitate comprehension for readers. However, Spain appears to have adopted an innovative and user-friendly document presentation format, enabling individuals from diverse backgrounds to access and understand the results, comments, and recommendations.
After completing this initial approach of the comparative analysis, which involved the IRCs comparison, valuable insights have been gained by practitioners and researchers regarding their practices and limitations. Through the utilization of Table 5 and its accompanying explanation, potential gaps and opportunities for improvement have been identified, such as the sectors other IRCs analyse or their utilization of sub-sector divisions.
For the second approach of the comparison analysis, the report cards’ normative criteria are applied. Following the Gormley and Weimer study [38], six criteria must be considered: validity, comprehensiveness, comprehensibly, relevance, reasonableness, and functionality. For this purpose, each of these criteria will be developed on the basis of characteristics or effects shown by the IRCs.
To analyse the IRCs validity, several questions in the proposed comparison guide are used as these directly contribute to its assessment: assessment methodology traceability, objectivity vs. subjectivity, experts’ opinion traceability, the use of sub-indicators, and sub-indicators traceability.
Analysing these questions, it becomes evident that there is room for improvement. Only 62.5% (five out of eight) of the selected IRCs clearly state their methodology, but the assessments predominantly rely purely on subjective judgments, except for Canada and Spain. Canada’s approach involves specific questions about infrastructure data condition, while Spain clearly defines each sub-indicator and its source. These two countries stand out as examples where readers can easily trace and verify the opinions of the experts involved. This issue is even more pronounced in terms of traceability of expert opinions as the overwhelming majority of IRCs fail to furnish information regarding the sources of their expert opinions or the underlying processes employed by these experts. Similarly, there is a notable dearth in the utilization of sub-sectors within the assessments.
It is strongly recommended to revise and improve the IRCs validity as it is crucial for the effective implementation of the UN SDGs and the advancement of sustainable infrastructure objectives. Valid assessments provide reliable information for decision making, promote accountability and monitoring, and guide efforts to improve infrastructure systems in line with sustainable development principles.
The IRCs that rely exclusively on subjective opinions to assess infrastructure may be susceptible to the “aim for negative grades” phenomenon [68], wherein the editors’ motivations may be inclined towards enhancing public allocations rather than providing an unbiased evaluation. Hence, the adoption of well-defined and traceable indicators, as well as objective measures, is crucial to mitigate any perception of biased grading or negative bias. However, it is important to acknowledge that experts’ opinions should always be taken into consideration to obtain sector-specific or general advice and recommendations, avoiding situations of sector status knowledge but lack of solution understanding.
Regarding comprehensiveness, the examination should concentrate on the sectors and criteria that have been studied and utilized as they provide insights into the applicable norms of relevance. To achieve this objective, Figure 2 illustrates the number of sectors analysed in IRCs, categorized into seven groups: transport, water, solid waste, social energy, telecommunications, and agriculture infrastructure. In certain instances, analogous grouping has been employed, such as combining potable water, drinking water, and water resources under the category of water, while electricity and energy are combined under the category of electric power.
Transport and water are the categories that encompass a larger number of analysed sectors, aligning with the political objectives of resource allocation, as they are directly perceived as achievements by citizens [49]. The global occurrence percentage is calculated based on the number of sectors over the total: over 39.0% for transport, 28.6% for water, 10.4% for energy, 10.4% for social infrastructure, 7.8% for solid waste, 2.6% for telecommunications, and 1.3% for agriculture. These figures correspond to the interests of national governments, with sectors like transport, water, social infrastructure, and solid waste primarily under municipal ownership, while energy, telecommunications, and agriculture are typically managed through private-sector concessions.
Furthermore, four countries have subdivided certain sectors into sub-sectors to enhance the accuracy of the provided results and recommendations. Table 6 presents the countries along with the sectors and sub-sectors obtained from this division.
It is evident that less developed countries like South Africa and Zambia, which exhibit significant disparities between urban and rural areas, tend to employ a sub-sector division that reflects these distinctions. Sectors such as healthcare, education, and telecommunications are categorized separately, considering their specific characteristics and territorial differences. In contrast, Australia primarily divides its roads into various categories, perhaps due to the significance of this infrastructure sector at the national level. Canada also demonstrates a high degree of sub-sector division as these subdivisions generate specific questions and indicators for infrastructure assessment.
Turning to the criteria employed, Figure 3 illustrates the criteria utilized in IRC assessments, employing an analogy grouping. This analogy has been conducted using a similarity approach: since certain criteria have distinct names but pertain to the same concept, they have been grouped based on their purpose, taking the ASCE proposal as a foundation, which is widely recognized and extensively utilized, including by the United States, Ghana, and Spain. For example, South Africa’s performance is categorized as operation, and the United Kingdom’s leadership, encompassing strategy and planning, and economic and social factors are categorized as future needs and innovation, respectively. Additionally, Zambia’s security criterion is divided into public safety and resilience.
Condition and capacity emerge as the most prevalent criteria in IRC assessments as they provide insight into the actual state of infrastructure and its performance in meeting current demands. Future needs also receive significant attention as evaluations of condition and capacity are extrapolated to analyse the infrastructure’s ability to meet projected demands, thus enabling experts to provide recommendations and advice to the administration. Operation encompasses criteria related to infrastructure performance, maintenance, and preservation operations, which are closely linked to the condition of the infrastructure. Resilience and public safety criteria offer insights into the necessary measures to maintain the infrastructure’s current state rather than assessing its condition.
However, there is a notable need for increased emphasis on innovation and funding criteria. ASCE IRC-related countries already incorporate innovation, which includes discussions and advice on sustainability issues and solutions. Given the growing importance of sustainability in government decision making, it would be beneficial to consider including it as a separate criterion or incorporate it under “Innovation and sustainability”. The inclusion of funding criteria would provide crucial information on the cost of repairs or improvements, assisting public administrations in making informed decisions regarding infrastructure allocation.
In conclusion, by considering the sectors mentioned earlier, utilizing the ASCE criteria, and implementing the proposed improvements, it would already enable the analysis of fundamental infrastructures from their key areas of concern, thereby fulfilling the aspect of comprehensiveness.
However, it is crucial to note that, when it comes to the criteria, IRCs should consider the SDGs and prioritise the key aspects of sustainable infrastructure objectives. By aligning the assessment criteria with them, emphasizing the dimensions of sustainability, fostering transparency and accountability, and capturing the interdependencies within infrastructure systems, these assessments can effectively guide decisionmakers towards strategic infrastructure investments that promote and support sustainable development.
Comprehensibility is also examined through the utilization of the comparison guide questions, aligning with the emphasis placed by the SDGs on the importance of accessible and transparent information for facilitating well-informed decision making and fostering sustainable development. The evaluation code, sector improvement recommendations, and insights pertaining to future needs in the presented outcomes, along with the presentation of results, visual elements, and format length, are directly associated with comprehensibility.
Finally, the last two criteria examined in the study are reasonableness and functionality. While reasonableness cannot be thoroughly analysed due to the lack of available information on IRC drafting costs, the aspect of functionality can be discussed in terms of the impact generated on governments and citizens.
In terms of the impact on governments, despite receiving significant media coverage in most countries and gaining attention from infrastructure-related organizations, there remains a lack of substantial government response to address the problems and funding issues highlighted by the IRCs [49]. Only three countries’ IRCs have demonstrated clear influences on government actions.
The first example is the United Kingdom’s IRC, which explicitly mentions government infrastructure programs, investment plans, and policy strategies implemented since 2010, where the IRC’s findings have played a guiding role. The second example is the United States of America’s IRC, where the results have been utilized by ASCE to advocate for government interventions and policy changes. Lastly, Canada’s IRC holds significant influence not solely through its report but due to the extensive involvement of both public and private stakeholders in its creation, enjoying robust support from the administration.
Nevertheless, it is challenging to quantitatively measure the impact of IRCs on government policies. Generally, government policies are influenced by a multitude of factors, including political, economic, and social considerations. For example, identifying the direct influence of IRCs among these complex dynamics can be inherently difficult. The causal relationship between the publication of IRCs and subsequent policy changes may not be straightforward. Policy decisions are often the result of a lengthy and iterative process involving various stakeholders, including policymakers, experts, interest groups, and the public. IRCs serve as one source of information among many, making it challenging to isolate their specific impact on policy outcomes.
Given the inherent challenges associated with quantitatively measuring the impact of IRCs on government, it becomes paramount to focus on enhancing their effectiveness in shaping policy decisions. To achieve this, active involvement and engagement of the government are essential. When the government actively participates in the development and utilization of IRCs, it fosters a sense of ownership and facilitates the integration of their findings into policy formulation and decision making processes. This integration enhances the functionality by ensuring that it influences policies and contributes to the improvement of infrastructure systems.
Such government involvement can lead to a deeper understanding of the issues identified in the IRCs, which serve as valuable tools for assessing infrastructure needs, identifying priorities, and informing investment decisions, including their implications for sustainable infrastructure development. Additionally, government involvement ensures access to accurate and comprehensive data, which is essential for IRCs as they rely on reliable and up-to-date information about infrastructure systems. Moreover, government involvement helps foster transparency and accountability, demonstrating a commitment to transparency and openness in infrastructure management and showing willingness to be held accountable for the state of infrastructure and its progress towards sustainable infrastructure objectives.
However, in order to mitigate the risk of biased results influenced by political interests, it is important for the government to limit its role to providing information to experts and promoting subsequent editions of IRCs. Similarly, private organizations that handle private data from infrastructure concessions should also follow this approach to avoid potential criticism for obtaining low grades [55]. If their input is to be considered in the assessment process, it is recommended to employ a carefully designed method aimed at seeking multi-stakeholder consensus [69,70]. Finally, regarding citizens’ impact, only civil engineering associations and infrastructure-related organisations’ press releases regarding IRCs have been found.
It is highly recommended that IRCs incorporate essential information about the impact of infrastructure on citizens’ lives, similar to the approach taken by the ASCE IRC. By including factors such as travel time reduction and waste management in the streets, which directly affect people’s daily lives, IRCs can make the results more relatable and meaningful to the general public, increasing citizens’ awareness and interest in infrastructure issues. Furthermore, adopting a people-centric perspective and aligning the infrastructure analysis with the UN SDGs can make the report more engaging and appealing to the non-technical population as it highlights the importance of sustainable development and the well-being of individuals and communities.

5. Conclusions

The infrastructure report card comparison presented in this paper has shed light on the methodologies employed by different countries and the key aspects of their respective reports. By means of a comparative analysis, the discussion section of this paper has presented a set of recommendations and suggestions, fulfilling its objective of furnishing practitioners and researchers with invaluable insights into IRCs. These insights encompass a wide range of information, ranging from general knowledge to diverse practices and potential areas for enhancement, providing readers with a comprehensive understanding of IRCs and valuable guidance for improving their infrastructure assessment processes.
One significant finding pertains to the pivotal role of governments in IRCs. Enhanced government involvement, achieved through collaboration with civil engineering associations and stakeholders, is crucial for ensuring the effective integration of IRC findings into policymaking processes.
The methodology utilized in IRCs has also been a focal point of discussion. Providing detailed explanations of the methodology enhances transparency and credibility. ASCE has set a positive example in this regard and has influenced other IRCs to follow suit.
The report’s format has also been critically analysed, with an emphasis on presenting results in accessible formats for citizens and stakeholders. It is highly recommended to expose results that consider the direct impact on citizens and stakeholders, thereby enhancing awareness of the problems at hand. Spain’s approach, involving various document types catering to different reader types, exemplifies an effective strategy. The adherence to guidelines aimed at improving IRCs can transform these reports into essential tools for prioritization, enabling informed decision making for sustainable infrastructure development.
The study acknowledges limitations regarding the analysis of IRCs’ real impact and the scarcity of available documents. However, the potential for future research in this field is substantial, building upon the insights garnered from this study. A crucial area for exploration is the role of governments in IRCs, with a focus on collaboration best practices. Developing comprehensive and objective methodology guidelines is equally important for enhancing transparency. The development of these guidelines could be essential, motivating efforts to encourage more countries to adopt the methodology, thus contributing to a more diverse and robust dataset. Lastly, future studies could explore the actual impact of these documents by assessing their effectiveness through policy adoption.

Author Contributions

D.B.-C.: Conceptualization and investigation, methodology, data curation, writing—original draft preparation; F.P.-B. and P.P.: writing—review and editing, supervision, validation. All authors have read and agreed to the published version of the manuscript.

Funding

This research was funded by the Spanish Ministry of Universities [grant number FPU18/01471] and AGAUR through its research group support program [2021SGR00341].

Data Availability Statement

No new data were created or analysed in this study. Data sharing is not applicable to this article.

Conflicts of Interest

The authors declare no conflict of interest.

References

  1. Czernich, N.; Falck, O.; Kretschmer, T.; Woessmann, L. Broadband Infrastructure and Economic Growth. Econ. J. 2011, 121, 505–532. [Google Scholar] [CrossRef]
  2. Wang, E.C. Public infrastructure and economic growth: A new approach applied to East Asian economies. J. Policy Model. 2002, 24, 411–435. [Google Scholar] [CrossRef]
  3. Esfahani, H.S.; Ramírez, M.T. Institutions, infrastructure, and economic growth. J. Dev. Econ. 2003, 70, 443–477. [Google Scholar] [CrossRef]
  4. World Economic Forum. Empowering Public-Private Collaboration in Infrastructure National Infrastructure Acceleration (NIA) Approach; World Economic Forum: Geneva, Switzerland, 2018. [Google Scholar]
  5. ASCE. Failure to Act: Economic Impacts of Status Quo Investment Across Infrastructure Systems; ASCE: Reston, VA, USA, 2021. [Google Scholar]
  6. Heathcote, C. Forecasting Infrastructure Investment Needs for 50 Countries, 7 Sectors through 2040. Getting Infrastructure Finance Right. 2017. Available online: https://blogs.worldbank.org/ppps/forecasting-infrastructure-investment-needs-50-countries-7-sectors-through-2040 (accessed on 17 June 2020).
  7. Thorpe, D.S.; Kumar, A. A Life Cycle Model for Asset Investment Decision Making. In Applications of Advanced Technologies in Transportation; ASCE: Reston, VA, USA, 2002; pp. 576–583. [Google Scholar] [CrossRef]
  8. Gramlich, E.M. Infrastructure Investment: A review essay. J. Econ. Lit. 1994, 32, 1176–1196. [Google Scholar]
  9. Ye, S.; Tiong, R.L.K. NPV-at-Risk Method in Infrastructure Project Investment Evaluation. J. Constr. Eng. Manag. 2000, 126, 227–233. [Google Scholar] [CrossRef]
  10. Boix-Cots, D.; Pardo-Bosch, F.; Blanco, A.; Aguado, A.; Pujadas, P. A systematic review on MIVES: A sustainability-oriented multi-criteria decision-making method. Build. Environ. 2022, 223, 109515. [Google Scholar] [CrossRef]
  11. Huang, W.-C.; Teng, J.-Y.; Lin, M.-C. Application of Fuzzy Multiple Criteria Decision Making in the Selection of Infrastructure Projects. In Proceedings of the 5th International Conference on Fuzzy Systems and Knowledge Discovery, FSKD, Jinan, China, 18–20 October 2008; Volume 5, pp. 159–163. [Google Scholar] [CrossRef]
  12. Garvin, M.J.; Cheah, C.Y.J. Valuation techniques for infrastructure investment decisions. Constr. Manag. Econ. 2004, 22, 373–383. [Google Scholar] [CrossRef]
  13. Gerrits, L.; Verweij, S. The Evaluation of Complex Infrastructure Projects; Wiley: Hoboken, NJ, USA, 2018. [Google Scholar] [CrossRef]
  14. Sharma, V.; Al-Hussein, M.; Safouhi, H.; Bouferguène, A. Municipal Infrastructure Asset Levels of Service Assessment for Investment Decisions Using Analytic Hierarchy Process. J. Infrastruct. Syst. 2008, 14, 193–200. [Google Scholar] [CrossRef]
  15. Westerling, D.L. Reporting on America’s Infrastructure: Background Preparation and Possible Guidance on Grading Infrastructure. In Infrastructure Reporting and Asset Management: Best Practices and Opportunities; American Society of Civil Engineers: Reston, VA, USA, 2008; pp. 65–72. [Google Scholar] [CrossRef]
  16. Issapour, M.; Sheppard, K. Evolution of American Engineering Education. In Proceedings of the Conference for Industry and Education Collaboration, Palm Springs, CA, USA, 4–6 February 2015; pp. 1–24. [Google Scholar]
  17. Amekudzi, A.; McNeil, S. Infrastructure Reporting and Asset Management; American Society of Civil Engineers: Reston, VA, USA, 2008. [Google Scholar] [CrossRef]
  18. Pardo-Bosch, F.; Aguado, A.; Pino, M. Holistic model to analyze and prioritize urban sustainable buildings for public services. Sustain. Cities Soc. 2019, 44, 227–236. [Google Scholar] [CrossRef]
  19. Henisz, W.J. The Institutional Environment for Infrastructure Investment. Ind. Corp. Chang. 2002, 11, 355–389. [Google Scholar] [CrossRef]
  20. Pujadas, P.; Pardo-Bosch, F.; Aguado-Renter, A.; Aguado, A. MIVES multi-criteria approach for the evaluation, prioritization, and selection of public investment projects. A case study in the city of Barcelona. Land Use Policy 2017, 64, 29–37. [Google Scholar] [CrossRef]
  21. Coe, K.C. A report card on report cards. Public Perform. Manag. Rev. 2003, 27, 53–76. [Google Scholar]
  22. Pujadas, P.; Cavalaro, S.; Aguado, A. Mives multicriteria assessment of urban-pavement conditions: Application to a case study in Barcelona. Road Mater. Pavement Des. 2018, 20, 1827–1843. [Google Scholar] [CrossRef]
  23. Ochoa Díaz, H.; Giovanni González, C. Macroeconomía para la Gerencia Latinoamericana; Ecoe Ediciones: Bogota, Colombia, 2017. [Google Scholar] [CrossRef]
  24. Roubini, N.; Setser, B. The Effects of the Recent Oil Price Shock on the U.S and Globbal Economy; Stern School of Business: New York, NY, USA, 2004; pp. 1–12. [Google Scholar]
  25. Hamilton, J.D. Causes and Consequences of the Oil Shock of 2007–08. Brookings Pap. Econ. Act. 2009, 2009, 215–261. [Google Scholar] [CrossRef]
  26. Kilian, L. Oil Price Shocks: Causes and Consequences. Annu. Rev. Resour. Econ. 2014, 6, 133–154. [Google Scholar] [CrossRef]
  27. United Nations Environment Programme. International Good Practice Principles for Sustainable Infrastructure; United Nations: New York, NY, USA, 2022. [Google Scholar]
  28. Congress, S.S.C.; Puppala, A.J.; Treybig, C.; Gurganus, C.; Halley, J. Application of Unmanned Aerial Vehicles for Monitoring Airport Asset Surfaces. Transp. Res. Rec. 2022, 2677, 458–473. [Google Scholar] [CrossRef]
  29. Kale, A.; Ricks, B.; Gandhi, R. New Measure to Understand and Compare Bridge Conditions Based on Inspections Time-Series Data. J. Infrastruct. Syst. 2021, 27, 04021037. [Google Scholar] [CrossRef]
  30. El-Abbasy, M.S.; El Chanati, H.; Mosleh, F.; Senouci, A.; Zayed, T.; Al-Derham, H. Integrated performance assessment model for water distribution networks. Struct. Infrastruct. Eng. 2016, 12, 1505–1524. [Google Scholar] [CrossRef]
  31. Grigg, N.S. Water Main Breaks: Risk Assessment and Investment Strategies. J. Pipeline Syst. Eng. Pr. 2013, 4, 4013001. [Google Scholar] [CrossRef]
  32. Abouhamad, M.; Zayed, T. Fuzzy Preference Programming Framework for Functional Assessment of Subway Networks. Algorithms 2020, 13, 220. [Google Scholar] [CrossRef]
  33. de Jager, P.; Wall, K. A pragmatic derivative method to assess the condition of a public health built infrastructure portfolio. J. S. Afr. Inst. Civ. Eng. 2022, 64, 42–49. [Google Scholar] [CrossRef]
  34. Rust, F.C.; Wall, K.; Smit, A.M.; Amod, S. South African infrastructure condition—An opinion survey for the SAICE Infrastructure Report Card. J. S. Afr. Inst. Civ. Eng. 2021, 63, 35–46. [Google Scholar] [CrossRef]
  35. Grigg, N.S. President Biden’s Infrastructure Plan: Does it address needs of water systems in the United States? Int. J. Water Resour. Dev. 2021, 38, 346–350. [Google Scholar] [CrossRef]
  36. Reuters, T. Web of Science. 2017. Available online: https://web.archive.org/web/20170224013916/http://wokinfo.com/citationconnection/realfacts (accessed on 6 May 2023).
  37. Ishizaka, A.; Pearman, C.; Nemery, P. AHPSort: An AHP-based method for sorting problems. Int. J. Prod. Res. 2012, 50, 4767–4784. [Google Scholar] [CrossRef]
  38. Gormley, W.T.; Weimer, D.L. Organizational Report Cards. J Public Policy 1999, 19, 313–320. [Google Scholar] [CrossRef]
  39. National Council on Public Works Improvement. Fragile Foundations: A Report on America’s Public Works; National Council on Public Works Improvement: Washington, DC, USA, 1988. [Google Scholar]
  40. American Society of Civil Engineers. 1998 Report Card for America’ s Infrastructure; American Society of Civil Engineers: Reston, VA, USA, 1998. [Google Scholar]
  41. American Society of Civil Engineers. 2001 Report Card for America’s Infrastructure; American Society of Civil Engineers: Reston, VA, USA, 2001. [Google Scholar]
  42. American Society of Civil Engineers. 2005 Report Card for America’s Infrastructure; American Society of Civil Engineers: Reston, VA, USA, 2005. [Google Scholar]
  43. American Society of Civil Engineers. 2009 Report Card for America’s Infrastructure; American Society of Civil Engineers: Reston, VA, USA, 2009. [Google Scholar]
  44. American Society of Civil Engineers. 2013 Report Card for America’s Infrastructure; American Society of Civil Engineers: Reston, VA, USA, 2013. [Google Scholar]
  45. American Society of Civil Engineers. 2017 Infrastructure Report Card; American Society of Civil Engineers: Reston, VA, USA, 2017. [Google Scholar] [CrossRef]
  46. American Society of Civil Engineers. Report Card for America’s Infrastructure; American Society of Civil Engineers: Reston, VA, USA, 2021. [Google Scholar]
  47. Longley, K. ASCE’s 2017 Infrastructure Report Card. ASCE Gives Thanks in 2019. 2019. Available online: https://www.infrastructurereportcard.org/asce-gives-thanks-in-2019/ (accessed on 25 May 2020).
  48. UNESCO. Engineering: Issues Challenges and Opportunities for Development; UNESCO: Paris, France, 2010. [Google Scholar]
  49. Grigg, N.S. Infrastructure Report Card: Purpose and Results. J. Infrastruct. Syst. 2015, 21, 02514001. [Google Scholar] [CrossRef]
  50. Institution of Engineers Australia. Infrastructure Report Card 2010 Australia; Institution of Engineers: Barton, Australia, 2010. [Google Scholar]
  51. SAICE. The SAICE Infrastructure Report Card for South Africa: 2006; SAICE: Midrand, South Africa, 2006. [Google Scholar]
  52. Parliament of the Republic of South Africa. White Paper on Reconstruction and Development Programme; Government Gazette No 16085 Notice No 1954 of 1994; Parliament of the Republic of South Africa: Cape Town, South Africa, 1994; p. 353.
  53. SAICE. SAICE Infrastructure Report Card for South Africa 2011; SAICE: Midrand, South Africa, 2011. [Google Scholar]
  54. SAICE. SAICE 2017 Infrastructure Report Card for South Africa; SAICE: Midrand, South Africa, 2017. [Google Scholar]
  55. Wall, K.; Rust, C. A rating tool to access the condition of South African infrastructure. In Proceedings of the Smart and Sustainable Built Environment (SASBE) Conference, Pretoria, South Africa, 9–11 December 2015; Volume 9. [Google Scholar]
  56. Institution of Civil Engineers. The State of the Nation: Waste and Resource Management; Institution of Civil Engineers: London, UK, 2011. [Google Scholar]
  57. Institution of Civil Engineers. The State of the Nation: Infrastructure 2010; Institution of Civil Engineers: London, UK, 2010. [Google Scholar]
  58. Institution of Civil Engineers. The State of The Nation: Infrastructure 2014; Institution of Civil Engineers: London, UK, 2014. [Google Scholar]
  59. Larson, N. Infrastructure Report Cards – A Comparison of Canadian and International Experiences; McMaster University: Hamilton, ON, Canada, 2012. [Google Scholar]
  60. PSC. The 2019 Canada Infrastructure Report Card; Public Service Commission: Ottawa, ON, USA, 2019.
  61. PSC. Informing the Future; Public Service Commission: Ottawa, ON, USA, 2016.
  62. PSC. Canadian Infrastructure Report Card, Volume 1: 2012—Municipal Roads and Water Systems; Canadian Infrastructure Report Card; Public Service Commission: Ottawa, ON, USA, 2012.
  63. EIZ. Infrastructure Report Card (IRC) Framework; EIZ: Zürich, Switzerland, 2012. [Google Scholar]
  64. EIZ. 2014 Baseline Report Card for Zambia’s Infrastructure; EIZ: Zürich, Switzerland, 2015. [Google Scholar]
  65. Muya, M.; Kaluba, C.; Nzali Banda, I.; Rattray, S.; Mubemba, C.; Mukelabai, G. Infrastructure Watch Culture: Zambia’s Infrastructure Report Card. Civ. Eng. Architect. 2017, 5, 8–17. [Google Scholar] [CrossRef]
  66. Ghana Institution of Engineers. GhIE Ghana Infrastructure Report Card 2016; Ghana Institution of Engineers: Accra, Ghana, 2016. [Google Scholar] [CrossRef]
  67. AICCP-IC. Las Obras y Servicios Públicos a Examen; AICCP-IC: Pittsburgh, PA, USA, 2019. [Google Scholar]
  68. Price, W.T. Reporting on the Infrastructure Report Card. Why grade the nation’s public works? Public Works Manag. Policy 1999, 4, 50–57. [Google Scholar] [CrossRef]
  69. Boix-Cots, D.; Pardo-Bosch, F.; Pujadas, P. A systematic review on multi-criteria group decision-making methods based on weights: Analysis and classification scheme. Inf. Fusion 2023, 96, 16–36. [Google Scholar] [CrossRef]
  70. Boix-Cots, D.; Pardo-Bosch, F.; Pujadas, P. A hierarchical integration method under social constraints to maximize satisfaction in multiple criteria group decision making systems. Expert Syst. Appl. 2023, 216, 119471. [Google Scholar] [CrossRef]
Figure 1. Paper’s methodology.
Buildings 13 02166 g001
Figure 2. IRCs analysed sectors.
Buildings 13 02166 g002
Figure 3. IRCs assessment used criteria.
Buildings 13 02166 g003
Table 1. IRCs comparison guidelines.
CategoryGuidelineQuestion
Methodology
Assessment
EditorWhich is the main IRC editor institution?
External supportStakeholders have been involved at IRC publication?
Assessment methodology traceabilityIRC methodology is clearly explained?
Studied sectorsHow many sectors are studied?
Stated and assessed sub-sectorsThere are assessed sub-sectors?
CriteriaHow many criteria have been used to assess the sectors?
SustainabilityWhat level of importance is assigned to sustainability throughout the IRC?
Objectivity vs. SubjectivityDoes the assessment rely on expert opinions or on quantitative indicators?
TransversalityStakeholders are directly considered during the assessment?
Experts’ opinion traceabilityThe experts’ assessment criteria or results are shown?
Use of sub-indicatorsSub-indicators are directly used to assess the sectors?
Sub-indicators assessment traceabilityIf used, sub-indicators can be traced and are transparent to replicate?
ResultsEvaluation CodeThe assessment uses alphabetical, numerical or percentual codes?
Sector Grade Up recommendationsRise up sector recommendations are given?
Economic future needsEconomic future needs are stated for every sector?
Maintenance vs. UpgradingAre the distinctions between maintenance and improvement needs clear?
FormatResults PresentationThe IRC allows a consecutive and understandable reading for non-experts?
Visual ContentHow much visual information does the IRC provide?
LengthWhich is the report length?
Table 2. United States of America’s IRC studied sectors.
Sector1998200120052009201320172021
Roads
Bridges
Transit
Aviation
Rail
Inland Waterways
Ports
Drinking water
Wastewater
Damns
Levees
Solid waste
Hazardous waste
Schools
Public parks
Energy
Stormwater
Security
Table 3. United States of America’s IRC used criteria.
1998–2001–200520092013–2017–2021
Condition and performanceCapacityCapacity
Capacity vs. needConditionCondition
Funding vs. needFundingFunding
Future NeedFuture Need
Operation and MaintenanceOperation and Maintenance
Public SafetyPublic Safety
ResilienceResilience
Innovation
Table 4. Canada’s IRC studied sectors.
201220162019
Municipal RoadsRoads and BridgesRoads and Bridges
Drinking water systemsPublic TransitPublic Transit
Wastewater systemsPotable WaterPotable Water
Stormwater systemsWastewaterWastewater
StormwaterStormwater
BuildingsCulture, Recreation, and Sport facilities
Sport and recreation facilitiesSolid Waste
Table 5. Comparison guidelines results.
GuidelineUnited StatesAustraliaSouth AfricaUnited KingdomCanadaZambiaGhanaSpain
EditorASCEEASAICEICECIRCEIZGhIEAICCP-IC
External supportPreliminary phasePreliminary phasePreliminary phasePreliminary phaseThroughout processPreliminary phaseThroughout processThroughout process
Assessment methodology traceabilityWell-definedUnclearPreliminary guidelinesPreliminary guidelinesWell-definedWell-definedWell-definedWell-defined
Studied sectors16111067946
Stated and assessed sub-sectorsNoYes (3)Yes (29)NoYes (17)Yes (7)NoNo
Criteria81451488
SustainabilityAll sectorsCritical sectorsCritical sectorsCommentsNot consideredCritical sectorsAll sectorsAll sectors
Objectivity vs. SubjectivitySubjectiveSubjectiveSubjectiveSubjectiveObjectiveSubjectiveSubjectiveBoth
TransversalityAbsenceAbsenceAbsenceAbsenceExistenceAbsenceExistenceExistence
Experts’ opinion traceabilityNon-existentNon-existentNon-existentNon-existentPartialNon-existentNon-existentTotal
Use of sub-indicatorsNoNoNoNoNoYesNoYes
Sub-indicators assessment traceability-----Partial-Total
Evaluation CodeAlphabeticAlphabeticAlphabeticAlphabeticPercentagePercentageNumericMultiple
Sector Grade Up recommendationsCompleteHintsHintsCompleteAnyCompleteCompleteComplete
Economic future needsCompleteHintsAnyHintsAnyCompleteAnyComplete
Maintenance vs. UpgradingCompleteHintsHintsHintsAnyHintsHintsComplete
Results PresentationImprovedUnclearClearUnclearClearImprovedImprovedImproved
Visual Content85 VC at 17/17 sectorsNo VC8 VC at 5/10 sectors3 VC at 3/6 sectors64 VC at 7/7 sectors71 VC at 10/14 sectorsFactsheetsMultiple document
Length168 pages39 pages44 pages27 pages55 pages145 pages43 pages-
Table 6. Sector and sub-sector division.
CountrySectorSub-Sectors
AustraliaRoadsNational Roads/State Roads/Local Roads
South AfricaWaterBulk water resources
Supply in major Areas/Supply in other areas
SanitationFor major Urban Areas/For other Areas
Solid waste ManagementCollection For major Urban Areas/Collection For other Areas
Waste disposal in metros/Waste disposal in other areas
RoadsNational roads/Paved provincial roads/Paved metropolitan roads/Other paved municipal roads
AirportsACSA-Owned airports
PortsCommercial Ports
RailHeavy-haul freight lines/General freight lines
Passenger lines—PRASA/Passenger lines—Gautrain
HealthcareHospitals/Clinics
EducationPublic ordinary schools/Universities/TVET colleges
CanadaRoadsRoads/Bridges and tunnels
Culture and recreationIce Arenas and Pools/Arts and culture facilities/Other
Potable waterLinear Infrastructure/Non-linear infrastructure
wastewaterLinear Infrastructure/Non-linear infrastructure
StormwaterLinear Infrastructure/Non-linear infrastructure
Public transitRolling assets/Fixed assets
Roads/tracks
Solid wasteTransfer station
Waste diversion/Waste disposal
ZambiaWater Supply, Sanitation, and Solid WasteUrban Water Supply/Rural Water Supply
Urban Sanitation
Solid Waste Management
Information and Communication TechnologyFixed Telephone Network/Mobile Network
International Gateway, Internet Infrastructure, and ISP Networks
Satellite Network/Postal Services
Disclaimer/Publisher’s Note: The statements, opinions and data contained in all publications are solely those of the individual author(s) and contributor(s) and not of MDPI and/or the editor(s). MDPI and/or the editor(s) disclaim responsibility for any injury to people or property resulting from any ideas, methods, instructions or products referred to in the content.

