
The Thermal Potential of Wastewater for Heating and Cooling Buildings: A Case Study of a Low Exergy Building in Madrid


Abstract
:1. Introduction
- -
- The type of thermal energy that can be harnessed from wastewater, for heating or for cooling, and in which period of the year this energy is more effective.
- -
- The impact of wastewater (groundwater and rainwater) on the flow and temperature in the sewerage system and, consequently, how the efficiency of the HPs (COP/EER) is affected according to source-side temperature, building demand, and location of the heat exchanger.
- -
- The hypothetical efficiency of the thermal exchange of wastewater flowing through the sewerage systems on the actual temperature and flow rate measurements, and what is its contribution to the geothermal exchange system currently in place in the case study building.
2. Materials and Methods
3. Data Analysis
4. Results and Discussion
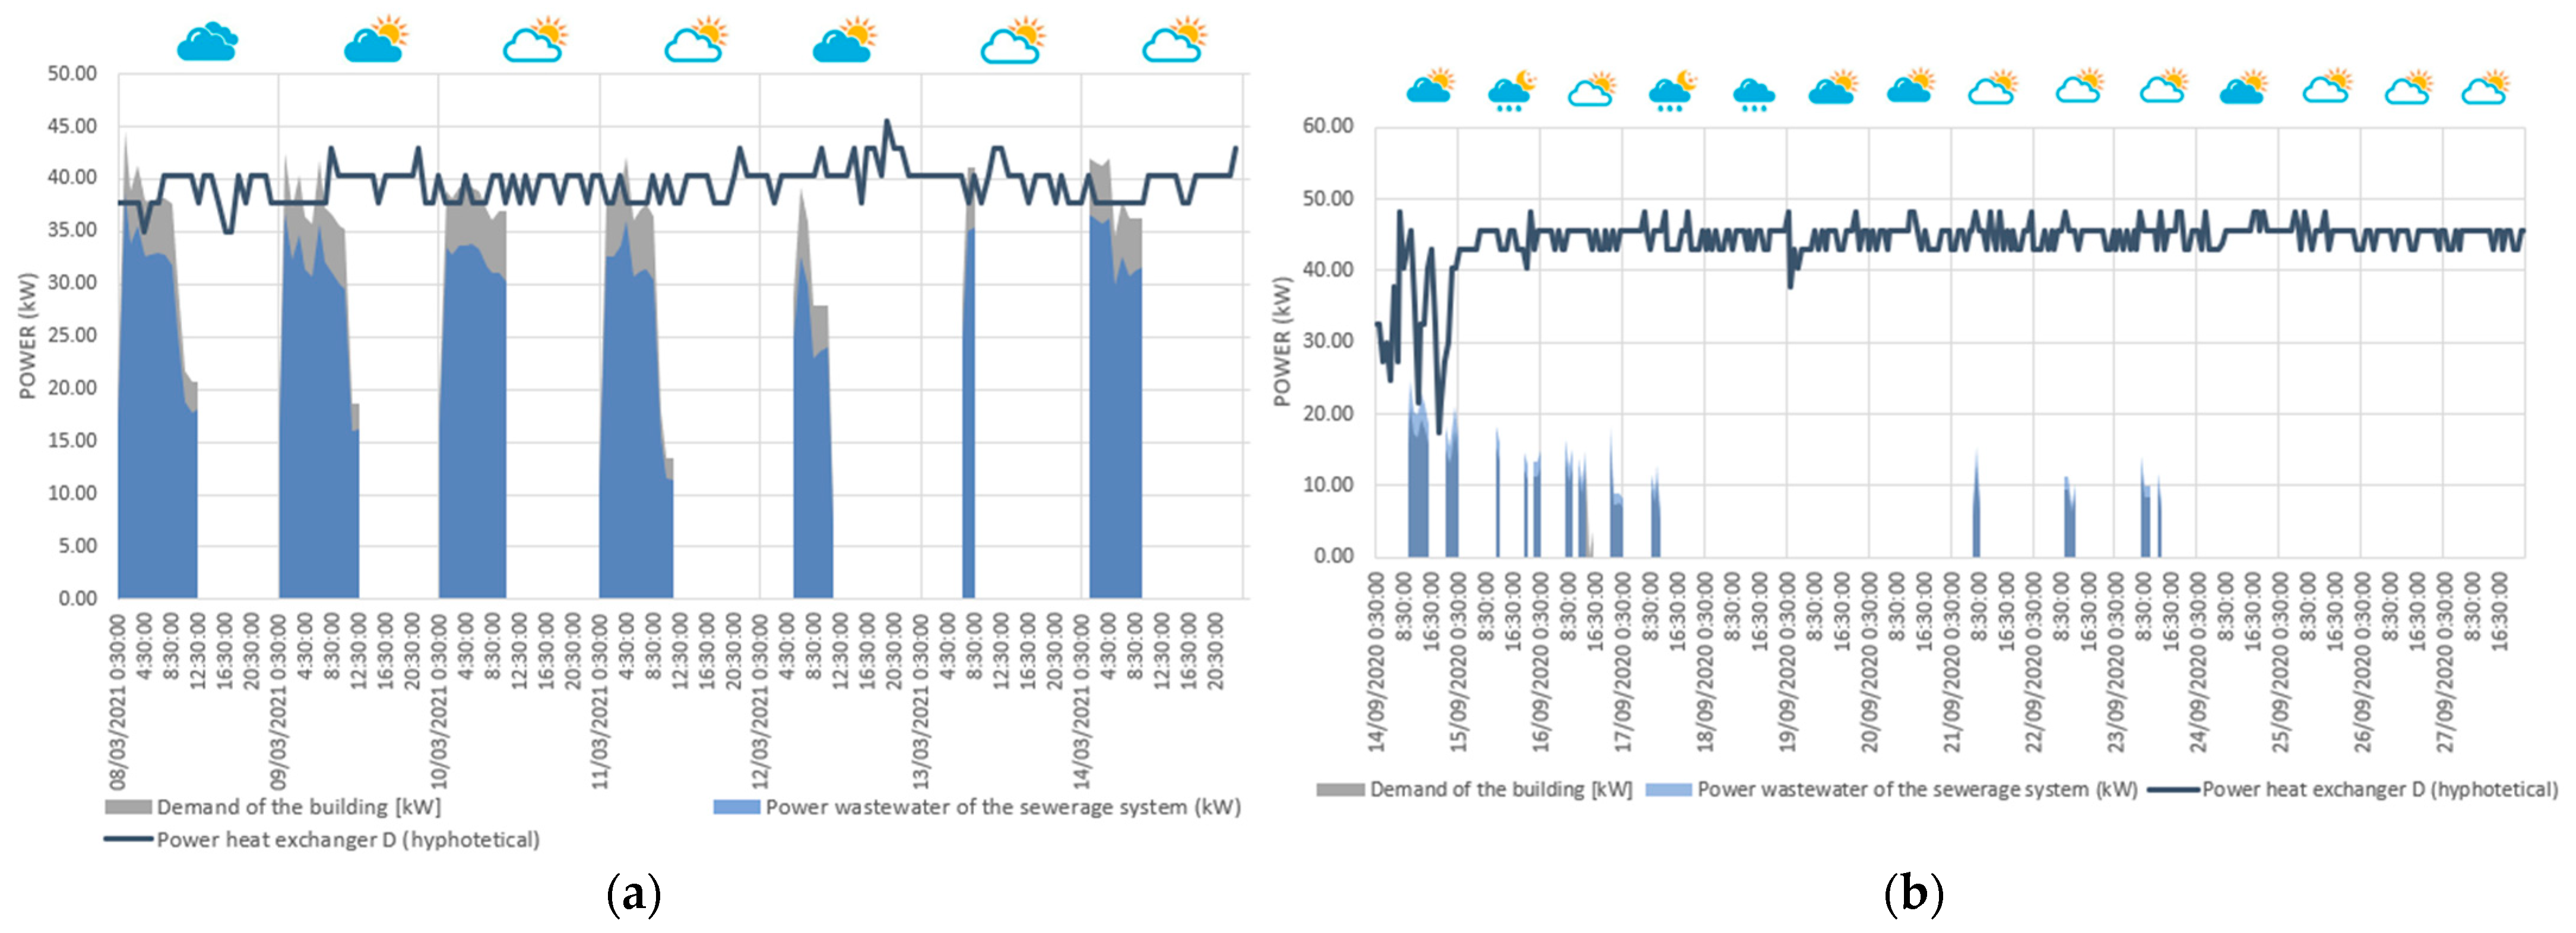
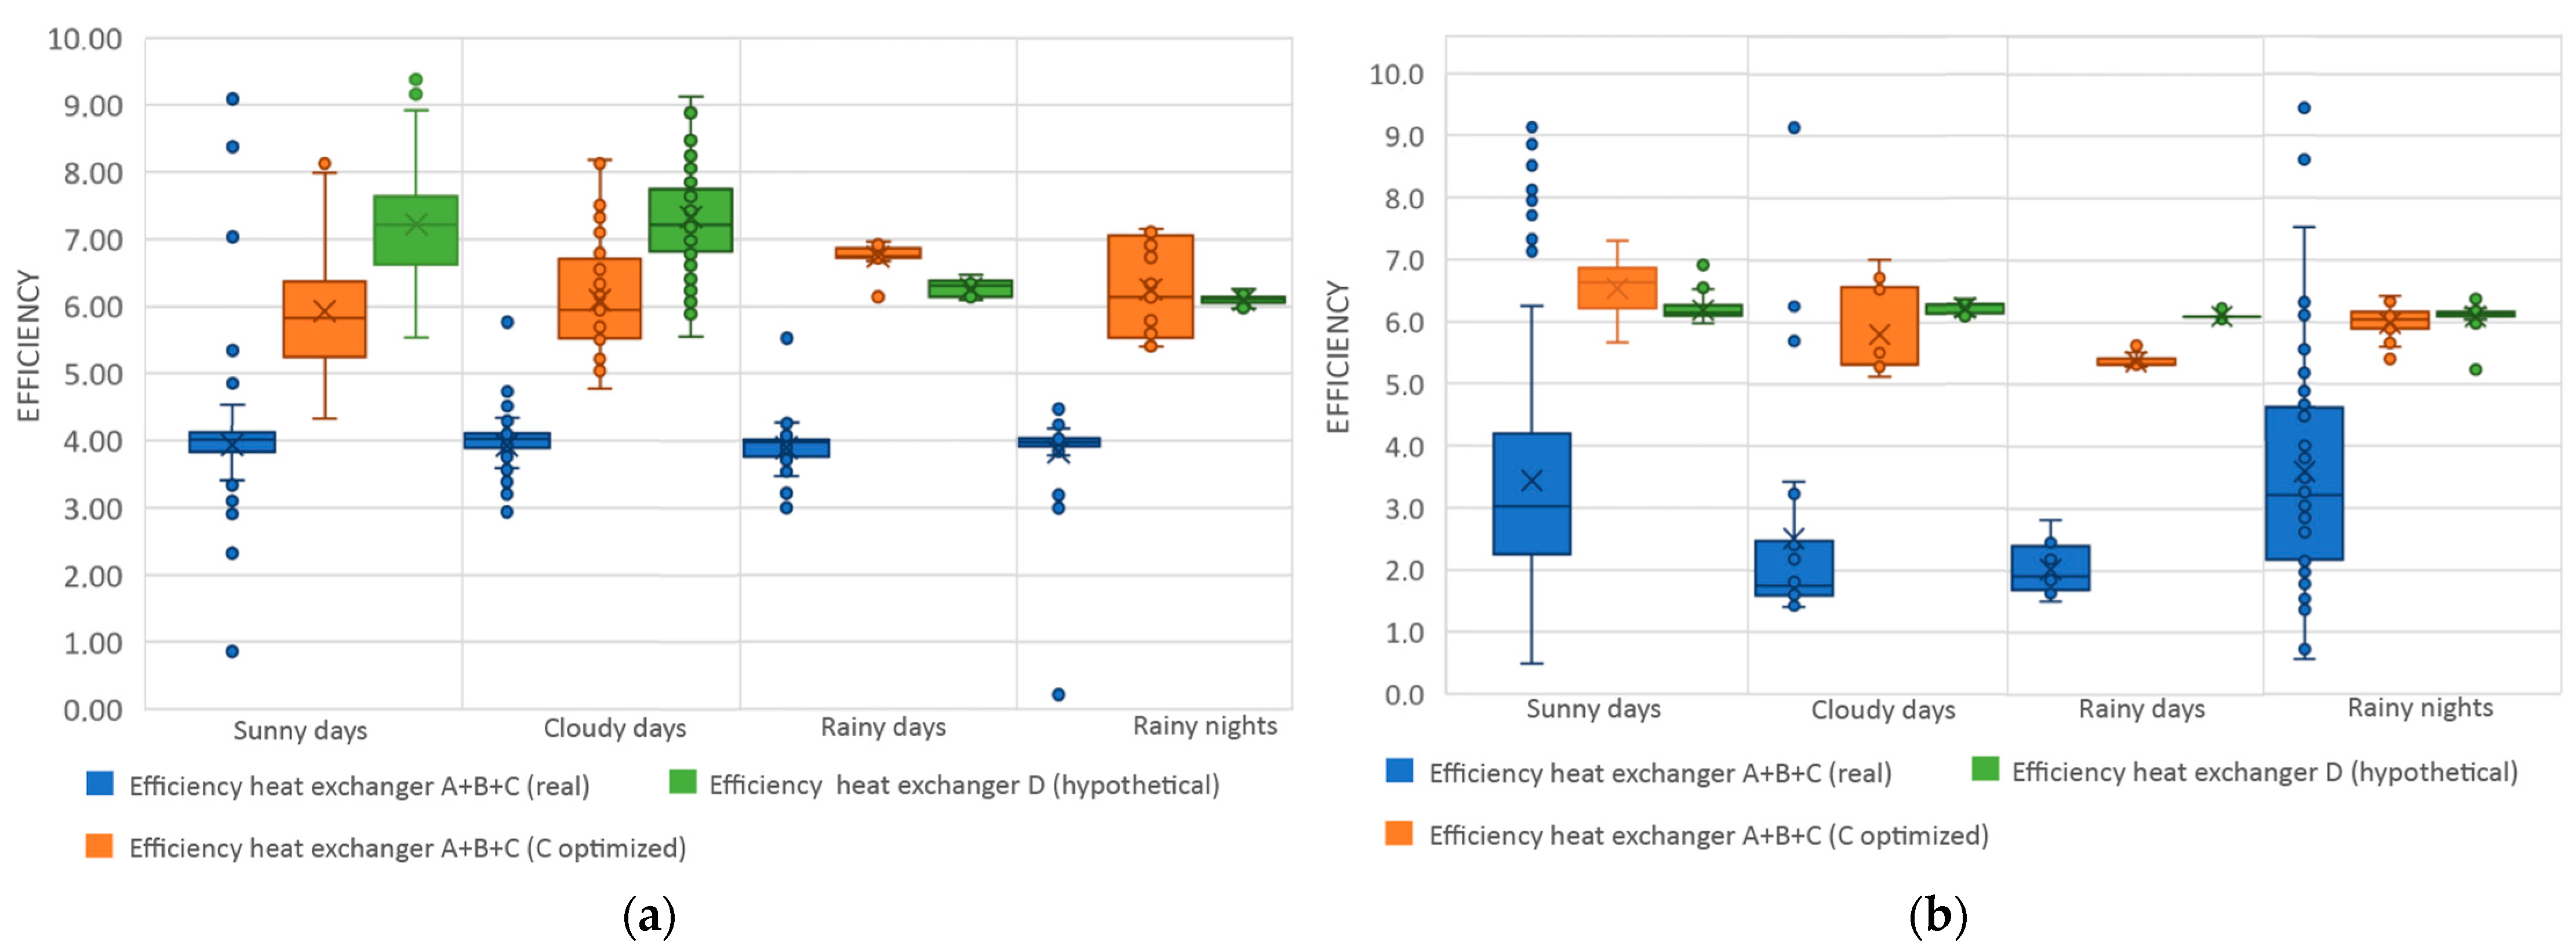
- As illustrated in Figure 7, the energy contribution of wastewater from the sewerage system (source D) resulting from the use of domestic hot water:
- o
- is beneficial for heating scenarios, since higher efficiency increases are observed for HE D compared to HE A + B + C (real) on sunny and cloudy days, with 83.60% and 86.73%, respectively, against 50.75% and 55.17% for HE A + B + C (optimized). In this case, replacing the set of A + B + C sources with source D could lead to efficiency improvements of more than 22%.
- o
- is not favorable for cooling scenarios, since lower efficiency increases are observed for HE D compared to HE A + B + C (real) on sunny days, with 79.72%, against 89.89% for HE A + B + C (optimized). In this case, the reduction in efficiency by replacing the set of A + B + C sources with source D could be up to 5%.
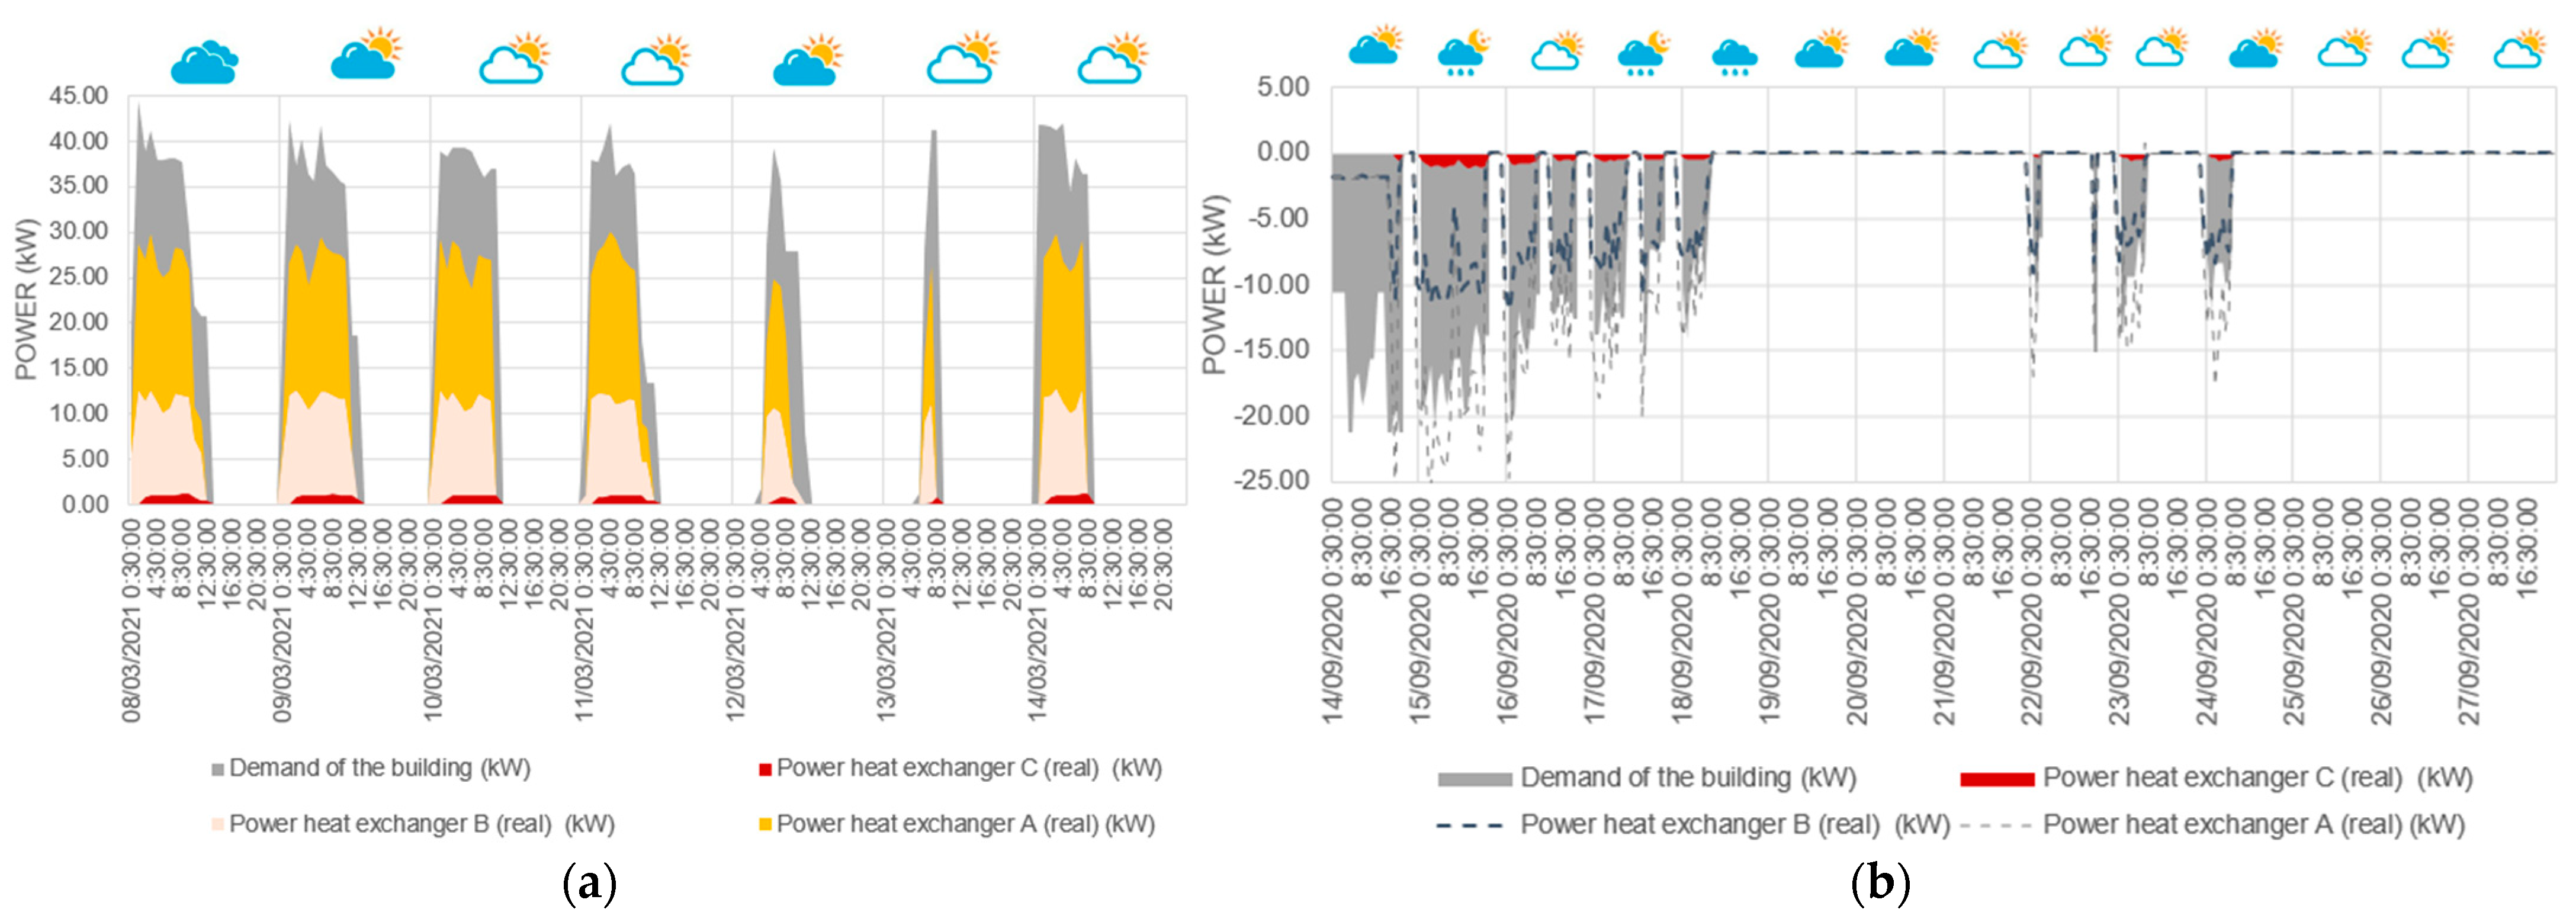
- As shows in Figure 7, the energy contribution of rainwater:
- o
- is more impactful on HE D due to the greater amount of rain collected in the sewerage system.
- o
- is not favorable for heating scenarios, since lower performance increases are observed for HE D compared to HE A + B + C (real) on rainy days and rainy nights, with 61.07% and 59.15%, respectively, against 73.19% and 63.21% for HE A + B + C (optimized). In this case, the reduction in efficiency by replacing the set of A + B + C sources with source D could be up to 7%.
- o
- is beneficial for cooling scenarios, since higher efficiency increases are observed for HE D compared to HE A + B + C (optimized) on rainy days and rainy nights with 201.97% and 69.92%, respectively, against 165.87% and 66.89% for HE A + B + C (optimized). In this case, replacing the set of A + B + C sources with source D could lead to efficiency improvements of more than 14%.
5. Conclusions
Author Contributions
Funding
Data Availability Statement
Acknowledgments
Conflicts of Interest
Nomenclature
| WWHR | Wastewater Heat Recovery |
| TABS | Thermo-Active Building System |
| HE | Heat Exchanger |
| HEs | Heat Exchangers |
| HP | Heat Pump |
| HPs | Heat Pumps |
| WWTP | Wastewater Treatment Plant |
| HVAC | Heating, Ventilation and Air Conditioning |
| BMS | Building Management System |
| COP | Coefficient of performance |
| EER | Energy Efficiency Ratio |
| A, B | Geothermal sources |
| C | Groundwater + rainwater |
| D | Sewerage wastewater (domestic wastewater + rainwater) |
References
- Cardona-Montoya, G.; Restrepo, J.C.; Londo, D.; Mu, F. Fossil or bioenergy? Global fuel market trends. Renew. Sustain. Energy Rev. 2021, 143, 110905. [Google Scholar] [CrossRef]
- Saidur, R.; Masjuki, H.H.; Jamaluddin, M.Y. An application of energy and exergy analysis in residential sector of Malaysia. Energy Policy 2007, 35, 1050–1063. [Google Scholar] [CrossRef]
- Fundación Energía sin Fronteras (EsF). Oportunidades de la Biomasa para mejorar el acceso local a la Energía en comunidades rurales aisladas de Amércia Latina. Fund. Energía sin Front. 2012, 13–21. Available online: https://pfcyl.es/biblioteca/biomasa-desarrollo-oportunidades-biomasa-mejorar-acceso-local-energia-comunidades-rurales (accessed on 19 April 2021).
- Bosseboeuf, D.; Gynther, L.; Lapillonne, B.; Pollier, K.; Altdorfer, F.; Schlomann, B.; Dinneen, D.; Klavs, G.; Rosenberg, E.; Jellinek, R.; et al. Energy Efficiency Trends and Policies in the Household and Tertiary Sectors. 2015. Available online: https://www.odyssee-mure.eu/publications/archives/energy-efficiency-trends-policies-buildings.pdf (accessed on 28 April 2021).
- International Renewable Energy Agency. How to Transform the Energy System and Reduce Carbon Emissions. 2019. Available online: https://www.irena.org/DigitalArticles/2019/Apr/How-To-Transform-Energy-System-And-Reduce-Carbon-Emissions (accessed on 6 June 2021).
- de Klijn-Chevalerias, M.M.; Javed, S. The Dutch approach for assessing and reducing environmental impacts of building materials. Build. Environ. 2017, 111, 147–159. [Google Scholar] [CrossRef]
- Kurnitski, J.; Kuusk, K.; Tark, T.; Uutar, A.; Kalamees, T.; Pikas, E. Energy and investment intensity of integrated renovation and 2030 cost optimal savings. Energy Build. 2014, 75, 51–59. [Google Scholar] [CrossRef]
- Schmidt, D. Low exergy systems for high-performance buildings and communities. Energy Build. 2009, 41, 331–336. [Google Scholar] [CrossRef]
- Hosokawa Menéndez, K.J. Comportamiento Termomecánico de las Estructuras Termoactivas. Ph.D. Thesis, Universidad Politécnica de Madrid, Madrid, Spain, 2019. [Google Scholar]
- Ortega Cubero, I.; del Ama Gozalo, F.; Alonso González, A.; Hernández Ramos, J.A.; Villanueva Peñalver, A.; Guitiérrez Fernández-Cuervo, R.; Ortega, J.M.; de Pereda Fernández, L. Guía Sobre Estructuras Termoactivas y Sistemas Inerciales en la Climatización de Edificios. 2014. Available online: https://www.fenercom.com/wp-content/uploads/2014/11/Guia-sobre-Estructuras-Termoactivas-y-Sistemas-Inerciales-en-la-Climatizacion-de-Edificios-fenercom-2014.pdf (accessed on 25 May 2021).
- Cao, X.; Dai, X.; Liu, J. Building energy-consumption status worldwide and the state-of-the-art technologies for zero-energy buildings during the past decade. Energy Build. 2016, 128, 198–213. [Google Scholar] [CrossRef]
- Schmid, F. Sewage water: Interesting heat source for heat pumps and chillers. In Proceedings of the 9th International IEA Heat Pump Conference, Zürich, Switzerland, 20–22 May 2008. [Google Scholar]
- Kaufman, R. Waste Wattage: Cities Aim to Flush Heat Energy Out of Sewers. National Geographic News. 11 December 2012. Available online: https://www.nationalgeographic.com/science/article/121211-sewage-heat-recovery (accessed on 6 June 2021).
- Innners. Heat Recovery from the Sewer System. 2015. Available online: http://www.vlario.be/site/files/Appendix-6-Heat-recovery-from-the-sewer-system.pdf (accessed on 19 May 2021).
- de Pereda, L.; Fernández, J.; Lanao, H.; Durango, M. Use of the energy of the urban Wastewater network for the thermal conditioning of the swimming pool of the Moratalaz Sports Centre. Build. Manag. 2018, 2, 66. [Google Scholar] [CrossRef]
- Nagpal, H.; Spriet, J.; Murali, M.K.; McNabola, A. Heat recovery from wastewater—A review of available resource. Water 2021, 13, 1274. [Google Scholar] [CrossRef]
- Sievers, J.; Londong, J.; Stübler, A.; Bestenlehner, D.; Drück, H.; Schönfelder, W. Heat recovery potential of domestic grey water in the pilot project Jenfelder Au in Hamburg. In Proceedings of the 17th International EWA Symposium “WatEnergyResources–Water, Energy and Resources: Innovative Options and Sustainable Solutions” during IFAT, Hennef, Germany, 5–9 May 2014; pp. 5–9. [Google Scholar]
- Bohra, V.; Ahamad, K.U.; Kela, A.; Vaghela, G.; Sharma, A.; Deka, B.J. Energy and resources recovery from wastewater treatment systems. Clean Energy Resour. Recover. Wastewater Treat. Plants Biorefineries 2021, 2, 17–36. [Google Scholar] [CrossRef]
- Mazhar, A.R.; Liu, S.; Shukla, A. A key review of non-industrial greywater heat harnessing. Energies 2018, 11, 386. [Google Scholar] [CrossRef] [Green Version]
- HUBER Tecnology. Aprovechamiento del Calor Perdido de las Aguas Residuales Generadas In Situ—Informe Práctico Utilizando el Ejemplo de la Residencia de Ancianos Hofmatt/Suiza. HUBER Report. Available online: https://www.huber.de/es/huber-report/ablage-berichte/energy-from-wastewater/aprovechamiento-del-calor-perdido-de-las-aguas-residuales-generadas-in-situ-informe-practico-utilizando-el-ejemplo-de-la-residencia-de-ancianos-hofmattsuiza.html (accessed on 25 May 2021).
- Ibn-Mohammed, T.; Greenough, R.; Taylor, S.; Ozawa-Meida, L.; Acquaye, A. Operational vs. embodied emissions in buildings—A review of current trends. Energy Build. 2013, 66, 232–245. [Google Scholar] [CrossRef]
- Cipolla, S.S.; Maglionico, M. Heat recovery from urban wastewater: Analysis of the variability of flow rate and temperature. Energy Build. 2014, 69, 122–130. [Google Scholar] [CrossRef]
- Cipolla, S.S.; Maglionico, M. Heat recovery from urban wastewater: Analysis of the variability of flow rate and temperature in the sewer of Bologna, Italy. Energy Procedia 2014, 45, 288–297. [Google Scholar] [CrossRef] [Green Version]
- Culha, O.; Gunerhan, H.; Biyik, E.; Ekren, O.; Hepbasli, A. Heat exchanger applications in wastewater source heat pumps for buildings: A key review. Energy Build. 2015, 104, 215–232. [Google Scholar] [CrossRef]
- Stec, A.; Kordana, S. Analysis of profitability of rainwater harvesting, gray water recycling and drain water heat recovery systems. Resour. Conserv. Recycl. 2015, 105, 84–94. [Google Scholar] [CrossRef]
- Aladenola, O.O.; Adeboye, O.B. Assessing the potential for rainwater harvesting. Water Resour. Manag. 2010, 24, 2129–2137. [Google Scholar] [CrossRef]
- de Sá Silva, A.C.R.; Bimbato, A.M.; Balestieri, J.A.P.; Vilanova, M.R.N. Exploring environmental, economic and social aspects of rainwater harvesting systems: A review. Sustain. Cities Soc. 2022, 76, 103475. [Google Scholar] [CrossRef]
- de Isabel, J.A.; García, M.; Egido, C. Guía de Auditorías Energéticas en Edificios de Oficinas en la Comunidad de Madrid. 2009. Available online: https://gestiona3.madrid.org/bvirtual/BVCM015006.pdf (accessed on 4 July 2021).
- UNE-EN 14511-3:2023|Normas AENOR. Available online: https://tienda.aenor.com/norma-une-en-14511-3-2023-n0071363?_gl=1*y0cny3*_up*MQ..&gclid=CjwKCAjw-vmkBhBMEiwAlrMeF6ZEn-fe9ZYVN_w0BU1GkPeVrBISYeKoa2Te8143GTYLsgOtLRWS1RoCgRcQAvD_BwE&gclsrc=aw.ds (accessed on 30 June 2023).


| Heat Exchanger | Source | Situation | Name |
|---|---|---|---|
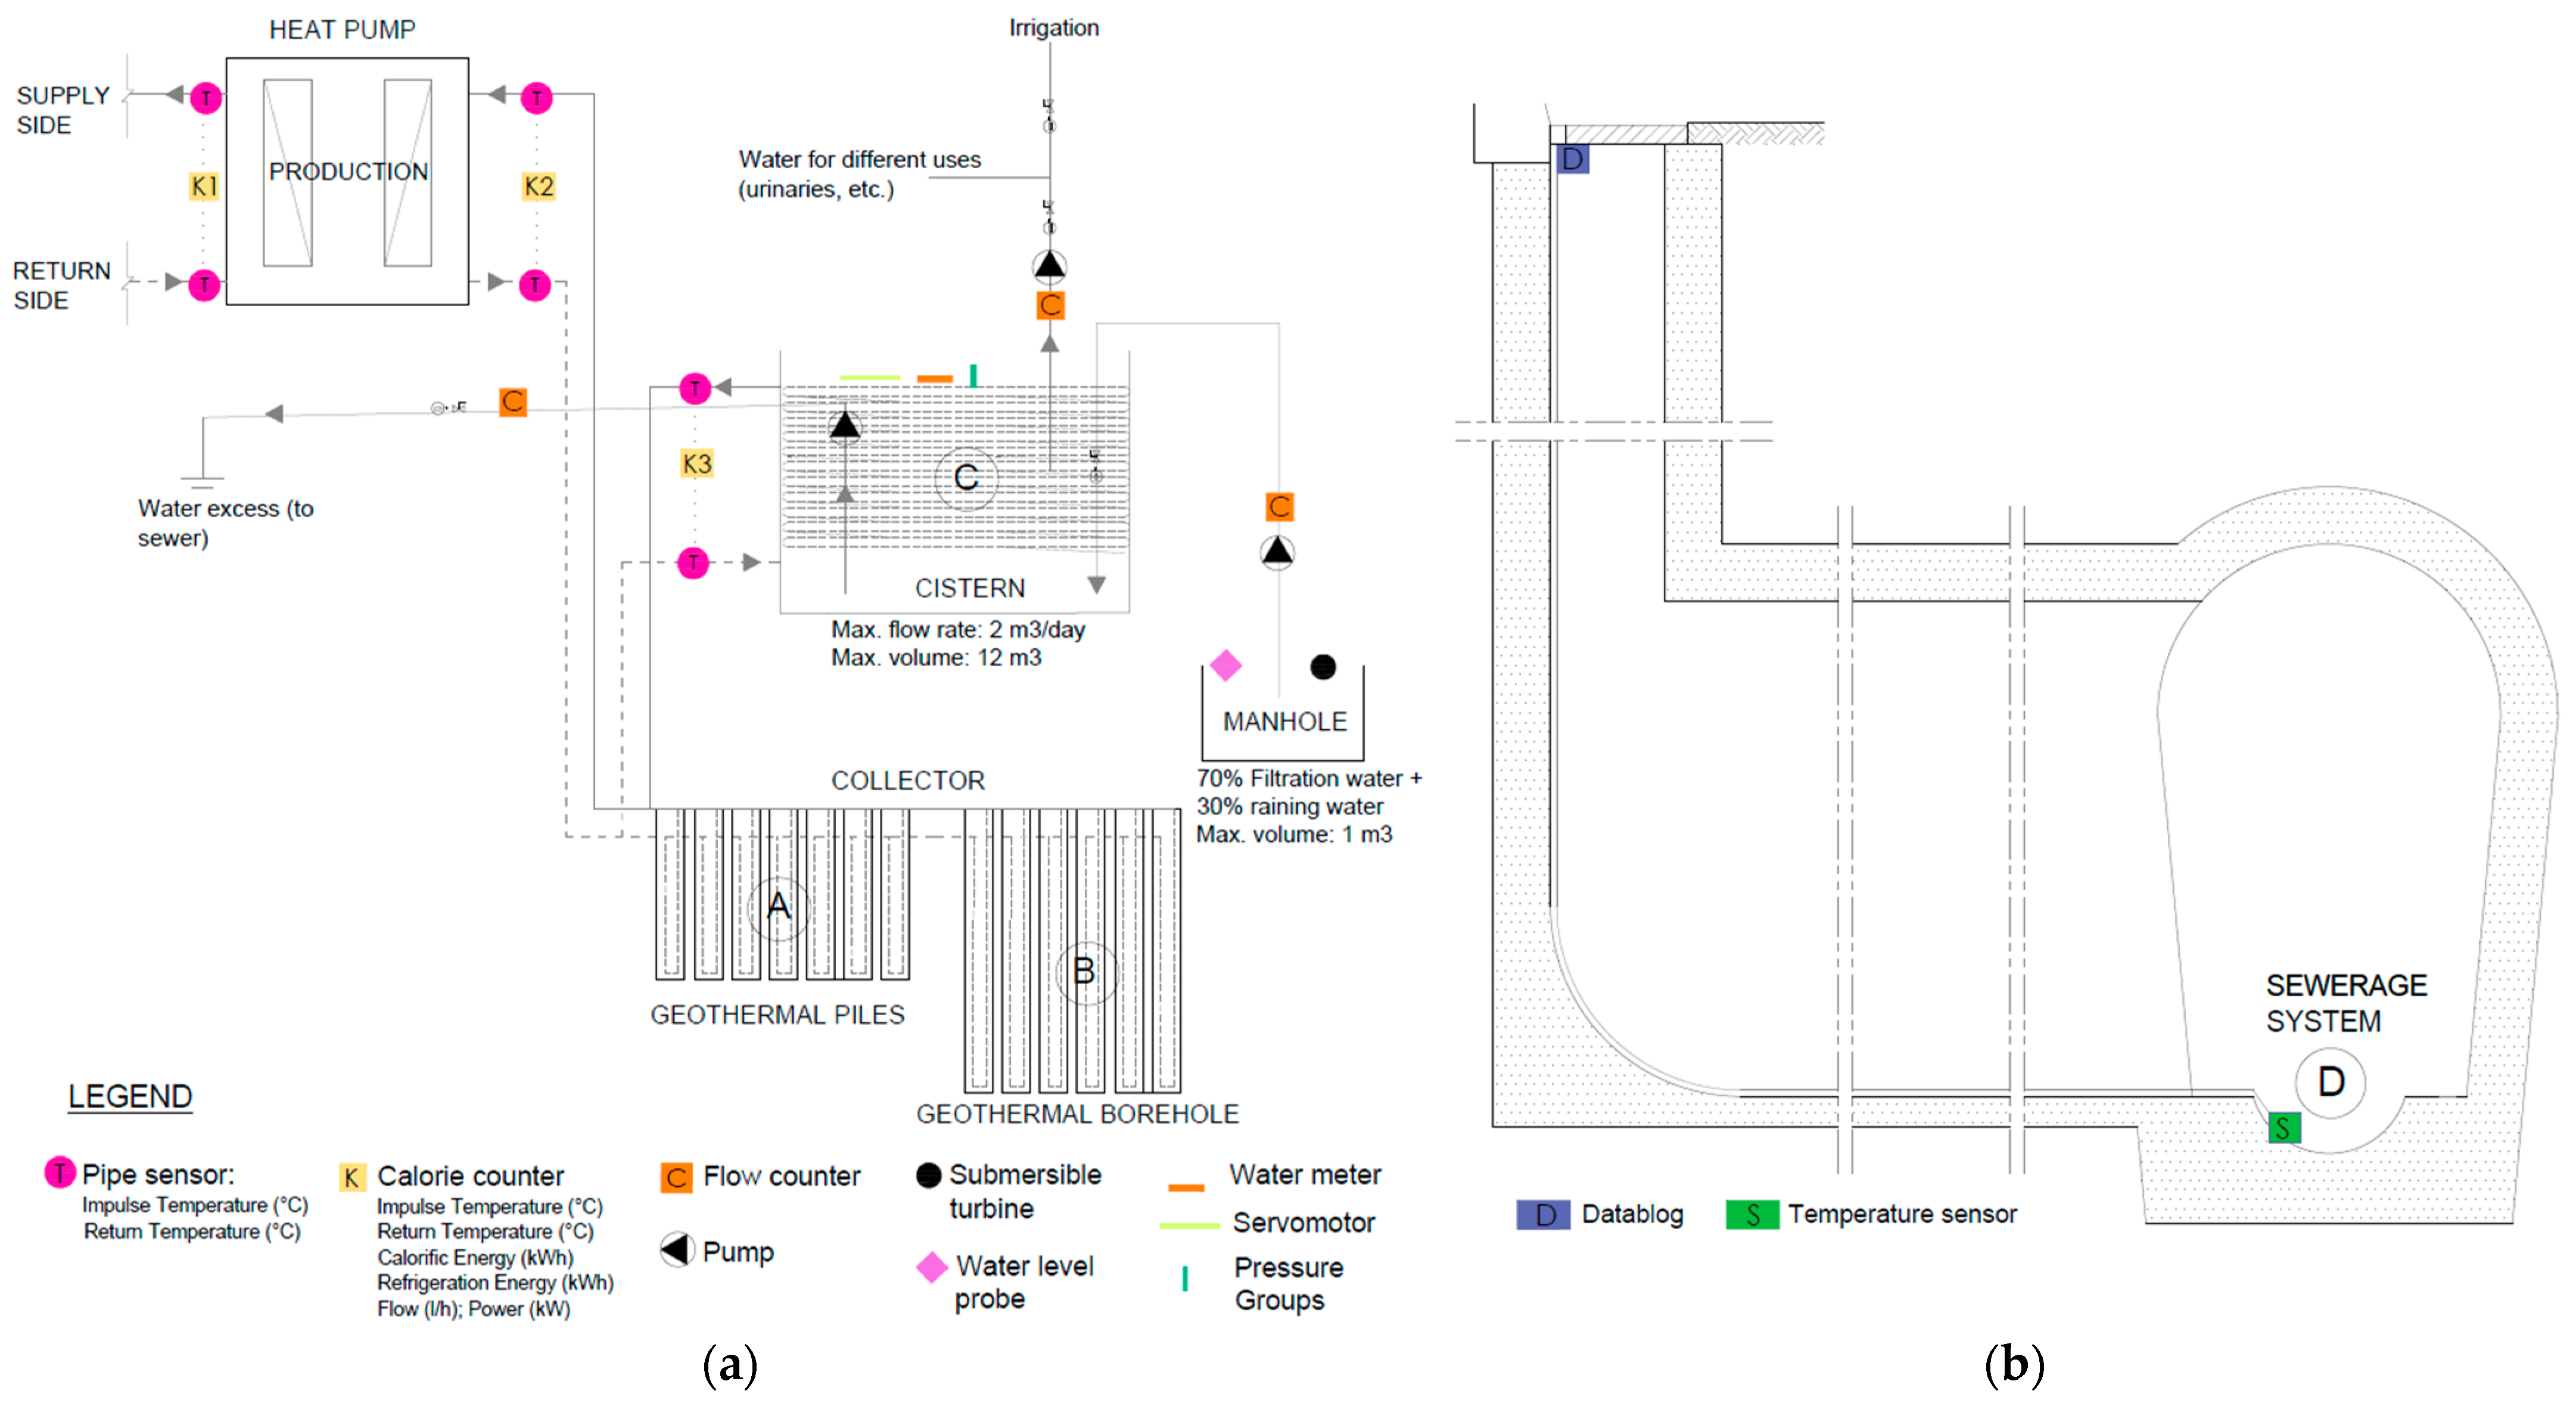
| Geothermal 10-m-deep pile | Geothermal | Real (existing) | A |
| Geothermal 100-m-deep borehole heat exchangers | Geothermal | Real (existing) | B |
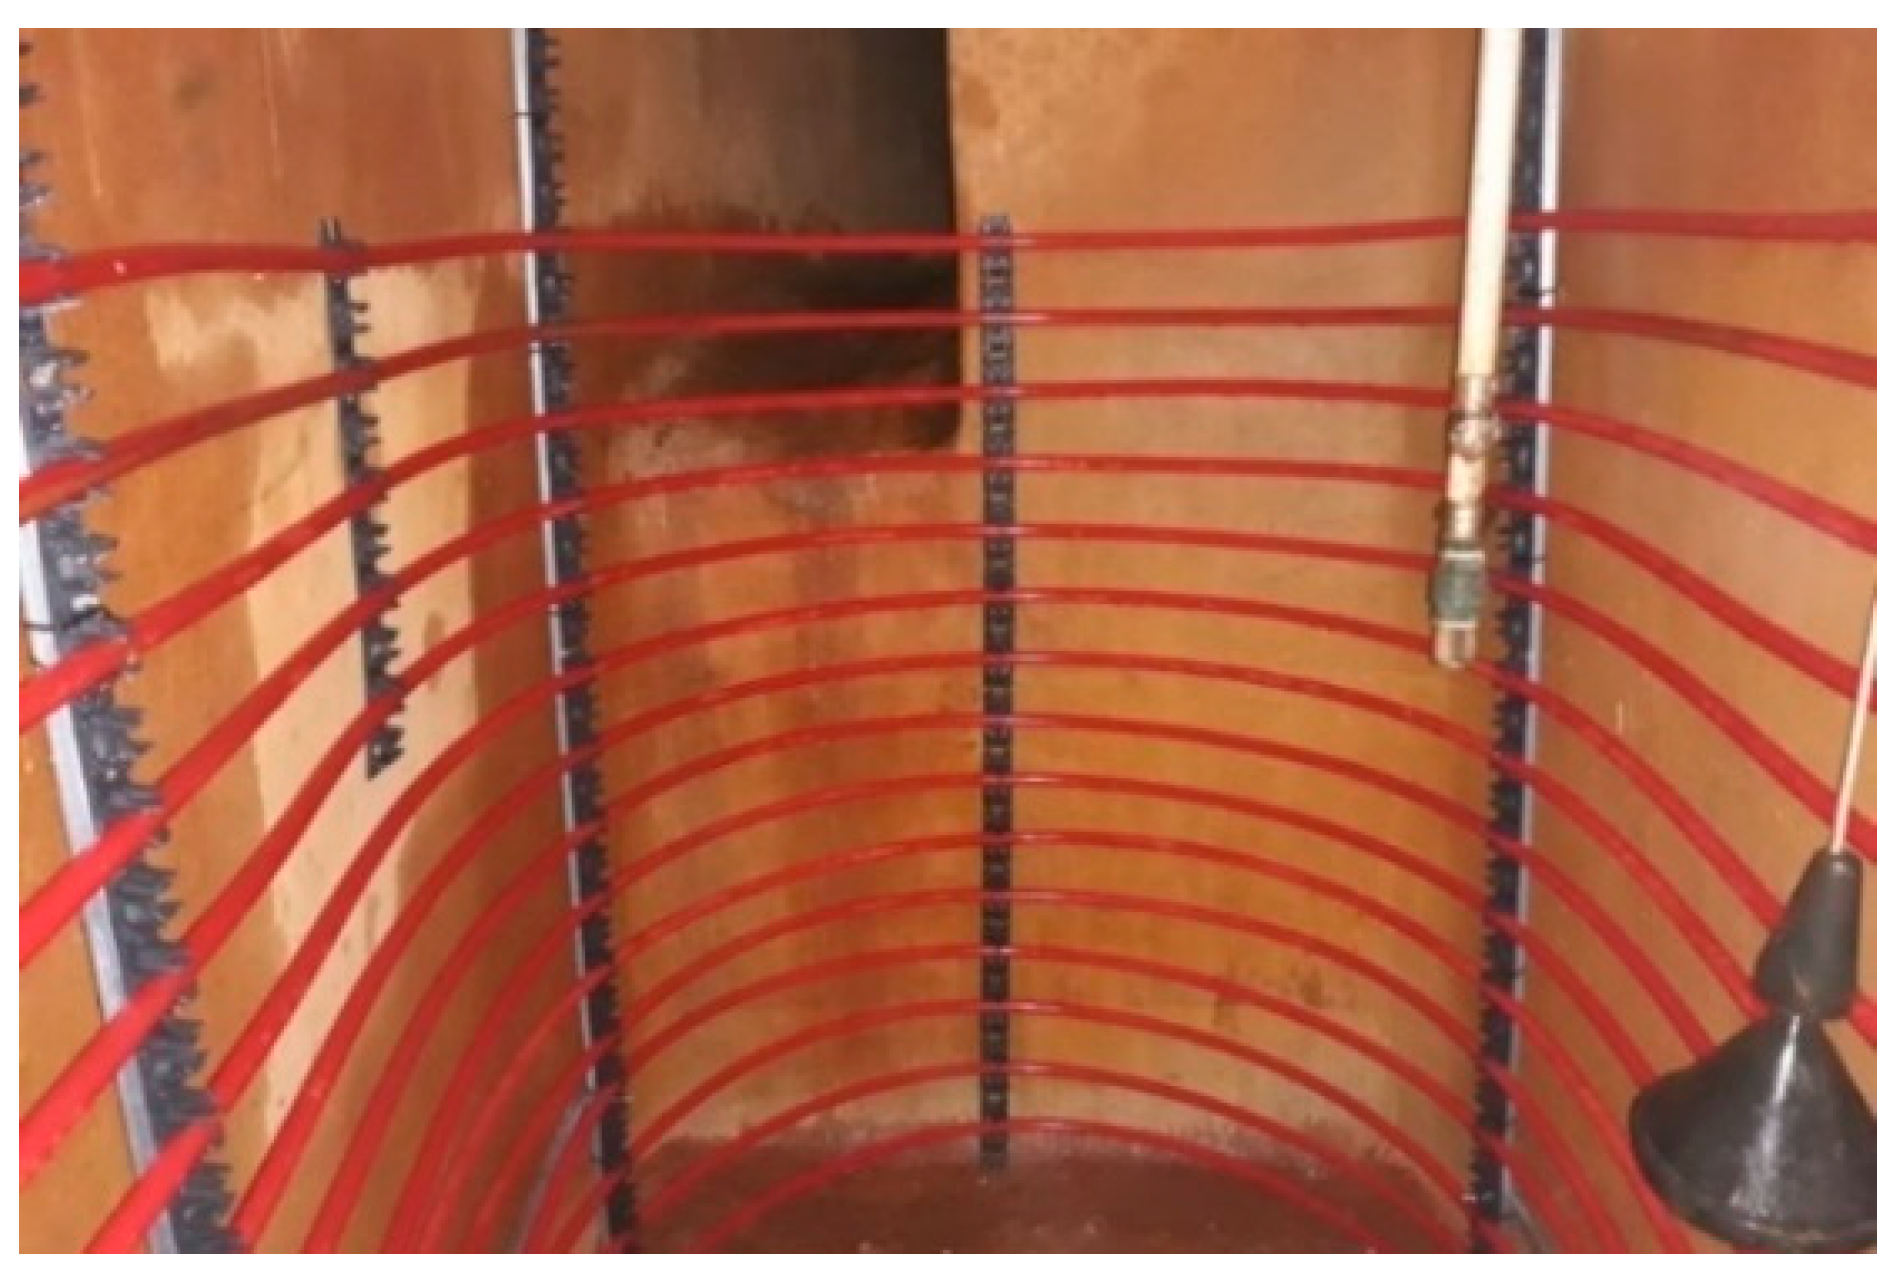
| Wastewater heat spiral exchanger (cistern) | Ground and rainwater | Real (existing) | C |
| Wastewater exchanger (sewerage system) | Domestic wastewater and rainwater | Hypothetical | D |
| Level | Source Temperature Analysis (°C) | Water Flow Temperature Analysis (°C) | Power and Coverage Analysis (kW) | Coverage Analysis (%) | Efficiency Analysis |
|---|---|---|---|---|---|
| Building | - | - | Production power (building thermal loads) (kW) | - | - |
| Heat exchanger A (real) | Average ground temperature at the level of 10-m-deep geothermal piles (°C) | Supply and return water temperature in the 10-m-deep geothermal piles (°C) | Pile exchanger system power (kW) | Pile exchanger system coverage (%) | Real heat exchanger system |
| Heat exchanger B (real) | Average ground temperature at the level of 100-m-deep borehole exchangers (°C) | Supply and return water temperature in the 100-m-deep borehole exchangers (°C) | Borehole exchanger system power (kW) | Borehole exchanger system coverage (%) | |
| Heat exchanger C (real) | Water temperature at the manhole level (groundwater) (°C) | - | - | - | |
| Water temperature at the cistern level (ground and rainwater) (°C) | Supply and return water temperature in the heat exchanger (°C) | Heat exchanger power (kW) | Heat exchanger coverage (%) | ||
| Heat exchanger D (hypothetical) | Water temperature at the sewerage system level (domestic wastewater and rainwater) (°C) | - | Wastewater heat exchanger power (kW) | Wastewater heat exchanger coverage (%) | Heat exchanger ideal |
| Heat Exchanger | COP/EER | Heating | Cooling | ||||||
|---|---|---|---|---|---|---|---|---|---|
| Sunny Days | Cloudy Days | Rainy Days | Rainy Nights | Sunny Days | Cloudy Days | Rainy Days | Rainy Nights | ||
| A + B + C (Real) | Min. | 0.86 | 2.94 | 3.00 | 0.22 | 0.49 | 1.41 | 1.50 | 0.56 |
| Median | 4.01 | 4.03 | 3.97 | 3.97 | 3.02 | 1.74 | 1.90 | 3.20 | |
| Mean | 3.93 | 3.93 | 3.89 | 3.83 | 3.44 | 2.51 | 2.02 | 3.59 | |
| Sd | 0.62 | 0.42 | 0.38 | 0.60 | 1.67 | 1.80 | 0.40 | 1.93 | |
| Max. | 9.09 | 5.77 | 5.53 | 4.47 | 10.40 | 9.14 | 2.81 | 9.45 | |
| A + B + C (C upgraded) | Min. | 4.33 | 4.78 | 6.14 | 5.41 | 5.67 | 5.13 | 5.28 | 5.41 |
| Median | 5.83 | 5.95 | 6.74 | 6.14 | 6.63 | 5.32 | 5.32 | 6.04 | |
| Mean | 5.93 | 6.09 | 6.74 | 6.26 | 6.53 | 5.80 | 5.37 | 5.98 | |
| Sd | 0.88 | 0.79 | 0.21 | 0.68 | 0.40 | 0.67 | 0.10 | 0.26 | |
| Max. | 8.19 | 8.19 | 6.96 | 7.16 | 7.30 | 7.01 | 5.63 | 6.42 | |
| D (Hypothetical) | Min. | 5.53 | 5.55 | 6.09 | 5.98 | 5.98 | 6.09 | 6.05 | 5.24 |
| Median | 7.21 | 7.22 | 6.31 | 6.12 | 6.92 | 6.29 | 6.09 | 6.14 | |
| Mean | 7.22 | 7.33 | 0.13 | 6.10 | 6.18 | 6.23 | 6.10 | 6.09 | |
| Sd | 0.77 | 0.73 | 0.13 | 0.08 | 0.15 | 0.09 | 0.04 | 0.20 | |
| Max. | 9.38 | 9.13 | 6.47 | 6.27 | 6.92 | 6.38 | 6.22 | 6.38 | |
Disclaimer/Publisher’s Note: The statements, opinions and data contained in all publications are solely those of the individual author(s) and contributor(s) and not of MDPI and/or the editor(s). MDPI and/or the editor(s) disclaim responsibility for any injury to people or property resulting from any ideas, methods, instructions or products referred to in the content. |
© 2023 by the authors. Licensee MDPI, Basel, Switzerland. This article is an open access article distributed under the terms and conditions of the Creative Commons Attribution (CC BY) license (https://creativecommons.org/licenses/by/4.0/).
Share and Cite
Gualotuña-Gualoto, D.; Martínez-Pérez, I.; Laera, R.; Pereda, L.d. The Thermal Potential of Wastewater for Heating and Cooling Buildings: A Case Study of a Low Exergy Building in Madrid. Buildings 2023, 13, 2057. https://doi.org/10.3390/buildings13082057
Gualotuña-Gualoto D, Martínez-Pérez I, Laera R, Pereda Ld. The Thermal Potential of Wastewater for Heating and Cooling Buildings: A Case Study of a Low Exergy Building in Madrid. Buildings. 2023; 13(8):2057. https://doi.org/10.3390/buildings13082057
Chicago/Turabian StyleGualotuña-Gualoto, Diana, Inmaculada Martínez-Pérez, Rossana Laera, and Luis de Pereda. 2023. "The Thermal Potential of Wastewater for Heating and Cooling Buildings: A Case Study of a Low Exergy Building in Madrid" Buildings 13, no. 8: 2057. https://doi.org/10.3390/buildings13082057