Article

Life Cycle Cost Method for Safe and Effective Infrastructure Asset Management

1
Department of Civil Engineering, Chungnam National University (CNU), Engineering Hall #2, 99 DaeHakRo, Yuseong-gu, Daejeon 34134, Republic of Korea
2
Unified Construction Soft-Tech (UNICONS), 2nd floor, 11-3, Hangang-daero 102-gil, Yongsan-gu, Seoul 04334, Republic of Korea
*
Author to whom correspondence should be addressed.
Buildings 2023, 13(8), 1983; https://doi.org/10.3390/buildings13081983
Submission received: 5 July 2023 / Revised: 28 July 2023 / Accepted: 1 August 2023 / Published: 3 August 2023

Abstract

:
Existing maintenance management systems implement periodic inspections and diagnoses and perform maintenance to restore damaged facilities, making it difficult to establish a long-term and analytical budget plan. The Framework Act on Sustainable Infrastructure Management necessitates specific implementation plans for new implementation items. This study proposes a detailed method for estimating infrastructure management cost to overcome the limitations of the post-response maintenance system and establish a management plan for the Framework Act on Sustainable Infrastructure Management, considering the performance and cost effects in terms of the life cycle. The method was classified into the following stages: analysis of the performance degradation timing by deriving the performance degradation curve, analysis of proper construction methods by performance grade to establish a cost model for each member grade, representative life assessment of the establishment to determine the end-of-life of members, and analysis of optimal action timing for establishing short/mid- to long-term repair and reinforcement plans. The proposed method was applied to a water reservoir (99 reservoirs in Seoul, Korea). The performance degradation and cost prediction models for the target establishment were analyzed. The proposed method can be applied to the maintenance decision making of the management agency and is significant for efficient infrastructure maintenance.

1. Introduction

1.1. Background and Importance

Infrastructure, including facilities, such as transportation, supply, and distribution, is the primary resource that forms the foundation and basis of a nation [1]. Around the 1970s, as the Korean economy entered a period of compressed growth, major national infrastructures gradually aged, revealing limitations in serving their original functions. Maintenance is performed according to the Special Act on the Safety Control and Maintenance of Establishments (hereinafter “Infrastructure Safety Act”) enacted after the collapse of the bridge and building in the 1990s [2]. The recent rise in concerns for the safety of infrastructure, such as underground facilities, triggered by the recent Station heat transport pipe accident (December 2018), tele-communication line fire accident (November 2018), and road sinking accident, necessitates systematic maintenance to prevent disasters [3].
Safety accidents and the aging of infrastructure necessitate improvement of existing maintenance systems. By introducing the Framework Act on Sustainable Infrastructure Management (hereinafter “Infrastructure Management Act”), enacted in 2018 and enforced in 2020 [4], the government adopted a strategic investment and management method for aging public infrastructure to prevent safety accidents and increase the efficiency of financial investment by extending the service life and improving the performance of existing facilities. The existing maintenance management system implements maintenance as follow-up measures to perform inspection, diagnosis, and damage repair [5]. In this system, damage repair increases as the facilities constituting the infrastructure deteriorate, increasing the maintenance budget. In addition, problems caused by the follow-up response method emerged. Accordingly, the framework act on establishment maintenance, individual laws, and special laws have been enacted and amended to improve existing response methods. Moreover, new tasks for maintenance entities have been created according to these laws and regulations.
Awareness of facility safety management has increased due to various incidents/accidents, and facility-related regulations have been enacted/revised to improve the existing maintenance management system. However, there is no method, manual, etc., that can implement regulations, etc., so an environment in which preemptive maintenance can be performed is required.

1.2. Scope and Methodology of Research

This study proposes a method for estimating infrastructure management cost to establish a management plan for the Infrastructure Management Act. A method for calculating infrastructure management cost is proposed to establish a management plan for maintenance entities under the Infrastructure Management Act based on the results of the maintenance trend analysis. The proposed method includes analyzing historical information on infrastructure and deriving a future management budget from a life cycle perspective. A model for future prediction is essential for analysis from a life cycle perspective. Accordingly, this study proposes a model application method for establishment of life cycle analysis and a method for establishing the optimal timing of action. The life cycle perspective refers to a method for maintaining infrastructure throughout its public lifespan considering safety, cost, and lifespan.
  • (Existing maintenance management system) Inspection and diagnosis according to the Infrastructure Safety Act ⇒ Evaluation of members and facility grades ⇒ Maintenance is performed with priority given to members with lower grades according to the allocated budget;
  • (Preemptive maintenance management system) Facility information investigation ⇒ Performance deterioration time and appropriate construction method analysis ⇒ Facility life evaluation ⇒ Optimal action time analysis ⇒ Maintenance according to condition prediction.
The analysis method was classified into four stages (Figure 1): analysis of the performance degradation timing, analysis of proper construction methods by performance grade, representative life assessment of the establishment, and analysis of the optimal timing of action. The proposed method focuses on quantitatively presenting the analysis results to establish an efficient management plan.

2. Literature Review for Preemptive Maintenance

2.1. Existing Research Trends

Regarding infrastructure, focusing on the Continuous Acquisition and Life-cycle Support (construction CALS) system used by the Ministry of Land, Infrastructure and Transport, research was conducted to present construction information service plans for the overall national infrastructure in public construction projects and future promotion methods and procedures [6] by collecting, linking, and processing major construction information from the information system of affiliated organizations. In addition, a method was proposed for implementing only the core asset management tasks without duplicating the functions of the establishment maintenance management system as a public establishment asset management information plan, dividing the structure of the system into hierarchies, and sharing information by linking the asset management system with the existing establishment maintenance management system [7]. We compared and analyzed the barriers facing the establishment of asset management systems between Libya and Spain, and we defined an asset management system as a management system for organizations to efficiently operate, maintain, optimize, and properly utilize assets (infrastructure, equipment, funds, etc.) [8].
In the river field, the current status of information systems related to the maintenance and operation of river facilities was investigated and analyzed to identify issues, and the optimal solution was presented from a practical information perspective by verifying pilot application cases [9]. For road facilities, an effective asset value evaluation process suitable for domestic conditions was proposed through a review and analysis of asset value evaluation methods [10].
In the bridge field, a regression analysis of the integration results of representative samples according to cost calculation variables was performed to develop a regression model for estimating the cost of remodeling bridges based on the basic bridge specifications in the Bridge Management System database [11]. Moreover, a cost model was derived for new construction costs, such as upper and lower structures and foundations, bridge installation, and dismantling and disposal costs [11]. In addition, a risk-based maintenance prioritization method was developed through a literature review and expert advice on evaluation criteria and weights for 14 common risk factors that cause damage to bridges [12]. In addition, a resilience-based model was developed to evaluate the periodic behavior of reinforced concrete bridge columns over time under corrosion and buckling conditions [13] and the functionality (performance) of the road network in the process of repairing damage to the bridge due to earthquakes [14].
In the field of asset management (excluding systems), various factors affecting the establishment of infrastructure asset management in various aspects of Libya and the United States were analyzed, and the importance of infrastructure asset management between the two countries and the challenges and barriers encountered during the establishment were compared and analyzed [15]. A new organizational model that can help developing countries perform infrastructure asset management was explored, and methods for designing and developing an infrastructure asset management organizational model tailored to the specific circumstances and needs of developing countries were studied [16]. In addition, strategies and methods that can be used to effectively implement infrastructure asset management in developing countries to strengthen infrastructure asset management implementation were explored [17]. Finally, to mitigate losses from infrastructure-related disasters (e.g., earthquakes, floods, heat waves, etc.) in the Middle East and North Africa, appropriate practices of infrastructure asset management were investigated [18].

2.2. Infrastructure-Related Laws

According to the Framework Act on Infrastructure Management, the Ministry of Land, Infrastructure and Transport establishes a 5-year basic plan (Article 8), and the management agency prepares a 5-year management plan (Article 9) and submits it to the Infrastructure Management Committee. When establishing a management plan, the “expenses required for the management of the relevant infrastructure (referring to expenses classified by item such as maintenance and performance improvement) and matters related to the procurement and operation of financial resources” in Article 4, Paragraph 3 of the Enforcement Decree should be included. The Infrastructure Safety Act established a system for evaluating the safety status of member units for facilities and classifying and managing the facilities through integration, managing the data for analyzing the history of infrastructure through the Facility Management System (FMS).

2.3. Related Analysis of Establishment Information Management System Operation Status

The key to changing the maintenance management system according to the Infrastructure Management Act is to investigate establishment-related history information, which is then used to build a database for establishing various strategies for efficient establishment management. However, although various construction information-related systems are currently being built and implemented, no system meets the detailed management procedures of the Infrastructure Management Act. Therefore, the Ministry of Land, Infrastructure and Transport has developed a detailed plan to establish an information management system for necessary information by analyzing the information management system for each establishment according to the classification of 15 major infrastructure facilities subject to management under the National Land Planning and Utilization Act.

2.4. Problems and Complementary Directions According to Trend Analysis

The Infrastructure Safety Act aims to advance from a response-based maintenance management system to a performance-oriented evaluation system. However, it is primarily applied to large-scale or highly important facilities. Owing to the unit establishment-oriented evaluation, experts have primarily focused on solving individual problems rather than making comprehensive asset management decisions. To address these problems, the Infrastructure Management Act was implemented to manage individual management facilities through integrated standards and continuously establish life cycle history information to derive improved maintenance plans, including future state predictions and prospects. Several pending issues should be supplemented to establish the legal system and achieve effectiveness.
This study proposes a method for calculating the necessary management plan cost, which should be established by the management agency for establishing the basic plan of the Ministry of Land, Infrastructure and Transport.

3. Analysis of the Performance Degradation Timing

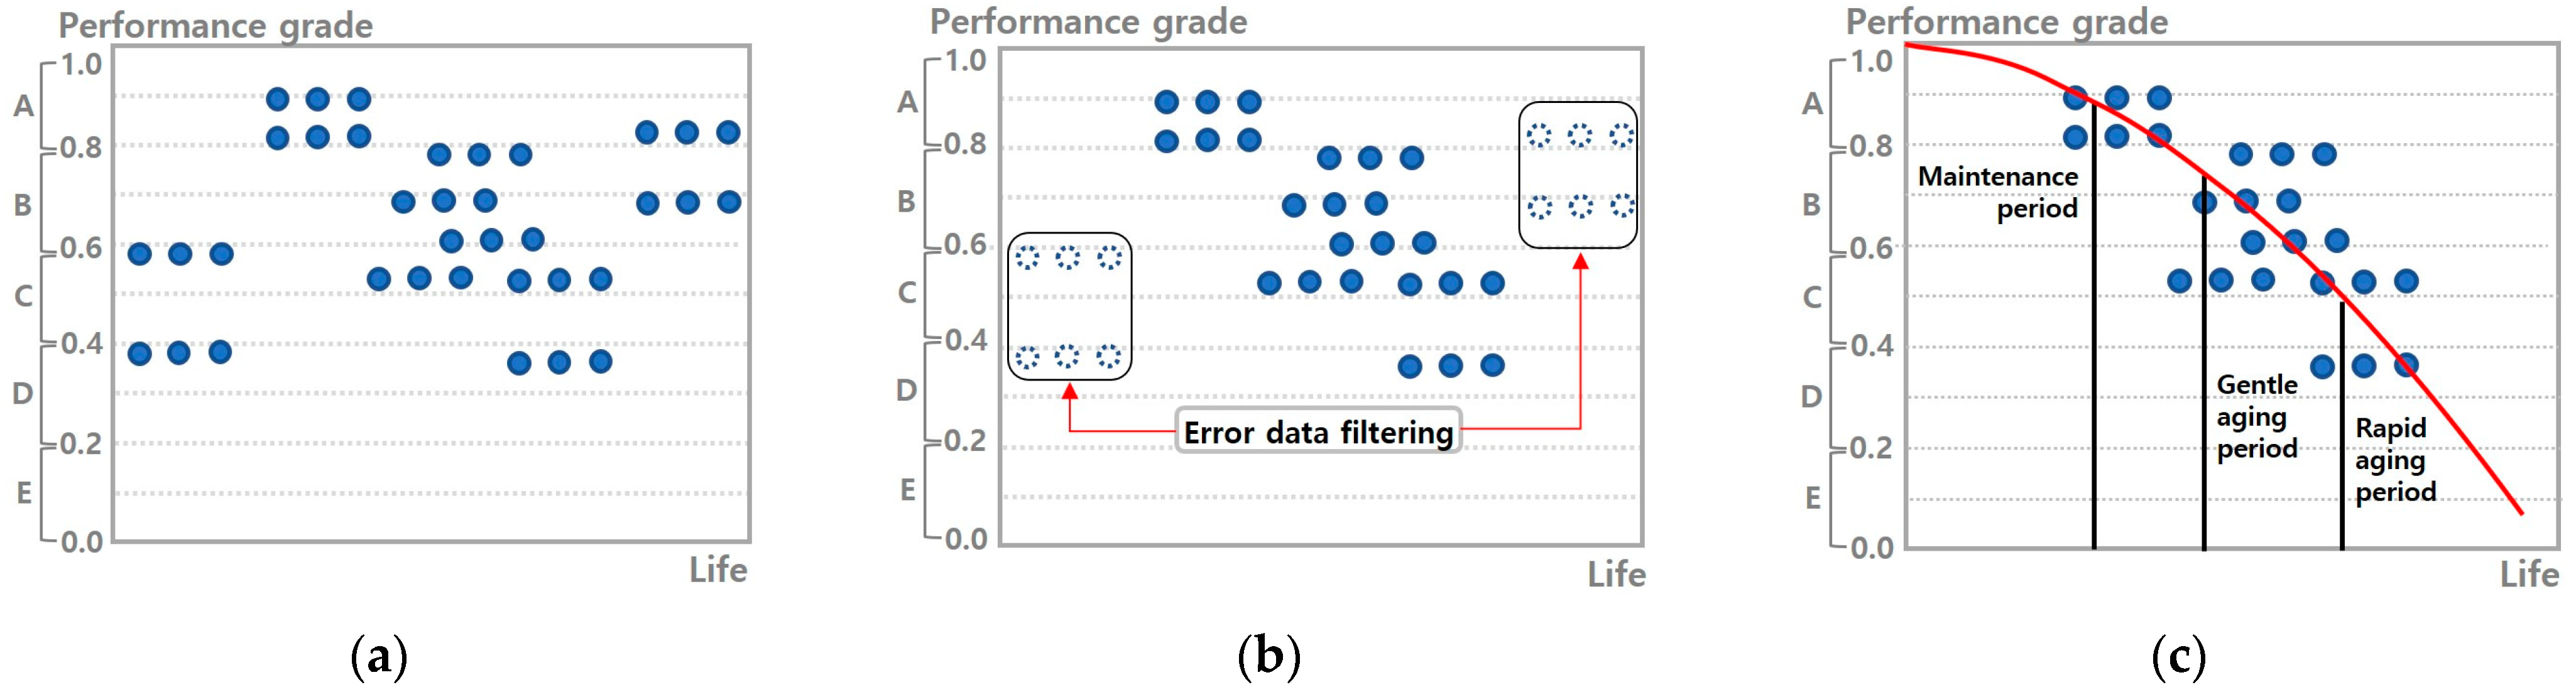
3.1. Overview of the Performance Degradation Model

Developing a short-term (within 5 years) or mid- to long-term (after 5 years, service life) performance degradation model for facilities is necessary to establish a management plan. The performance degradation model analyzes the change in the performance grade of an establishment over time and the period in which each performance grade is maintained without action taken on an individual establishment member unit. Design and maintenance information is used to classify information by type and member of the target establishment. The information is extracted and used for analyzing the performance degradation timing. The information required for performance degradation model analysis includes member type, condition grade (performance grade), condition index (defect degree index), occurrence time, and damage type of the establishment from completion to the present.
Among the extracted establishment information, the information on the performance change through action is not used. The performance degradation model (the period from the completion year to the first maintenance) is analyzed using the information before the first action. This is called the “performance degradation model when no action is taken”. Information after the point of performance improvement is used as information to determine the degradation acceleration rate of the performance degradation model after maintenance actions when analyzing the life cycle with a performance degradation model after action (the period from the time of the first maintenance to the maintenance performed again thereafter).

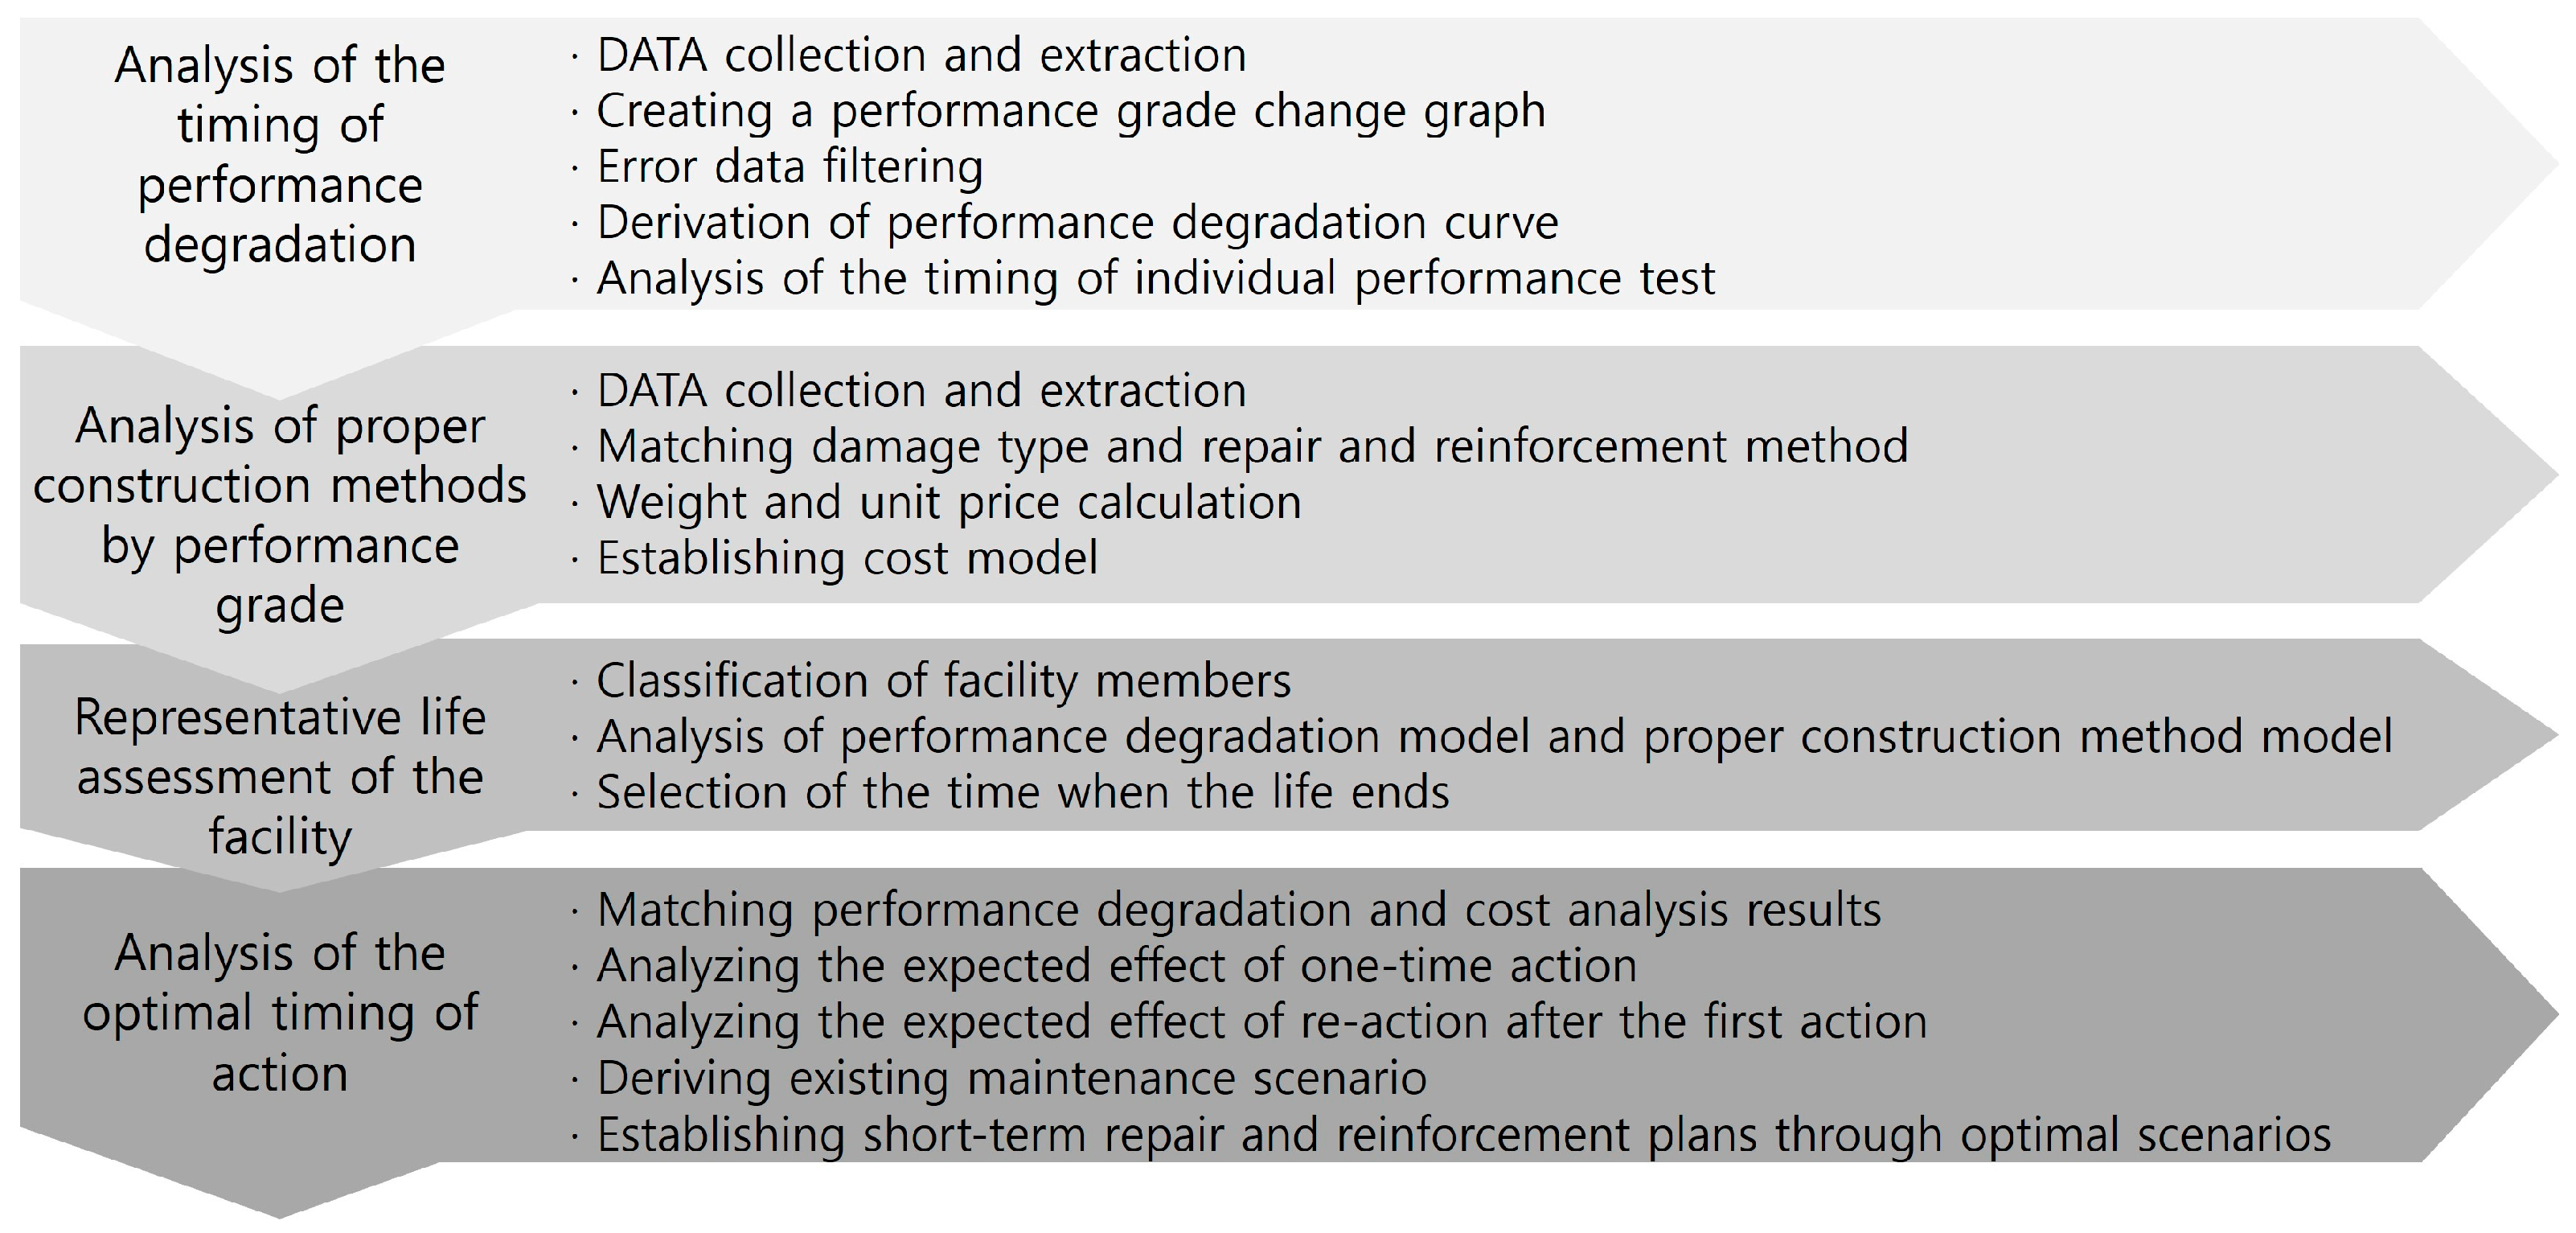
3.2. Analysis Procedure for the Performance Degradation Timing for Model Development

The performance degradation model must be developed for all member types of facilities subject to the infrastructure management plan. Member unit information analysis is based on member type, condition grade (performance grade), condition index (defect degree index), occurrence time, and damage type. The condition grade is converted into a performance grade, and a prediction curve is obtained by considering the performance grade and occurrence time on the graph. When analyzing the prediction curve, error information, such as defect repair, special damage, and erroneous input information should be removed through discrimination. The procedure for analyzing the degradation point is as follows:
  • (Step 1) Collecting and extracting target establishment data (member type by span, member form, completion year, span length, traffic volume, condition grade by inspection and diagnosis service period, etc.);
  • (Step 2) Creating a performance grade change graph after converting condition grade into performance grade (x-axis: lifespan, y-axis: performance grade);
  • (Step 3) Filtering error data (except for repair damage and special condition damage);
  • (Step 4) Deriving the performance degradation curve;
  • (Step 5) Analysis of individual performance degradation points.
Step 1 extracts establishment information, such as member type and condition grade by span, from the collected data (safety inspection and precise safety diagnosis report). Table 1 shows an example of information extraction results.
Step 2 converts the condition grade collected through safety inspection and a precise safety diagnosis report for each member into a performance grade (performance grade = 1 − condition grade) and expresses the change in performance grade over time in a graph (y-axis is performance grade, x-axis is life) to analyze the performance degradation timing. Step 3 shows the performance grade information according to the elapsed years of the member to be analyzed by the span of the target establishment in a graph, where only the information corresponding to the damage type under the Infrastructure Safety Act is applied. Useful information is extracted by filtering erroneous information. Figure 2 shows an example of filtering such outlier information.
The performance grade is an index that indicates the state of the facility, and classifies A as excellent, B as good, C as normal, D as poor, and E as bad.
Step 4 derives a performance degradation curve through regression analysis as linear, quadratic, and exponential functions for information generated through data filtering. The first and second-order functions are y = −ax + b and y = −ax2 + bx + c, respectively. Other exponential functions can be used. Various regression analyses (linear function, quadratic function, etc.) are performed. A function with a coefficient of determination (R2) close to 1, a function with a high degree of fit, is selected and used as a performance degradation curve. As shown in Figure 3, the performance degradation curves without and after maintenance are derived separately.
Step 5 derives the time to take action for each member grade of the establishment through regression analysis. Table 2 shows the results of deriving the performance degradation timing by analyzing the performance deterioration timing. Finally, the performance deterioration prediction model is updated by accumulating information on the results of annual inspections and diagnoses.

4. Analysis of Proper Construction Methods by Performance Grade

4.1. Overview of Analysis of Proper Construction Methods

Maintenance actions, such as appropriate repair and reinforcement, are required to restore the degraded performance. The available methods and costs for each performance grade may vary according to the damage type. The representative cost for each grade must be analyzed according to the performance grade system to analyze the optimal timing of action based on the relationship between performance and cost. The maintenance costs vary according to the difference between the performance level at the time of maintenance and repair of the establishment and performance level to be restored (target performance level) (Figure 4). This study refers to the information analysis to predict the cost according to the action level by grade as the analysis of proper construction methods by performance grade. In this analysis, repair and reinforcement methods for various damage types are presented as representative construction methods for each performance grade by weighted combination within the grade. A cost model for each member unit linked to the performance degradation model is derived through a cost prediction curve.

4.2. Analysis Procedure for Proper Construction Methods

The analysis of proper construction methods by performance grade to establish a cost model is performed according to the following procedure:
  • (Step 1) Collecting and extracting target establishment data (inspection report, repair and reinforcement work statement, and repair and reinforcement method unit price data);
  • (Step 2) Connection of damage type and repair/reinforcement method by performance grade;
  • (Step 3) Calculating the weight and unit price of representative repair and reinforcement methods;
  • (Step 4) Establishing cost models for proper construction methods by member grade.
Step 1 extracts the information on the repair and reinforcement method, performance grade, repair quantity, and unit price according to damage by member performed from the year of completion to the present (material cost, labor cost, and expense) through the inspection and diagnosis service information and repair and reinforcement work information collected from the target establishment data (Table 3).
Step 2 defines possible damage types of the target member and derives a repair and reinforcement method according to the performance grade (Table 4). Using the information accumulated in Step 1, a repair and reinforcement method is derived by linking the performance grade and damage type based on systematically organized data. ‘○’ in Table 4 is a symbol indicating the existence/nonexistence of each damage type in the related member.
Step 3 selects a representative repair and reinforcement method and calculates the unit price of the representative method (Table 5). As a detailed procedure for calculating the unit price of the representative construction method, the application performance of the repair and reinforcement method by grade from the date of completion to the present is investigated to determine the number of times it has already been applied. Subsequently, the application performance (number of times) of the repair and reinforcement method by grade should be converted into an application weight to be integrated into the representative repair and reinforcement method. The unit price of the repair and reinforcement construction method at the time of information collection is converted to the unit price of the current construction method by reflecting the current price index. Finally, when applying the repair and reinforcement methods by performance grade according to the damage type, the representative repair and reinforcement method unit price is calculated by multiplying the applied weight by the repair and reinforcement method unit price. Finally, Step 4 establishes an appropriate construction method analysis model for each performance grade derived through Steps 1 to 3 and updates the cost prediction model based on the results of the annual inspection, diagnosis, repair, and reinforcement.

5. Representative Life Assessment of the Establishment

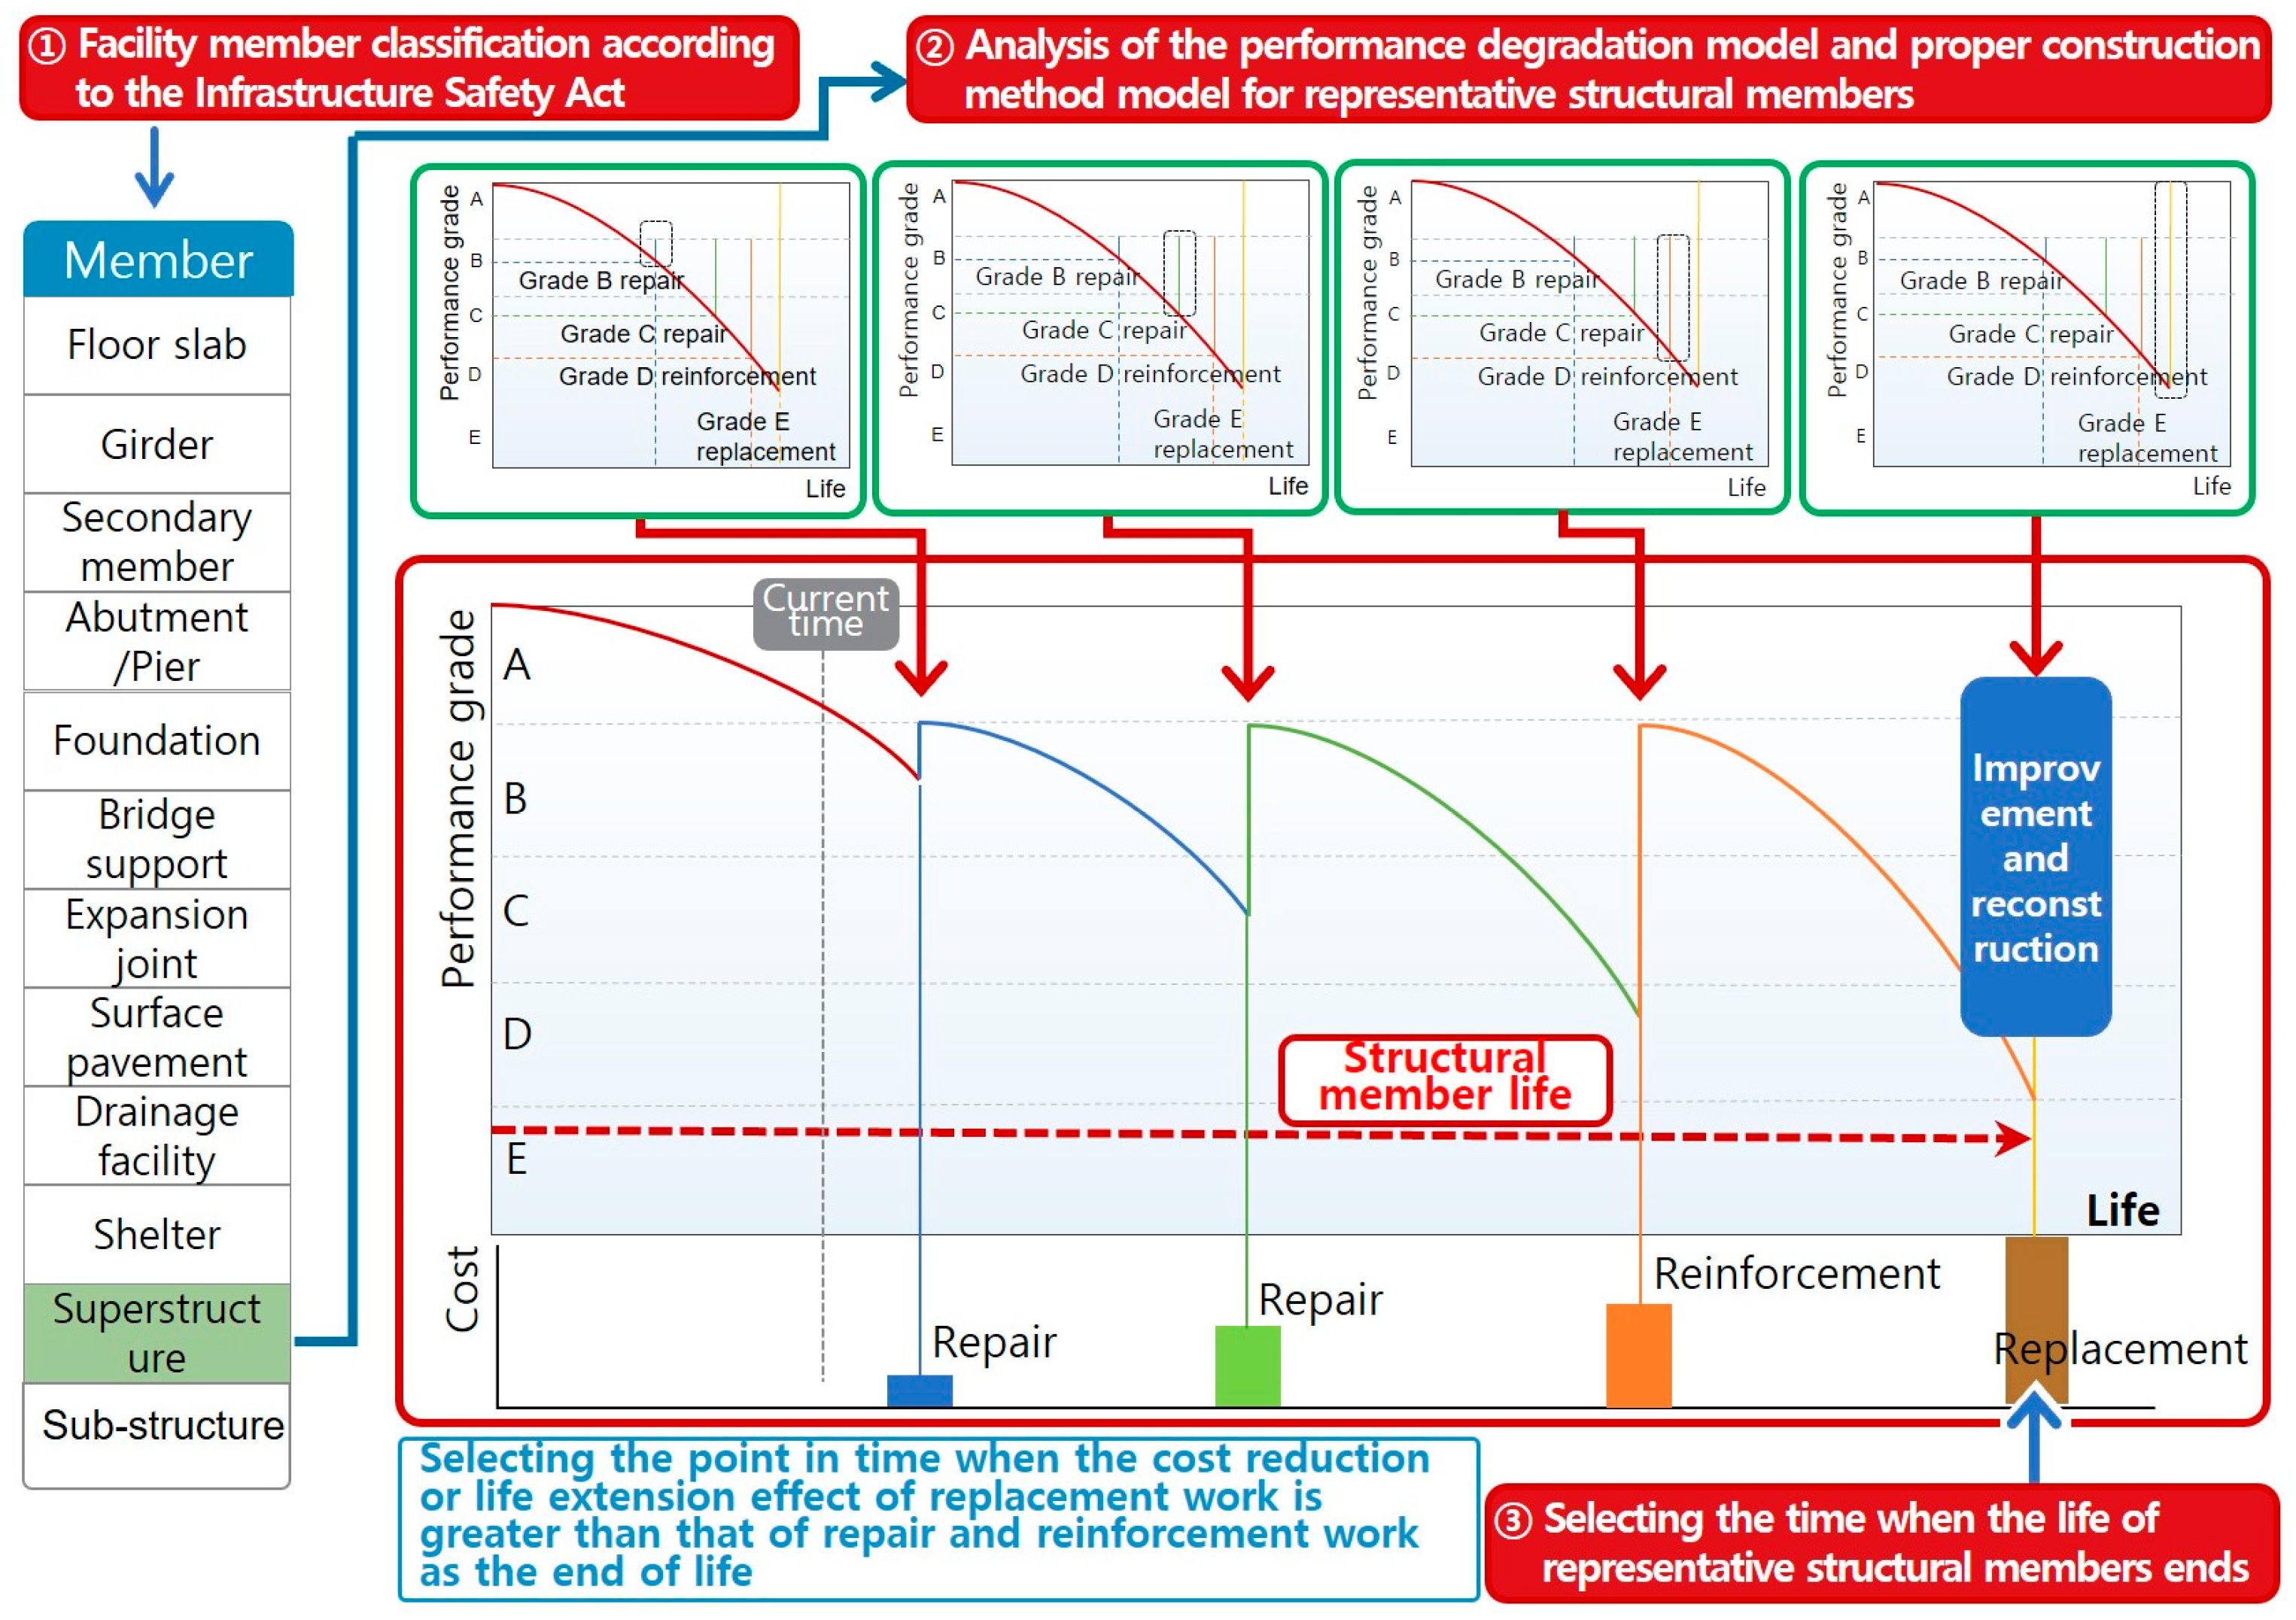
5.1. Overview of Representative Life Assessment

The representative life assessment of an establishment aims to establish an analysis period for the optimal timing of action method. Generally, the analysis period is set as the life for the assessment because the life cycle cost (LCC) assessment at the design stage for a design type or construction method application analyzes the relative difference between the two alternatives throughout the design, maintenance, and dismantling/disposal stages. From a practical perspective for management planning, the representative life assessment was intended as an analysis period to analyze the expected effect to establish an optimal repair and reinforcement construction plan. Determining the point at which the safety performance of individual unit facilities deteriorates below the limit is necessary to achieve the expected effect of life cycle information analysis. Therefore, this study defines the life of facilities required to establish a management plan as the point at which the result of performing “maintenance at the optimal level of action” on structural members is completed, considering the maintenance cost effect as the representative life.

5.2. Representative Life Assessment Methods and Procedures

The representative life assessment (Figure 5) determines the optimal level of maintenance actions analyzed in individual member units to establish an optimal repair and reinforcement plan, determining the end-of-life of each member as the representative life. The target member of the representative life assessment is defined as the main structural member constituting the establishment. Among several structural members, a structural member whose life ends the earliest is defined as a life member for determining a representative life value.
Accordingly, the representative life assessment procedure first classifies the structural and nonstructural members among the various members constituting the individual unit facilities and performs an analysis to determine the optimal action time for the structural members. Among the structural members, the end-of-life of the member with the earliest end-of-life, derived from determining the optimal timing of action, is considered the representative life. Finally, in terms of the management plan, the estimated cost and period should be included in the management plan based on the improvement and renovation work information investigated at the end of the life in the performance improvement information survey.

6. Analysis of Optimal Timing of Action

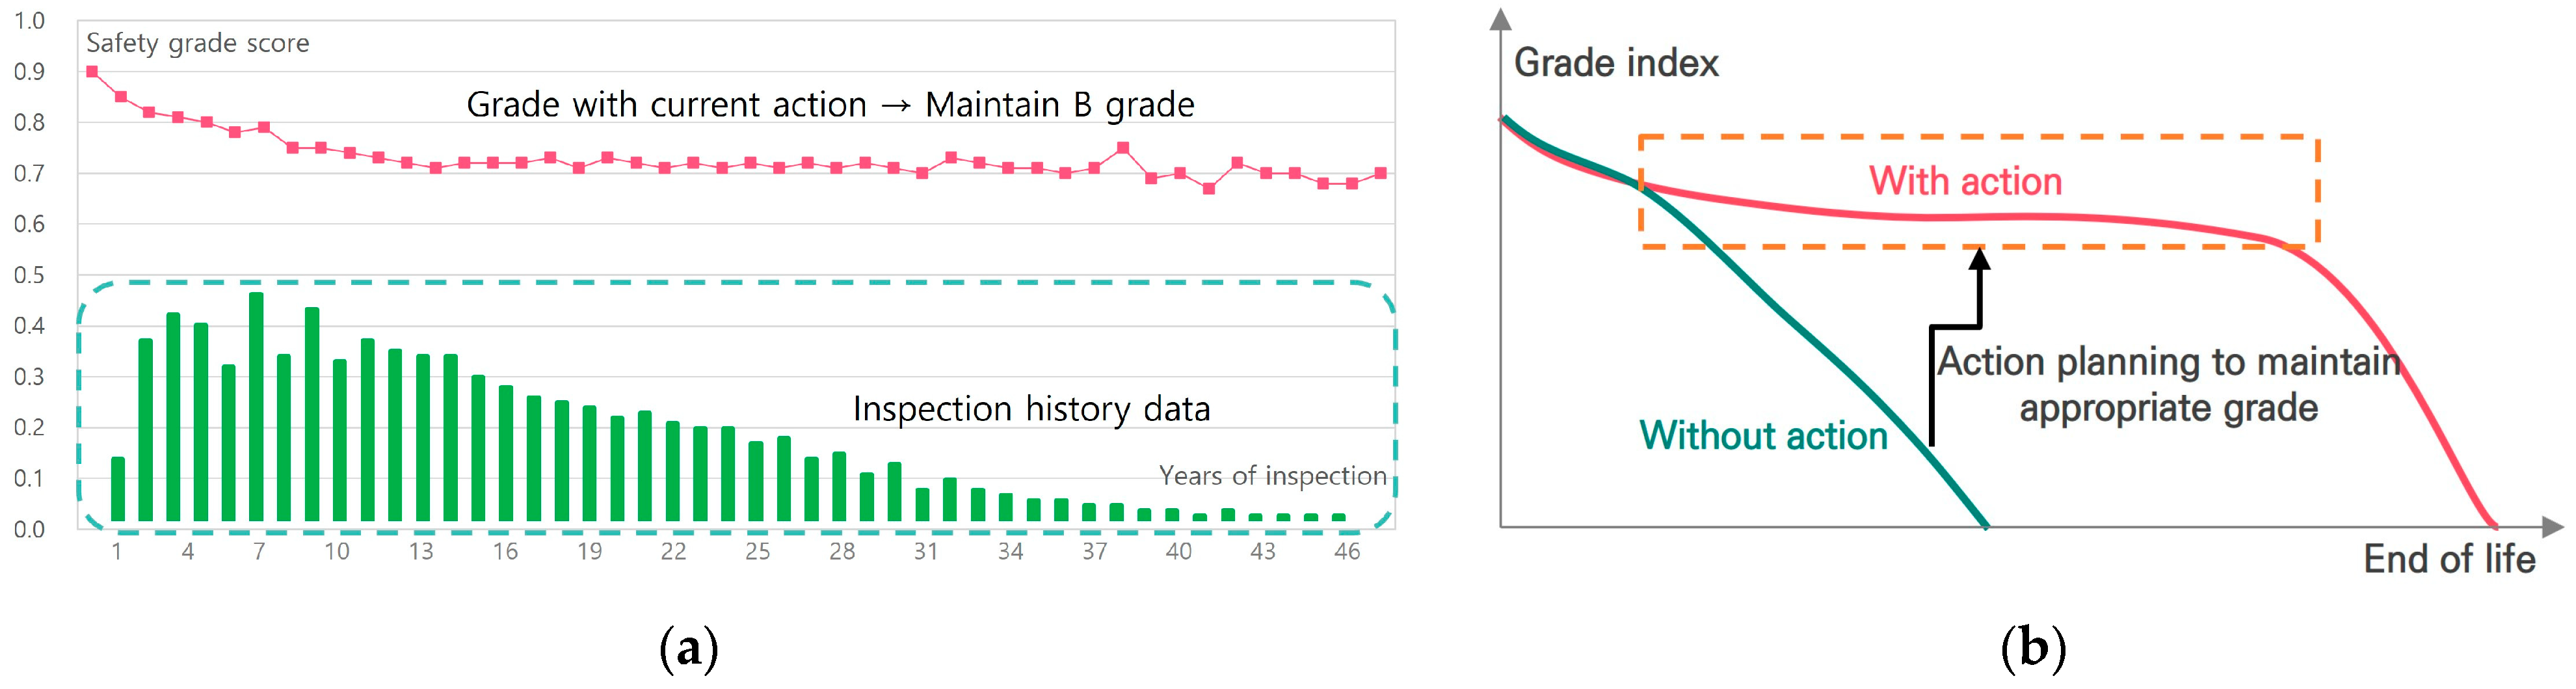
6.1. Changes and Overview of Maintenance System

Predicting the short-, mid-, and long-term establishment management budgets is necessary to establish a management plan. In this maintenance activity, budgets are invested to raise the performance grade of the current establishment to the target grade.
The existing maintenance management system (Figure 6) repeatedly performs repair and reinforcement through continuous inspection and diagnosis after the completion of the establishment and restoration of damage to each establishment member according to the results. This is to perform reactive maintenance to maintain the current management level in good condition (grade B) regardless of the expected life cycle effects. These actions serve as an action plan to prevent performance grade degradation, which is crucial when not handled, and maintain an appropriate performance grade. However, the repetitive grade restoration of an establishment whose grade has been reduced by such a reactive action is implemented as a single maintenance method. Thus, the efficiency of maintenance costs or the advantages or disadvantages of performance improvement could not be considered. Therefore, the current maintenance system may have difficulties applying the optimal maintenance method owing to reactive maintenance.
This study classifies the proposed method into preemptive, appropriate, and marginal maintenance methods based on the results of analyzing the expected effects of life, cost, and performance rather than a single response maintenance method when the performance grade is reduced without action taken in various ways from grades B, C, and D, as shown in Figure 7. The method with the highest priority is applied as the optimal timing of action. Determining the optimal timing of action for individual members predicts when the performance grade of each member deteriorates and determines the time to improve the performance grade through actions, such as repair, reinforcement, and replacement for each performance grade, to determine the maintenance levels for optimum performance, cost, and life expectancy.

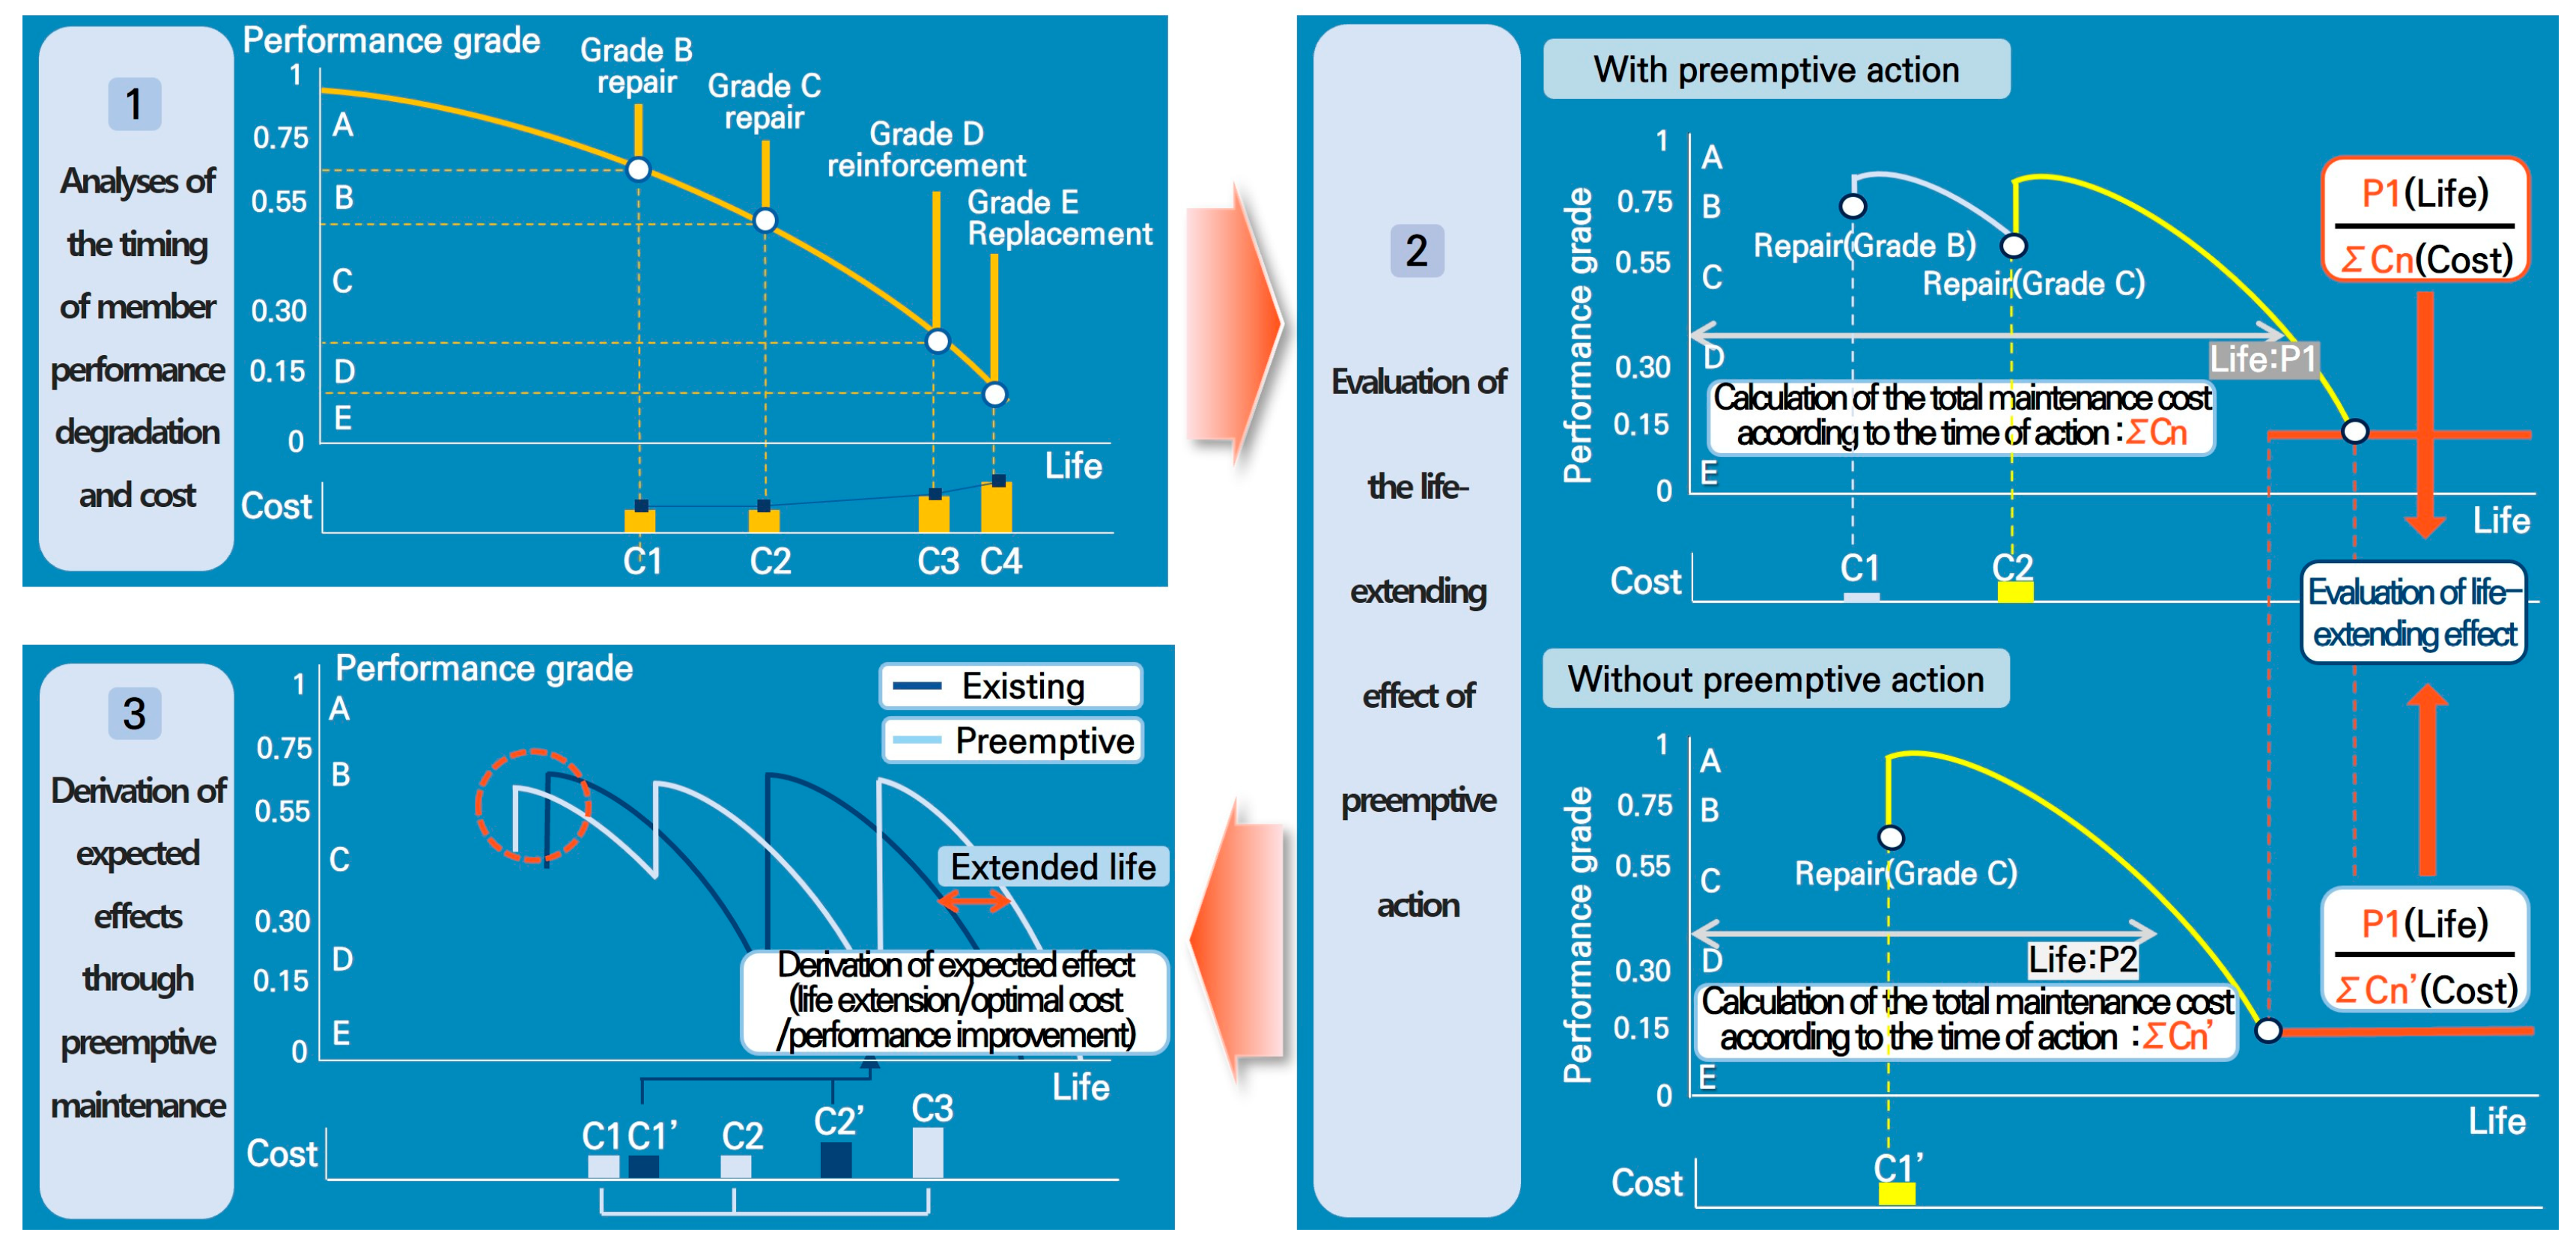
6.2. Analysis Procedure for Optimal Timing of Action

Based on the expected effect analysis for determining the optimal timing of action, the analysis algorithm for the optimal timing of action derives the optimal repair and reinforcement plan through the following five-step analysis:
  • (Step 1) Linkage between performance degradation time analysis and cost prediction analysis results (uniform time dimension);
  • (Step 2) Analyzing the expected effect performing one-time actions in a specific grade for an establishment;
  • (Step 3) Analyzing the expected effect of reaction after the first action (reanalysis, as in Figure 8);
  • (Step 4) Deriving a maintenance scenario for the existing maintenance system;
  • (Step 5) Establishing short-term maintenance and reinforcement plans through optimal maintenance scenarios.

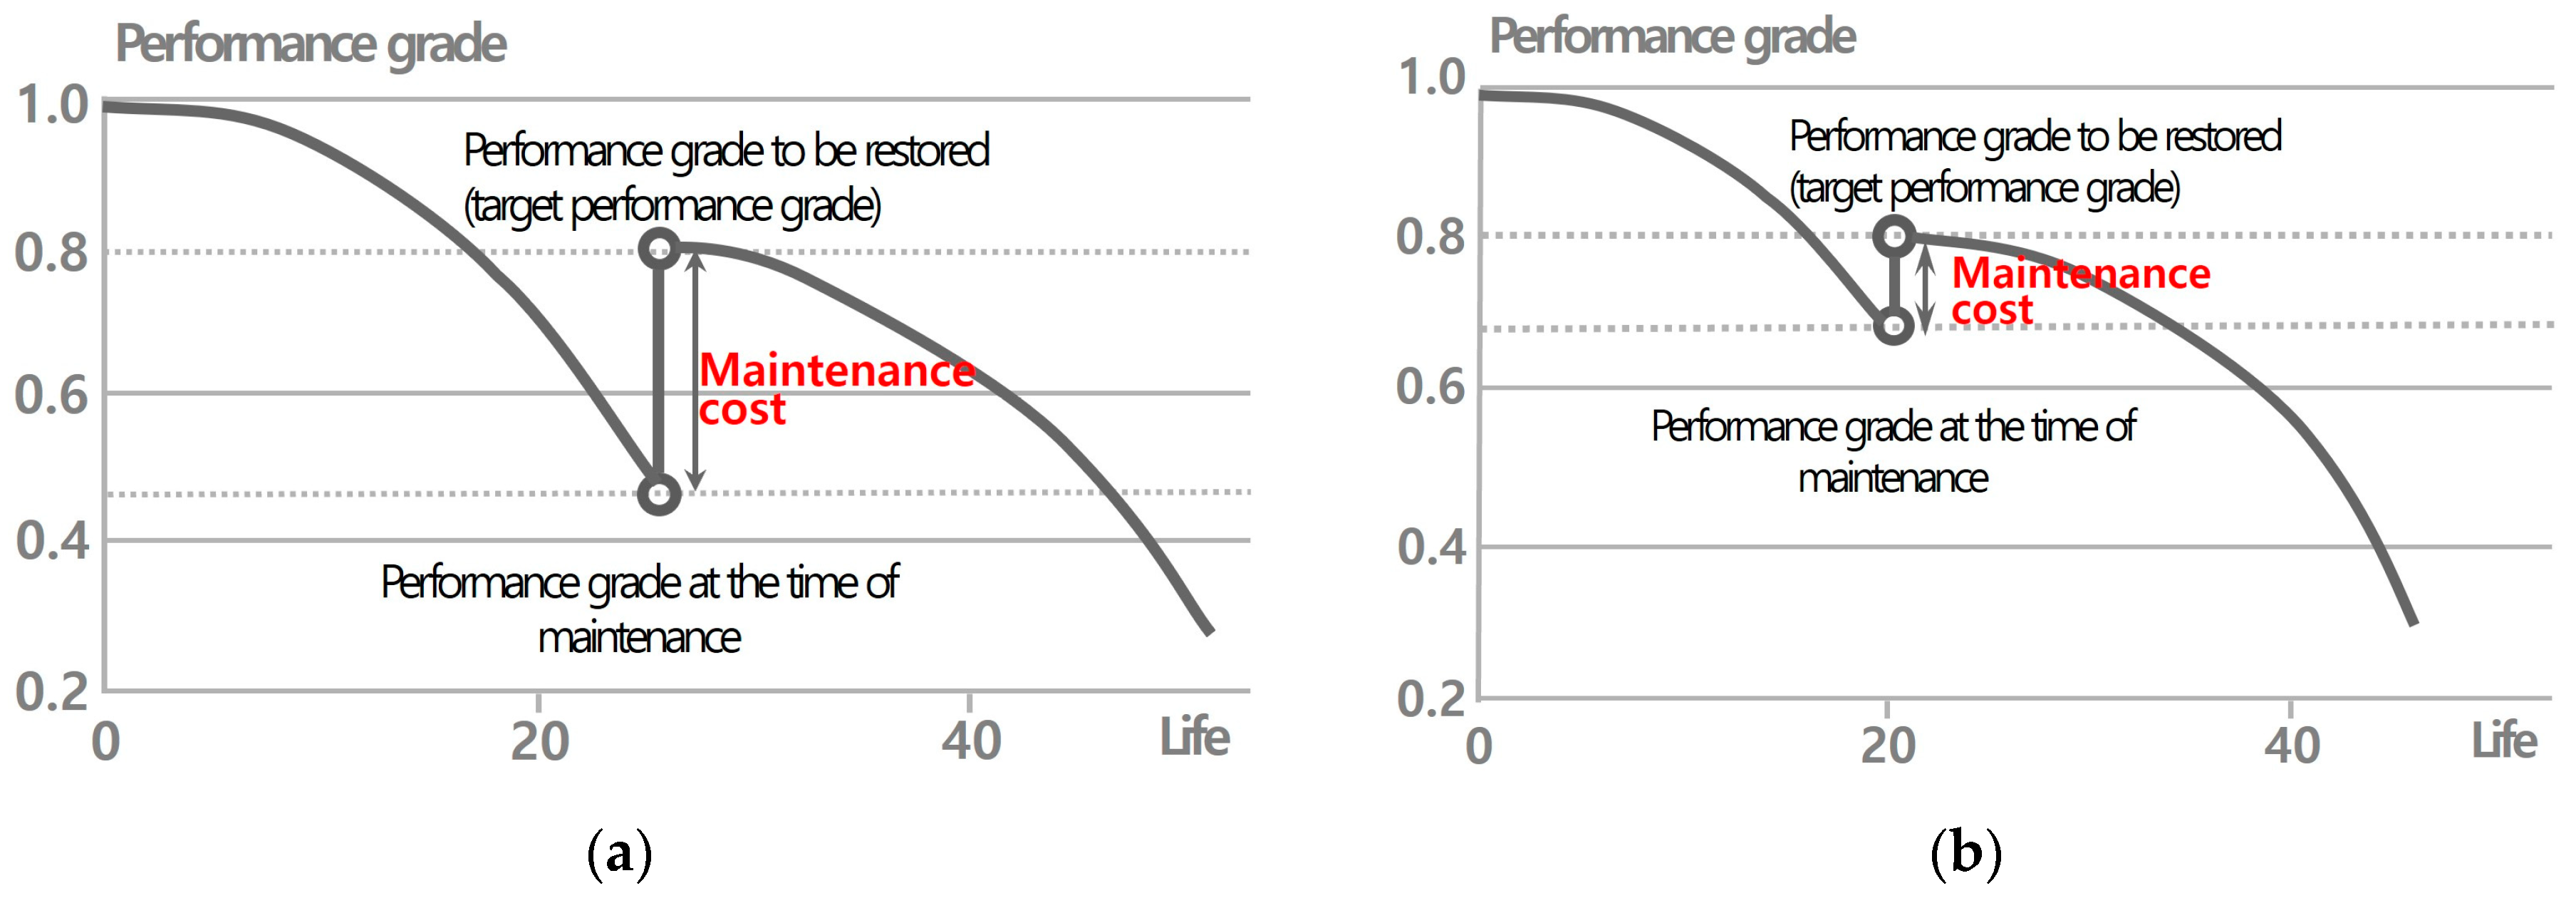
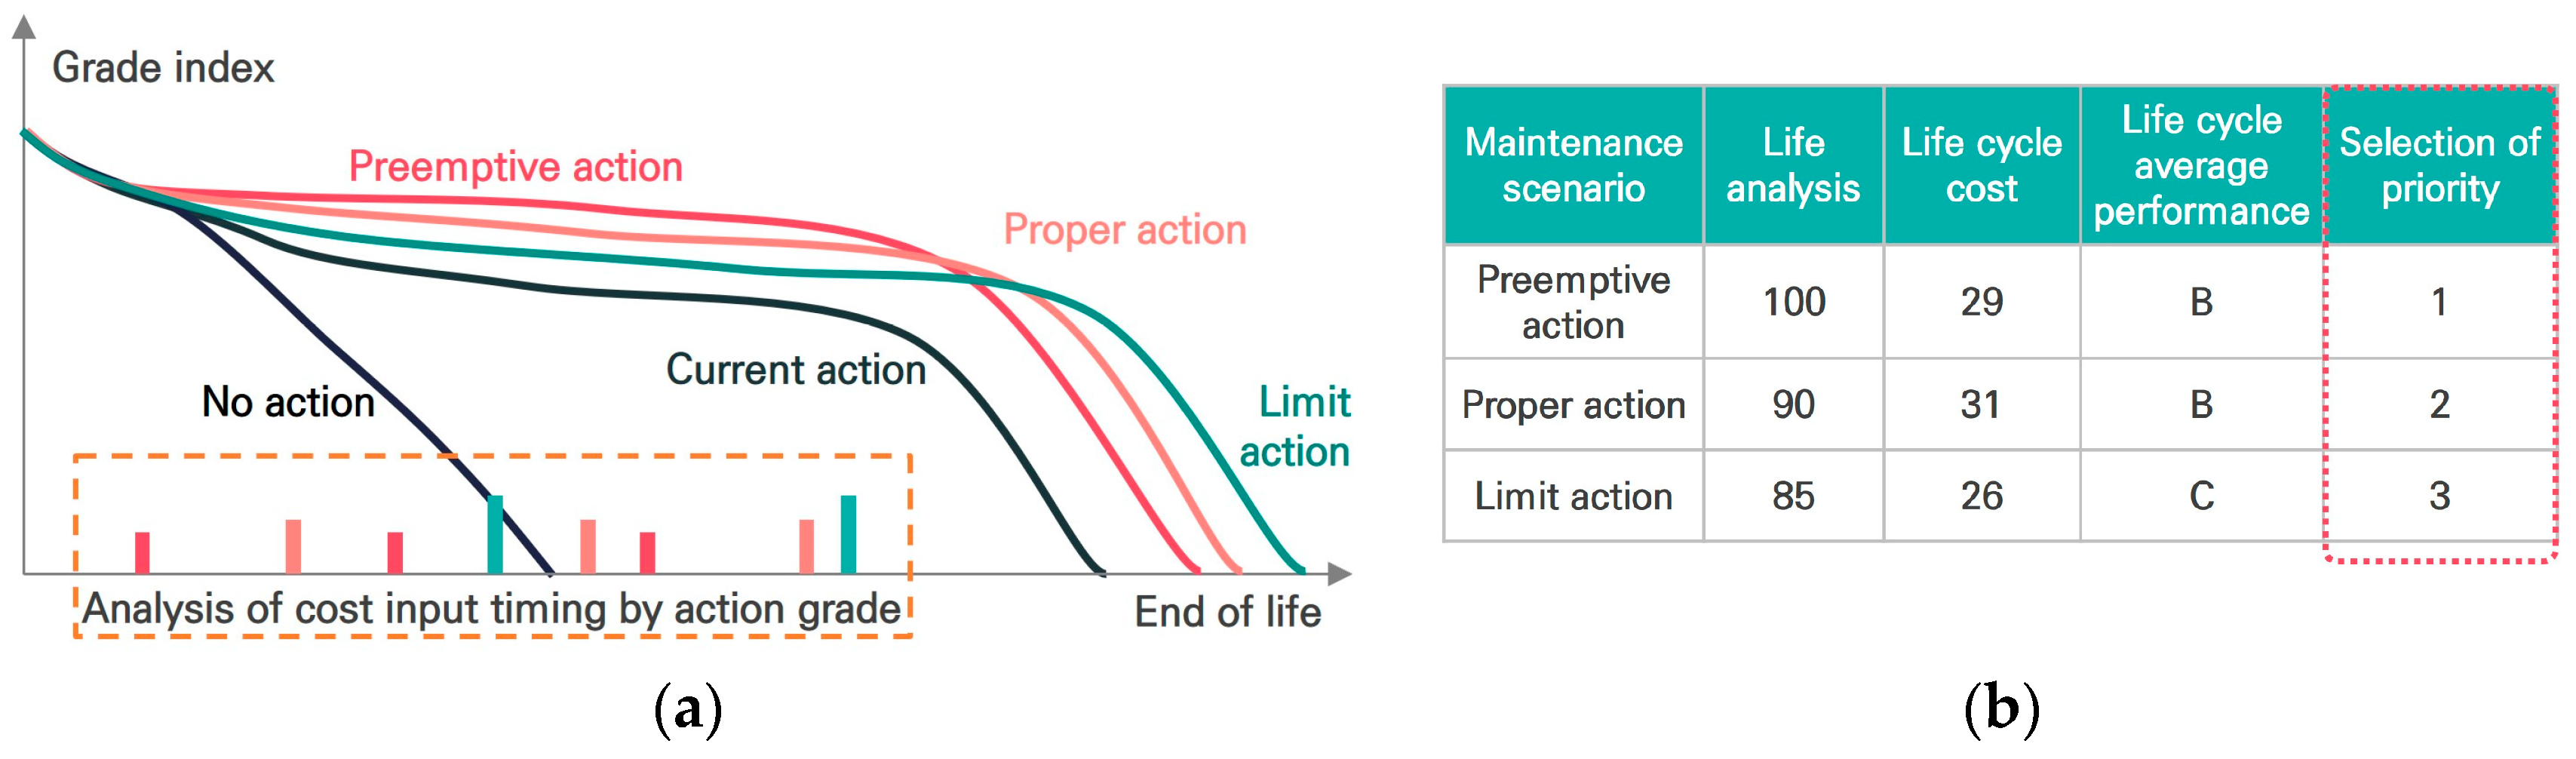
6.3. Method of Determining the Optimal Timing of Action

The method for determining the optimal timing of action develops a performance degradation and cost prediction model for each member and derives the time when each performance grade is expressed for each member unit. A model linking performance grade degradation and cost increase prediction is derived by linking the time of occurrence of the derived performance grade with a cost prediction model representing the representative cost for each grade.
Subsequently, the optimal action time decision for each member unit is derived by verifying the effect of increasing the life according to the action by grade. First, when the current grade of the member is B, the cost of actions taken for grade B as a preemptive action and the cost of actions taken upon reaching grade C after the performance grade is lowered again are added up. The extended life resulting from the two actions is also added. This sum of costs and performance is calculated by dividing the cost per unit life or the life per unit cost.
Conversely, when the current grade of the member is B but the performance grade is lowered to C without applying preemptive actions, the cost of actions and the resulting extended life are calculated to derive the effect of increasing life as in the case of applying preemptive actions. Subsequently, the most effective action is selected and reflected as the timing of action by comparing the extended life against the derived cost. Figure 8 shows the stepwise, detailed method for these procedures.
When the expected effect analysis method for determining the optimal timing is applied for each grade and repeatedly applied until the end of life, the optimal action scenario for the member is established. In addition, when the analysis results for each member are summed up on a facility basis, the result of the facility’s optimal action time can be derived. In the end, it can be said that it is a method of finding an optimal solution through relative differences by repeatedly learning the life-extension effect analysis for each level based on the tendency of performance and cost to change for each level.

7. Model Application and Analysis

7.1. Overview of Target Establishment and Data (Information) Collection

The proposed method was reviewed by applying it to water supply facilities, representative infrastructure facilities among national and local government facilities. Main facilities in the water supply system include water treatment plants, offices, reservoirs, pressurization plants, and water pipelines. Among these, the reservoirs, completed many years prior and with many management targets, were selected to apply and review the proposed method.
To review the status of the elapsed years of facilities in the reservoir, the current status of the number of years since the establishment completion was analyzed based on data, such as completion publications, precise inspections, and precise safety diagnosis reports for 99 reservoirs (as of 2019), was considered [19]. The 99 reservoirs have been in service for 26.5 years on average, exceeding 30 years after approximately 3.5 years. Currently, there are 40 facilities older than 30 years, accounting for approximately 40.4% (Table 6).
Although the proportion of facilities older than 30 years is relatively higher than other facilities, the current durability grade is maintained at “B” through continuous maintenance and management by the Office of Waterworks.
Inspection and diagnosis information related to the investigation on maintenance management included detailed items, such as unit damage, grade, quantity, index, repair, and reinforcement plan (Table 7). Based on each inspection and diagnosis, major repair and reinforcement plans are used as basic data for calculating future budgets. Thus, the reliability of this information survey is of utmost importance.
Subsequently, the performance improvement information survey collected information on constructions conducted to improve the safety, durability, and usability of the establishment. The performance improvement information survey was conducted for each reservoir. The contents of the project primarily included waterproofing, anti-corrosion work, and repainting work (Table 8).
In the method review, a data survey, analysis of the performance degradation timing, and analysis of proper construction methods by performance grade were conducted for 99 reservoirs (total). The representative life assessment of the establishment and analysis of optimal timing of action were applied only to 40 reservoirs aged 30 years or older considering the degradation level.

7.2. Analysis of the Performance Degradation Timing

Table 9 below shows the performance degradation model when no action is taken, analyzed through the performance degradation analysis method and the cost prediction model for each member. The performance degradation model for each member was analyzed for upper slab y = −0.00255x2 + 5, lower slab y = −0.00230x2 + 5, and wall y = −0.00163x2 + 5.
This reservoir performance degradation model was used to determine the timing of action and to analyze expected effects.

7.3. Analysis of Proper Construction Methods by Performance Grade

The current status of cost occurrence by construction method and grade was analyzed to develop a cost prediction model. Based on the results of the information survey, the current status of the cost trend was calculated by classifying the repair and reinforcement construction methods by condition grade. Through this, the cost status for each representative construction method and grade of the establishment was derived, as shown in Table 10.
A cost prediction model was calculated for each establishment member through data organized by grade and method of repair and reinforcement. The trend function model of the cost model analyzed the models for the linear, logarithmic, and exponential functions and selected the model with the highest fit (Table 11). The upper/lower slab cost prediction model was analyzed as y = 0.0478e1.3313x (R2 = 0.9432), and the wall cost prediction model as y = 0.0857e1.2286x (R2 = 0.9554).

7.4. Representative Life Assessment of the Establishment

The predicted representative life was analyzed when optimal maintenance was continued based on the performance degradation and cost models. In the representative life assessment, the sub-members of each establishment were classified into structural members with structural functions and nonstructural members that are necessary components but do not have structural functions. The representative life of the establishment was determined based on the structural members. The upper slab was selected as the standard member for representative life (minimum life). For reservoirs aged 30 years or older, the predicted results were 35 years of service life, 85 years of life assessment, and 50 years of remaining life.

7.5. Analysis of Optimal Timing of Action

For reservoirs with a service life of 30 years or more, the preemptive action for the current grade B or action for grade C or D after performance grade degradation, life-extending effect against cost in terms of life cycle prediction cost, and expected effect for restoration of the damage grade shown in the inspection and diagnosis were derived, as shown in Table 12.
In conclusion, the optimal timing of action for a reservoir with a service life of 30 years or longer is when the average life cycle performance at each action level is grade C or higher. Preemptive actions for grade B have the most cost-effective life-extending effect. The analysis indicates that performing repair and reinforcement works for the reservoir before the performance falls below grade C (Table 13) is the most effective course of action.

8. Conclusions

The advancement of maintenance technology is as important as the development of construction technology in the infrastructure maintenance system. However, in reality, the development of maintenance systems has been lagging. To calculate the cost required for establishing a management plan under the Infrastructure Management Act, this study proposed a method which includes analyzing the performance degradation timing, proper construction methods by performance grade, and optimal timing of action, and assessing the representative life of the establishment based on the trend analysis results of domestic and foreign maintenance.
(1)
Analyzing the performance degradation timing plots a performance grade change graph based on the target establishment data. The performance degradation curve is derived through error data filtering in the graph, analyzing individual performance deterioration points.
(2)
Analyzing proper construction methods by performance grade derives a repair and reinforcement method by linking the performance class grade and damage type using the target establishment data. Among the derived construction methods, a cost model is established after calculating the weight and unit price of the representative repair and reinforcement methods.
(3)
The representative life assessment of the establishment determines the life required for analysis. Among the structural members, the life of the structural member with the earliest end-of-life is determined as the representative life.
(4)
Analyzing the optimal timing of action establishes the repair and reinforcement plan through the optimal maintenance scenario with high priority after applying the maintenance scenarios by dividing them into preemptive, proper, and limited actions.
While accuracy is significant for predictive analysis, the proposed method determines the timing through the expected effects, considering the relative difference between the actions at the current grade and those after performance grade degradation. With the performance degradation and cost prediction models under the same conditions applied between the alternatives, the method for deriving the relative difference will have fewer errors owing to the accuracy of the model. In addition, uncertainty can be reduced by periodically updating new information to improve the accuracy of each model.
Finally, it is necessary to develop a standardized predictive model for infrastructure life cycle analysis. Standard models are already being applied through specifications or guidelines in various engineering fields, and it is judged that research on various element technologies is necessary to apply standard prediction models for each facility type to maintain.

Author Contributions

Conceptualization, C.C. and M.L.; Methodology, C.C.; Validation, W.O.; Resources, W.O.; Data curation, C.C.; Writing—original draft, W.O. and C.C.; Writing—review & editing, W.O. and M.L.; Supervision, M.L.; Funding acquisition, M.L. All authors have read and agreed to the published version of the manuscript.

Funding

Korea Agency for Infrastructure Technology Advancement(KAIA) grant funded by the Ministry of Land, Infrastructure and Transport (Grant RS-2020-KA156208).

Acknowledgments

This work is supported by the Korea Agency for Infrastructure Technology Advancement(KAIA) grant funded by the Ministry of Land, Infrastructure and Transport (Grant RS-2020-KA156208).

Conflicts of Interest

The authors declare no conflict of interest.

References

  1. Choi, G.H.; Ko, M.H.; Kwon, J.H. Comparison of Infrastructure Maintenance Framework. In Proceedings of the 2019 Fall Academic Conference; Korea Institute for Structural Maintenance and Inspection: Seoul, Republic of Korea, 2019; Volume 23, p. 106. [Google Scholar]
  2. Kwon, J.H.; Ko, M.H.; Choi, G.H.; Cho, C.Y.; Lee, H.S. A Study on the Infrastructure Survey Strategy for Sustainable Management. In Proceedings of the 2019 Fall Academic Conference; Korea Institute for Structural Maintenance and Inspection: Seoul, Republic of Korea, 2019; Volume 23, p. 230. [Google Scholar]
  3. Cho, C.Y. Develop a Sustainable Infrastructure Management Method Based on Life Cycle History Information Survey and Analysis. Ph.D. Dissertation, Chungnam National University, Daejeon, Republic of Korea, 2020. [Google Scholar]
  4. Korean Law Information Center. Available online: http://law.go.kr (accessed on 3 March 2023).
  5. Kwon, J.H.; Choi, G.H.; Ko, M.H.; Lee, M.J. Sustainable Infrastructure Management Framework. In Proceedings of the 2019 Fall Academic Conference; Korea Institute for Structural Maintenance and Inspection: Seoul, Republic of Korea, 2019; Volume 23, p. 227. [Google Scholar]
  6. Ok, H.; Kim, J.U. Research on the Plans of Construction Information for National Infrastructure in Public Construction Projects. J. Korea Cont. Assoc. 2013, 13, 1026–1035. [Google Scholar] [CrossRef]
  7. Choi, W.S.; Nah, H.S.; Seo, M.B.; Jeong, S.Y.; Lim, J.T. Asset Management Information in the Social Infrastructure. J. Korea Cont. Assoc. 2010, 10, 68–79. [Google Scholar] [CrossRef]
  8. Pelle, A.; Briseghella, B.; Bergami, A.V.; Fiorentino, G.; Giaccu, G.F.; Lavorato, D.; Quaranta, G.; Rasulo, A.; Nuti, C. Time-dependent cyclic behavior of reinforced concrete bridge columns under chlorides-induced corrosion and rebars buckling. Struct. Concr. 2022, 23, 81–103. [Google Scholar] [CrossRef]
  9. Nam, J.Y.; Kim, M.J.; Jo, C.W. A Study of Information Update and Framework for Integrated Maintenance and Operation of River Facilities. J. Korea Acad.-Indus. Coop. Soc. 2017, 18, 140–149. [Google Scholar]
  10. Lee, D.Y.; Lee, M.J. A Study of the Asset Valuation Method for Efficient Road Facility Maintenance. J. Asian Archit. Build. Eng. 2014, 13, 279–286. [Google Scholar] [CrossRef]
  11. Sun, J.W.; Lee, D.Y.; Lee, M.J.; Park, K.H. Development on Reconstruction Cost Model for Decision Making of Bridge Maintenance. J. Korea Acad.-Indus. Coop. Soc. 2016, 17, 533–542. [Google Scholar]
  12. Kim, D.J.; Lee, Y.J.; Lee, M.J. Development of Risk-Based Bridge Maintenance Prioritization Method. KSCE J. Civ. Eng. 2018, 22, 3718–3725. [Google Scholar] [CrossRef]
  13. Rasulo, A.; Pelle, A.; Briseghella, B.; Nuti, C. A resilience-based model for the seismic assessment of the functionality of road networks affected by bridge damage and restoration. Infrastructures 2021, 6, 112. [Google Scholar] [CrossRef]
  14. Beitelmal, W.; Molenaar, K.R.; Javernick-Will, A. Challenges and barriers to establishing infrastructure asset management: A comparative study between Libya and the USA. Eng. Constr. Archit. Manag. 2017, 24, 1184–1202. [Google Scholar] [CrossRef] [Green Version]
  15. Beitelmal, W.H.; Pellicer, E.; Molenaar, K.R. Potential barriers for asset management systems: A comparison between Libya and Spain. In Proceedings of the 18th International Congress on Project Management and Engineering, Alcañiz, Spain, 16–18 July 2014; pp. 689–699. [Google Scholar]
  16. Beitelmal, W.H. Towards an Infrastructure Asset Management Organizational Model for Developing Countries. Ph.D. Thesis, University of Colorado at Boulder, Boulder, CO, USA, 2016. [Google Scholar]
  17. Beitelmal, W.; Molenaar, K.; Javernick-Will, A.; Smadi, O. Strategies to Enhance Implementation of Infrastructure Asset Management in Developing Countries, Transportation Research Record. J. Transp. Res. Board 2017, 2646, 39–48. [Google Scholar] [CrossRef]
  18. Mastroianni, E.; Lancaster, J.; Korkmann, B.; Opdyke, A.; Beitelmal, W. Mitigating Infrastructure Disaster Losses Through Asset Management Practices in the Middle East and North Africa Region. Int. J. Disaster Risk Reduct. 2020, 53, 102011. [Google Scholar] [CrossRef]
  19. Facility Management Division, Seoul Waterworks Division. Establishment of Water Supply Facilities Maintenance History Information and Actual Condition Evaluation Service Report; Seoul Waterworks Division: Seoul, Republic of Korea, 2019. [Google Scholar]
Figure 1. Flow and procedure by analysis method for establishing a management plan.
Buildings 13 01983 g001
Figure 2. Erroneous information filtering (example): (a) application of information; (b) filtering; (c) derivation of graded graph.
Buildings 13 01983 g002
Figure 3. Classification of performance grade data.
Buildings 13 01983 g003
Figure 4. Changes in maintenance cost according to the degree of performance recovery: (a) high maintenance costs; (b) low maintenance costs.
Buildings 13 01983 g004
Figure 5. Example of a representative life assessment of an establishment.
Buildings 13 01983 g005
Figure 6. Calculation method for the action plan for the current maintenance system: (a) calculation of action plans according to inspection results; (b) current maintenance system.
Buildings 13 01983 g006
Figure 7. Method for determining the timing of action through optimal maintenance scenarios: (a) preemptive maintenance system; (b) analysis of expected effects (example).
Buildings 13 01983 g007
Figure 8. Method of analyzing the expected effect to determine the optimal timing of action.
Buildings 13 01983 g008
Table 1. Data collection and extraction results for analyzing the performance degradation timing (example).
Facility
Type
Member
Type
Member
Form
Member Form
by Span
Detailed Member Form
by Span
Completion
Year
Span LengthTraffic VolumePerformance Grade by Period
20152020···
Test
bridge
Super
structure
Floor slabSpan 1 floor slabConcrete floor slab20103020,000A (1.0)B (0.7)···
Span 2 floor slabConcrete floor slab20103520,000A (1.0)C (0.5)···
······2010···············
GirderSpan 1 girderSteel girder20103020,000A (1.0)B (0.7)···
Span 2 girderConcrete girder20103520,000A (1.0)C (0.5)···
······2010···············
Sub-
structure
AbutmentSpan 1 abutmentSelf-weight type20103020,000A (1.0)B (0.7)···
Span 9 abutmentSelf-weight type20103020,000A (1.0)B (0.7)···
PierSpan 2 pierT type20103520,000A (1.0)C (0.5)···
Span 3 pierπ type20103520,000A (1.0)C (0.5)···
······2010···············
FoundationSpan 1 foundationCaisson20103020,000A (1.0)B (0.7)···
······2010···············
Table 2. Determination of performance deterioration actions (example).
Analysis of the Performance Deterioration Timing
EstablishmentMemberCycle by Grade (Year)
ABCDE
Test bridgeMember A0–56–1819–2930–3637–41
Member B0–1819–2930–4142–5253–62
Member C0–34–1011–1718–2627–30
Member D0–67–1213–1819–2425–30
Member E0–34–67–910–1213–15
Member F0–23–67–1112–1819–26
Table 3. Target establishment information extraction (example).
Facility
Category
MemberDetailed
Member
BridgeCompletion
Year
Ascending/Descending
Line
Span
Number
Repair and Reinforcement
2022
Damage
Type
Repair
Method
Repair
Quantity
UnitGradePrice (KRW)
Material CostLabor CostExpenseTotal
BridgeFloor slabConcrete floor slabBridge A00Ascending line1CrackSection repair0.48m2b15,71122,48910638,306
··················
Bridge B00Ascending line2DamageSection reinforcement1360m2c107,68047,406106155,192
··················
Table 4. Selection of repair and reinforcement methods according to performance grade and damage type (example).
MemberFormGradeDamage TypeRepair and Reinforcement Method
CrackCrazing
(Network of Fine Cracks)
ExfoliationDamageContaminationLeaks and EfflorescenceExposed Rebar/CorrosionMaterial SeparationSpallingLack of Cover Thickness
Floor slabConcrete floor slabb, c Injection method
a, b, c Surface repair
b, c Section repair
c, d Connection method
c, d Asphalt surface treatment
d, e Floor slab replacement
c, d Filling method
b, c, d Waterproof layer repair
Table 5. Calculation of the unit price of the representative repair and reinforcement method (example).
MemberGrade
(Before Action)
Damage TypeRepair MethodApplication Performance
(Times)
Application
Weight
Repair/Reinforcement
Price (KRW)
Average
Quantity
UnitRepresentative Method
Price (KRW)
Concrete floor slabbMicroscopic cracksInjection method120100%19,15110m19,191
Surface damageSurface repair22488%38,30610m252,332
DamageSection repair3012%155,19210m
cMicroscopic cracksInjection method100100%19,15110m19,191
Surface damageSurface repair18075%38,30610m267,528
DamageSection repair6025%155,19210m
dCracks, leaks, and efflorescenceAdhesion method20100%324,38810m2324,388
eCracks, leaks, and efflorescenceAdhesion method10100%324,38810m2324,388
Damage, corrosion, and spallingFloor slab replacement2100%543,44010m2543,440
Table 6. Reservoir degradation status analysis.
Category30 Years or Longer20–30 Years10–20 YearsLess than 10 Years
Number of facilities by age4026276
Table 7. Inspection and diagnosis information investigation.
Inspection and Diagnosis
Type
MemberDamageCondition
Grade
Damage
Type
Damage
Quantity
Maintenance
Plan
Maintenance
Method
Maintenance
Quantity
Quantity
Unit
Precise safety inspectionUpper slabLeakbRust water
spill
90Rust removalSpacer rod removal90EA
Precise safety inspectionUpper slabConcrete
efflorescence
bEfflorescence1Complete waterproof layer construction A = 2204.56 m2Complete waterproof layer construction (with the haunch)2204.56m2
Precise safety inspectionLower slabExpansion joint
dropout and deterioration
bSurface
deterioration
8Complete waterproof layer construction A = 2273.13 m2Complete waterproof layer construction2273.13m2
Precise safety inspectionWallExpansion joint
dropout and deterioration
bWaterproof layer
spalling
1Complete waterproof layer construction A = 1008.42 m2Complete waterproof layer construction1008.42m2
Precise safety inspectionWallConcrete spalling/layer separationbStainless
dropout
1Waterproof layer constructionWaterproof layer construction0.3m2
Precise safety inspectionWallLeakbWaterproof layer
bubble
15Complete waterproof layer construction A = 1100.88 m2Complete waterproof layer construction1100.88m2
Table 8. Performance improvement information survey.
Serial
Number
PerformanceDetailed PerformanceTargetPerformance Improvement MethodPerformance Improvement QuantityUnitTotal Construction Cost (KRW 1000)
1SafetySafety performanceReservoirCorrosion protection20,136m2995,775
2SafetySafety performanceReservoirCorrosion protection9688m2480,414
3SafetySafety performanceReservoirCOSREM,
tempered glass
7111m2355,400
4SafetySafety performanceReservoirInorganic8886m2444,098
5SafetySafety performanceReservoirCOSREM (coating), tempered glass7111m2335,400
6SafetySafety performanceReservoirCorrosion protection9714m2612,907
7SafetySafety performanceReservoirCorrosion protection32,758m22,850,265
Table 9. Performance degradation model for each reservoir member.
Upper SlabLower SlabWall
Buildings 13 01983 i001Buildings 13 01983 i002Buildings 13 01983 i003
CategoryabcdeCategoryabcdeCategoryabcde
Period
(year)
0–
14
15–
24
25–
31
32–
37
38
or longer
Period
(year)
0–
14
15–
25
26–
33
34–
39
40
or longer
Period
(year)
0–
17
18–
30
31–
39
40–
46
47
or longer
Table 10. Cost incurred by grade of each member.
(Unit: KRW 1000)
CategoryCost Incurred by Grade of Upper and Lower SlabsCost Incurred by Grade of Wall
ABCABC
Crack repair method5.937858011--613.7
Leak repair method-11,75918,287-76.970.9
Section repair method19412013416815.716.4239
Painting method26712,27912.1313.8793.8
Mortar repair method3135973---
Waterproofing method25010,741115,900---
Bolt replacement method-49119.3---
Tile repair method3.1212,120----
Surface repair method1122-33151252469.413.4
Total1873252,293149,122.32069.8876.51730.8
Table 11. Cost prediction model for upper/lower slabs, wall.
Grade before ActionGrade after ActionCost Prediction Model for Upper and Lower SlabsCost Prediction Model for the Wall
AABuildings 13 01983 i004Buildings 13 01983 i005
BB
CB
DB
EB
Table 12. Analysis results of the optimal timing of action for reservoirs aged 30 years or older.
Maintenance ScenarioAction GradeLife-Extending Effect After Action
(Year)
Life Cycle Prediction Cost
(KRW 1000)
Cost/LifeLife Cycle Average Performance
Cost (KRW 1000)
/Year
Relative RatioGrade IndexRelative RatioGrade
Preemptive actionB105443,1524220.50.7693.511.05B
Proper actionC115500,0604348.30.7923.471.03C
Limit management actionD135741,0225489.11.0003.351.00C
Table 13. Prediction of life cycle cost by action level for reservoirs aged 30 years or older.
CategoryCost by AgeCumulative Cost
Preemptive
maintenance
(Grade B actions)
Buildings 13 01983 i006Buildings 13 01983 i007
Proper
maintenance
(Grade C actions)
Buildings 13 01983 i008Buildings 13 01983 i009
Limit
maintenance
(Grade D actions)
Buildings 13 01983 i010Buildings 13 01983 i011
Disclaimer/Publisher’s Note: The statements, opinions and data contained in all publications are solely those of the individual author(s) and contributor(s) and not of MDPI and/or the editor(s). MDPI and/or the editor(s) disclaim responsibility for any injury to people or property resulting from any ideas, methods, instructions or products referred to in the content.

